Emergence of catalytic function in prebiotic information-coding polymers
- Center for Functional Nanomaterials, Brookhaven National Laboratory, United States
- Department of Bioengineering, University of Illinois Urbana-Champaign, United States
- Department of Physics, University of Illinois Urbana-Champaign, United States
- Carl R Woese Institute for Genomic Biology, University of Illinois Urbana-Champaign, United States
Figures
Figure 1
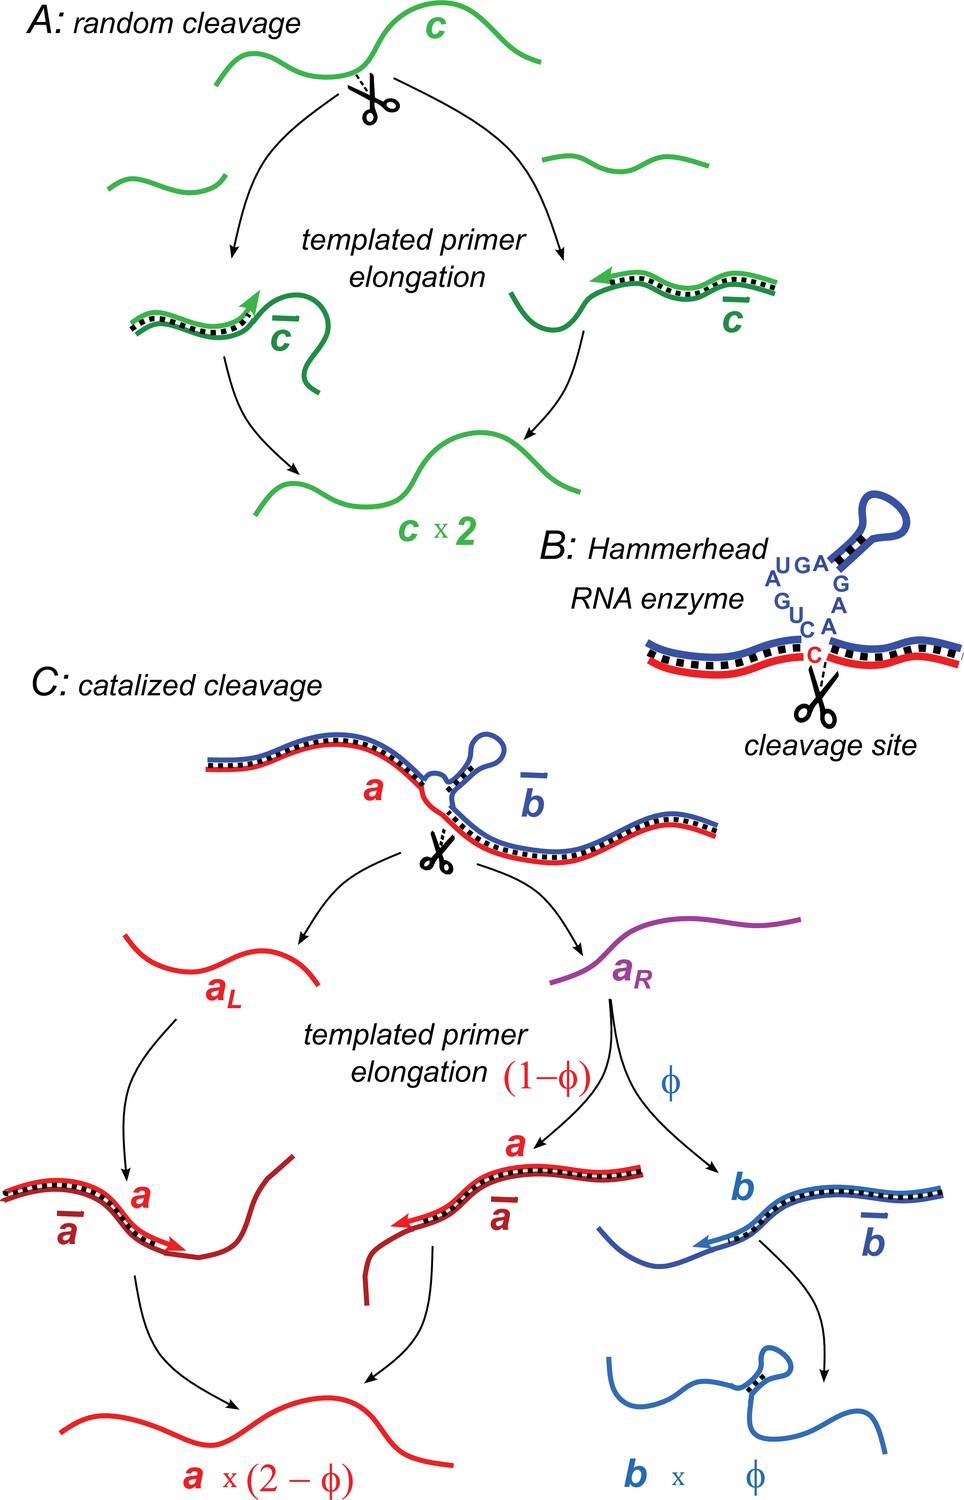
Illustration of two model variants.
(A) Random cleavage model. A random break in a chain of type generates two primer fragments, which are elongated to give rise to two chains of type . Elongation requires a complementary template of type . (B) An example of catalyzed cleavage given by hammerhead ribozyme (Pley et al., 1994). Note that the right cleavage fragment is perfectly complementary to the blue sequence, while the left one contains an extra non-complementary base C. (C) Catalyzed cleavage model. A cleavage of the red chain catalyzed by the blue chain gives rise to two primers (red) and (purple). Because of an extra non-complementary base (see B), the primer can only elongate to , while the primer – to either or depending on its first hybridization partner. Similar processes involving complementary chains and (not shown) result in the replication of templates.
Figure 2
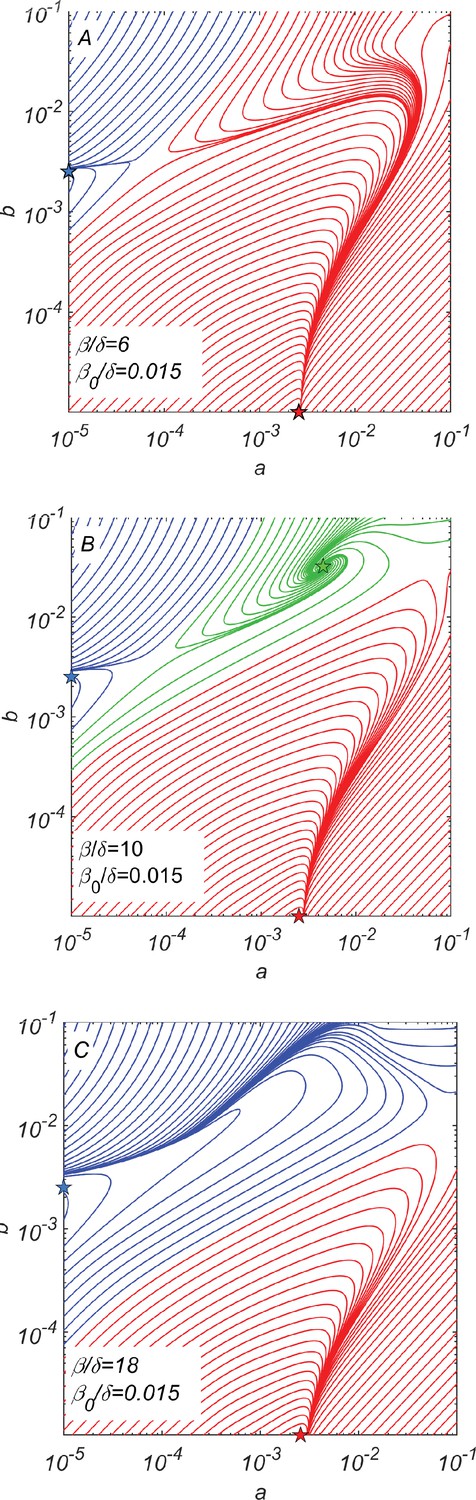
Dynamical phase portraits for different catalytic cleavage rates β.
(A) The phase portrait for a small catalytic cleavage rate has two non-cooperative steady-state solutions marked with red and blue stars corresponding to pure and pure subpopulations, respectively. These solutions are maintained by random rather than catalytic cleavage. (B) The phase portrait for intermediate catalytic cleavage rate in addition to two non-cooperative steady states marked with red and blue stars has a cooperative steady state marked with the green star in which all four subpopulations coexist. One can reach this state, for example, starting from the non-cooperative steady state (the blue star) and adding a relatively small subpopulation of crossing the saddle point separating blue and green trajectories. (C) The phase portrait for a large catalytic cleavage rate again has only two non-cooperative cleavage steady states marked with red and blue stars. All three panels were obtained by numerically solving dynamical Equations 7–11 with random cleavage rate , elongation asymmetry factor , and dilution factor .
Figure 3
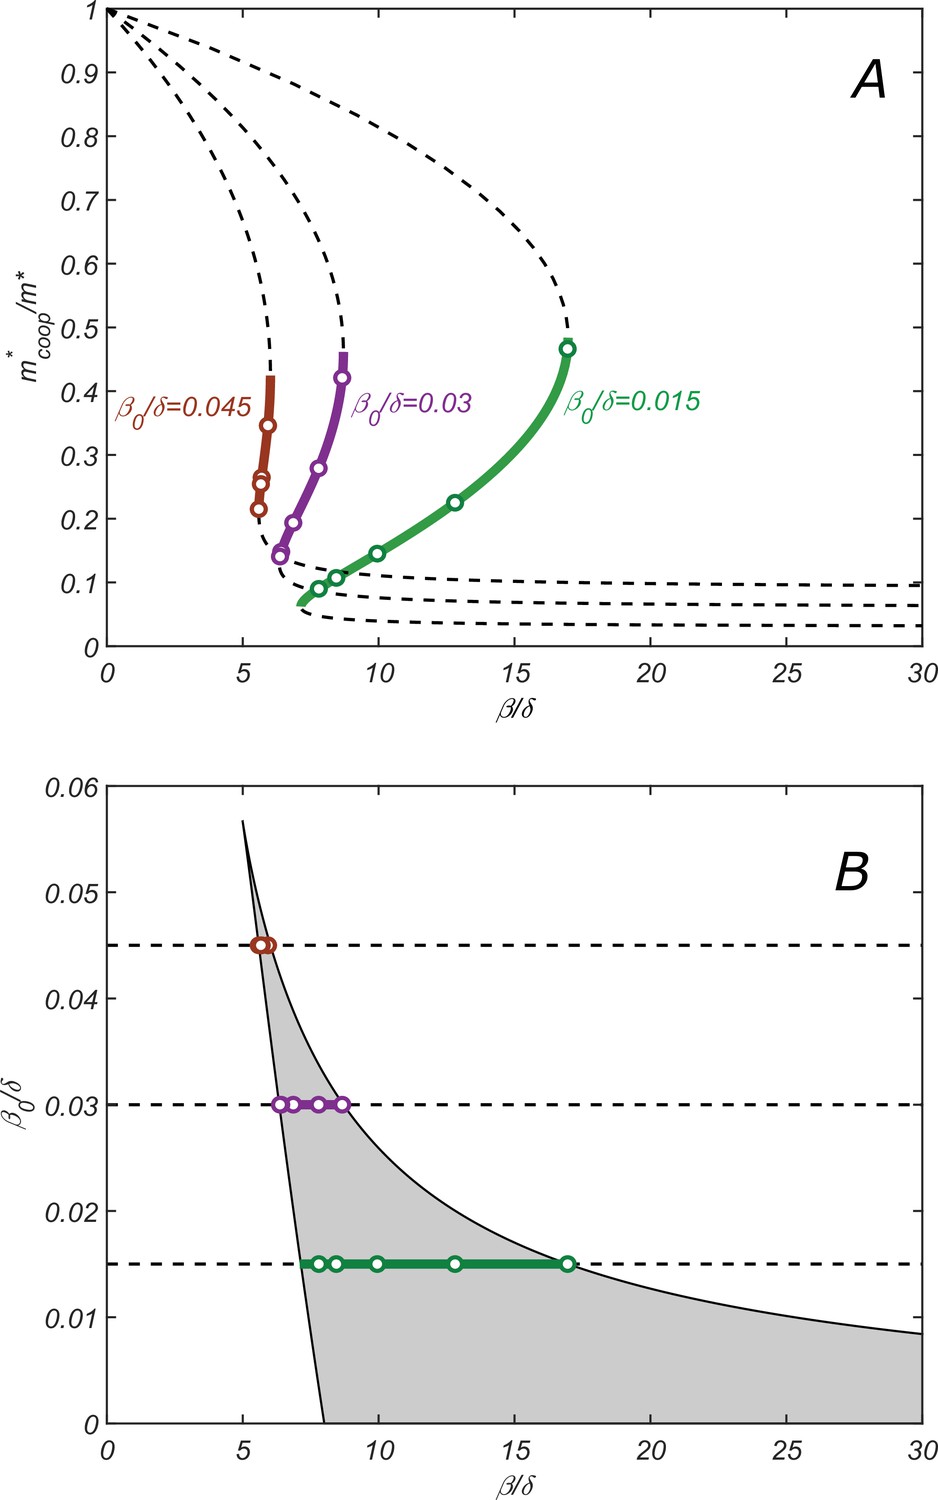
Properties of the cooperative state.
(A) The relationship between parameters of the cooperative state. plotted vs. for , and increasing values of : 0.015 (green), 0.003 (purple), and 0.0045 (red). Lines are given by the parametric equation describing the state and derived in the SI Appendix (Equation S14), while open circles are obtained by direct numerical solution of dynamical equations (7–11). Monotonically increasing branches (solid lines) correspond to the stable cooperative fixed point, while the decreasing branches (dashed lines) – to the dynamically unstable saddle points separating different steady-state solutions in Figure 2B. (B) Phase diagram of the cooperative state. The shaded region marks the values of and for which the cooperative solution exists. Green, purple, and red lines show the ranges of for which the cooperative solution exists for the corresponding value of shown in (A). Increasing the parameter makes the range of for which the cooperative solution exists progressively smaller until it altogether disappears above. .
Figure 4
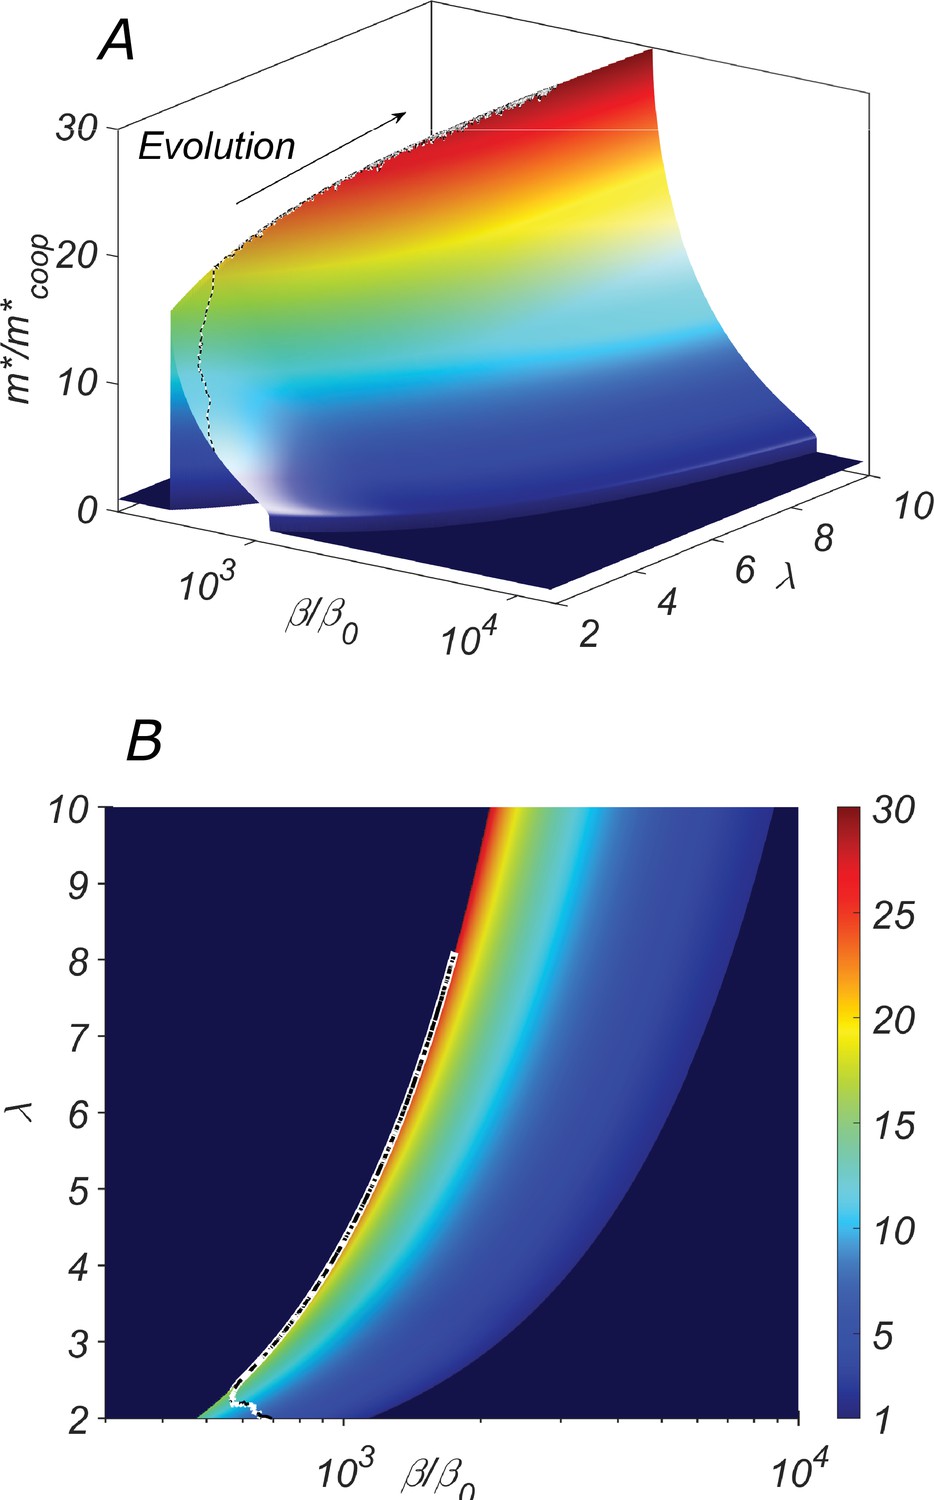
The fitness landscape of our system.
(A) the three-dimensional plot and (B) the heatmap of the fitness of the cooperative state in our system as a function of the catalytic cleavage rate enhancement and elongation asymmetry λ. The co-evolution of λ and β would increase together. A typical evolutionary trajectory in which small changes in these parameters are independent of each other is shown as a dashed line.
Additional files
Download links
A two-part list of links to download the article, or parts of the article, in various formats.
Downloads (link to download the article as PDF)
Open citations (links to open the citations from this article in various online reference manager services)
Cite this article (links to download the citations from this article in formats compatible with various reference manager tools)
Emergence of catalytic function in prebiotic information-coding polymers
eLife 12:RP91397.
https://doi.org/10.7554/eLife.91397.3


