Respiratory and cardiac interoceptive sensitivity in the first two years of life
- University of Vienna, Faculty of Psychology, Department of Developmental and Educational Psychology, Austria
- Vienna Doctoral School Cognition, Behavior and Neuroscience, University of Vienna, Austria
- Ludwig-Maximilians-Universität München, Germany
- School of Human and Behavioural Sciences, College of Human Sciences, Prifysgol Bangor University, United Kingdom
- Department of Developmental Psychology, University of Potsdam, Germany
- Department of Psychology, Royal Holloway University of London, United Kingdom
Figures
Figure 1
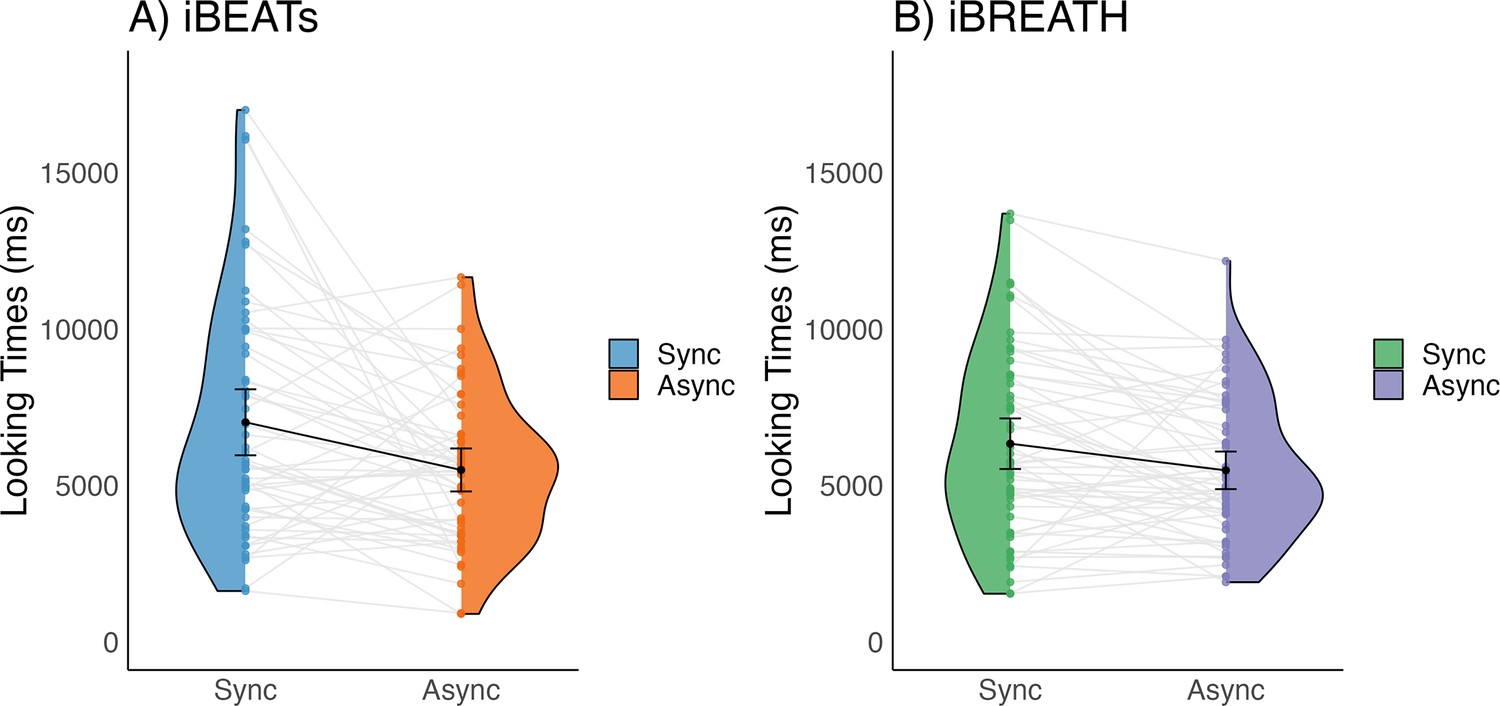
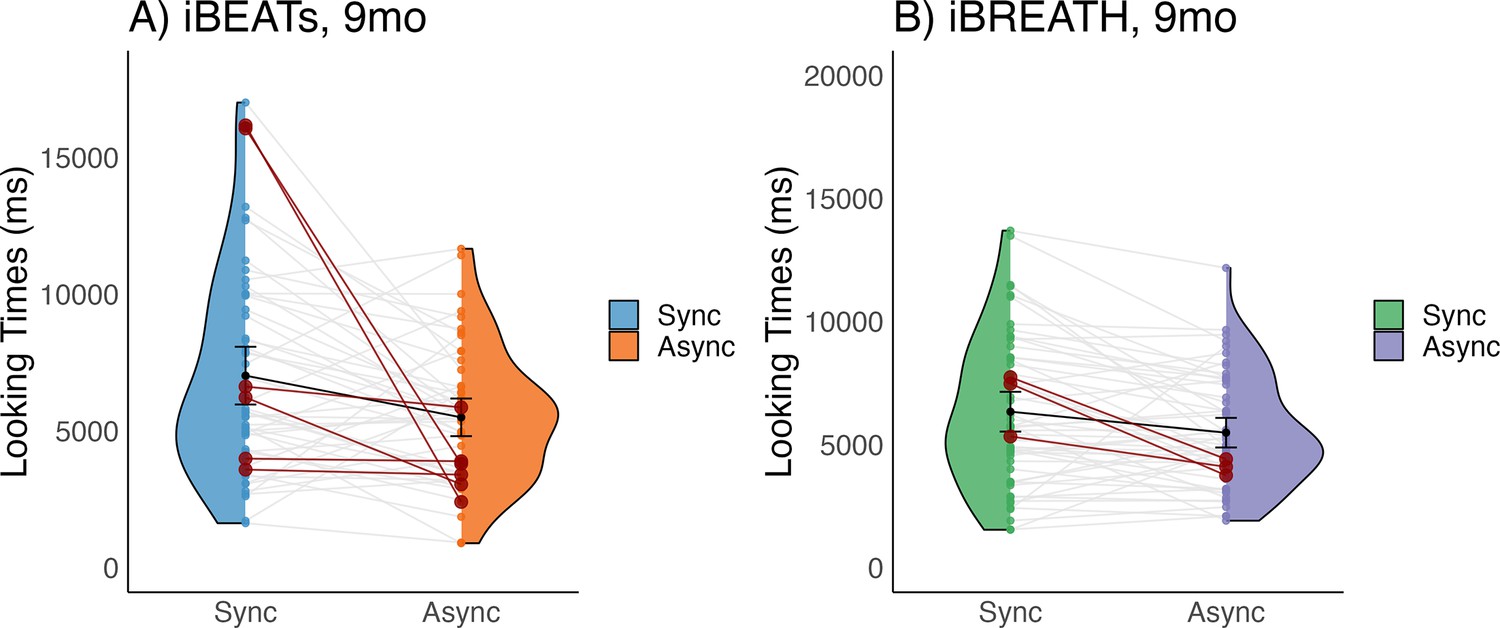
Looking times for (A) iBEATs and (B) iBREATH in 9-mo infants.
Looking times for the (A) iBEATs (paired t-test, N = 52, t=–2.96, p=0.005) and (B) iBREATH (paired t-test, N = 56, t=–2.80, p=0.007) tasks. In both tasks, 9-mo-old infants looked significantly longer at stimuli presented synchronously to their own physiological signals. Black dots refer to the group mean. Black bars refer to the standard error of the mean. Gray lines and colorful dots refer to individual mean-looking times per condition and infant. In (A) blue represents the synchronous condition and orange is the asynchronous, while in (B) green represents the synchronous condition, and purple is the asynchronous.
Figure 2
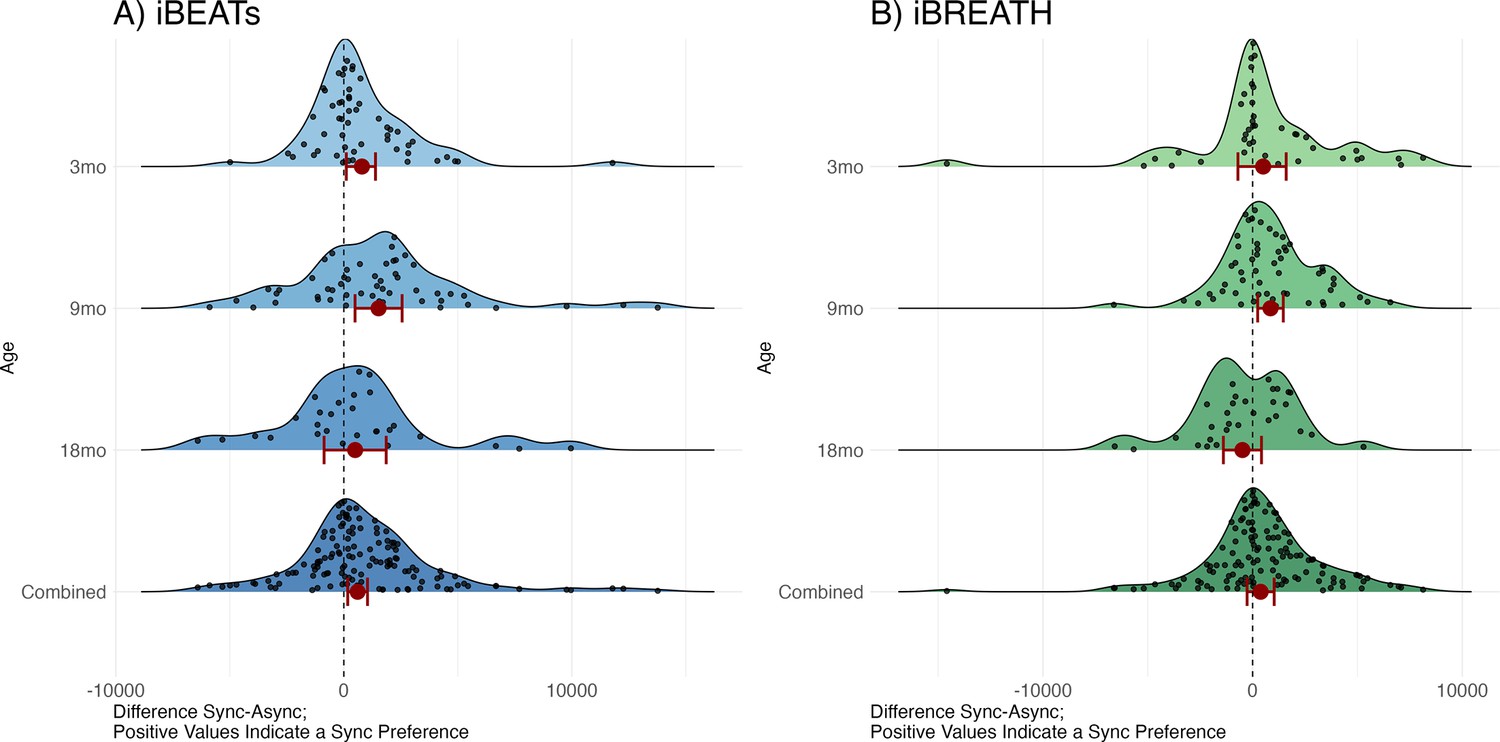
Results from the MEGA analysis for (A) iBEATs and (B) iBREATH.
Results from the MEGA analysis for (A) iBEATs (combined sample N = 135) and (B) iBREATH (combined sample N = 120). Plot of difference scores computed as mean synchronous looking times minus mean asynchronous looking times per individual for each age group, as well as the combined sample. Red dots refer to mean effects for the respective analysis as described above, red bars refer to 95% confidence/credible intervals. Dashed line indicates a difference of 0. For 3, 9, and 18 mo age groups our preregistered analysis is plotted. For the combined sample we computed a linear mixed model using lme4 for visualization purposes as results from a mixed model with a beta error distribution cannot easily be transformed back to the original scale.
Figure 3
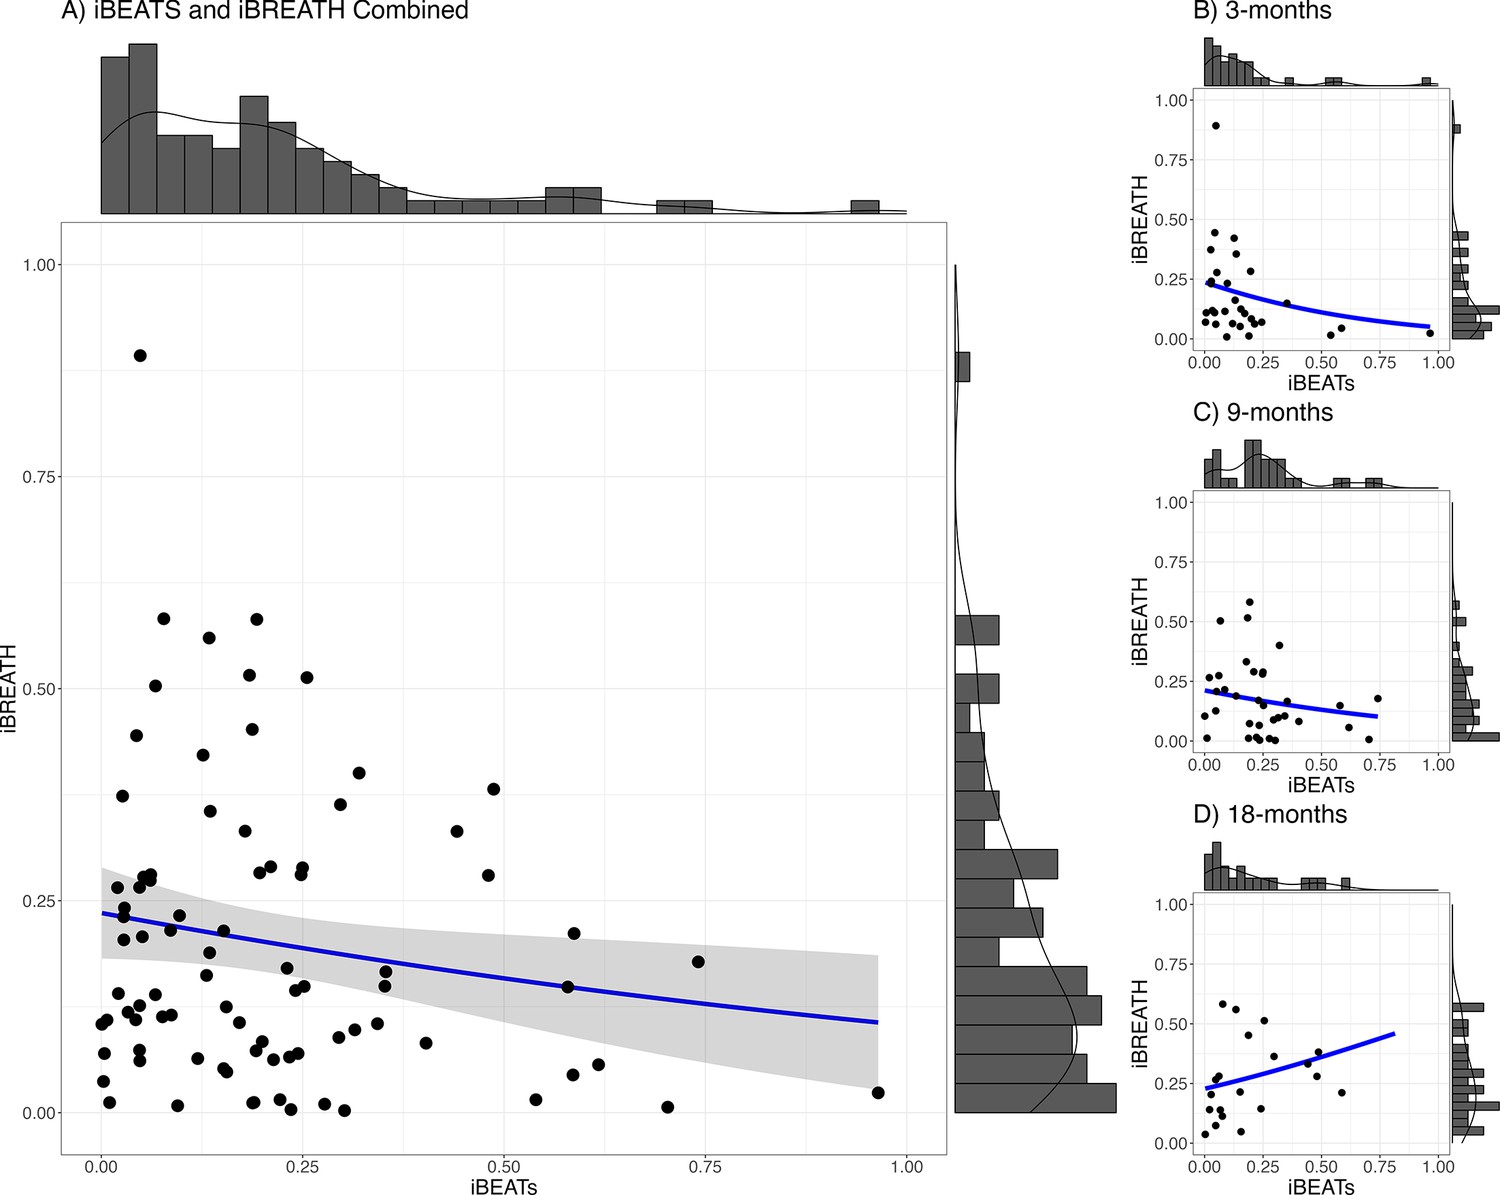
Relationship between iBEATs and iBREATH using a combined sample.
Histogram with a plotted line for individual performance on iBEATs and iBREATH using a beta regressionN = 84. Following Maister et al., 2017, individual difference scores were computed as the proportion of the absolute difference between synchronous and asynchronous trials.
Figure 4
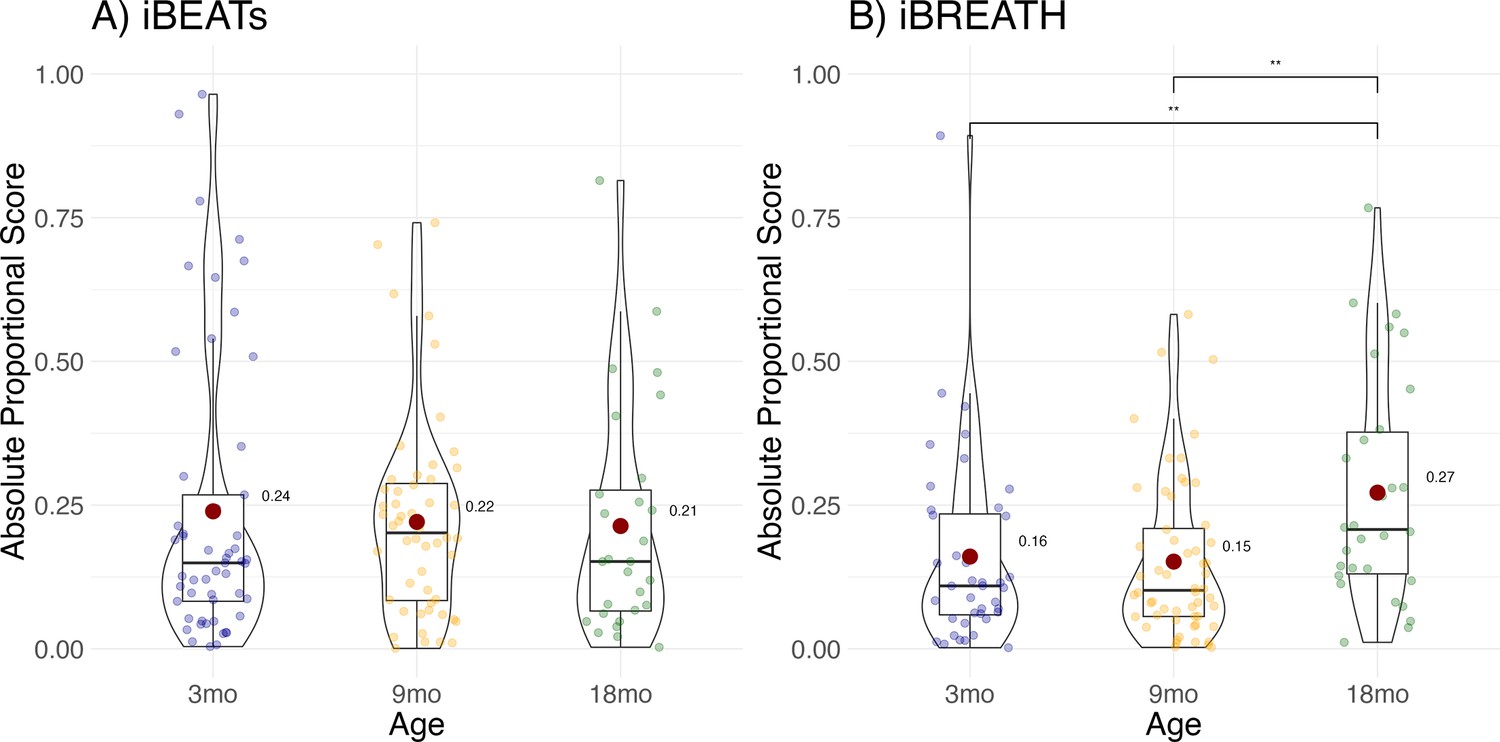
Exploratory analysis for age effect.
Absolute proportional scores for (A) iBEATs and (B) iBREATH plotted for each age group. Red dots refer to group means, and colorful dots to individual means, ** refers to a significant result (p<0.01).
Figure 5
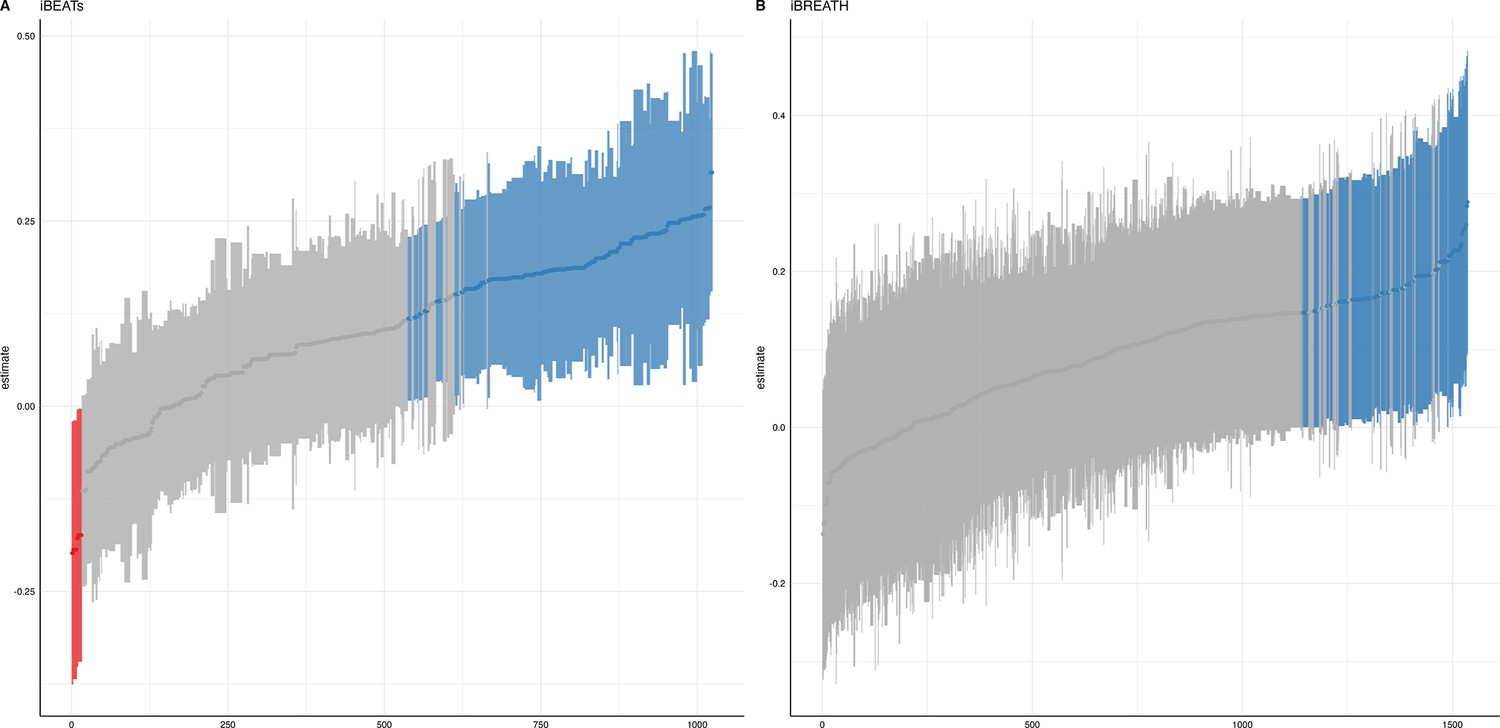
Specification curve analysis for the (A) iBEATs and (B) iBREATH task.
Specification curve analysis plotting standardized beta regression coefficients (y-axis) and number of analysis (x-axis) for (A) iBEATs and (B) iBREATH. Number of analysis (x-axis) are ordered increasing from lowest to highest standardized beta regression coefficient. Blue color indicates a significant effect (p<0.05) for a mean synchronous preference, red color indicates a significant effect (p<0.05) for a mean asynchronous preference, and gray indicates a non-significant outcome.
Appendix 1—figure 1
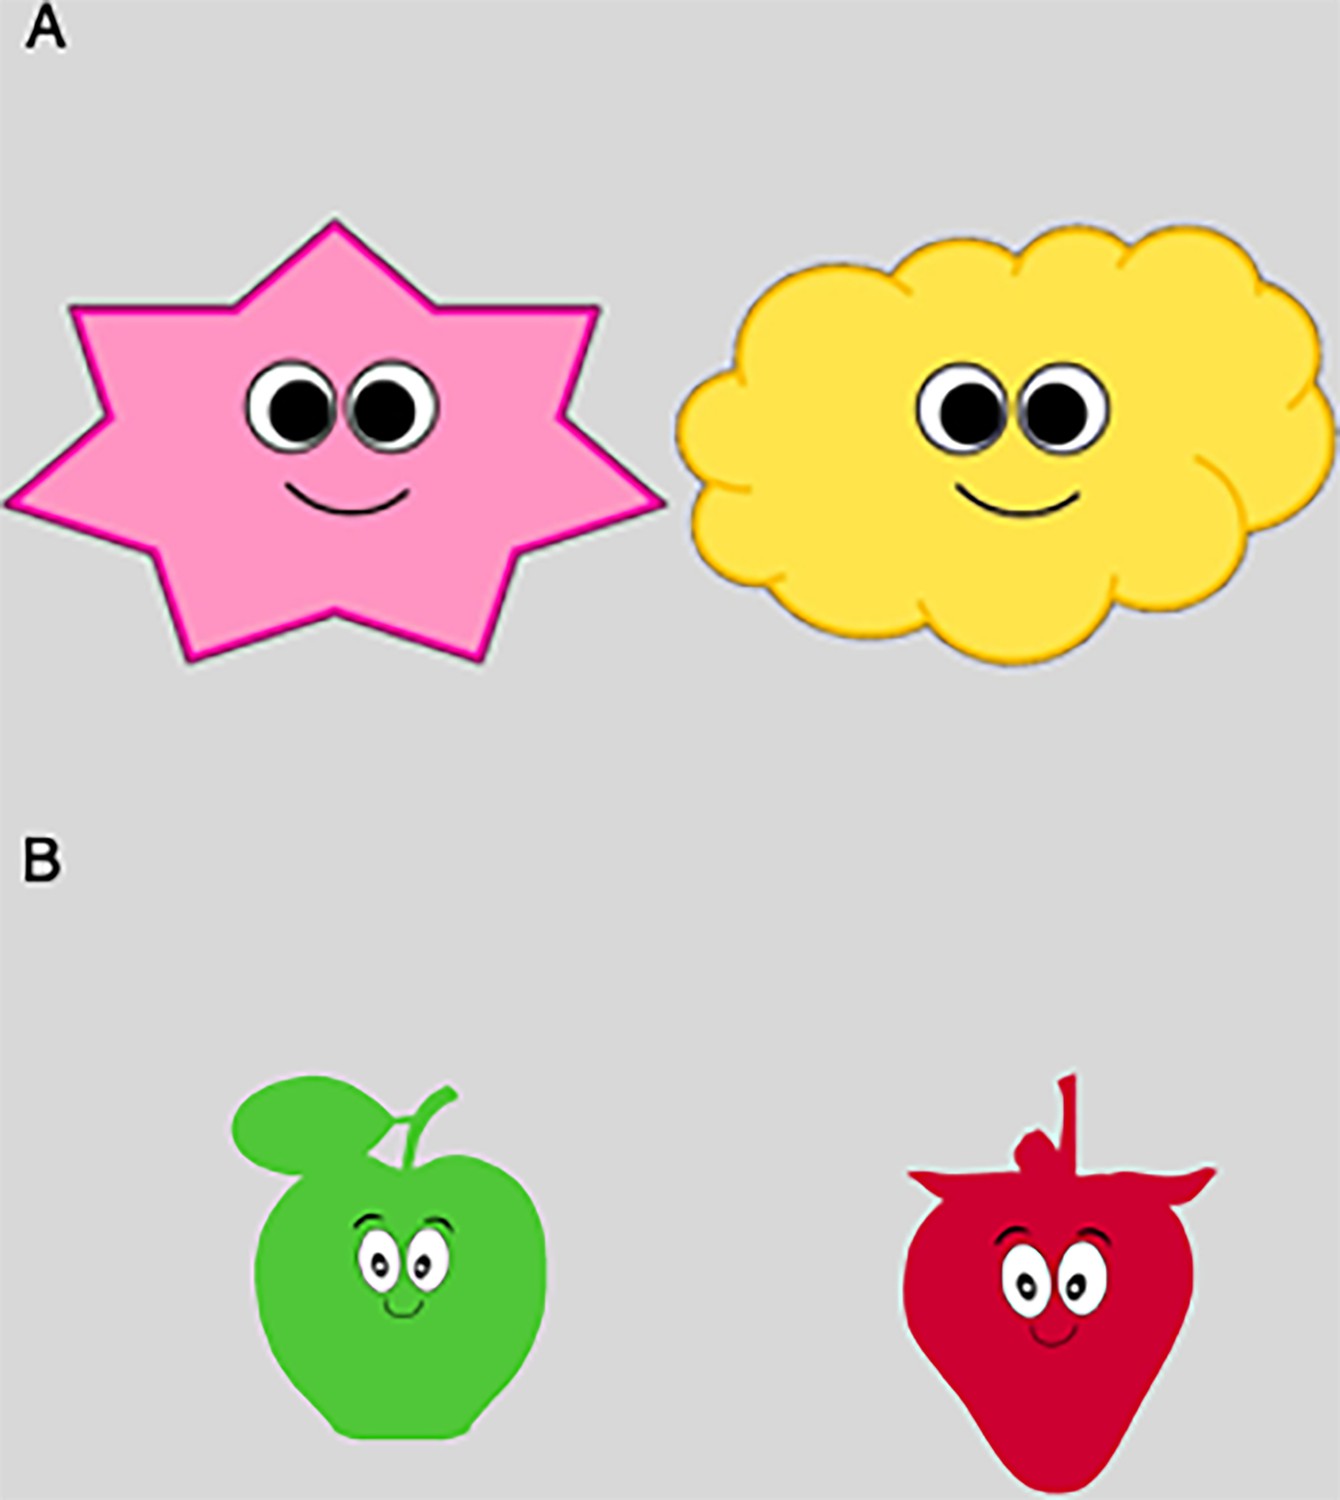
Stimuli used for (A) iBEATs and (B) iBREATH.
Appendix 1—figure 2
Mean differences in (A) iBEATs (blue refers to the synchronous and orange to the asynchronous condition) and (B) iBREATH (green refers to the synch and purple to the asynchronous condition) for the 9-mo-olds.
Gray dots and lines refer to individual infants, black dots and error bars to the results of mean comparison and corresponding 95% confidence intervals. Infants with alternative randomization are highlighted in red.
Appendix 1—figure 3
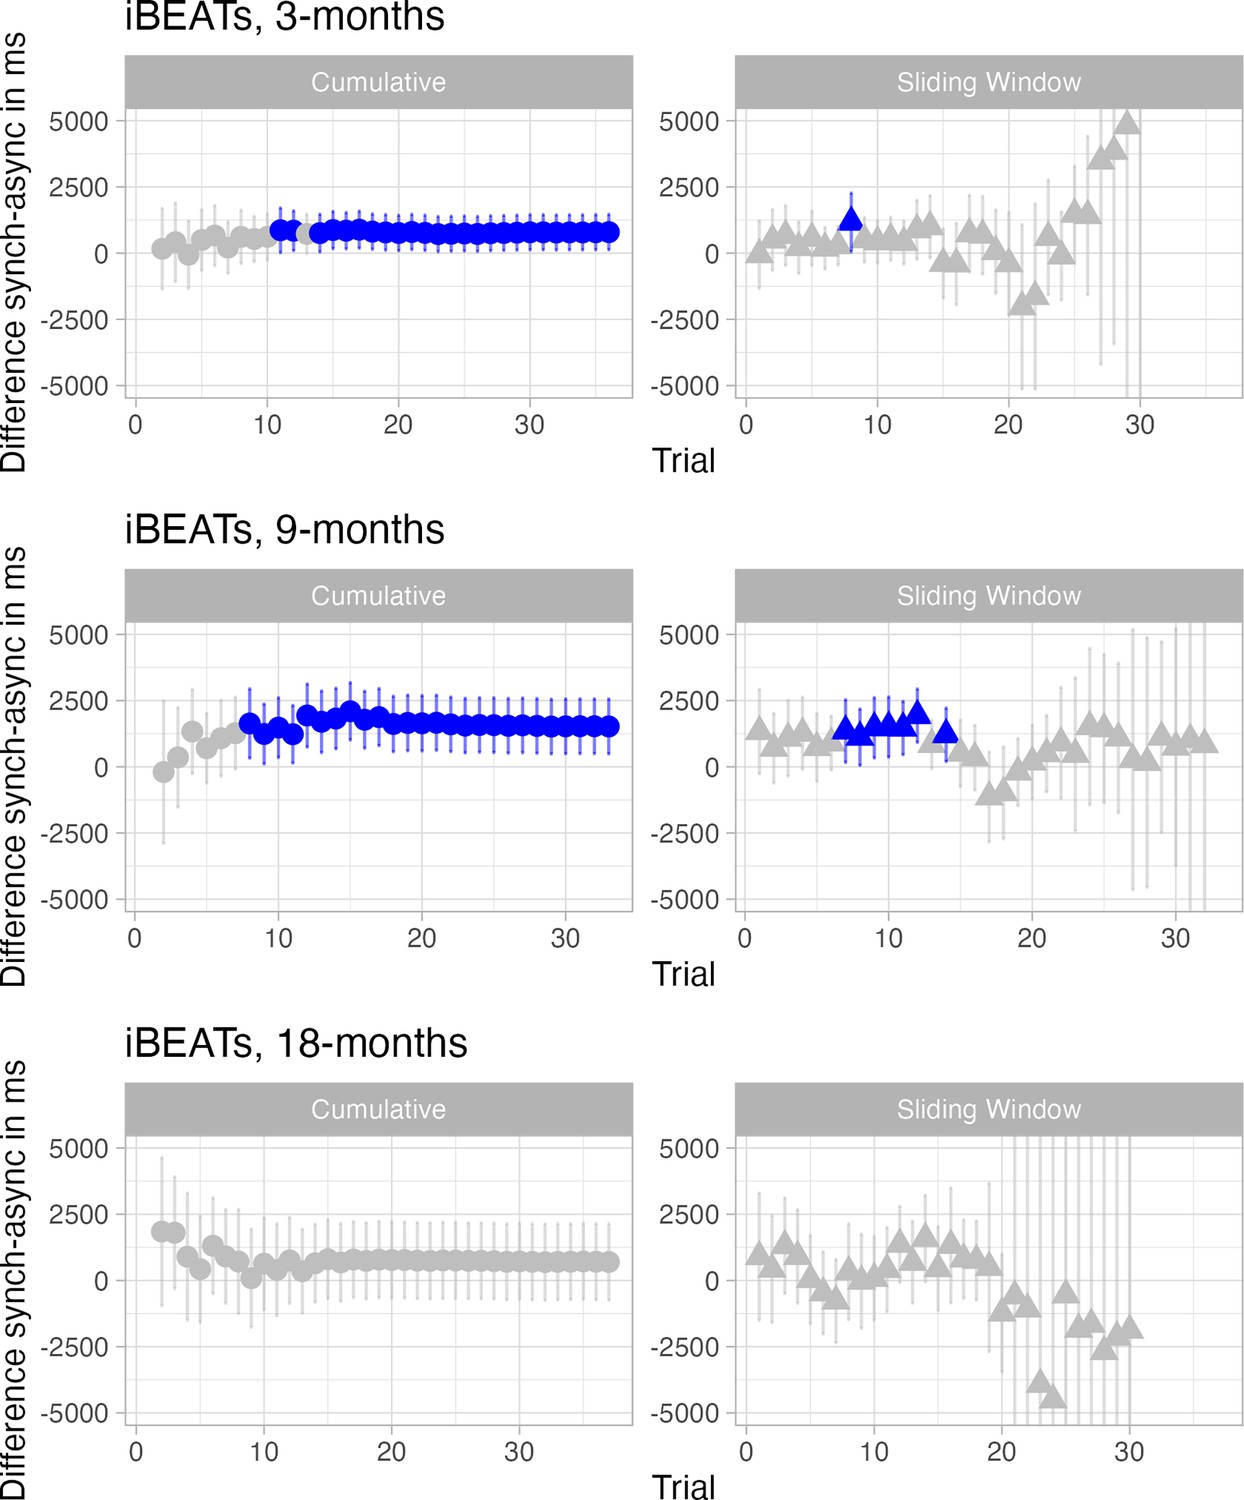
Infants’ preference over time in the iBEATs paradigm for all age groups.
Here results of paired t-tests for the iBEATs with different inclusion criteria for trials are displayed for all age groups. The left column shows a cumulative analysis in which all previous trials are included. The right column shows a 3-trial sliding window analysis in which the three preceding and three proceeding trials are included. Blue indicates a significant result of the paired t-test.
Appendix 1—figure 4
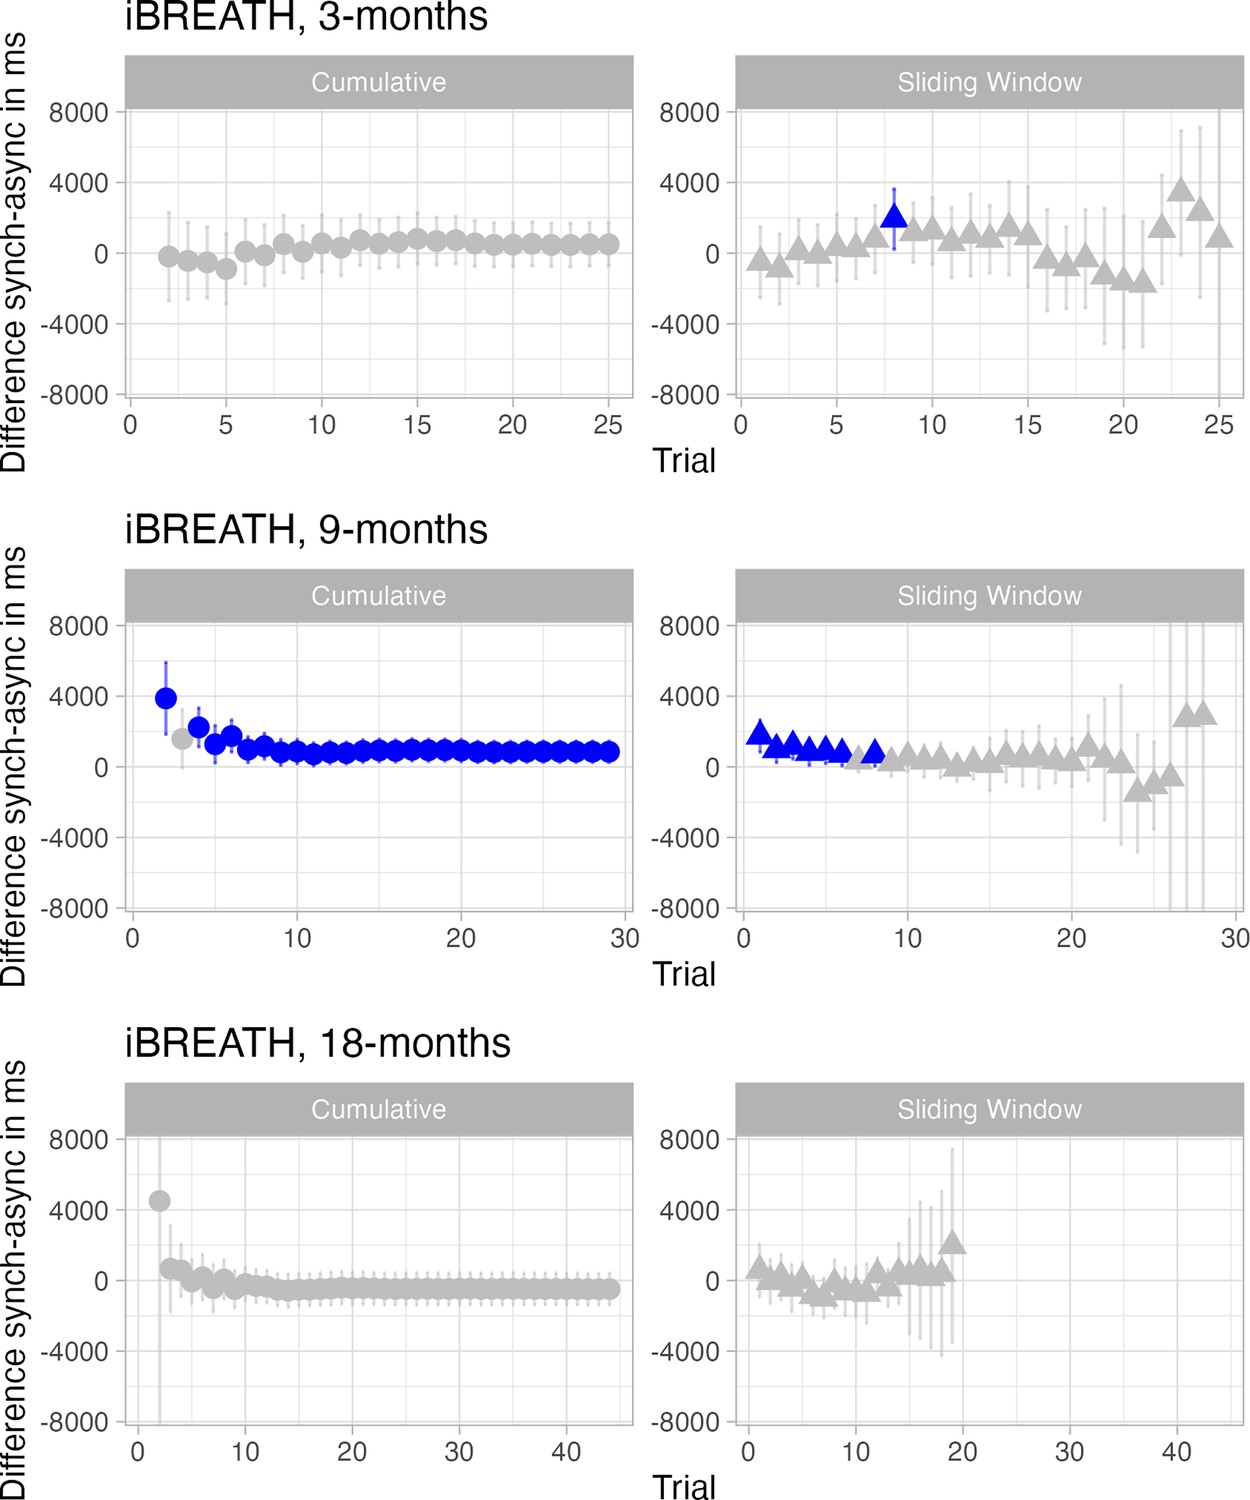
Infants’ preference over time in the iBREATH paradigm for all age groups.
Here results of paired t-tests for the iBREATH with different inclusion criteria for trials are displayed for all age groups. The left column shows a cumulative analysis in which all previous trials are included. The right column shows a 3-trial sliding window analysis in which the three preceding and three proceeding trials are included. Blue indicates a significant result of the paired t-test.
Appendix 2—figure 1
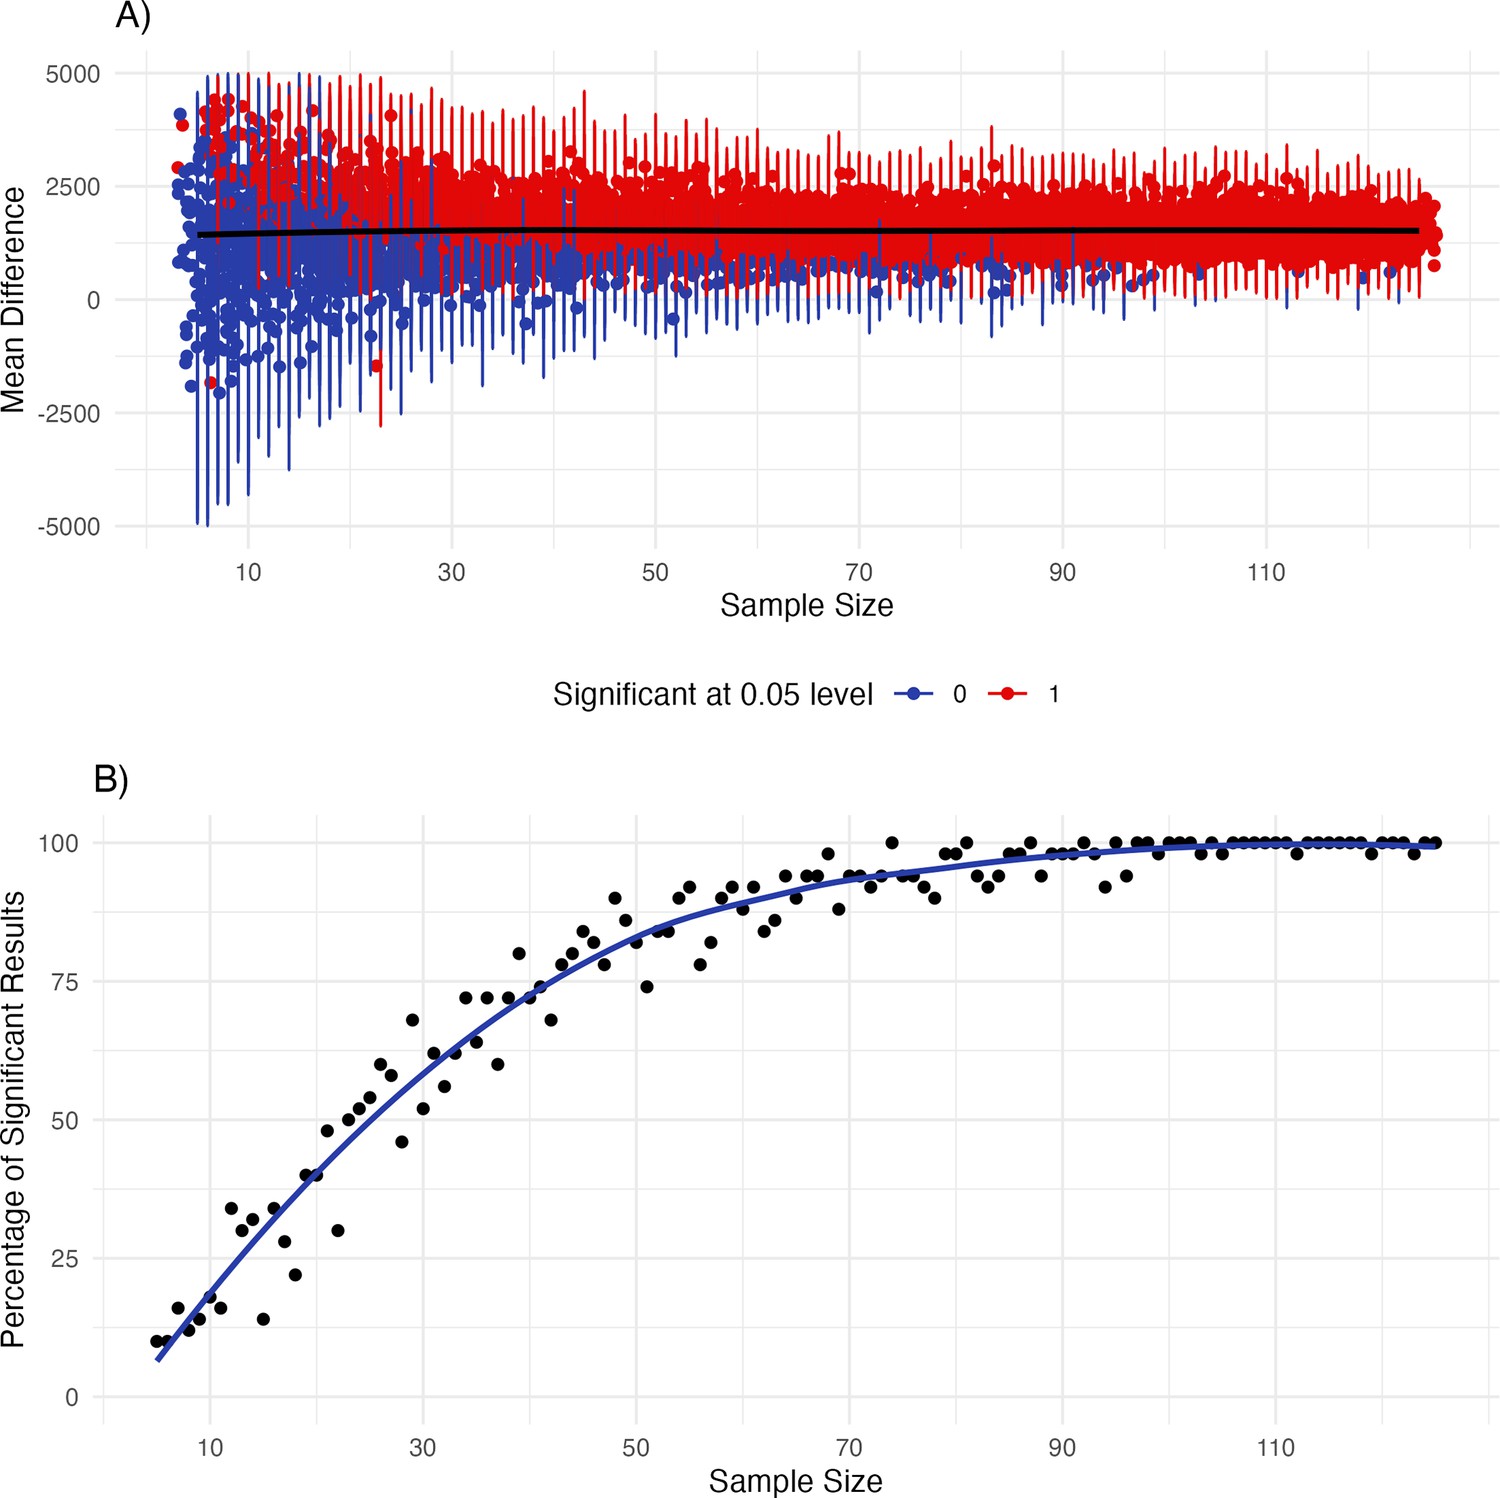
Simulating data frames for sample sizes from 15 to 125 building up on the iBEATs data from the 9-mo-olds.
Results from the simulations. In (A) mean effects and 95% confidence intervals are plotted for the different sample sizes. Red color indicates a significant effect, while blue indicates a non-significant result. In (B) the percent of significant results are plotted with a fitted line.
Appendix 4—figure 1
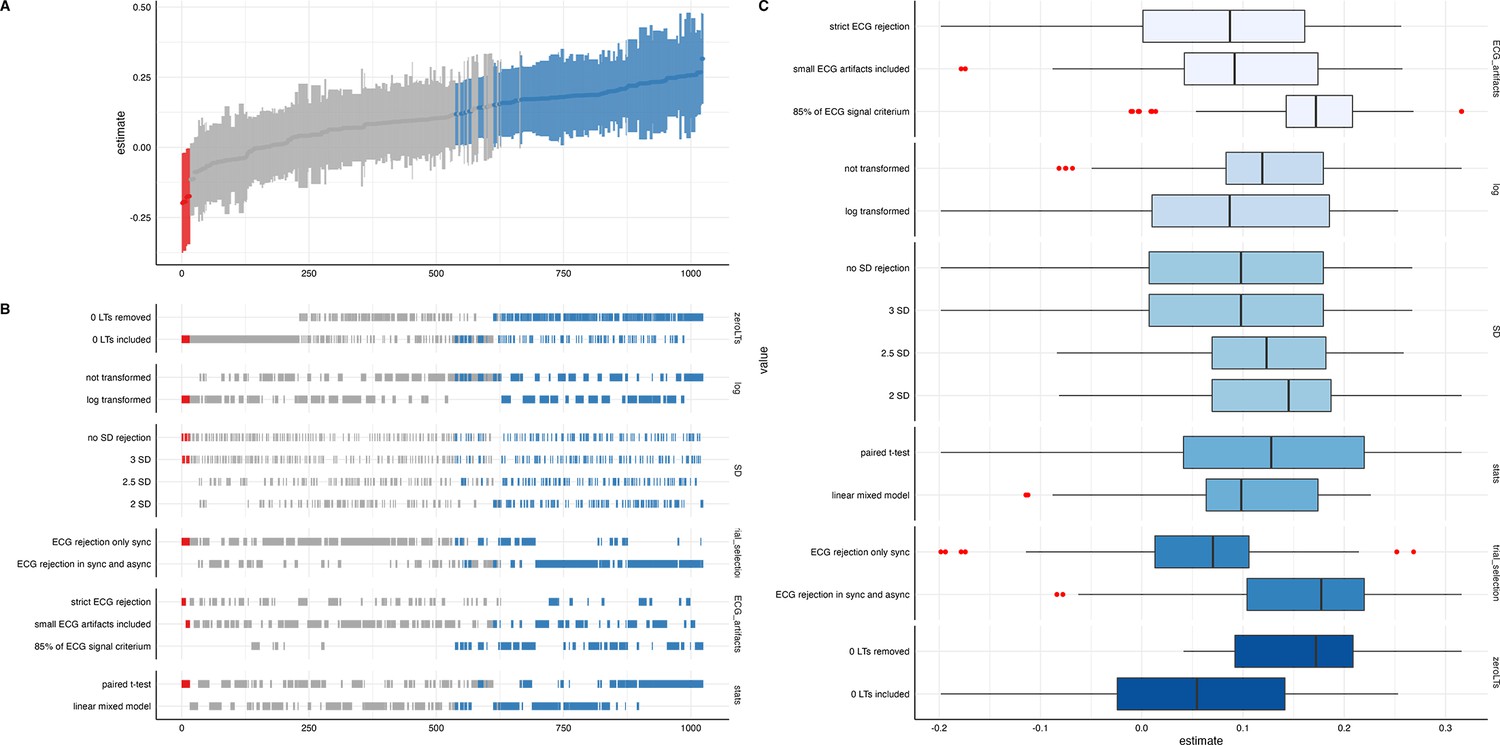
Descriptive results from the specification curve analysis for the iBEATs task.
Blue coloring in (A) and (B) refers to a significant result for a mean synchronous preference, while red color indicates to a significant result for a mean asynchronous preference (p<0.05) for the specification and test. In (A) standardized beta regression estimates are plotted. In (B) an overview for a range of analytical choices is given. In (C) analytical choices are further decomposed.
Appendix 4—figure 2
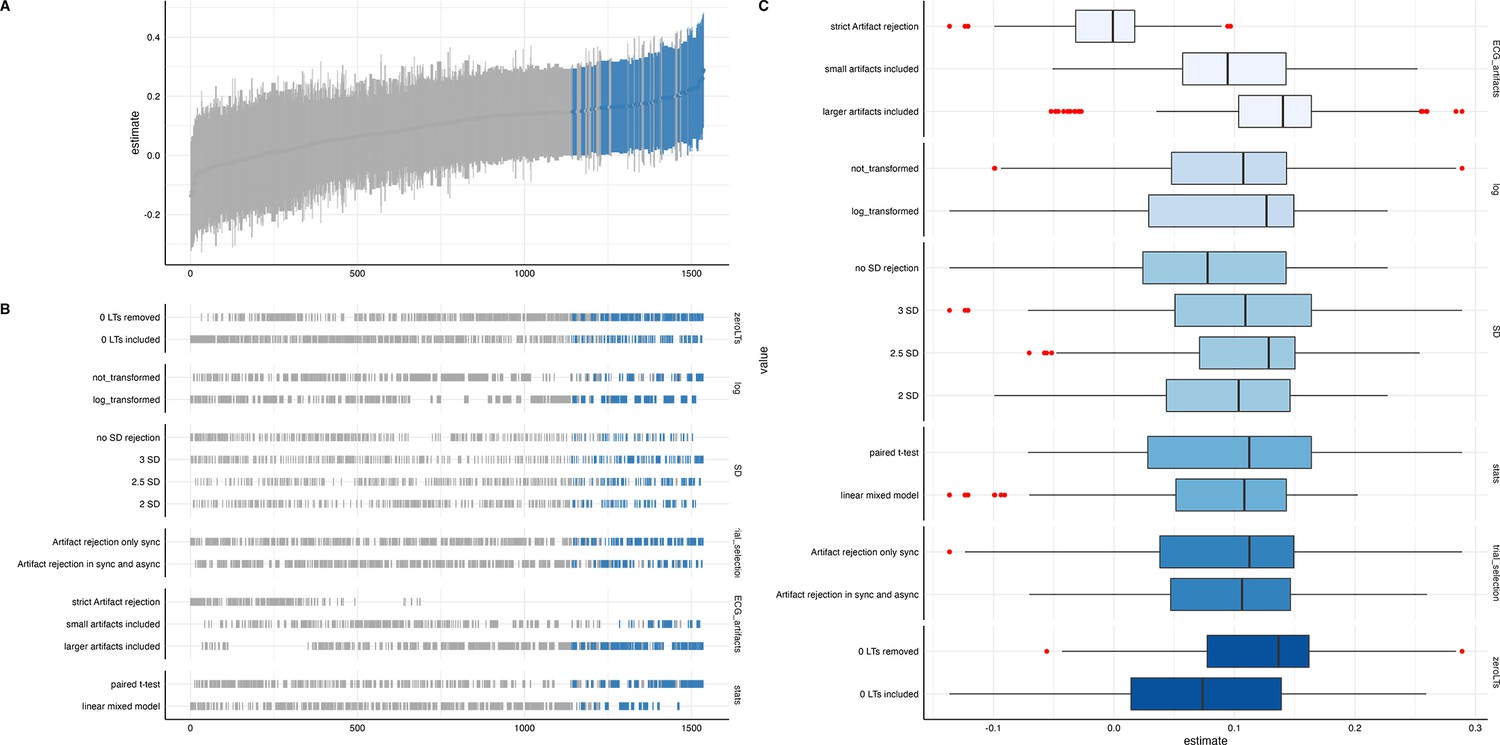
Descriptive results from the specification curve analysis for the iBREATH task.
Blue coloring in (A) and (B) refers to a significant result for a mean synchronous preference, while red color indicates to a significant result for a mean asynchronous preference (p<0.05) for the specification and test. In (A) standardized beta regression estimates are plotted. In (B) an overview for a range of analytical choices is given. In (C) analytical choices are further decomposed.
Tables
Table 1
Interactions between condition and age for the iBEATs MEGA-analysis.
| Term | Estimate | SE | z-value | p-value |
|---|---|---|---|---|
| Condition * age (3- vs 9 mo) | 0.00 | 0.11 | 0.02 | 0.982 |
| Condition * age (3- vs 18 mo) | 0.14 | 0.13 | 1.08 | 0.283 |
| Condition * age (9- vs 18 mo) | 0.14 | 0.12 | 1.12 | 0.264 |
-
Results for the mixed model using a beta error distribution. Here only the interaction between condition and age are reported for all combinations. Detailed results can be found in Appendix 3.
Table 2
Interactions between condition and age for the iBREATH MEGA-analysis.
| Term | Estimate | SE | z-value | p-value |
|---|---|---|---|---|
| Condition * age (3- vs 9 mo) | 0.02 | 0.12 | 0.17 | 0.864 |
| Condition * age (3- vs 18 mo) | 0.23 | 0.16 | 1.50 | 0.134 |
| Condition * age (9- vs 18 mo) | 0.21 | 0.15 | 1.43 | 0.154 |
-
Results for the mixed model using a beta error distribution. Here only the interaction between condition and age are reported for all combinations. Detailed results can be found in Appendix 3.
Table 3
Effects of iBEATs on iBREATH for all age groups, as well as for interactions between iBEATs and age.
| Term | Estimate | SE | z-value | p-value |
|---|---|---|---|---|
| iBEATs (3 mo) | –1.83 | 0.97 | –1.89 | 0.059 |
| iBEATs (9 mo) | –1.16 | 0.90 | –1.30 | 0.192 |
| iBEATs (18 mo) | 1.30 | 1.02 | 1.27 | 0.204 |
| iBEATs * age (3- vs 9 mo) | –0.15 | 0.34 | –0.42 | 0.674 |
| iBEATs * age (3- vs 18 mo) | 3.13 | 1.41 | 2.22 | 0.027 |
| iBEATs * age (9- vs 18 mo) | 2.45 | 1.36 | 1.81 | 0.070 |
-
Results for the beta regression of iBEATs scores on iBREATH scores. Detailed results can be found in Appendix 3.
Table 4
Change in absolute proportional scores across age groups for the iBREATH.
| Term | Estimate | SE | z-value | p-value |
|---|---|---|---|---|
| Intercept | –1.61 | 0.15 | 10.55 | <0001 |
| 9 mo | –0.04 | 0.19 | –0.18 | 0.853 |
| 18 mo | 0.61 | 0.21 | 2.86 | 0.004 |
-
Results for the mixed model using a beta error distribution. Results are in comparison to the synchronous condition, and 3 mo age group.
Table 5
Change in absolute proportional scores across age groups for the iBEATs.
| Term | Estimate | SE | z-value | p-value |
|---|---|---|---|---|
| Intercept | –1.11 | 0.14 | –7.91 | <0.001 |
| 9 mo | –0.04 | 0.19 | –0.22 | 0.826 |
| 18 mo | –0.09 | 0.23 | –0.41 | 0.684 |
-
Results for the mixed model using a beta error distribution. Results are in comparison to the synchronous condition, and 3 mo age group.
Table 6
Number of significant results for specifications for iBEATs and iBREATH.
| Specification | iBEATs | iBREATH |
|---|---|---|
| Outlier rejection | 128, only async 330, both | 111 only async 158 both |
| SD outlier rejection | 107, no rejection 107, 2SD 120, 2.5SD 124, 3SD | 59 no rejection 70 2SD 104 2.5SD 36 3SD |
| Artifact trial rejection | 224, 85% criterion 162, small artifacts included 72, strict rejection | 207, large artifacts included 62, small artifacts included 0, strict rejection |
| Data transformation | 240, log transformed 218, not transformed | 162 log transformed 102 not transformed |
| Trial removal | 308, 0LTs included 150, 0LTs excluded | 183, 0LTs included 86, 0LTs excluded |
| Min. number of trials per id to be included | 115, min. 2 trials 115, min. 4 trials 113, min. 8 trials 115, no criterion | 86, min. 2 trials 74, min. 4 trials 24, min. 8 trials 85, no criterion |
| Statistical analysis | 220, linear mixed model 238, paired t-test | 89, linear mixed model 180, paired t-test |
-
Number of significant specifications for iBEATs and iBREATH separate for each category. Overall, there were 1024 specifications for iBEATs and 1536 for iBREATH. Detailed information on the specifications can be found in Appendix 4. Category 3 (artifact trial rejection) for the iBREATH was simplified to make comparison to the iBEATs more intuitive.
Table 7
Descriptive information for number of trials completed and included.
| Paradigm, Age group | Mcompleted | SDcompleted | Mincluded | SDincluded |
|---|---|---|---|---|
| iBEATs, 3 mo | 13.97 | 7.08 | 9.82 | 7.44 |
| iBEATs, 9 mo | 18.16 | 6.35 | 9.52 | 6.63 |
| iBEATs, 18 mo | 15.62 | 6.31 | 10.90 | 7.54 |
| iBREATH, 3 mo | 13.00 | 5.84 | 9.16 | 6.52 |
| iBREATH, 9 mo | 13.25 | 4.85 | 10.10 | 5.21 |
| iBREATH, 18 mo | 12.52 | 7.63 | 6.88 | 5.56 |
Appendix 1—table 1
Main analysis for the 9-month-olds for iBEATs and iBREATH split by randomization.
| Experiment | Randomization | N | Mean LT Synch (SD) | Mean LT Async (SD) | Comparison |
|---|---|---|---|---|---|
| iBEATs | 1 | 46 | 6792 (3473) | 5727 (2508) | t(45)=2.37, p=0.022 |
| iBEATs | 2 | 6 | 8775 (5810) | 3734 (1175) | V=21, p=0.031 |
| iBREATH | 1 | 53 | 6307 (3090) | 5563 (2282) | t(52)=2.37, p=0.021 |
| iBREATH | 2 | 3 | 6847 (1321) | 4085 (331) | V=6, p=0.25 |
-
LT = looking time, Synch = synchronous trials, Async = asynchronous trials. For the larger samples a paired t-test was used, and a Wilcoxon rank sign test for the smaller samples.
Appendix 1—table 2
Mean looking time for first and second half of trials in the iBEATs.
| Age | Half | Mean looking time (SD) synchronous | Mean looking time (SD) asynchronous |
|---|---|---|---|
| 3 mo | 1 | 7620 (4786) | 6686 (6193) |
| 3 mo | 2 | 6010 (5899) | 5306 (5443) |
| 9 mo | 1 | 8933 (4890) | 8197 (4954) |
| 9 mo | 2 | 5724 (4475) | 5089 (3992) |
| 18 mo | 1 | 8552 (5536) | 8575 (5772) |
| 18 mo | 2 | 5607 (4527) | 5402 (4786) |
Appendix 1—table 3
Mean looking time for first and second half of trials in the iBREATH.
| Age | Half | Mean looking time (SD) synchronous | Mean looking time (SD) asynchronous |
|---|---|---|---|
| 3 mos | 1 | 9188 (9176) | 8356 (8654) |
| 3 mo | 2 | 5903 (7876) | 6353 (7594) |
| 9 mo | 1 | 8272 (5597) | 7110 (5486) |
| 9 mo | 2 | 5774 (5425) | 5135 (4418) |
| 18 mo | 1 | 6659 (5578) | 6976 (6629) |
| 18 mo | 2 | 3550 (4124) | 4532 (3482) |
Appendix 1—table 4
Mean looking times (SD) in ms and number of trials for side of the screen (left/right), condition, and age groups.
| Age | Side | Condition | Number of trials iBEATs | Mean looking time (SD) in ms iBEATs | Number of trials iBREATH | Mean looking time (SD) in ms iBREATH |
|---|---|---|---|---|---|---|
| 3 | L | Synchronous | 116 | 5807 (5854) | 95 | 7140 (8689) |
| L | Asynchronous | 185 | 5708 (5835) | 135 | 7138 (8230) | |
| R | Synchronous | 181 | 7367 (6130) | 147 | 7841 (8673) | |
| R | Asynchronous | 117 | 5978 (5775) | 81 | 7461 (7806) | |
| 9 | L | Synchronous | 158 | 7137 (5066) | 87 | 6948 (6137) |
| L | Asynchronous | 238 | 6962 (4963) | 197 | 6185 (5418) | |
| R | Synchronous | 242 | 7451 (4889) | 189 | 6567 (5235) | |
| R | Asynchronous | 173 | 5619 (4269) | 107 | 5642 (4416) | |
| 18 | L | Synchronous | 69 | 7206 (5323) | 23 | 5099 (5157) |
| L | Asynchronous | 108 | 6861 (5395) | 78 | 5433 (5567) | |
| R | Synchronous | 109 | 6867 (5286) | 82 | 5104 (5076) | |
| R | Asynchronous | 67 | 6904 (5753) | 41 | 5694 (4890) |
-
Values displayed here are based on the pre-processing pipeline used for the MEGA-analysis and are computed with unaggregated dataset. L=left, R=right.
Appendix 3—table 1
Full-null model comparison for the iBEATs model.
| Model | Df | AIC | BIC | logLik | Deviance | Chisq | Chi Df | p-value |
|---|---|---|---|---|---|---|---|---|
| Null | 5 | –1222.9 | –1195.5 | 616.46 | –1232.9 | |||
| Full | 8 | –1227.8 | –1184.0 | 621.92 | –1243.8 | 10.91 | 3 | 0.012 |
Appendix 3—table 2
Results for the MEGA analysis of the iBEATs data with 3 mo as reference group.
| Term | Estimate | SE | z-value | p-value |
|---|---|---|---|---|
| Intercept | –1.08 | 0.12 | –8.69 | <0.001 |
| Condition asynchronous | –0.17 | 0.08 | –2.15 | 0.031 |
| 9 mo | 0.57 | 0.16 | 3.48 | <0.001 |
| 18 mo | 0.44 | 0.18 | 2.49 | 0.013 |
| Condition * 9 mo | 0.00 | 0.11 | 0.02 | 0.982 |
| Condition * 18 mo | 0.14 | 0.13 | 1.08 | 0.283 |
-
Results for the mixed model using a beta error distribution. Results are in comparison to the synchronous condition, and 3 mo age group.
Appendix 3—table 3
Results for the MEGA analysis of the iBEATs data with 9 mo as reference group.
| Term | Estimate | SE | z-value | p-value |
|---|---|---|---|---|
| Intercept | –0.50 | 0.11 | –4.66 | <0.001 |
| Condition asynchronous | –0.17 | 0.07 | –2.49 | 0.013 |
| 3 mo | –0.57 | 0.16 | –3.48 | <0.001 |
| 18 mo | –0.13 | 0.10 | –1.22 | 0.221 |
| Condition * 3 mo | –0.00 | 0.11 | –0.02 | 0.982 |
| Condition * 18 mo | 0.14 | 0.12 | 1.12 | 0.264 |
-
Results for the mixed model using a beta error distribution. Results are in comparison to the synchronous condition, and 9 mo age group.
Appendix 3—table 4
Results for the MEGA analysis of the iBEATs data with 18 mo as reference group.
| Term | Estimate | SE | z-value | p-value |
|---|---|---|---|---|
| Intercept | –0.63 | 0.13 | –4.91 | <0.001 |
| Condition asynchronous | –0.03 | 0.10 | –0.31 | 0.756 |
| 3 mo | 0.44 | 0.18 | 2.49 | 0.013 |
| 9 mo | –0.13 | 0.10 | –1.22 | 0.221 |
| Condition * 3 mo | –0.14 | 0.13 | –1.08 | 0.283 |
| Condition * 9 mo | –0.14 | 0.12 | –1.12 | 0.264 |
-
Results for the mixed model using a beta error distribution. Results are in comparison to the synchronous condition, and 18 mo age group.
Appendix 3—table 5
Full-null model comparison for the iBREATH model.
| Model | Df | AIC | BIC | logLik | Deviance | Chisq | Chi Df | p-value |
|---|---|---|---|---|---|---|---|---|
| Null | 5 | –1600.3 | –1574.5 | 805.14 | –1610.3 | |||
| Full | 8 | –1600.7 | –1559.4 | 808.37 | –1616.7 | 6.45 | 3 | 0.091 |
Appendix 3—table 6
Results for the MEGA analysis of the iBREATH data.
| Term | Estimate | SE | z-value | p-value |
|---|---|---|---|---|
| Intercept | –1.35 | 0.13 | –10.35 | <0.001 |
| Condition asynchronous | –0.15 | 0.09 | –1.74 | 0.082 |
| 9 mo | 0.25 | 0.17 | 1.47 | 0.141 |
| 18 mo | –0.15 | 0.19 | –0.77 | 0.440 |
| Condition * 9 mo | 0.02 | 0.12 | 0.17 | 0.864 |
| Condition * 18 mo | 0.23 | 0.16 | 1.50 | 0.134 |
-
Results for the mixed model using a beta error distribution. Results are in comparison to the synchronous condition, and 3 mo age group.
Appendix 3—table 7
Results for the MEGA analysis of the iBREATH data.
| Term | Estimate | SE | z-value | p-value |
|---|---|---|---|---|
| Intercept | –1.10 | 0.11 | –9.76 | <0.001 |
| Condition asynchronous | –0.13 | 0.08 | –1.75 | 0.080 |
| 3 mo | –0.25 | 0.17 | –1.47 | 0.141 |
| 18 mo | –0.40 | 0.13 | –3.12 | 0.001 |
| Condition * 3 mo | –0.02 | 0.12 | –0.17 | 0.864 |
| Condition * 18 mo | 0.21 | 0.15 | 1.43 | 0.154 |
-
Results for the mixed model using a beta error distribution. Results are in comparison to the synchronous condition, and 9 mo age group.
Appendix 3—table 8
Results for the MEGA analysis of the iBREATH data.
| Term | Estimate | SE | z-value | p-value |
|---|---|---|---|---|
| Intercept | –1.35 | 0.13 | –10.35 | <0.001 |
| Condition asynchronous | –0.15 | 0.09 | –1.74 | 0.082 |
| 3 mo | 0.25 | 0.17 | 1.47 | 0.141 |
| 9 mos | –0.15 | 0.19 | –0.77 | 0.440 |
| Condition * 3 mo | –0.23 | 0.16 | –1.50 | 0.134 |
| Condition * 9 mo | –0.21 | 0.15 | –1.43 | 0.154 |
-
Results for the mixed model using a beta error distribution. Results are in comparison to the synchronous condition, and 18 mo age group.
Appendix 3—table 9
MEGA analysis for the relationship between iBEATs and iBREATH with 3 mo as reference group.
| Term | Estimate | SE | z-value | p-value |
|---|---|---|---|---|
| Intercept | –1.17 | 0.22 | –5.25 | <0.001 |
| iBEATs score | –1.83 | 0.97 | –1.89 | 0.059 |
| 9 mo | –0.15 | 0.34 | –0.42 | 0.674 |
| 18 mo | –0.05 | 0.35 | –0.15 | 0.880 |
| iBEATs * 9 mo | 0.67 | 1.31 | 0.51 | 0.610 |
| iBEATs * 18 mo | 3.13 | 1.41 | 2.22 | 0.027 |
-
Results for the mixed model using a beta error distribution. Results are in comparison to the 3 mo age group.
Appendix 3—table 10
MEGA analysis for the relationship between iBEATs and iBREATH with 9 mo as reference group.
| Term | Estimate | SE | z-value | p-value |
|---|---|---|---|---|
| Intercept | –1.13 | 0.27 | –4.89 | <0.001 |
| iBEATs score | –1.16 | 0.90 | –1.30 | 0.192 |
| 3 mo | 0.15 | 0.34 | 0.42 | 0.674 |
| 18 mo | 0.09 | 0.38 | 0.24 | 0.810 |
| iBEATs * 3 mo | –0.67 | 1.31 | –0.51 | 0.610 |
| iBEATs * 18 mo | 2.45 | 1.36 | 1.81 | 0.070 |
-
Results for the mixed model using a beta error distribution. Results are in comparison to the 9 mo age group.
Appendix 3—table 11
MEGA analysis for the relationship between iBEATs and iBREATH with 18 mo as reference group.
| Term | Estimate | SE | z-value | p-value |
|---|---|---|---|---|
| Intercept | –1.22 | 0.28 | –4.39 | <.001 |
| iBEATs score | 1.30 | 1.02 | 1.27 | .204 |
| 3 mo | 0.05 | 0.35 | 0.15 | .880 |
| 9 mos | –0.09 | 0.38 | –0.24 | .810 |
| iBEATs * 3 mo | –3.13 | 1.41 | –2.22 | .027 |
| iBEATs * 9 mo | –2.45 | 1.36 | –1.81 | .070 |
-
Results for the mixed model using a beta error distribution. Results are in comparison to the 18 mo age group.
Appendix 4—table 1
Analytical decisions for the iBEATs.
| Category | Implementation specification curve analysis | Number of analytical choices |
|---|---|---|
| Outlier rejection | Only for sync trials, apply to all trials | 2 |
| SD outlier rejection | 2SD, 2.5SD, 3SD, no criterion | 4 |
| ECG artifact trial rejection | All R-peaks identified, missed single R-peaks, missed R-peaks in last two seconds, identified at least 85% of R-peaks | 4 |
| Data transformation | Log-transformation, non-transformed data | 2 |
| Trial removal | Remove trials with 0 looking times, keep trials with 0 looking times | 2 |
| Min. number of trials per id to be included | 8, 4, 2, 0 | 4 |
| Statistical analysis | Paired t-test, linear mixed model (trials clustered in id) | 2 |
Appendix 4—table 2
Analytical decisions for the iBREATH.
| Category | Implementation specification curve analysis | Number of analytical choices |
|---|---|---|
| Outlier rejection | Only for sync trials, apply to all trials | 2 |
| SD outlier rejection | 2SD, 2.5SD, 3SD, no criterion | 4 |
| Respiration artifact trial rejection | Only good signals, include deep breaths, artifacts in ECG but not respiration, deep breaths & artifacts in ECG, short flat lines in respiratory signal, flat lines & deep breaths and/or ECG artifacts | 6 |
| Data transformation | Log-transformation, non-transformed data | 2 |
| Trial removal | Remove trials with 0 looking times, keep trials with 0 looking times | 2 |
| Min. number of trials per id to be included | 8, 4, 2, 0 | 4 |
| Statistical analysis | Paired t-test, linear mixed model (trials clustered in id) | 2 |
Appendix 4—table 3
Inference of the specification curve analysis.
| Test statistic used | Observed result | p-value (% of shuffled results as or more extreme than observed results) |
|---|---|---|
| iBEATs | ||
| 1. Median effect size | 0.111 | 0.008 |
| 2. Share of significant results | 470 | 0.042 |
| 3. Aggregate all p-values | Stouffer Z=–39.91 | 0.068 |
| iBREATH | ||
| 1. Median effect size | 0.109 | 0.032 |
| 2. Share of significant results | 269 | 0.088 |
| 3. Aggregate all p-values | Stouffer Z=–24.32 | 0.120 |
Appendix 5—table 1
Looking times for slow and fast asynchronous trials.
| Mean Async (SD) in ms | Mean Slow (SD) in ms | Mean Fast (SD) in ms | Comparison | |
|---|---|---|---|---|
| iBEATs, 3 mo | 5812 (5804) | 5652 (5731) | 5961 (5885) | t(299.15)=0.46, p=0.64 |
| iBEATs, 9 mo | 6539 (4924) | 6517 (5125) | 6655 (4755) | t(536.77)=0.33, p=0.74 |
| iBEATs, 18 mo | 6877 (5518) | 6608 (5473) | 7120 (5578) | t(171.77)=0.61, p=0.54 |
| iBREATH, 3 mo | 7259 (8057) | 7924 (8601) | 6630 (7491) | t(206.34)=–1.18, p=0.24 |
| iBREATH, 9 mo | 6123 (5282) | 6657 (5779) | 5659 (4939) | t(366.26)=–1.85, p=0.066 |
| iBREATH, 18 mo | 5477 (5325) | 6078 (6053) | 4969 (4610) | t(99.74)=–1.11, p=0.27 |
-
For this analysis we used the pre-processing of the MEGA-analysis. Thus, looking times might differ from the confirmatory analysis.
Additional files
Download links
A two-part list of links to download the article, or parts of the article, in various formats.
Downloads (link to download the article as PDF)
Open citations (links to open the citations from this article in various online reference manager services)
Cite this article (links to download the citations from this article in formats compatible with various reference manager tools)
Respiratory and cardiac interoceptive sensitivity in the first two years of life
eLife 12:RP91579.
https://doi.org/10.7554/eLife.91579.4


