A neurocomputational account of the link between social perception and social action
- Department of Psychology, Queen’s University, Canada
- Department of Psychology, University of Toronto Scarborough, Canada
- Department of Marketing, Rotman School of Management, University of Toronto, Canada
- Center for Neuroscience Studies, Queen’s University, Canada
Figures
Figure 1
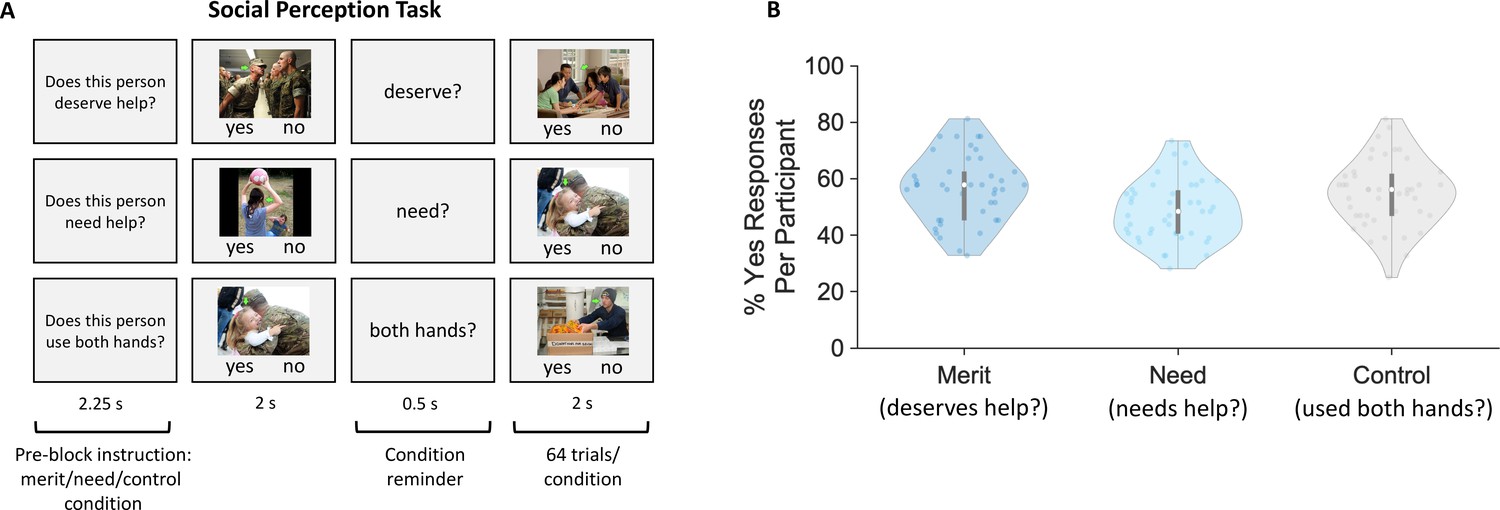
Social perception task and perceptual judgments.
(A) Social perception task. Participants made rapid yes/no judgments regarding others’ perceived deservingness (merit blocks, top row), need (need blocks, middle row), or factual inferences (control blocks, bottom row) while their brain responses were measured using fMRI. All photographs included in this panel are in the public domain in the United States. (B) Social perception responses. Violin plots of the participant-specific percentage of yes responses (dots) for merit (left), need (middle), and control judgments (right). Merit: 56.70 ± 11.91; Need: 48.69 ± 10.81; Control: 54.87 ± 12.03. Edges of boxplots (gray bars) indicate the 25th–75th percentiles, boxplot whiskers illustrate minima and maxima, and central white dots represent median values. Two outliers for merit and one outlier for need responses were excluded based on values that exceeded 3 standard deviations from the mean.
Figure 2 with 2 supplements

Estimates of the computational model of social perception.
(A) Violin plots illustrate the distribution of participant-specific estimates (dots) of the perceptual sensitivity and (B) perceptual bias for each inference condition in the social perception task (merit, need, and control). Edges of boxplots (bars) indicate the 25th–75th percentiles; central red dots represent mean values.
Figure 2—figure supplement 1
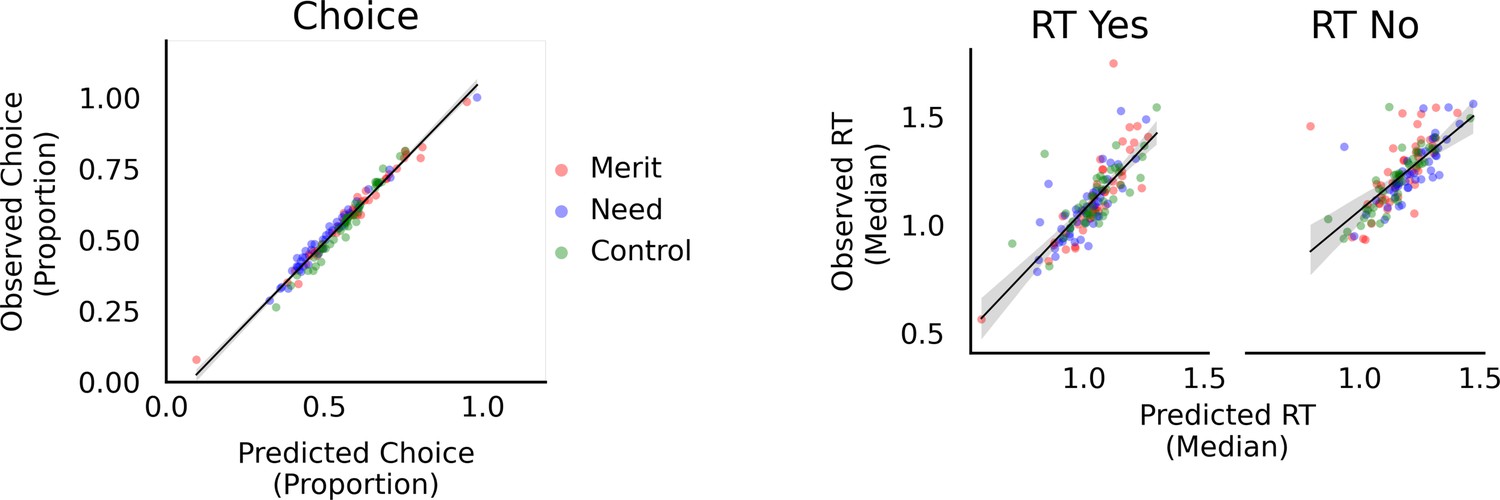
Model fit of our computational model of social perception illustrated via the correspondence between predicted (model) and observed (data) choices (left panel) and reaction times (RTs; middle and right panel).
Figure 2—figure supplement 2
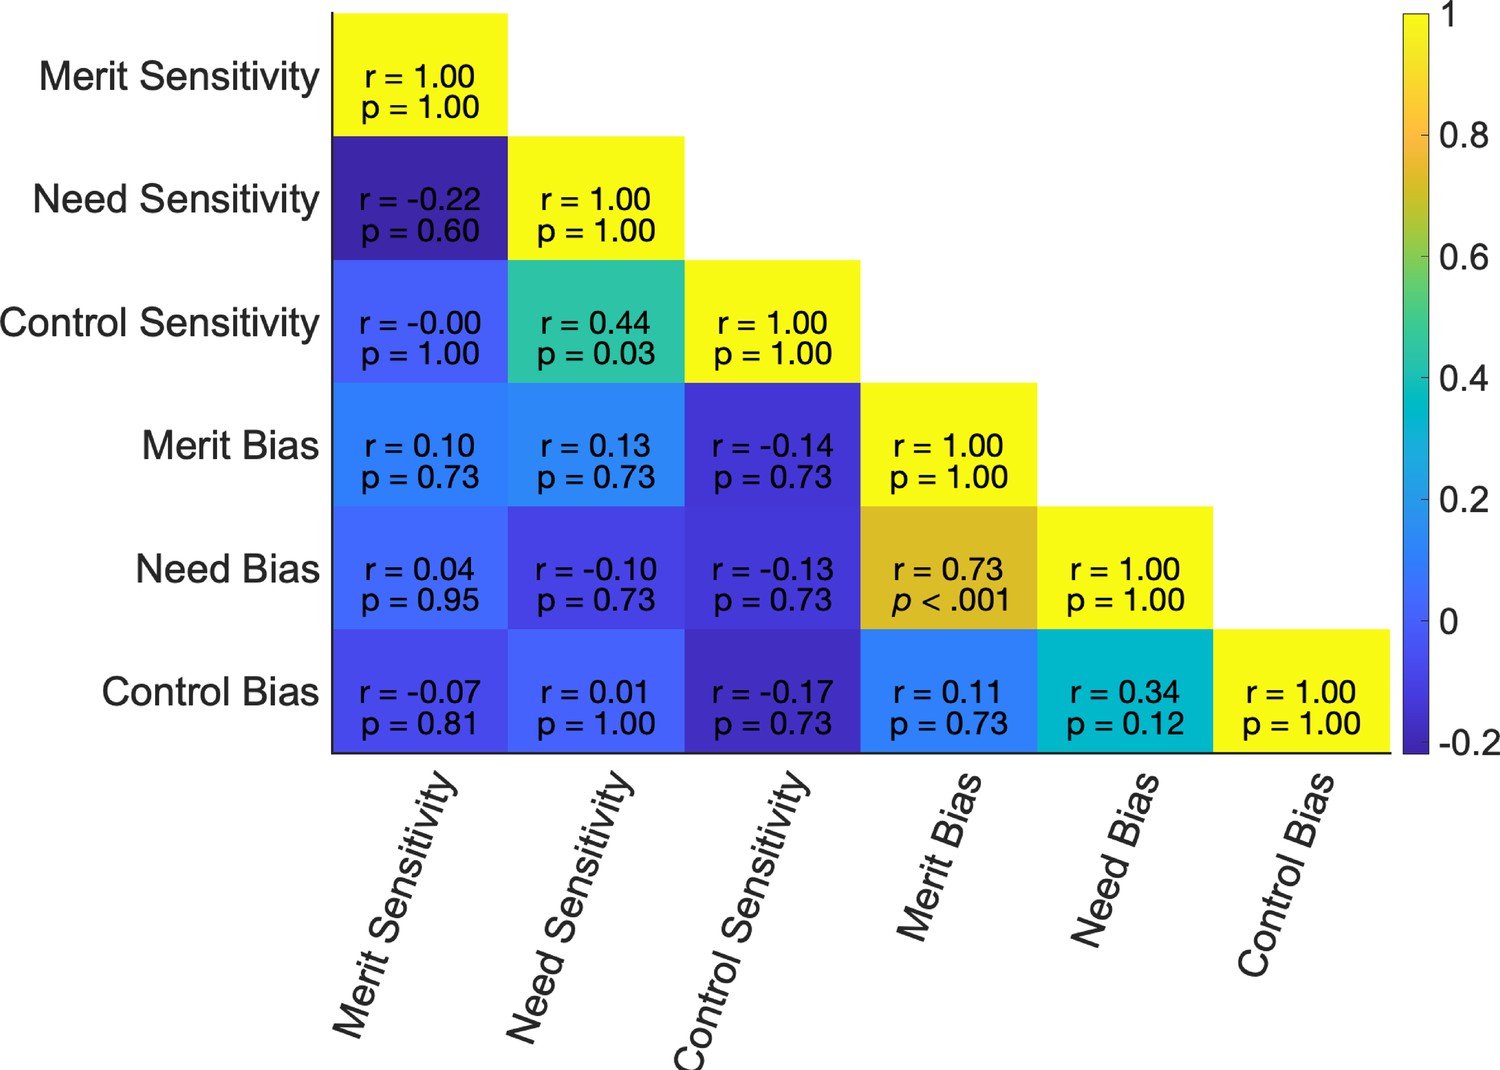
Intercorrelation of estimates of the computational behavioral model of social perception (upper values indicate Spearman’s correlation coefficients, lower values represent p-values, FDR corrected for multiple comparisons, and pairwise outlier exclusions based on ± 3 standard deviations; 1.52% outliers removed for all variables).
Figure 3 with 2 supplements
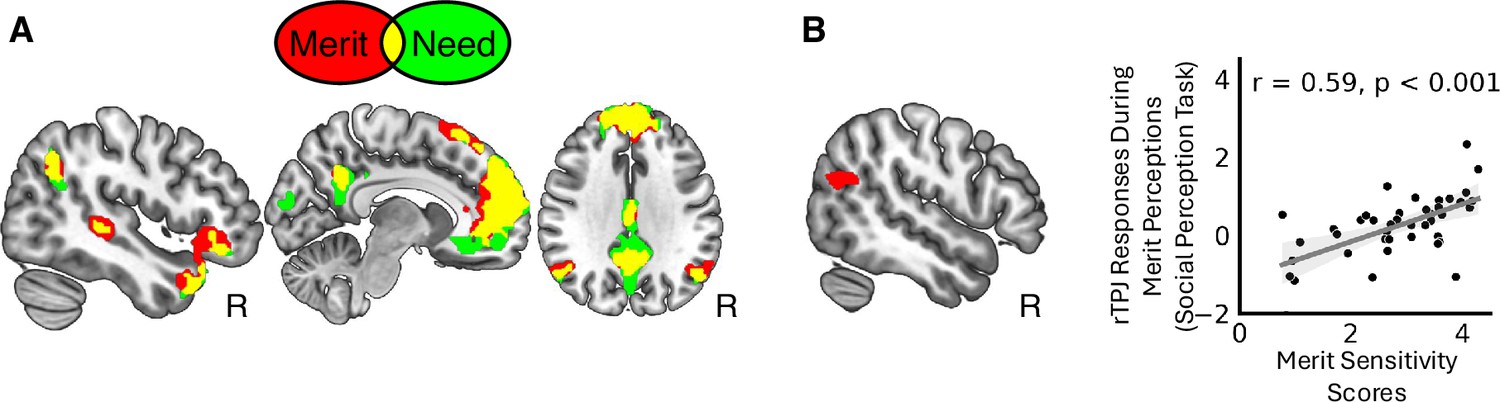
Neural correlates of need and merit inferences.
(A) Need and merit inferences activate the mentalizing network to a similar extent (red illustrates brain regions activated for [merit − control], green illustrates brain regions identified for [need − control], and yellow indicates overlap; both contrast maps thresholded at p < 0.001 at the voxel level, family-wise error (FWE) corrected at the cluster level at p < 0.05; R = right hemisphere). (B) Activity in the right temporoparietal junction (TPJ) during merit perceptions [merit − control] reflects individual differences in merit sensitivity scores estimated in the computational model of social perception.
Figure 3—figure supplement 1

Conjunction of brain areas recruited during need and merit perceptions (social perception task) of brain maps identified for [need − control] and [merit − control] inferences (each social perception map thresholded at p < 0.001 at the voxel level, family-wise error (FWE) corrected at the cluster level at p < 0.05).
Figure 3—figure supplement 2

Cluster in the right temporoparietal junction (rTPJ) activated during merit perceptions (social perception task) that reflect individual differences in merit sensitivity estimated in the computational model of social perception (in only the n = 25 participants with overlapping altruistic choice task data).
Figure 4 with 1 supplement
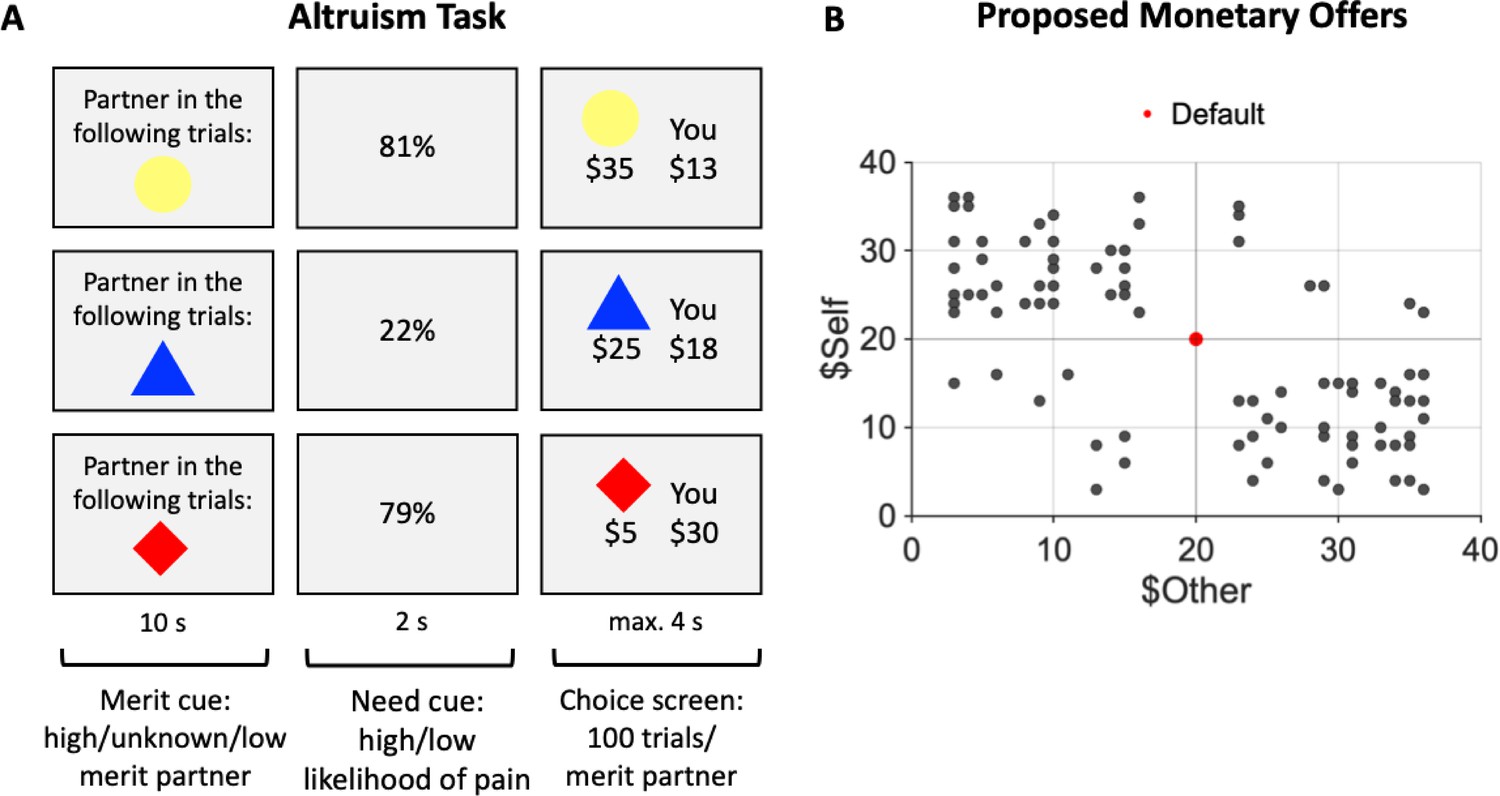
Altruism task and its proposed monetary offers.
(A) Altruism task. On each trial, participants accepted or rejected a monetary offer that affected the payoffs for themselves (You) and one of three partners (choice screen; displayed offer vs. constant default of $20 for both). The three partners (identified via colored geometric shapes) differed in their associated merit (merit cue: high/low/unknown) based on partner behavior in a separate exchange game played before the altruism task (see Appendix 1). Partner’s need (need cue: high/low) was manipulated on a trial-by-trial basis, indicated by the likelihood of a painful cold pressor task (CPT) for the partner after the altruism task (high need: 80 ± 4%; low need: 20 ± 4%). Partners could buy out of the painful CPT using funds from one randomly selected trial at the end of the altruism task. Participants were informed that they could help their partners avoid the painful CPT by making generous choices. (B) Proposed monetary offers for the participant (You) and the partner (represented by one of three colored geometric shapes in A) ranged from $5 to $35. Offers are illustrated as indicated as black dots, whereas the constant default offer ($20 for both) is indicated as a red dot. Monetary proposals were selected such that most choices involved a trade-off between higher payoffs for participants and partners (upper left and lower right quartile), compared to the constant default offer.
Figure 4—figure supplement 1
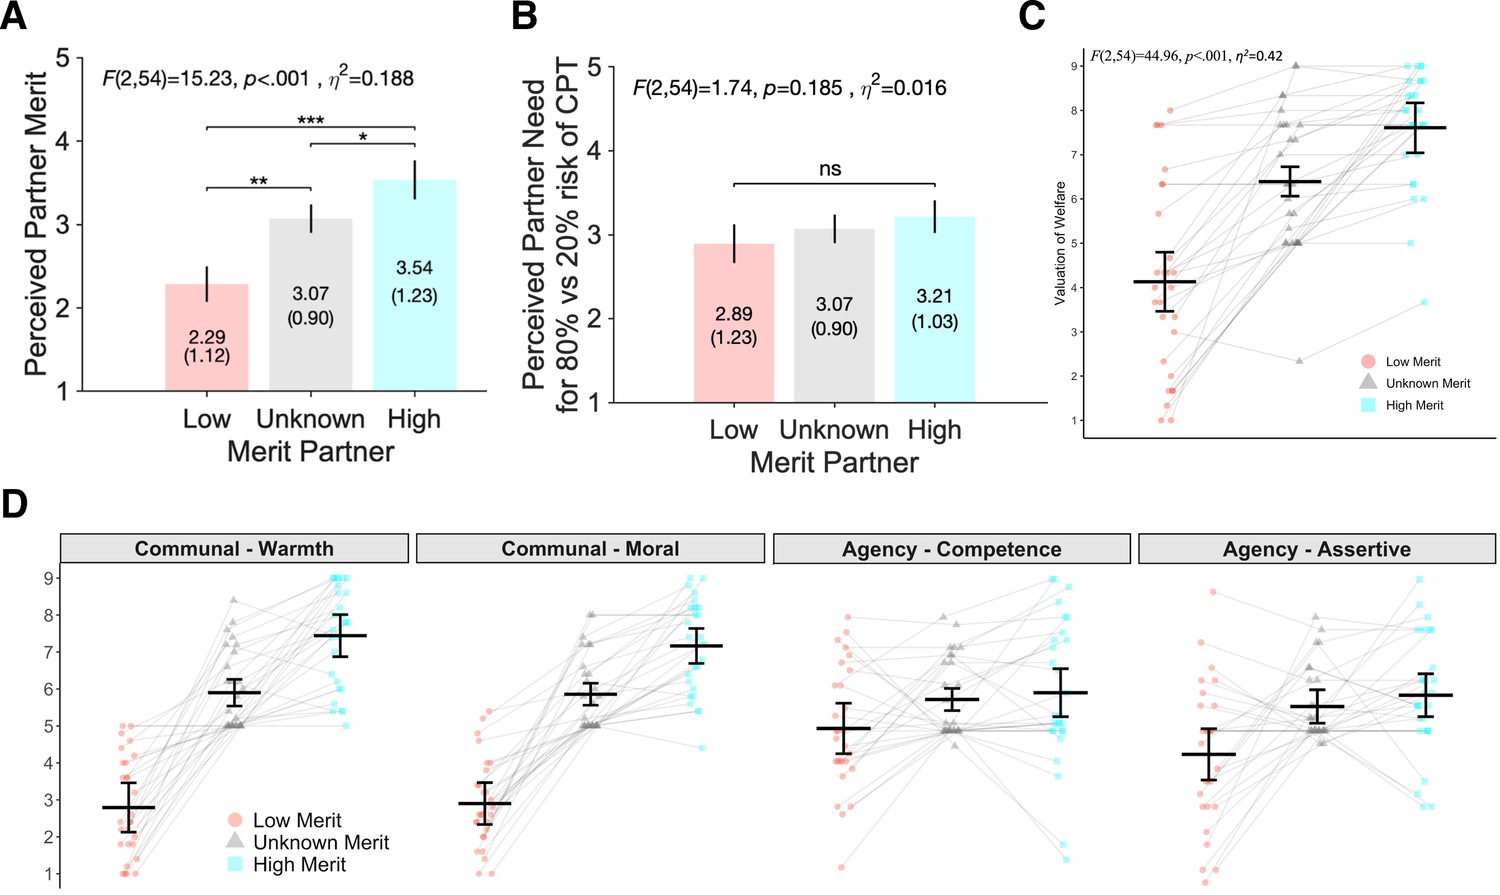
Sanity checks of successful merit and need manipulation.
We tested for differences in self-reported perceived partner need and merit, obtained at the end of the altruism task (5-point scale, 1 = ‘Not at all’ to 5 = ‘Extremely’), using a two-factorial repeated-measures ANOVA. Mauchly’s test indicated that the assumption of sphericity had been violated, W = 0.61, p < 0.01; therefore, the degrees of freedom were corrected using Huynh–Feldt estimates of sphericity (ε = 0.75). (A) The perceived merit of the three partners differed significantly, F(2,54) = 15.23, p < 0.001, η2 = 0.188. Participants perceived a high merit partner as more deserving than an unknown (p = 0.029) or low (p < 0.001) merit partner, and a low merit partner was rated as less deserving than an unknown merit partner (p = 0.003; How much more do you think this partner DESERVED to be helped when the chance of having to hold a hand in ice water was 80% vs. 20%?). (B) Participants perceived others’ need to be greater in high need trials (~80% risk of cold pressor task [CPT]) compared to low need trials (~20% risk of CPT) by an average of 3.06 (out of a 5-point scale) across all three partners (How much more do you think this partner NEEDED help when the chance of having to hold a hand in ice water was 80% vs. 20%). There were no significant differences in the perceived increased need (for 80% vs. 20% CPT) across the three partners (W = 0.71, p < 0.05, ε = 0.81; F(2,54) = 1.74, p = 0.185, η2 = 0.016). This was not surprising as participants were told before the altruism task that all three partners perceived the CPT as equally and maximally painful. (C) Our experimental merit manipulation also yielded significant differences in self-reported valuation of partners’ welfare, F(2,54) = 44.96, p < 0.001, η2 = 0.420 (all p’s < 0.001, Bonferroni corrected). (D) Finally, our merit manipulation affected the perceived trait impressions (Abele et al., 2016) of the three partners in the altruism task (9-point scale, 1 = ‘Not at all’ to 9 = ‘Extremely’). Warmth: F(2,54) = 78.75, p < 0.001, η2 = 0.707; Moral: F(2,54) = 95.26, p < 0.001, η2 = 0.710; Competence: F(2,54) = 3.41, p < 0.05, η2 = 0.065; Assertive: F(2,54) = 8.91, p < 0.001, η2 = 0.169. The findings suggest that the merit and need manipulations were effective. Red = low merit, gray = unknown merit, blue = high merit.
Figure 5 with 1 supplement
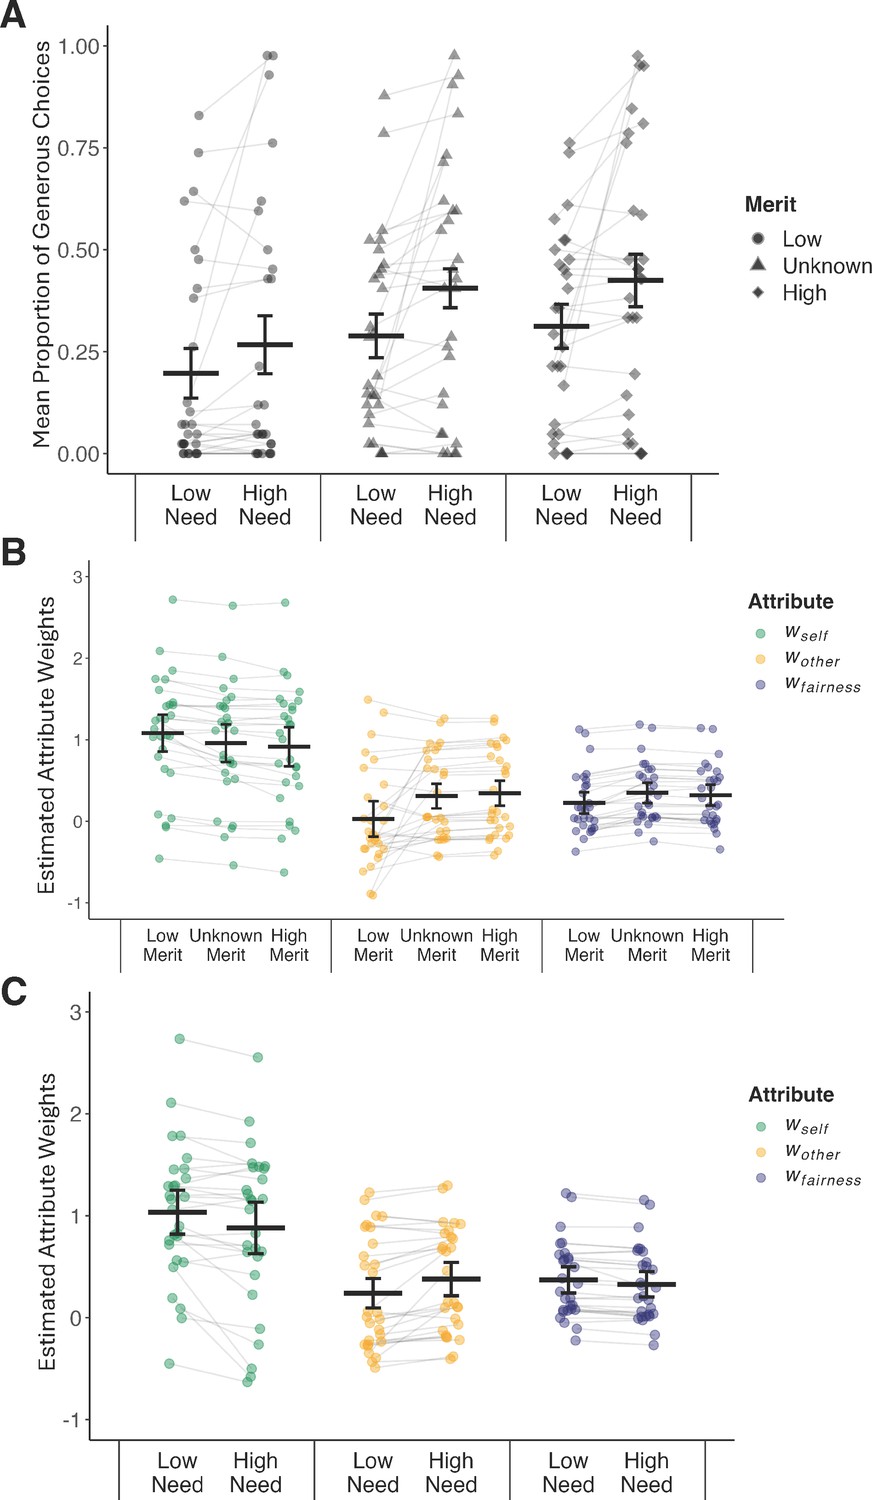
Effects of partner's merit and need on altruistic decision-making.
(A) Partner’s merit and need altered generosity in the altruism task. High (vs. low) need contexts elicited more generosity (p < 0.001). Compared to a low merit partner (circle), generosity was enhanced toward a high merit (diamond, p < 0.001) and an unknown merit partner (triangle, p < 0.001). (B) Condition-specific attribute weights (wself, wother, wfairness) for low, unknown, and high merit partner contexts. (C) Condition-specific attribute weights for low and high need contexts. All p’s ≤ 0.01, FDR corrected, for the six pair-wise comparisons of changes in attribute weights (high vs. low merit/need). Dots represent participant-specific estimates from the computational model of altruistic choice; black lines illustrate the estimated means and 95% confidence intervals.
Figure 5—figure supplement 1
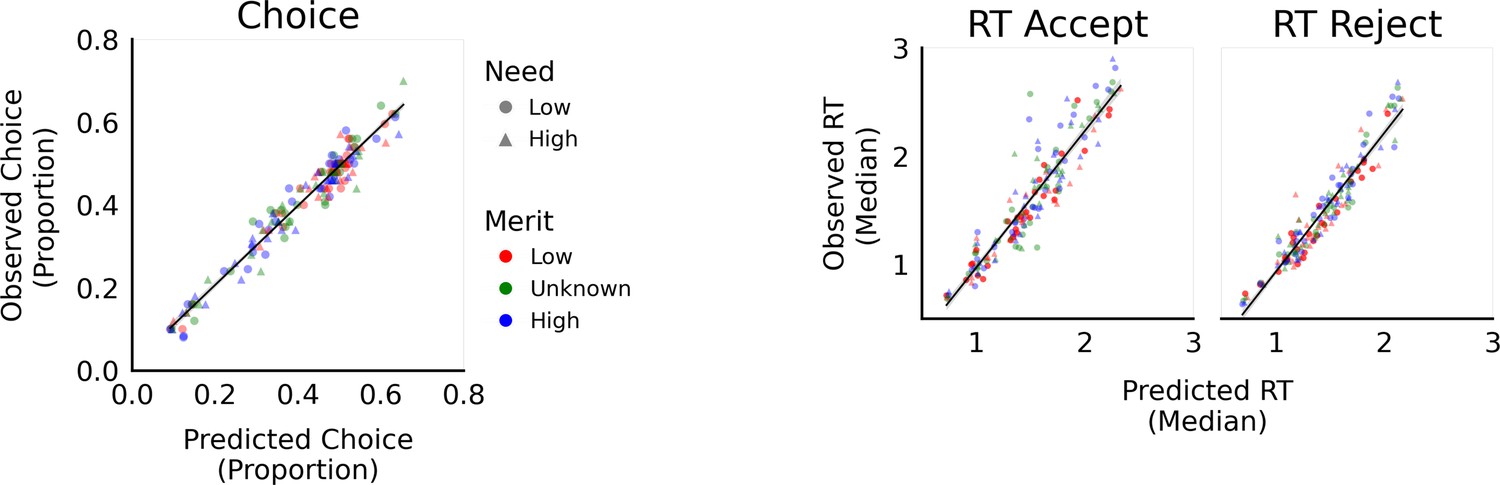
Model fit of our computational model of altruistic choice illustrated via the correspondence between predicted (model) and observed (data) choices (left panel) and reaction times (RTs; middle and right panel).
Figure 6
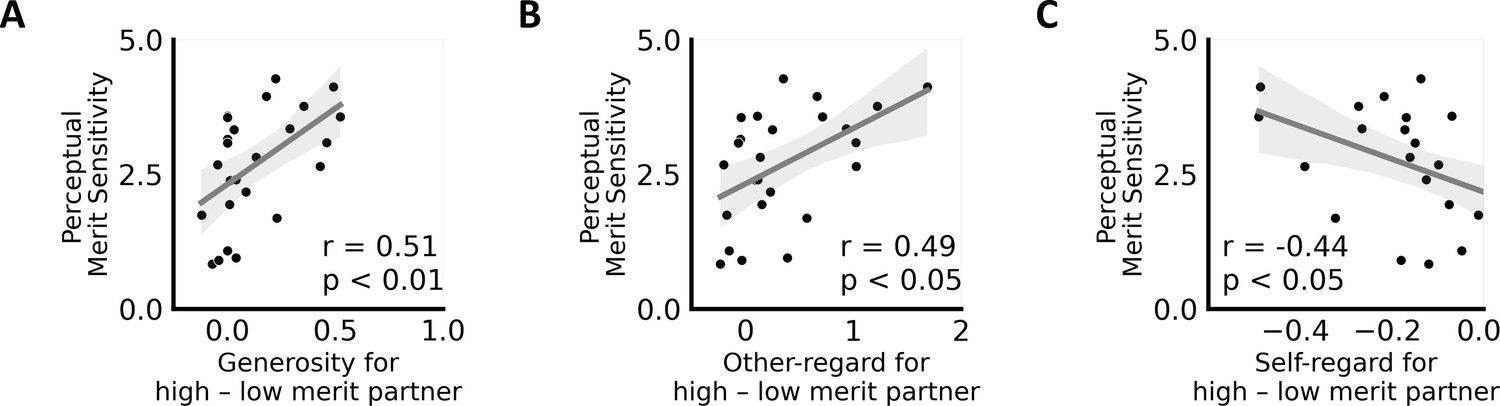
Individual differences in merit sensitivity predict social preferences in altruistic decisions.
(A) Variance in individuals’ general sensitivity to others’ merit (social perception task) is positively linked with merit-related changes in generosity, (B) other-regard (wother), and (C) self-regard (wself) during altruistic choice for high versus low merit partners (altruism task). Higher values on the x-axes indicate increased generosity/other-regard and decreased self-interest when interacting with a high versus low merit partner in the altruism task.
Tables
Table 1
Neural activations during social need and merit inferences in the social perception task.
| Brain region | Side | T | k | MNI (peak) | ||
|---|---|---|---|---|---|---|
| x | y | z | ||||
| [Need − control] ∩ [Merit − control] | ||||||
| Dorsomedial prefrontal cortex | L | 7.78 | 6250 | –14 | 38 | 48 |
| Superior temporal sulcus | L | 6.61 | 1154 | –64 | –26 | –14 |
| Superior temporal sulcus | R | 5.42 | 146 | 70 | –32 | 0 |
| Temporal pole | R | 6.16 | 523 | 40 | 22 | –32 |
| Posterior cingulate cortex | L | 5.97 | 671 | −2 | –54 | 32 |
| Midcingulate cortex | L | 5.17 | 119 | −2 | –10 | 34 |
| Temporoparietal junction (TPJ) | R | 4.56 | 167 | 54 | –66 | 34 |
| TPJ/angular gyrus | L | 4.58 | 141 | –50 | –62 | 32 |
| Cerebellum | L | 5.33 | 336 | –26 | –82 | –42 |
| [Merit > control] | ||||||
| Medial prefrontal cortex | L | 8.04 | 7616 | −8 | 54 | 18 |
| TPJ/ angular gyrus | R | 4.96 | 278 | 46 | –58 | 34 |
| TPJ/angular gyrus | L | 4.54 | 267 | –60 | –60 | 34 |
| Superior temporal gyrus | R | 5.84 | 526 | 68 | –34 | −2 |
| Posterior cingulate cortex | L | 6.56 | 687 | −4 | –48 | 28 |
| Medial cingulate cortex | L | 5.29 | 127 | −2 | –14 | 34 |
| Caudate nucleus | L | 5.43 | 74 | –12 | 10 | 12 |
| Anterior insula | L | 7.61 | 1973 | –38 | 20 | –14 |
| Anterior insula | R | 7.35 | 1123 | 34 | 22 | –16 |
| Dorsolateral prefrontal cortex | L | 4.45 | 66 | –34 | 22 | 46 |
| Cerebellum | R | 4.69 | 95 | 26 | –88 | –34 |
| Cerebellum | L | 6.05 | 471 | –26 | –80 | –34 |
| [Need > control] | ||||||
| Medial prefrontal cortex | L | 7.78 | 7522 | –14 | 38 | 48 |
| TPJ/angular gyrus | L | 4.58 | 261 | –50 | –62 | 32 |
| TPJ/angular gyrus | R | 4.56 | 252 | 54 | –66 | 34 |
| Medial temporal cortex | L | 6.61 | 1385 | –64 | –26 | –14 |
| Temporal pole | R | 6.16 | 801 | 40 | 22 | –32 |
| Superior temporal cortex | R | 5.42 | 181 | 70 | –32 | 0 |
| Posterior cingulate cortex | L | 5.97 | 1727 | −2 | –54 | 32 |
| Dorsolateral prefrontal cortex | L | 4.86 | 132 | –40 | 22 | 48 |
| Cerebellum | L | 5.33 | 362 | –26 | –82 | –42 |
| Cerebellum | R | 4.77 | 219 | 26 | –86 | –34 |
| Cuneus | L | 5.34 | 284 | −4 | –100 | 18 |
| [Need − control] > [Merit − control] | ||||||
| Visual cortex | L | 8741 | 7.64 | −4 | –98 | 18 |
| Intraparietal sulcus | R | 256 | 5.24 | 28 | –62 | 56 |
| Somatosensory cortex | R | 294 | 4.97 | 4 | –38 | 64 |
-
Note. Results are reported at a statistical threshold of p < 0.001 at the voxel level, family-wise error (FWE) corrected at cluster level at p < 0.05. There were no significant results for [Merit − control] > [Need − control]. Only peak activations of each cluster are shown. L = left hemisphere, R = right hemisphere, MNI = Montreal Neurological Institute, k = cluster size in voxels.
Table 2
Generosity in the altruism task (fraction of trials with generous choices).
| Condition | Mean | SD | Min | Max |
|---|---|---|---|---|
| Overall generosity (across conditions) | 0.34 | 0.23 | 0.08 | 0.91 |
| Merit low, Need low | 0.24 | 0.24 | 0.06 | 0.86 |
| Merit low, Need high | 0.30 | 0.30 | 0.00 | 0.98 |
| Merit unknown, Need low | 0.32 | 0.22 | 0.08 | 0.90 |
| Merit unknown, Need high | 0.43 | 0.28 | 0.06 | 0.94 |
| Merit high, Need low | 0.34 | 0.21 | 0.06 | 0.80 |
| Merit high, Need high | 0.44 | 0.29 | 0.08 | 0.96 |
Table 3
Correlations between changes in generosity and changes in parameter estimates of the computational model of altruistic choice (attribute weights) across conditions in the altruism task.
| Merit-inducedchanges in generosity[High merit − Low merit] | Need-inducedchanges in generosity[High need − Low need] | ||||
|---|---|---|---|---|---|
| Condition Altruism task | Changes in parameter estimates | R coefficient | p-value | R coefficient | p-value |
| Merit [High–low] | |||||
| Δwself | –0.85 | 0.000* | –0.19 | 344 | |
| Δwother | 0.91 | 0.000* | 0.01 | 0.948 | |
| Δwfairness | 0.56 | 0.018* | –0.11 | 0.569 | |
| Need [High–low] | |||||
| Δwself | 0.19 | 0.333 | 0.75 | 0.000* | |
| Δwother | –0.14 | 0.484 | –0.88 | 0.000* | |
| Δwfairness | –0.11 | 0.570 | –0.03 | 0.895 | |
-
Note. Spearman’s correlation coefficients, FDR corrected. * Indicates significant correlations.
Appendix 3—table 1
Scaling function, fsc(x), and resulting bounded range for each computational parameter in the model for the social perception task (left) and altruism task (right).
| Social perception task | Altruism task | |||
|---|---|---|---|---|
| Parameter | fsc(x) | Range | fsc(x) | Range |
| All drift parameters (S, w) | x × 10 − 5 | [−5, 5] | x × 10 − 5 | [−5, 5] |
| z | x | [0, 1] | x | [0, 1] |
| a | x × 9.999 − 0.001 | [0.001, 10.0] | x × 9.999 − 0.001 | [0.001, 10.0] |
| ndt | x × 2 | [0, 2] | x × 2 | [0, 2] |
-
Note. S = sensitivity, w = drift rates, a = difference between barriers, z = starting bias, ndt = non-decision time.
Additional files
-
MDAR checklist
- https://cdn.elifesciences.org/articles/92539/elife-92539-mdarchecklist1-v1.docx
-
Supplementary file 1
Estimates of the computational model of social perception (hyper-mean parameter estimates, means of the posterior distributions with 95% Highest Density Interval, HDI).
- https://cdn.elifesciences.org/articles/92539/elife-92539-supp1-v1.docx
-
Supplementary file 2
Whole-brain searchlight decoding of need, merit, and control inferences (social perception task).
- https://cdn.elifesciences.org/articles/92539/elife-92539-supp2-v1.docx
-
Supplementary file 3
Brain regions activated during merit perceptions (social perception task) that reflect individual differences in merit sensitivity (Smerit) estimated in the computational model of social perception (in the n = 25 participants with overlapping altruistic choice task data).
- https://cdn.elifesciences.org/articles/92539/elife-92539-supp3-v1.docx
-
Supplementary file 4
Logistic mixed models predicting generous choice (0/1).
- https://cdn.elifesciences.org/articles/92539/elife-92539-supp4-v1.docx
-
Supplementary file 5
Model-estimated weights of choice-relevant attributes (wself, wother, wfairness) and drift intercept bias (w0) in the altruism task at the participant level (computational model of altruistic choice, n = 28).
- https://cdn.elifesciences.org/articles/92539/elife-92539-supp5-v1.docx
-
Supplementary file 6
Hyper-mean parameter estimates (computational model of altruistic choice).
- https://cdn.elifesciences.org/articles/92539/elife-92539-supp6-v1.docx
Download links
A two-part list of links to download the article, or parts of the article, in various formats.
Downloads (link to download the article as PDF)
Open citations (links to open the citations from this article in various online reference manager services)
Cite this article (links to download the citations from this article in formats compatible with various reference manager tools)
A neurocomputational account of the link between social perception and social action
eLife 12:RP92539.
https://doi.org/10.7554/eLife.92539.3


