Visual routines for detecting causal interactions are tuned to motion direction
- Department of Psychology, Humboldt-Universität zu Berlin, Rudower Chaussee, Germany
- Berlin School of Mind and Brain, Germany
Figures
Figure 1
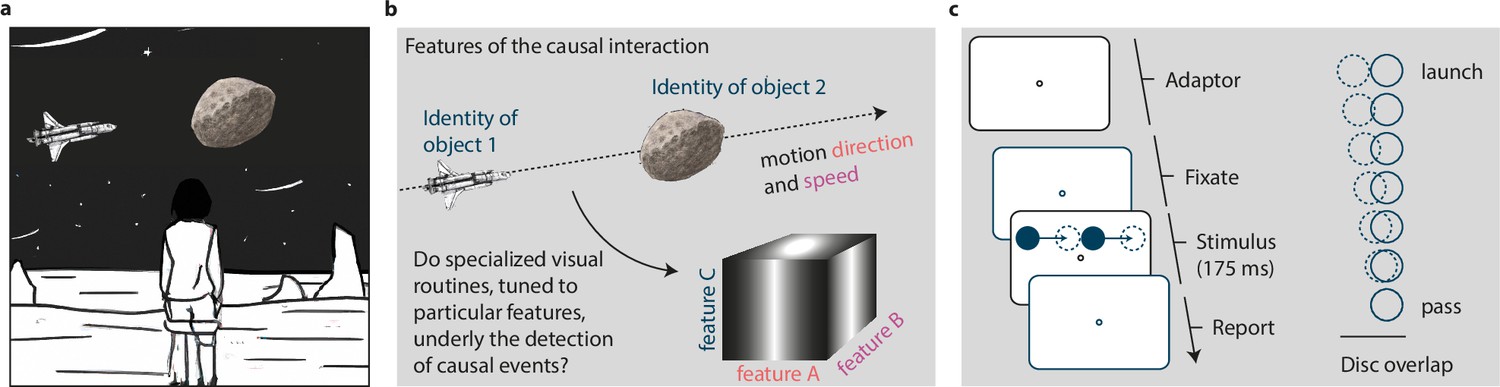
The perception of causality.
(a) A person perceiving an upcoming causal interaction between an uncrewed spacecraft and an asteroid. (b) Features of such launching events are the direction and speed of the colliding objects as well as their object identities (i.e. a specific set of features). Assessing the adaptation’s transfer between features allows us to determine whether the perception of causality arises in specialized visual routines that are tuned to a particular visual feature. (c) Trial sequence of a test event. A peripheral disc moved towards a stationary disc and stopped with some degree of overlap (ranging from 0–100% overlap in seven equidistant steps) between the two discs. The second disc then immediately started to move in the same direction, with the same speed as the first disc. In adaptation blocks, 320 launches were presented before the first test event of a block, and 16 top-up adaptation events before each subsequent test event.
Figure 2
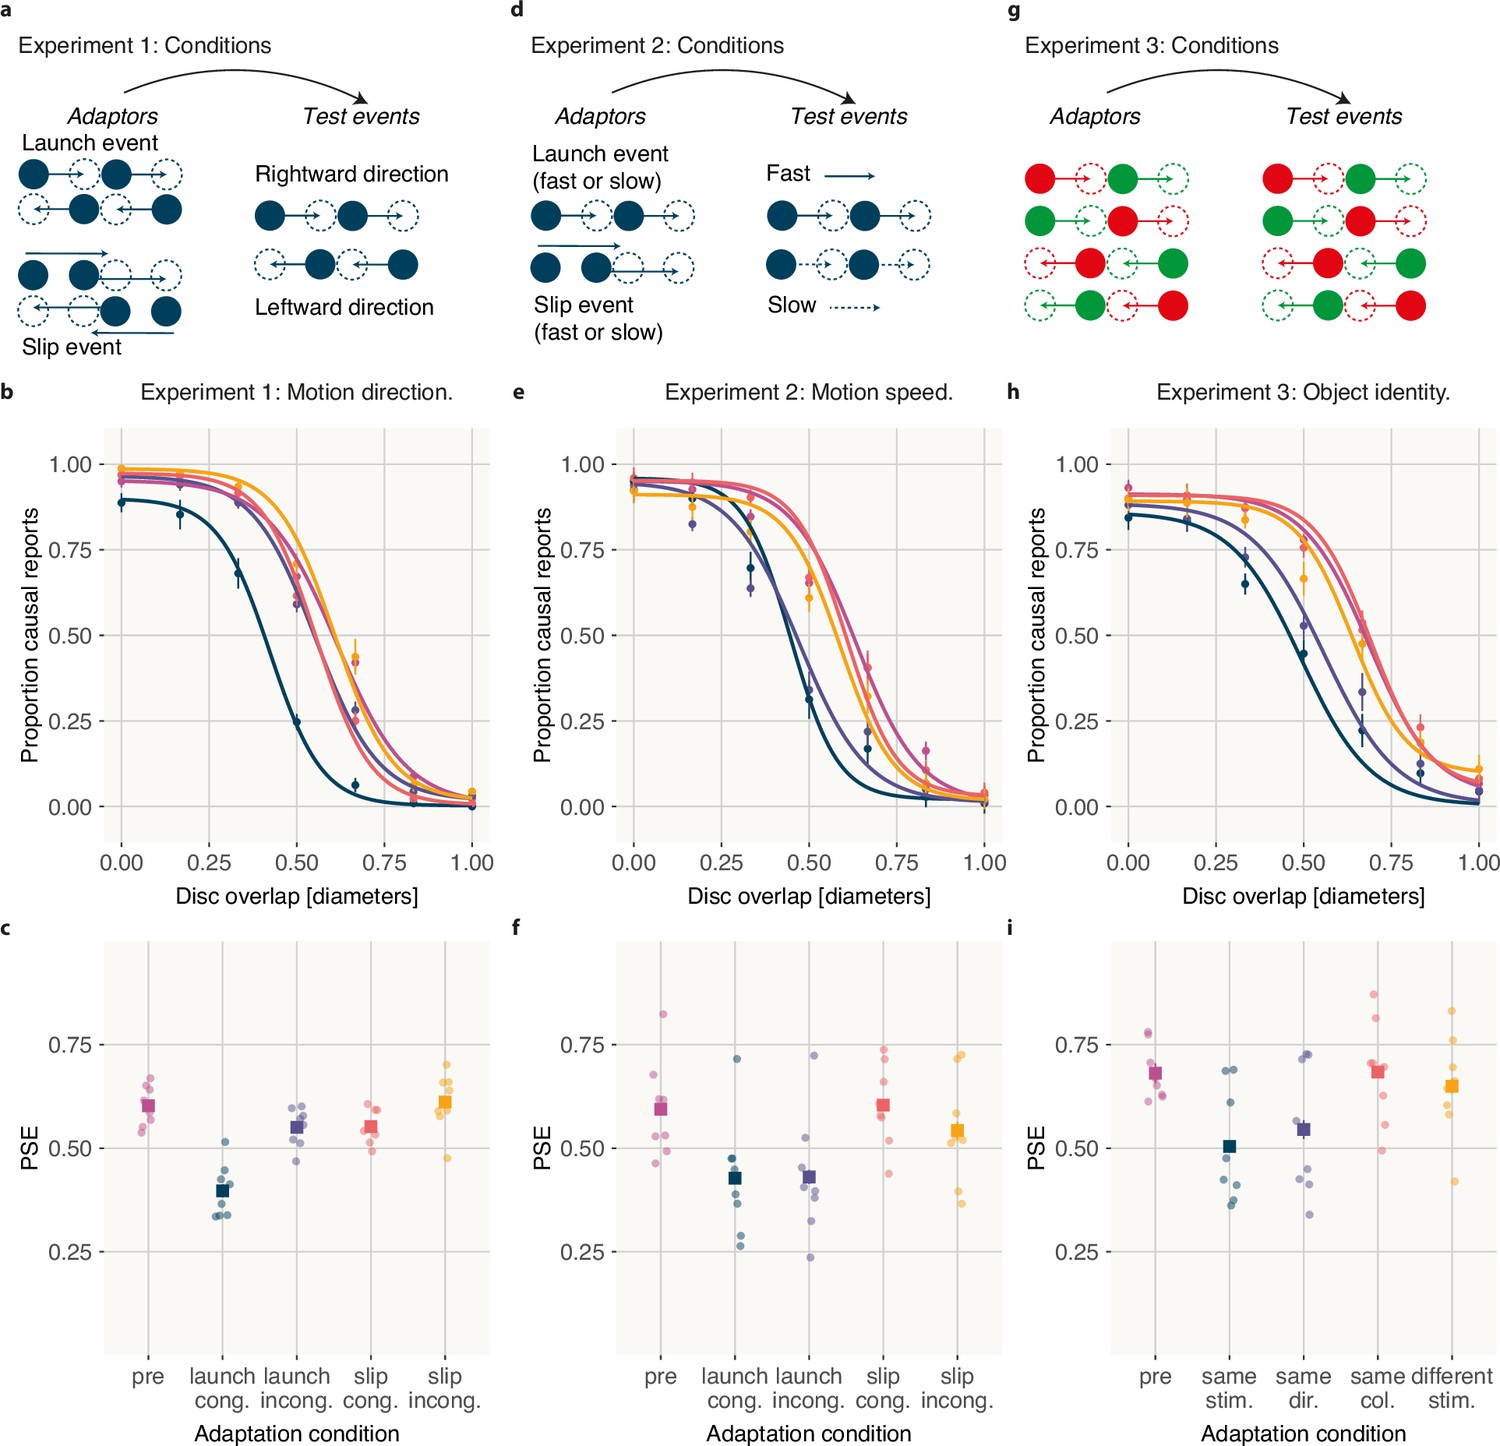
Results of Experiment 1, 2, and 3.
(a) Experimental conditions of Experiment 1. (b) Mean proportion of causal reports as a function of disc overlap in Experiment 1. Visualization of psychometric curves is based on the mean parameters averaged across observers before adaptation (pink), and after adaptation with direction-congruent launches (blue), direction-incongruent launches (in purple), direction-congruent slip events (red) and direction-incongruent slip events (in orange). (c) PSEs for each individual observers (circles, n=8) and the mean across observers (square). (d) Experimental conditions of Experiment 2. (e) Mean proportion of causal reports as a function of disc overlap in Experiment 2. Visualization of psychometric curves is based on the mean parameters averaged across observers before adaptation (pink), and after adaptation with speed-congruent launches (blue), speed-incongruent launches (in purple), speed-congruent slip events (red) and speed-incongruent slip events (in orange). (f) PSEs for each individual observers (circles, n=8) and the mean across observers (square). (g) Experimental conditions of Experiment 3. (h) Mean proportion of causal reports as a function of disc overlap in Experiment 3. Visualization of psychometric curves is based on the mean parameters averaged across observers before adaptation (pink), and after adaptation with adaptors that are identical with the test event (blue), share the same direction but different colors (in purple), same colors but different direction (red) and completely different test events (in orange). (i) PSEs for each individual observers (circles, n=8) and the mean across observers (square). All error bars are ±1 SEM.
Videos
Video 1
Example of the launch stimulus.
The stimulus is slowed down by a factor of 2.
Video 2
Example of the pass stimulus.
The stimulus is slowed down by a factor of 2.
Video 3
Example of the slip stimulus.
The stimulus is slowed down by a factor of 2.
Additional files
Download links
A two-part list of links to download the article, or parts of the article, in various formats.
Downloads (link to download the article as PDF)
Open citations (links to open the citations from this article in various online reference manager services)
Cite this article (links to download the citations from this article in formats compatible with various reference manager tools)
Visual routines for detecting causal interactions are tuned to motion direction
eLife 13:RP93454.
https://doi.org/10.7554/eLife.93454.3


