Contrasting responses to aridity by different-sized decomposers cause similar decomposition rates across a precipitation gradient
- Risk-Management Ecology Lab, Department of Ecology, Evolution & Behavior The Alexander Silberman Institute of Life Sciences, The Hebrew University of Jerusalem, Israel
- Theoretical Ecology and Evolution Lab, Centre for Ecological Sciences, Indian Institute of Science, India
- The National Natural History Collections, The Hebrew University of Jerusalem, Israel
Figures
Figure 1

Hypothetical climate dependence of litter decomposition by microorganisms and mesofauna (dotted orange curve), by macrofauna (gray – dash), and by the whole decomposer community (maroon – solid).
Figure 2
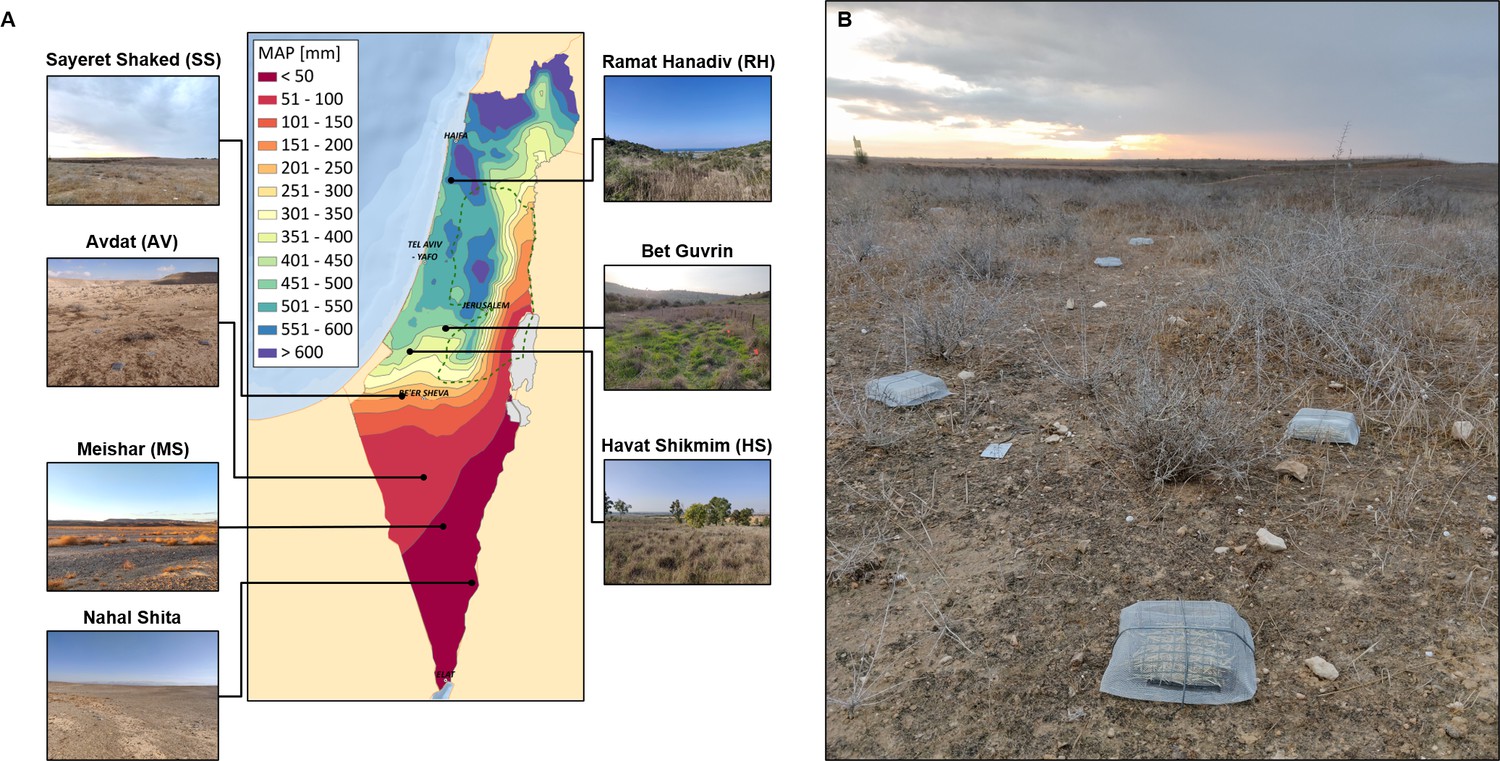
Illustration of the experimental design.
(A) Locations and landscapes of the seven experimental sites across a precipitation gradient from 22 to 526 mm mean annual precipitation (MAP). (B) A block of three litter baskets in the Sayeret Shaked site. Macro-basket in front, meso-basket on the right, and micro-basket on the left. The precipitation map courtesy of the Hebrew University GIS center.
Figure 3

Litter removal rate (mean ± standard error [se]) from baskets with different mesh sizes across sites and seasons.
Asterisks represent significant differences between mesh sizes within site and season: *p-value <0.05, **p-value <0.01, ***p-value <0.001 (Tukey’s Honestly Significant Difference). Each bar represents 25 samples, total n = 1050. NS – Nahal Shita; MS – Meishar; AV – Avdat; SS – Sayeret Shaked; HS – Havat Shikmim; BG – Bet Guvrin; RH – Ramat Hanadiv. Negative values may represent cases in which physical cleaning and ash correction failed to correct for all dust accumulation on the litter or cases in which exogenous litter may have penetrated the baskets. Our findings were not sensitive to these negative values.
Figure 4

Contribution of different organism size classes to litter removal (mean ± standard error [se]) across the precipitation gradient during summer, winter, and both seasons combined.
Macrofaunal contribution was calculated as the within-block difference between macro- and meso-baskets; mesofaunal contribution as the difference between meso- and micro-baskets; microbial and whole-community contributions represent litter removal rates in the micro- and macro-baskets, respectively. 25 litter baskets of each size class were used in each site during each season (total n = 1050). Curves were fitted to data using local estimation scatterplot smoothing (LOESS). Negative values may represent cases in which physical cleaning and ash correction failed to correct for all dust accumulation on the litter or cases in which exogenous litter may have penetrated the baskets. Our findings were not sensitive to these negative values.
Figure 5

Macro-decomposer abundance, biomass, and alpha morphospecies richness across the precipitation gradient in the two experimental seasons (mean ± standard error [se]).
Values are averaged across pitfall traps and divided by the number of trapping days. Sample sizes (number of recovered traps) in winter and summer, respectively: NS - 16,16; MS - 19,17; AV - 20,16; SS - 20,20; HS - 18,17; BG - 20,13; RH - 19,12. Curves are fitted to data using local estimation scatterplot smoothing (LOESS). NS – Nahal Shita; MS – Meishar; AV – Avdat; SS – Sayeret Shaked; HS – Havat Shikmim; BG – Bet Guvrin; RH – Ramat Hanadiv.
Figure 6

Differences in macro-decomposer assemblage across sites and seasons.
(A, B) Graphical representation of the first two axes of a principal coordinate analysis on the macro-decomposer assemblage data. Colors represent experimental sites in A and seasons in B. Arrows represent taxonomic group scores fitted onto the principal coordinates analysis (PCoA) ordination. (C) Distribution of abundance, biomass, and morphospecies richness among macro-decomposer taxonomic groups in each site across the aridity gradient. NS – Nahal Shita; MS – Meishar; AV – Avdat; SS – Sayeret Shaked; HS – Havat Shikmim; BG – Bet Guvrin; RH – Ramat Hanadiv. Color codes (left to right in panel C): gray – Zygentoma, burgundy – termites, olive green – millipedes, turquoise – woodlice, pink – snails and slugs, purple – earthworms, dark green – crickets, pale yellow – bristletails, red – beetles, pale blue – ants.
Tables
Table 1
Properties of the seven experimental sites.
| Site | Abb. | Coordinates | MAT* [°C] | MAP* [mm] | AIU* (MAP/PET) | Climate | Winter experiment | Summer experiment |
|---|---|---|---|---|---|---|---|---|
| Ramat Hanadiv | RH | 32°33′22.4″N 34°56′26.6″E | 20.2 | 526 | 0.518 | Dry sub-humid Mediterranean | 3.12.2020–27.6.2021 | 27.6–27.10.2021 |
| Bet Guvrin | BG | 31°35′54.7″N 34°54′14.2″E | 20.9 | 403 | 0.370 | Semiarid | 2.12.2020–13.6.2021 | 13.6–21.10.2021 |
| Havat Shikmim | HS | 31°30′49.7″N 34°41′18.8″E | 19.8 | 367 | 0.364 | Semiarid | 2.12.2020–13.6.2021 | 13.6–21.10.2021 |
| Sayeret Shaked | SS | 31°16′05.7″N 34°39′12.9″E | 20.0 | 148 | 0.145 | Arid | 26.11.2020–23.5.2021 | 23.5–21.10.2021 |
| Avdat | AV | 30°47′02.3″N 34°46′13.3″E | 18.7 | 84 | 0.089 | Arid | 26.11.2020–23.5.2021 | 23.5–21.10.2021 |
| Meishar | MS | 30°27′04.2″N 34°56′03.0″E | 20.8 | 33 | 0.029 | Hyper-arid | 10.12.2020–12.7.2021 | 12.7–8.11.2021 |
| Nahal Shita | NS | 30°08′29.4″N 35°07′36.6″E | 22.3 | 22 | 0.017 | Hyper-arid | 10.12.2020–12.7.2021 | 12.7–8.11.2021 |
-
*
Climatic data extracted from http://www.meteo-tech.co.il/hanadiv_new/hanadiv_en.asp (RH), courtesy of Shaily Dor-Haim (SS), and extracted from https://ims.gov.il/en (all other sites).
Table 2
Results of a full-factorial analysis of variance in litter removal rate across mesh sizes, experimental sites, and seasons.
| Df | Sum Sq | Mean Sq | F value | Pr(>F) | |
|---|---|---|---|---|---|
| Site | 6 | 0.002092 | 0.000349 | 171.946 | <0.001 |
| Season | 1 | 0.000679 | 0.000679 | 334.94 | <0.001 |
| Mesh size | 2 | 0.000267 | 0.000133 | 65.77 | <0.001 |
| Site:season | 6 | 0.00112 | 0.000187 | 92.044 | <0.001 |
| Site:mesh size | 12 | 0.000392 | 3.27E−05 | 16.11 | <0.001 |
| Season:mesh size | 2 | 1.77E−05 | 8.9E−06 | 4.368 | 0.0129 |
| Site:season:mesh size | 12 | 0.000129 | 1.08E−05 | 5.306 | <0.001 |
| Residuals | 1008 | 0.002044 | 0.000002 |
Additional files
-
Supplementary file 1
Results of post hoc pairwise comparisons between macro-decomposer assemblages across experimental sites.
- https://cdn.elifesciences.org/articles/93656/elife-93656-supp1-v1.docx
-
Supplementary file 2
Dissimilarity matrix between macro-decomposer assemblages of the different site–season combinations.
- https://cdn.elifesciences.org/articles/93656/elife-93656-supp2-v1.docx
-
MDAR checklist
- https://cdn.elifesciences.org/articles/93656/elife-93656-mdarchecklist1-v1.pdf
Download links
A two-part list of links to download the article, or parts of the article, in various formats.
Downloads (link to download the article as PDF)
Open citations (links to open the citations from this article in various online reference manager services)
Cite this article (links to download the citations from this article in formats compatible with various reference manager tools)
Contrasting responses to aridity by different-sized decomposers cause similar decomposition rates across a precipitation gradient
eLife 13:RP93656.
https://doi.org/10.7554/eLife.93656.3


