Gendered hiring and attrition on the path to parity for academic faculty
- Department of Computer Science, University of Colorado, United States
- BioFrontiers Institute, University of Colorado, United States
- Santa Fe Institute, United States
Figures
Figure 1
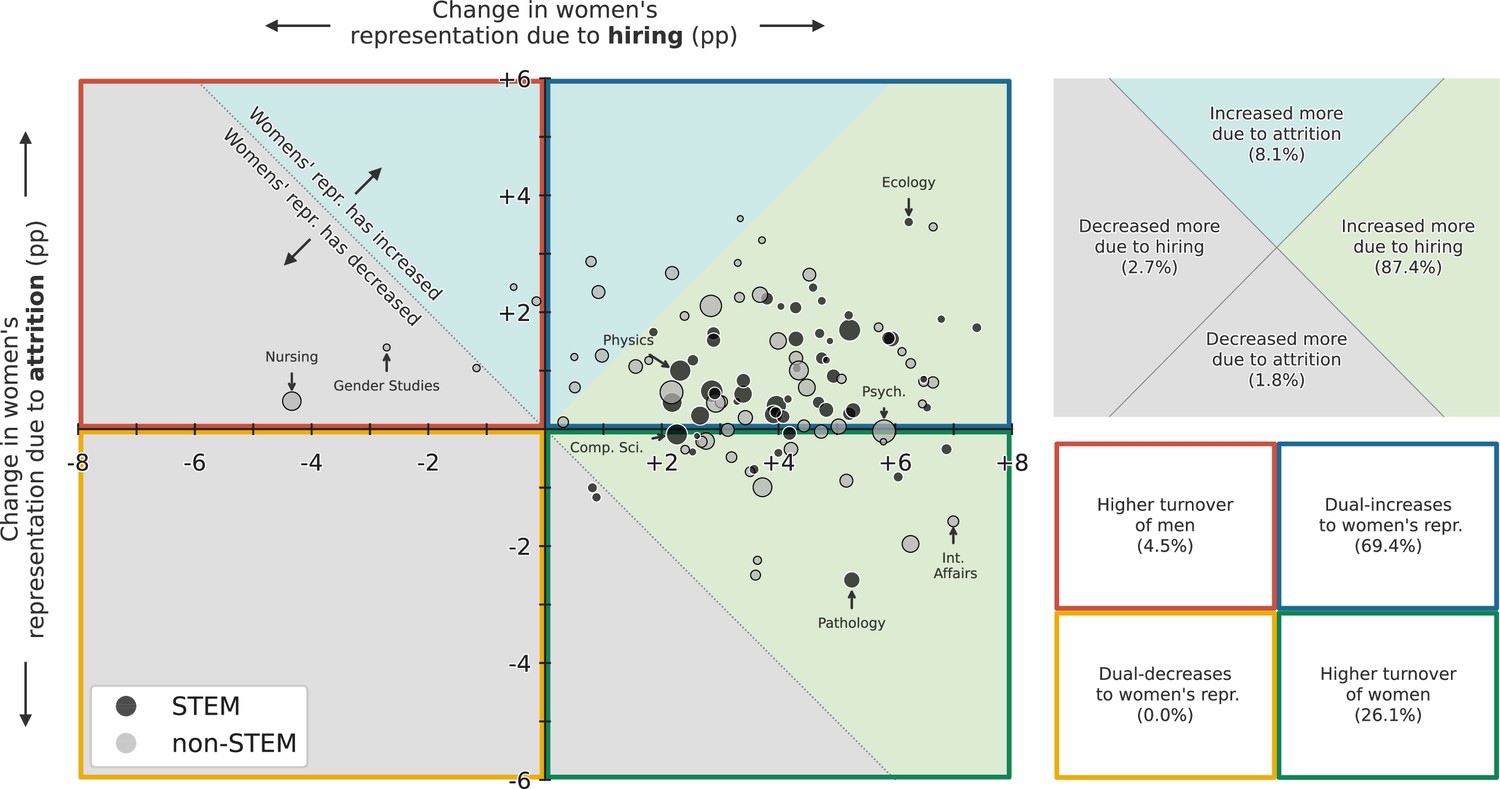
Change in women’s overall faculty representation for 111 academic fields between 2011 and 2020, decomposed into change due to hiring (horizontal axis) and change due to attrition (vertical axis, see Appendix 1 section, Decomposition of change in gender diversity), showing that hiring increased women’s representation for a large majority (87.4%) of fields, while it decreased women’s representation for five fields.
Point size represents the relative size of each field by number of faculty in 2020, and points are colored by Science, Technology, Engineering, and Mathematics (STEM) (black) or non-STEM (gray).
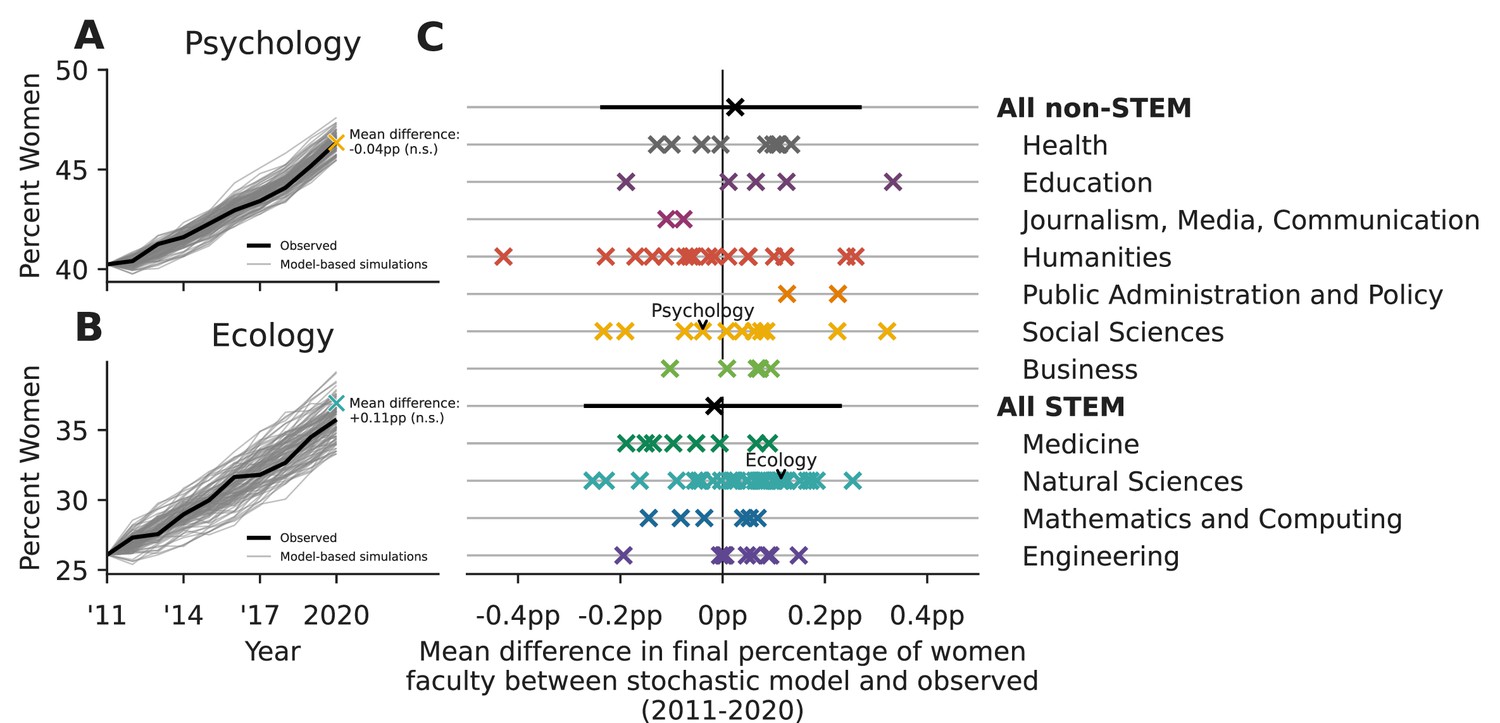
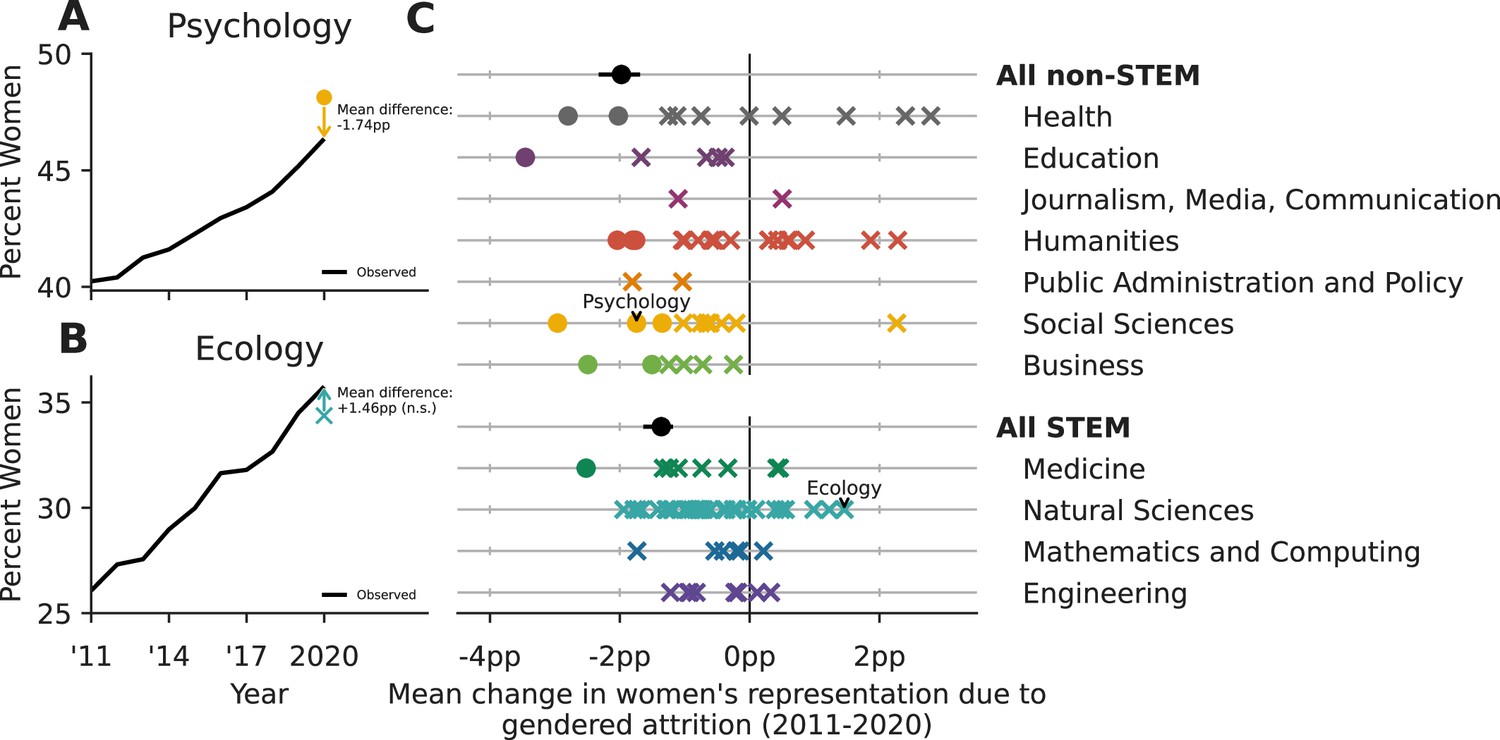
Figure 2
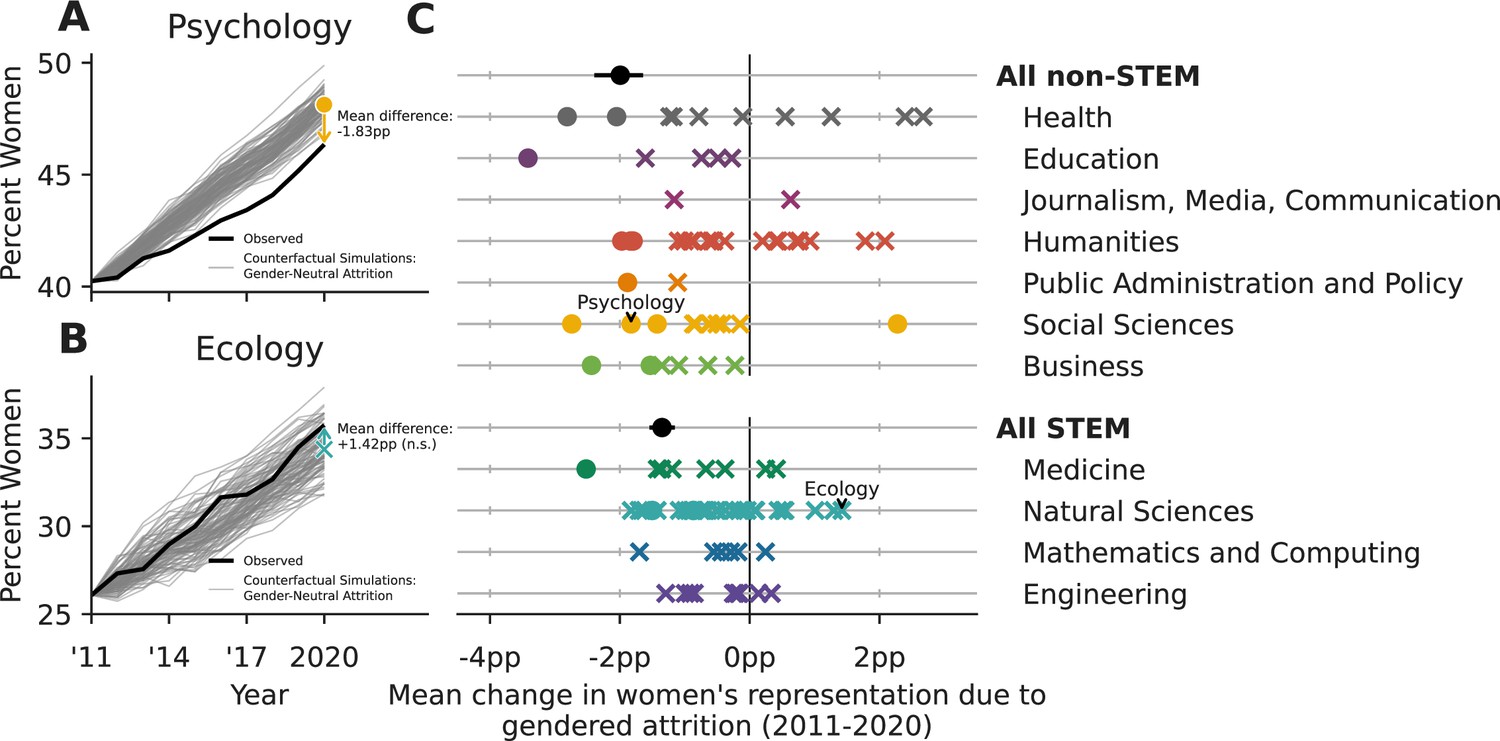
Gendered faculty attrition has caused a differential loss of women faculty in both Science, Technology, Engineering, and Mathematics (STEM) and non-STEM fields.
(A) Gendered attrition in psychology has caused a loss of () of women’s representation between 2011 and 2020, relative to a counterfactual model with gender-neutral attrition (see Methods section, Model of faculty hiring an attrition). In contrast, (B) gendered attrition in Ecology has not caused a statistically significant loss (, ). Relative to their field-specific counterfactual simulations, 15 academic fields and the STEM and non-STEM aggregations exhibit significant losses of women faculty due to gendered attrition (circles on C; two-sided test for significance relative to the gender-neutral null distribution derived from simulation, ). The differences in the remaining 95 fields were not statistically significant (crosses on C), but we note that their lack of significance is likely partly attributable to their smaller sample sizes at the field-level compared to the all STEM and all non-STEM aggregations, which exhibited large and significant differences. Error bars for the non-STEM and STEM aggregations contain 95% of stochastic simulations. No bars are included for field-level points to preserve readability.
Figure 3
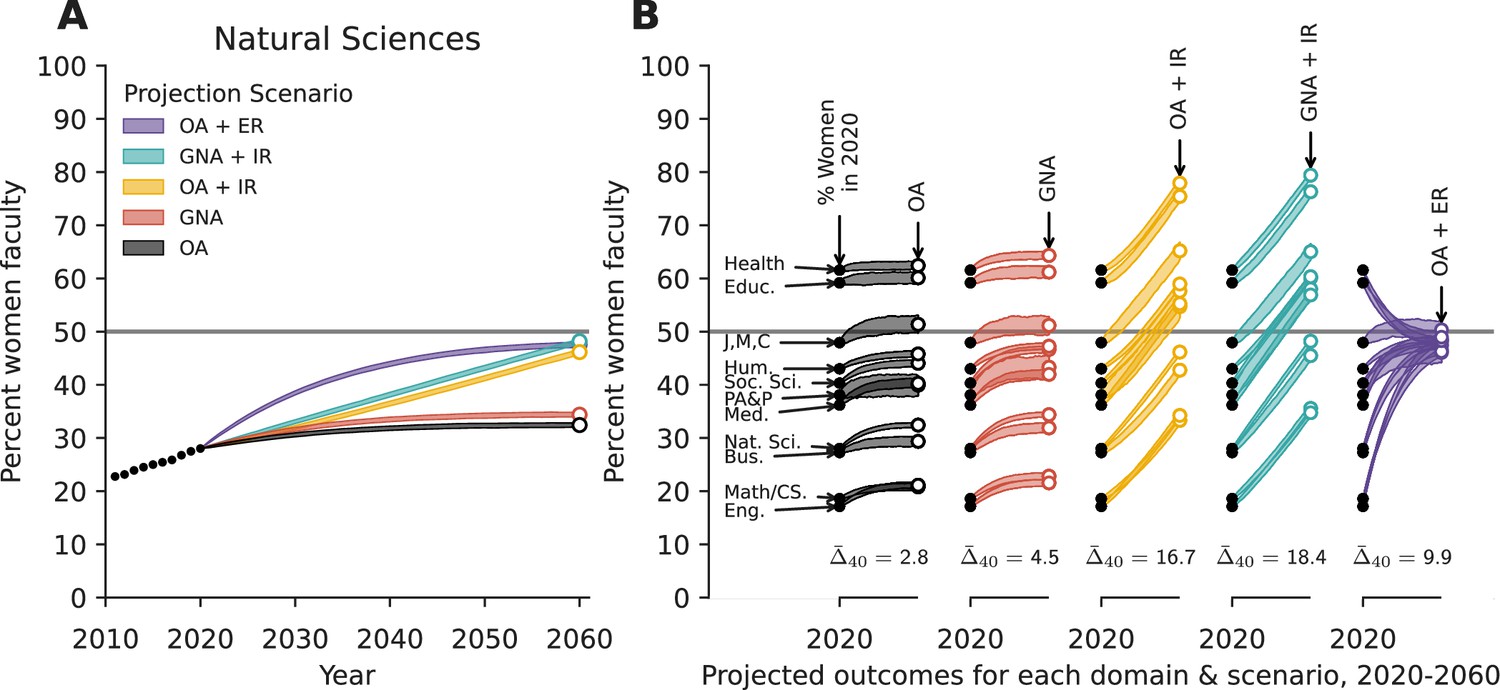
Projecting women’s representation under five policy scenarios.
(A) Observed (dotted line, 2011–2020) and projected (solid lines, 2021–2060) faculty gender diversity for Natural Sciences over time and (B) projections for 11 academic domains over 40 years under five policy scenarios. Line widths span the middle 95% of simulations and gives the mean change in women’s representation across domains over the 40-year period. Educ.=Education, J,M,C=Journalism, Media and Communications, Hum.=Humanities, Soc. Sci.=Social Sciences, and PA&P=Public Administration and Policy., Med.=Medicine, Nat. Sci.=Natural Sciences, Bus.=Business, Eng.=Engineering. See text for scenario explanations. OA = observed attrition, GNA = gender-neutral attrition, IR = increasing representation of women among hires ( each year), ER = equal representation of women and men among hires.
Appendix 1—figure 1
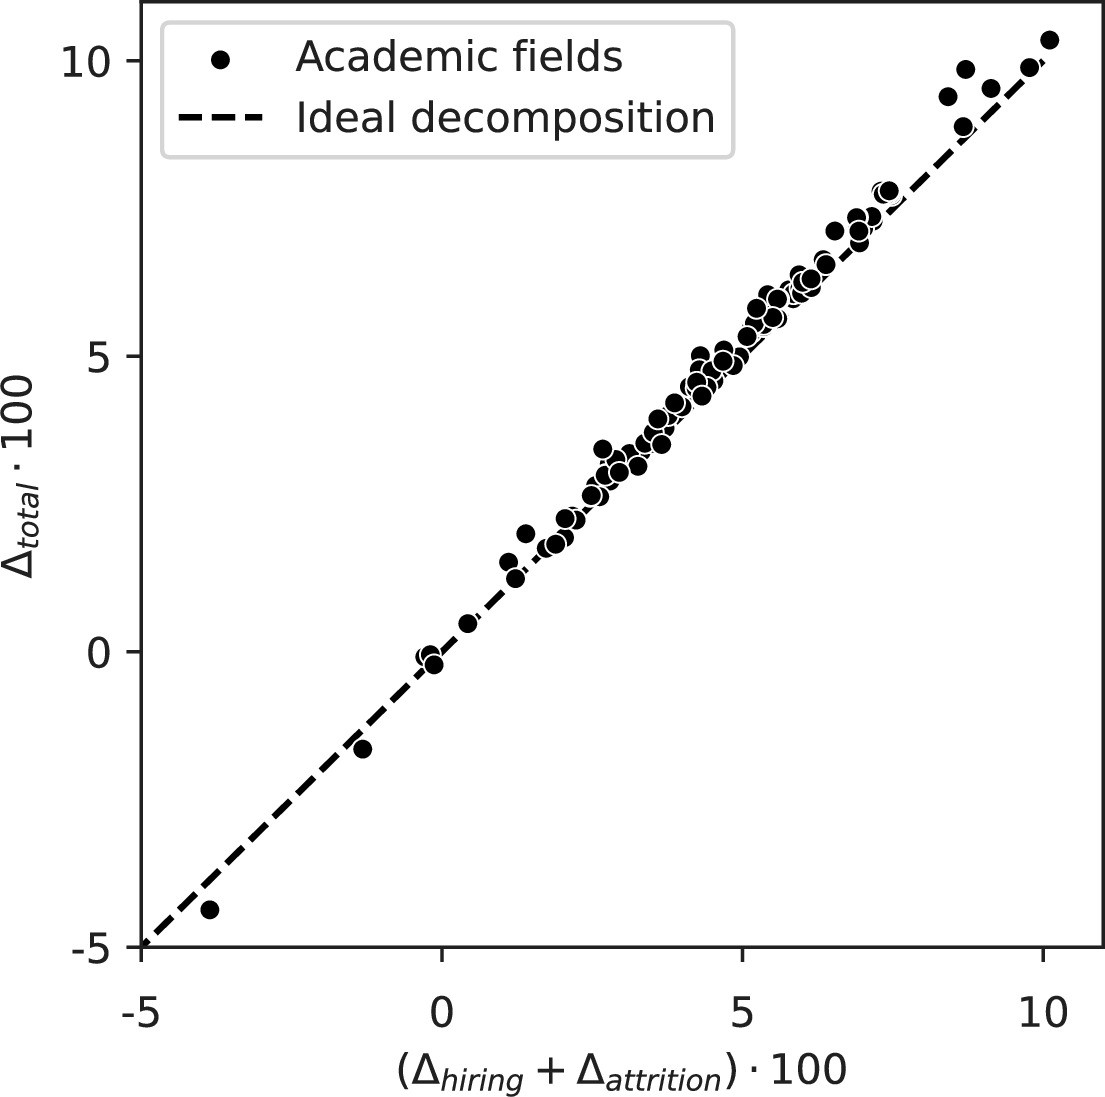
The change in gender diversity between 2011 and 2020 can be approximately decomposed into parts due to hiring and attrition for each academic field, but there is a leftover residual term.
In practice, we find that the residual term tends to be very small, such that the decomposition is nearly ideal. The dotted line represents an ideal decomposition, where the change in women’s representation among faculty due to hiring and attrition perfectly matches the total observed change.
Appendix 1—figure 2
Model validation: Differences between observed gender diversity outcomes and model-based outcomes.
(A) The mean outcomes of model-based simulations in psychology differ from the observed outcomes by , and (B) in Ecology by , but these differences are not statistically significant. (C) Gender diversity outcomes from model-based simulations of hiring and attrition are statistically indistinguishable from observed gender diversity outcomes for all 111 fields, and for Science, Technology, Engineering, and Mathematics (STEM) and non-STEM aggregations, based on a two-sided test for significance relative to the model-based null distribution derived from simulation, . Error bars for the non-STEM and STEM aggregations contain 95% of stochastic simulations. No bars are included for field-level points to preserve readability.
Appendix 1—figure 3
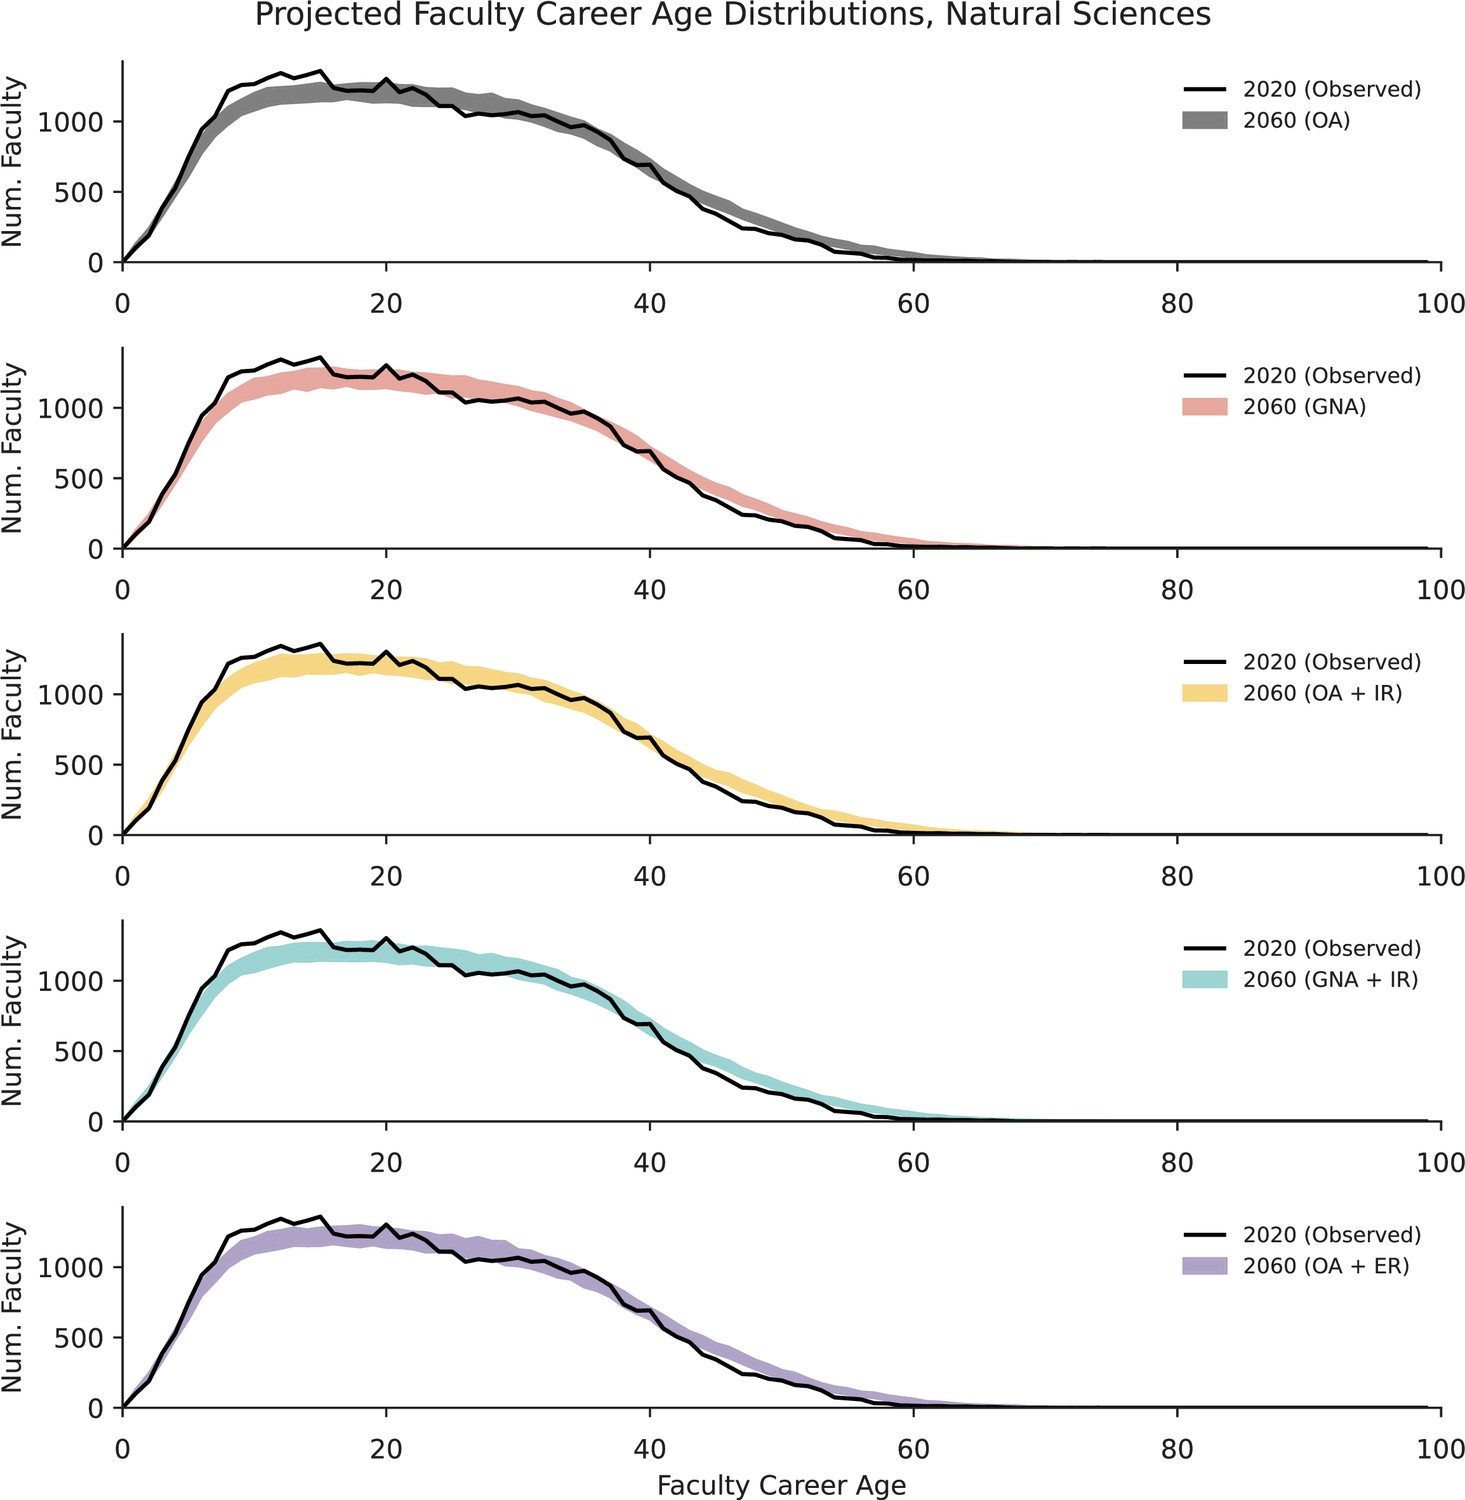
Model validation: Projected 2060 faculty career age distributions for Natural Sciences from Figure 3 are similar to the observed career age distribution for Natural Sciences in 2020, for each projection scenario.
Line widths for the simulated scenarios span the middle 95% of simulations. OA = observed attrition, GNA = gender-neutral attrition, IR = increasing representation of women among hires (+0.5 pp each year), ER = equal representation of women and men among hires.
Appendix 1—figure 4
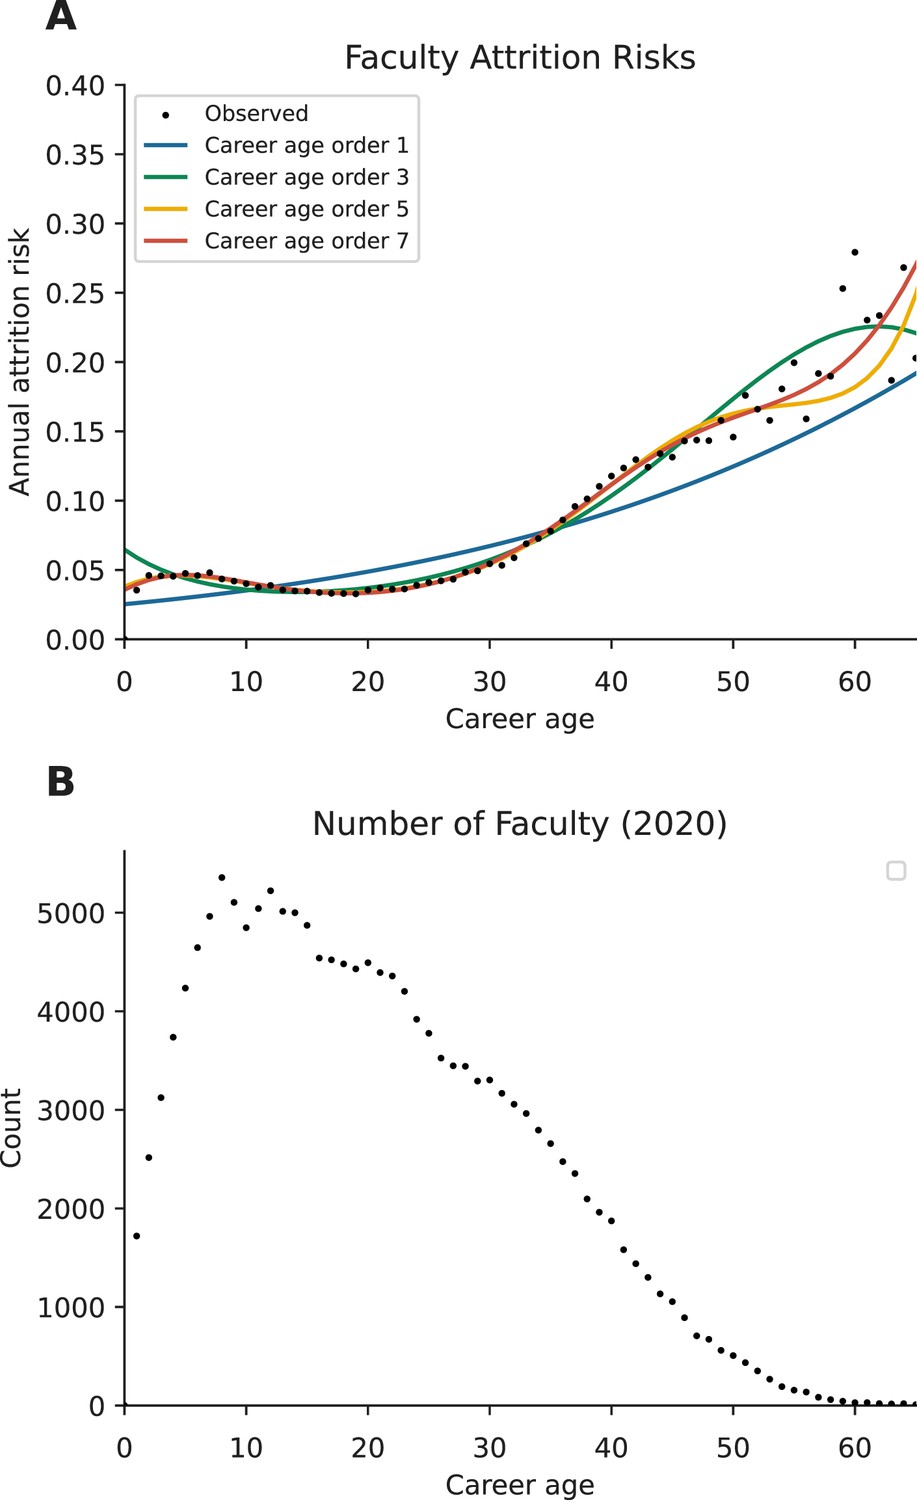
Model selection.
(A) Four logistic regression models fit to observed faculty attrition data. Each model includes career age up to a different power, e.g., the model labeled ‘Career age order 3’ includes career age up to its third power: where represents career age and represents year (see Methods section, Parameters for counterfactual model of 2011–2020, for details). The pattern in observed attrition risk becomes more noisy at higher career ages, because (B) there are relatively low numbers of faculty at the highest observed career ages.
Appendix 1—figure 5
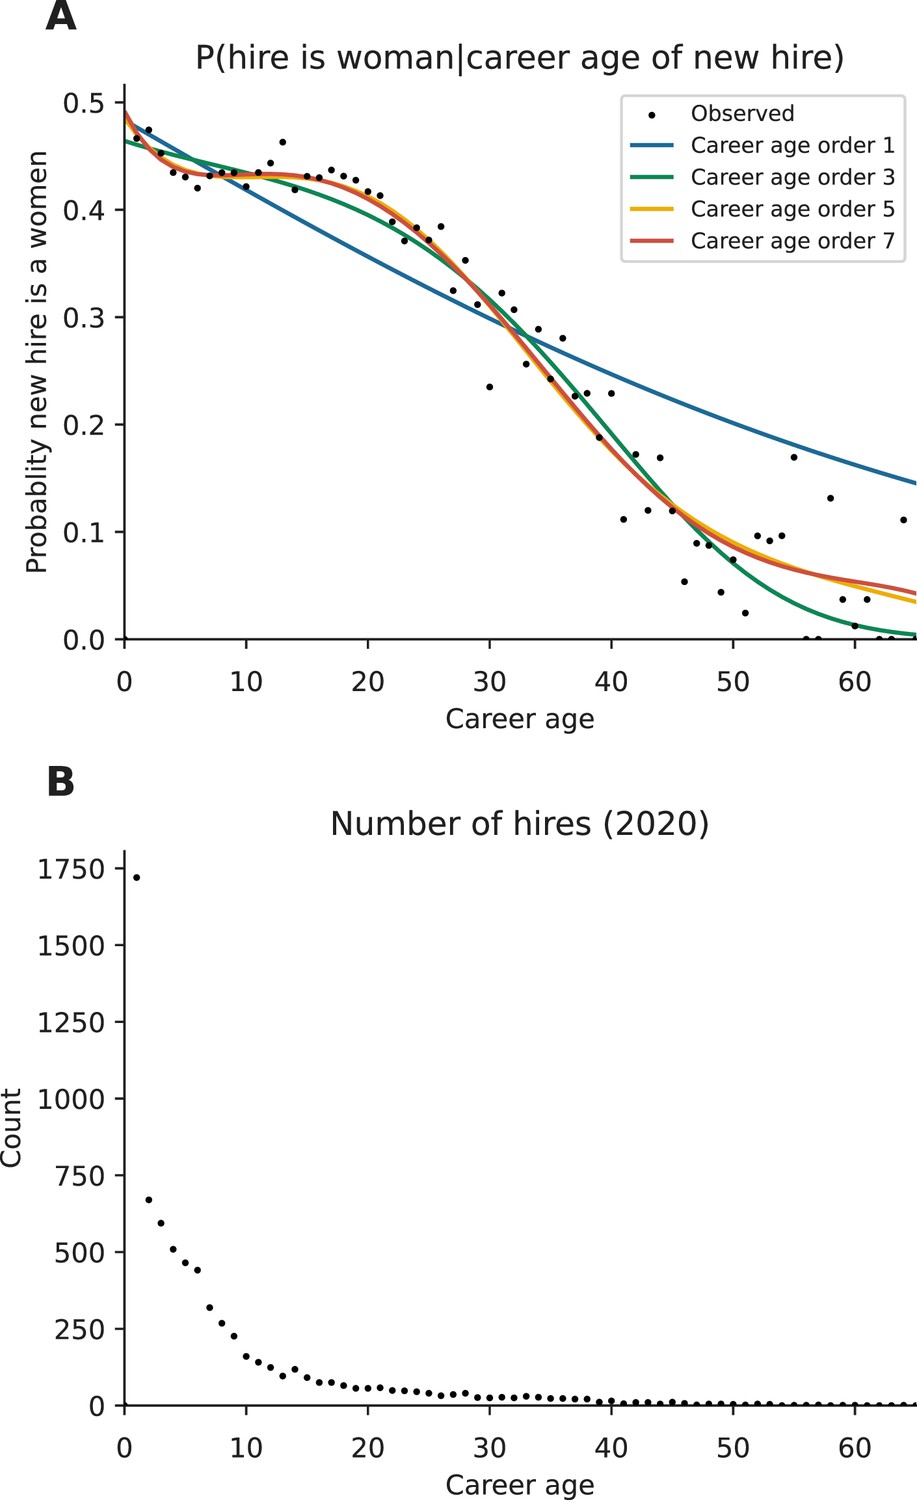
Model selection.
(A) Four logistic regression models fit to observed faculty hiring data, where the outcome variable is the gender of the faculty hire (1=woman, 0=man). Each model includes career age up to a different power, e.g., the model labeled ‘Career age order 3’ includes career age up to its third power: where represents career age and represents year (see Methods section, Parameters for counterfactual model of 2011–2020, for details). The pattern in the gender representation among new faculty hires becomes more noisy at higher career ages, because (B) there are relatively low numbers of faculty hired at higher career ages.
Appendix 1—figure 6
Sensitivity analysis: Replicating the counterfactual analysis from Results section, Quantifying the impact of gendered attrition using career age up to its third power in the associated logistic regressions model, instead of the fifth power (see Appendix 1 section, Model validation and sensitivity analysis, for details).
Findings under this parameterization are qualitatively very similar to those presented in Figure 2, indicating that the results are robust to modest changes to model parameterization.
Appendix 1—figure 7
Fraction of women among tenure-track faculty hires over time at U.S. PhD-granting institutions.
Women’s share of new hires is observed to increase at around annually (t-test, ), measured by an ordinary least squares regression fit (shown in purple).
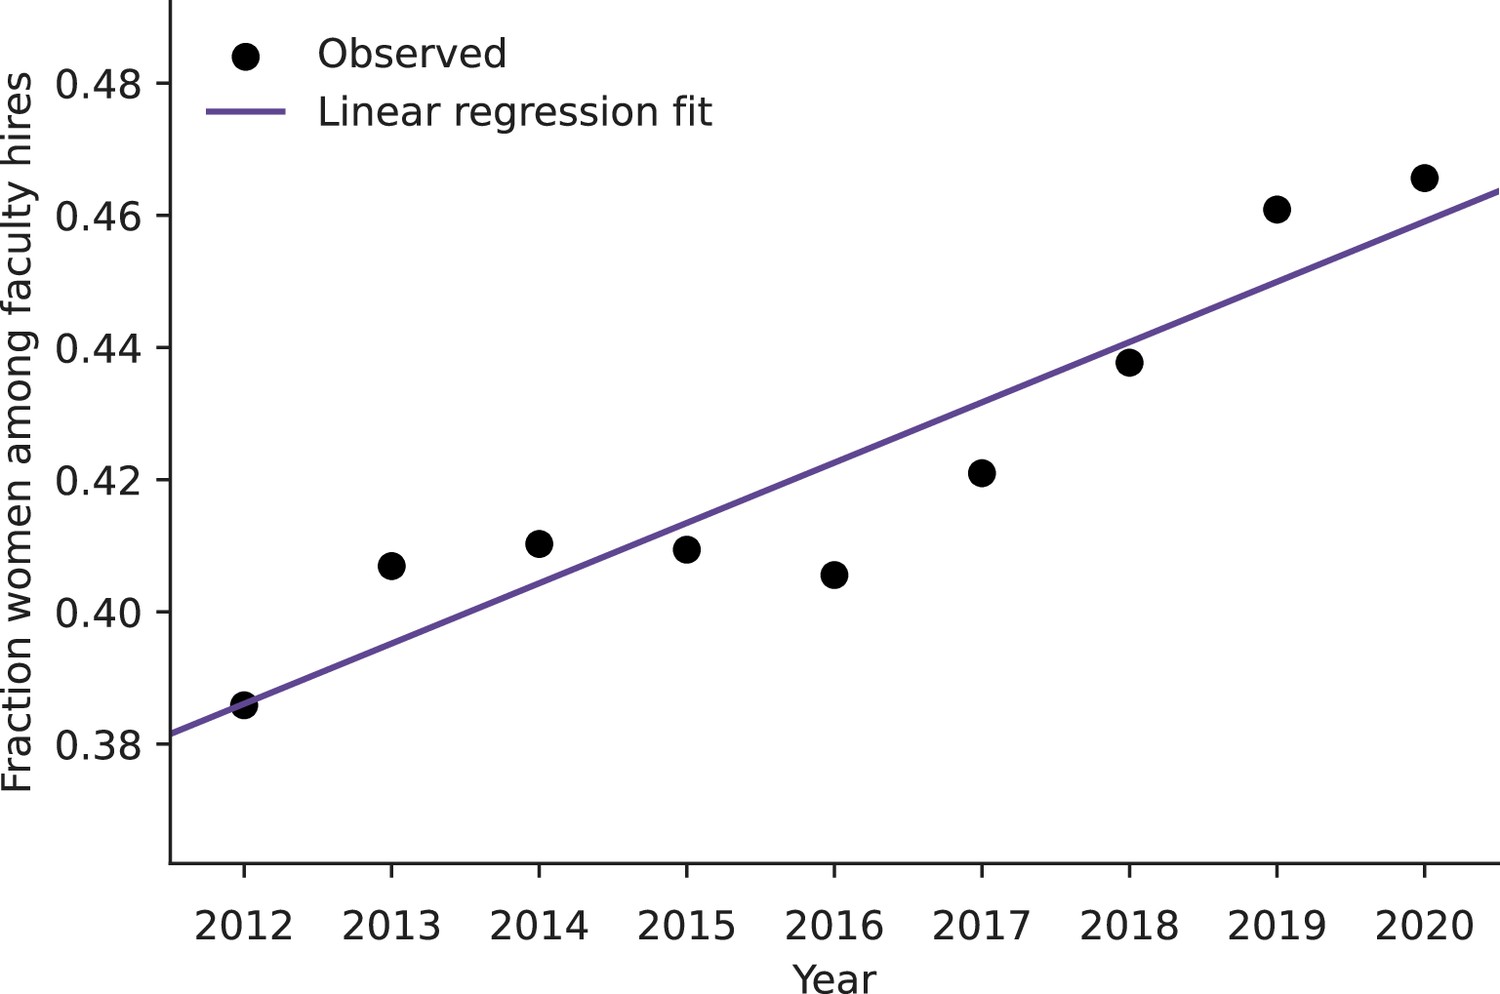
Appendix 1—figure 8
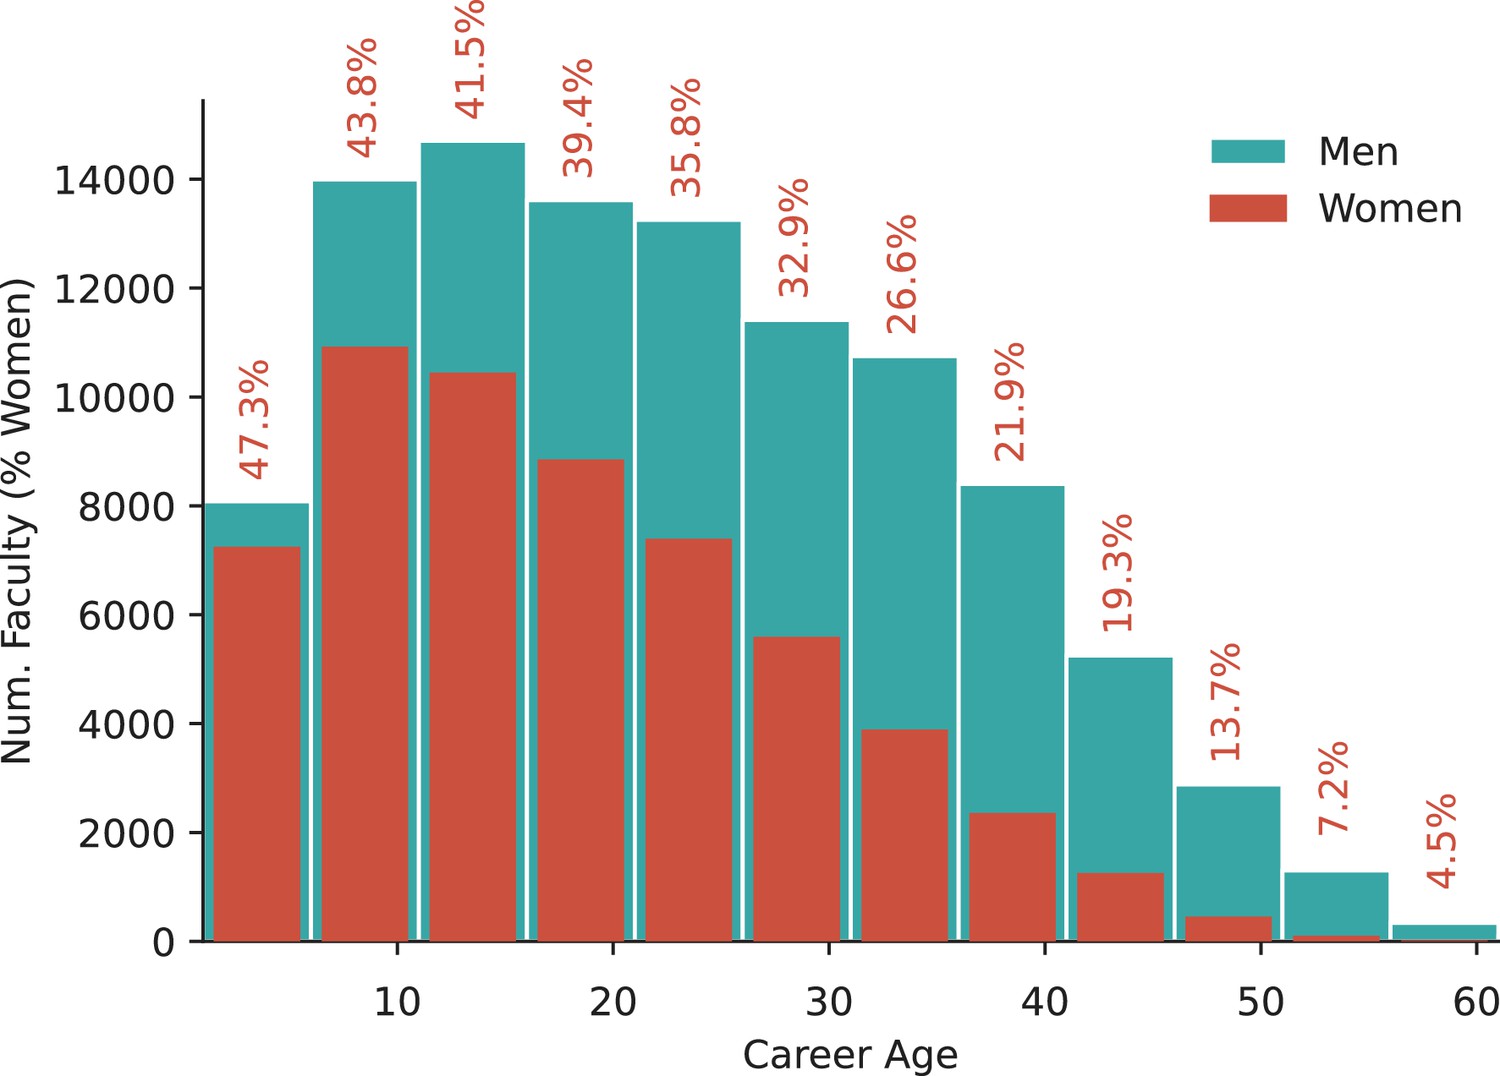
Career age distribution of women (red) and men (blue) tenured and tenure-track faculty across all academic fields.
Career age is measured as the number of years since earning a PhD. There are substantially more men faculty with high career ages than women faculty.
Tables
Appendix 1—table 1
Trends in women’s representation among new hires from 2012 to 2020 for 11 academic domains, along with academia overall.
We use linear regression to measure the expected change in women’s concentration among new hires each year, and find that women’s representation has been increasing in 6 of the 11 domains over time, at rates ranging from 0.58 pp to 1.30 pp per year. The remaining 5 domains have not exhibited significant linear trends. Overall, the fraction of women among hires has been increasing in academia over time (Appendix 1—figure 7). These findings are qualitatively replicated using logistic regression, so we present the linear regression results here for enhanced interpretability.
| Academic domain | Estimated annual change (pp) | p |
|---|---|---|
| Mathematics and Computing | 0.25 | 0.095 |
| Social Sciences | 1.18† | 0.006 |
| Natural Sciences | 1.30‡ | 0.000 |
| Engineering | 0.95‡ | 0.000 |
| Health | 0.58* | 0.020 |
| Humanities | 1.18† | 0.002 |
| Public Administration and Policy | 0.22 | 0.717 |
| Business | 0.38 | 0.089 |
| Medicine | 0.98† | 0.009 |
| Journalism, Media and Communication | 0.49 | 0.173 |
| Education | 0.34 | 0.057 |
| Academia Overall | 0.91‡ | 0.000 |
-
*
p<0.05.
-
†
p<0.01.
-
‡
p<0.001.
Appendix 1—table 2
Changes in women’s representation through Hiring, Attrition, and Gendered Attrition in Academic Fields (2011–2020).
Observed changes in women’s representation resulting from hiring and attrition, expressed in percentage points (pp), based on data from Figure 1, and the estimated average change in women’s representation due to gendered attrition as depicted in Figure 2, accompanied by the 2.5 percentile and 97.5 percentiles of simulations in parentheses. The analysis covers 111 academic fields.
| Field | Observed | Observed | Est. |
|---|---|---|---|
| Health | |||
| Environmental Health Sciences | +6.65 | +3.46 | +2.40 (–1.03, +5.60) |
| Nursing | –4.34 | +0.48 | +0.55 (–0.59, +1.65) |
| Public Health | +4.48 | +0.71 | –0.11 (–1.89, +1.60) |
| Human Development and Family Sciences | +3.19 | –0.48 | –2.81 (–5.44, –0.25) |
| Speech and Hearing Sciences | +3.30 | +2.84 | +2.67 (–0.81, +6.31) |
| Exercise Science, Kinesiology, Rehab, Health | +6.26 | –1.96 | –2.05 (–3.63, –0.27) |
| Nutrition Sciences | +0.31 | +0.12 | –1.18 (–3.62, +1.37) |
| Communication Disorders and Sciences | +6.11 | +1.32 | +1.26 (–1.77, +4.99) |
| Health, Physical Education, Recreation | +2.40 | –0.35 | –0.78 (–4.34, +2.52) |
| Social Work | +4.73 | –0.04 | –1.23 (3.21, +0.60) |
| Education | |||
| Education | +1.55 | +1.07 | –0.28 (–2.21, +1.62) |
| Special Education | +3.64 | –2.24 | –3.41 (–3.41, –0.28) |
| Education Administration | +0.91 | +2.34 | –0.74 (–2.84, +1.51) |
| Counselor Education | +5.08 | +0.86 | –0.49 (–3.36, +2.49) |
| Curriculum and Instruction | +0.97 | +1.26 | –1.61 (–3.70, +0.22) |
| Journalism, Media and Communication | |||
| Communication | +3.43 | +0.20 | –1.16 (–3.01, +0.80) |
| Mass Communications and Media Studies | +4.30 | +1.22 | +0.63 (–1.61, +2.73) |
| Humanities | |||
| Theological Studies | +0.51 | +0.71 | –0.91 (–3.07, +1.02) |
| Asian Languages | –0.54 | +2.43 | +1.78 (–1.91, +5.32) |
| Slavic Languages and Literatures | +3.34 | +3.60 | +0.93 (–3.00, +5.18) |
| Classics and Classical Languages | +3.33 | +2.25 | +0.20 (–2.14, +2.69) |
| French Language and Literature | +0.50 | +1.23 | –0.38 (–3.69, +3.30) |
| Germanic Languages and Literatures | +3.72 | _3.23 | +2.08 (–1.44, +5.76) |
| Theatre Literature, History and Criticism | +0.79 | +2.87 | +0.40 (–4.04, +4.58) |
| Art History and Criticism | +2.18 | +2.67 | +0.44 (–1.85, +2.86) |
| Asian Studies | –1.17 | +1.04 | +0.72 (–2.84, +3.90) |
| History | +2.84 | +2.11 | –0.64 (–1.69, +0.44) |
| Urban and Regional Planning | +5.71 | +1.74 | –1.01 (–4.53, +2.34) |
| Linguistics | –0.15 | +2.19 | +0.44 (–2.12, +3.29) |
| English Language and Literature | +2.17 | +0.63 | –1.80 (–2.80, –0.80) |
| Near and Middle Eastern Languages and Cultures | +5.80 | –0.22 | –0.87 (–4.87, +3.41) |
| Music | +3.72 | –0.99 | –1.10 (–2.54, +2.54) |
| Philosophy | +5.03 | +0.04 | –1.84 (–3.37, –0.24) |
| Religious Studies | +2.68 | –0.22 | –1.97 (–4.28, +0.08) |
| Comparative Literature | +1.78 | +1.17 | –0.58 (–4.04, +2.40) |
| Spanish Language and Literature | +2.39 | +1.94 | –0.55 (–3.09, +1.98) |
| Architecture | +4.53 | +2.64 | +0.77 (–2.31, +3.72) |
| Public Administration and Policy | |||
| Public Policy | +5.16 | –0.88 | –1.88 (–3.85, +0.23) |
| Public Administration | +6.49 | +0.82 | –1.11 (–3.71, +1.62) |
| Social Sciences | |||
| Sociology | +3.99 | +1.51 | –1.43 (–2.92, +0.03) |
| Gender Studies | –2.71 | +1.40 | +2.28 (–0.56, +5.25) |
| Anthropology | +3.68 | +2.30 | –0.42 (–1.94, +1.31) |
| Political Science | +4.35 | +1.00 | –0.15 (–1.41, +0.98) |
| International Affairs | +6.99 | –1.58 | –2.74 (–5.31, –0.33) |
| Geography | +6.65 | +0.80 | –0.51 (–2.26, +1.82) |
| Psychology | +5.81 | –0.04 | –1.83 (–2.82, –0.74) |
| Agricultural Economics | +6.46 | +0.43 | –0.87 (–4.10, +1.76) |
| Educational Psychology | +3.51 | –0.73 | –0.84 (–3.75, +2.13) |
| Economics | +2.93 | +0.45 | –0.61 (–1.66, +0.50) |
| Criminal Justice and Criminology | +6.26 | +1.12 | –0.63 (–3.47, +2.28) |
| Business | |||
| Accounting | +3.02 | +0.47 | –1.35 (–3.37, +0.61) |
| Marketing | +4.43 | +0.06 | –1.09 (–3.11, +0.99) |
| Management Information Systems | +3.61 | –2.50 | –2.44 (–4.61, –0.10) |
| Finance | +3.13 | –0.01 | –0.64 (–2.26, +0.88) |
| Business Administration | +4.21 | –0.34 | –0.23 (–1.98, +1.67) |
| Management | +2.76 | –0.20 | –1.53 (–2.94, +0.17) |
| Medicine | |||
| Genetics | +4.31 | +1.04 | +0.25 (–2.77, +3.00) |
| Pharmaceutical Sciences | +6.88 | –0.34 | –1.42 (–3.78, +0.96) |
| Epidemiology | +3.95 | +0.29 | –0.67 (–3.04, +1.59) |
| Pharmacology | +2.91 | +0.61 | –0.38 (–2.19, +1.36) |
| Pharmacy | +10.25 | –1.54 | –1.36 (–4.17, +1.52) |
| Physiology | +5.21 | +0.26 | –1.19 (–3.05, +0.72) |
| Veterinary Medical Sciences | +10.34 | –1.92 | –2.52 (–4.31, –0.74) |
| Immunology | +3.80 | +2.23 | +0.41 (–1.55, +2.35) |
| Natural Sciences | |||
| Entomology | +6.49 | +0.85 | –1.42 (–4.55, +1.21) |
| Soil Science | +4.64 | +2.10 | +0.52 (–2.46, +3.38) |
| Anatomy | +6.05 | –0.82 | –1.61 (–4.11, +0.84) |
| Natural Resources | +4.70 | +1.64 | +0.09 (–2.23, +2.49) |
| Plant Sciences | +4.74 | +2.19 | +1.01 (–1.61, +3.68) |
| Plant Pathology | +4.88 | +1.51 | –1.70 (–4.92, +1.69) |
| Biophysics | +4.00 | –0.41 | –0.75 (–3.31, +1.71) |
| Food Science | +4.16 | +0.51 | –1.08 (–4.07, +2.03) |
| Pathology | +5.25 | –2.58 | –1.50 (–3.14, +0.04) |
| Horticulture | +2.60 | –0.12 | –1.66 (–5.07, +1.69) |
| Biostatistics | +3.58 | –0.69 | –0.68 (–3.49, +2.02) |
| Agronomy | +4.82 | +1.18 | –0.93 (–3.96, +1.68) |
| Animal Sciences | +7.46 | +1.74 | –0.51 (–2.68, +1.63) |
| Forestry and Forest Resources | +6.54 | +0.37 | –1.82 (–4.83, +0.71) |
| Geology | +5.93 | +1.54 | –0.38 (–1.85, +1.03) |
| Biological Sciences | +5.22 | +1.69 | –0.04 (–1.07, +0.92) |
| Physics | +2.32 | +1.00 | –0.25 (–1.00, +0.50) |
| Chemistry | +3.96 | +0.40 | –0.87 (–1.77, +0.02) |
| Biochemistry | +3.91 | +0.25 | –0.89 (–2.22, +0.40) |
| Chemical Engineering | +4.08 | +0.21 | –0.87 (–2.38, +0.63) |
| Environmental Sciences | +5.88 | +1.56 | –0.64 (–2.62, +1.16) |
| Atmospheric Sciences and Meteorology | +4.59 | +2.42 | +1.30 (–1.00, +3.30) |
| Biomedical Engineering | +4.29 | +2.08 | +0.44 (–1.38, +2.40) |
| Microbiology | +5.28 | +0.32 | –0.99 (–2.51, +0.59) |
| Cell Biology | +4.82 | +0.33 | –0.48 (2.06, +1.11) |
| Marine Sciences | +5.20 | +1.95 | –0.08 (–2.85, +2.44) |
| Astronomy | +2.89 | +1.52 | +0.08 (–1.22, +1.35) |
| Evolutionary Biology | +6.79 | +1.88 | +0.54 (–2.10, +3.21) |
| Ecology | +6.23 | +3.54 | +1.42 (–0.88, +3.92) |
| Neuroscience | +4.19 | –0.07 | –0.75 (–2.63, +1.02) |
| Molecular Biology | +3.40 | +0.83 | –0.16 (–1.83, +1.53) |
| Mathematics and Computing | |||
| Statistics | +2.89 | +1.64 | +0.24 (–1.43, +1.72) |
| Mathematics | +2.86 | +0,65 | –0.44 (–1.22, +0.41) |
| Computer Engineering | +2.66 | +0.23 | –0.18 (–1.08, +0.79) |
| Computer Science | +2.26 | –0.09 | –0.55 (–1.51, +0.32) |
| Information Technology | +0.88 | –1.17 | –0.29 (–2.68, +2.01) |
| Information Science | +0.81 | –1.00 | –1.70 (–4.20, +1.05) |
| Engineering | |||
| Mechanical Engineering | +3.39 | +0.60 | –0.18 (–1.09, +0.75) |
| Systems Engineering | +3.29 | +0.48 | –1.29 (–3.85, +1.15) |
| Aerospace Engineering | +2.53 | +1.18 | +0.33 (–1.27, +1.93) |
| Electrical Engineering | +2.18 | +0.46 | –0.22 (–1.11, +0.66) |
| Agricultural Engineering | +4.74 | +1.22 | –0.16 (–1.96, +1.44) |
| Operations Research | +2.53 | –0.39 | –0.99 (–3.44, +1.32) |
| Environmental Engineering | +4.94 | +0.91 | –0.91 (–2.30, +0.52) |
| Civil Engineering | +4.30 | +1.54 | –0.25 (–1.51, +1.07) |
| Materials Engineering | +4.68 | +0.46 | –0.85 (–2.76, +0.80) |
| Industrial Engineering | +1.86 | +1.66 | +0.14 (285, –2.25, +2.54) |
Appendix 1—table 3
Number of faculty by field and gender, 2020.
Estimated counts of women and men faculty based on 2020 faculty rosters and name-based gender inference (Van Buskirk et al., 2023).
| Field | Women | Men | Pct. women |
|---|---|---|---|
| Health | |||
| Environmental Health Sciences | 285 | 430 | 39.9 |
| Nursing | 3531 | 515 | 87.3 |
| Public Health | 1813 | 1555 | 53.3 |
| Human Development and Family Sciences | 765 | 486 | 61.2 |
| Speech and Hearing Sciences | 352 | 184 | 65.7 |
| Exercise Science, Kinesiology, Rehab, Health | 1612 | 1555 | 50.9 |
| Nutrition Sciences | 722 | 604 | 54.4 |
| Communication Disorders and Sciences | 450 | 215 | 67.7 |
| Health, Physical Education, Recreation | 356 | 427 | 45.5 |
| Social Work | 1308 | 696 | 65.3 |
| Education | |||
| Education | 1301 | 857 | 60.3 |
| Special Education | 452 | 277 | 62.0 |
| Education Administration | 986 | 840 | 54.0 |
| Counselor Education | 566 | 405 | 58.3 |
| Curriculum and Instruction | 1204 | 654 | 64.3 |
| Journalism, Media and Communication | |||
| Communication | 1054 | 1208 | 46.6 |
| Mass Communications and Media Studies | 947 | 1093 | 46.4 |
| Humanities | |||
| Theological Studies | 324 | 958 | 25.3 |
| Asian Languages | 189 | 257 | 42.4 |
| Slavic Languages and Literatures | 198 | 186 | 51.6 |
| Classics and Classical Languages | 513 | 596 | 46.3 |
| French Language and Literature | 291 | 253 | 53.5 |
| Germanic Languages and Literatures | 244 | 264 | 48.0 |
| Theatre Literature, History and Criticism | 574 | 615 | 48.3 |
| Art History and Criticism | 1006 | 912 | 52.5 |
| Asian Studies | 237 | 344 | 40.8 |
| History | 2071 | 3008 | 40.8 |
| Urban and Regional Planning | 335 | 506 | 39.8 |
| Linguistics | 404 | 467 | 46.4 |
| English Language and Literature | 2968 | 2018 | 50.4 |
| Near and Middle Eastern Languages and Cultures | 160 | 268 | 37.4 |
| Music | 1239 | 2747 | 31.1 |
| Philosophy | 788 | 1773 | 30.8 |
| Religious Studies | 446 | 900 | 33.1 |
| Comparative Literature | 354 | 364 | 49.3 |
| Spanish Language and Literature | 438 | 409 | 51.7 |
| Architecture | 606 | 1205 | 33.5 |
| Public Administration and Policy | |||
| Public Policy | 687 | 1146 | 37.5 |
| Public Administration | 446 | 645 | 40.9 |
| Social Sciences | |||
| Sociology | 1501 | 1483 | 50.3 |
| Gender Studies | 474 | 82 | 85.3 |
| Anthropology | 1305 | 1291 | 50.3 |
| Political Science | 1345 | 2702 | 33.2 |
| International Affairs | 426 | 851 | 33.4 |
| Geography | 482 | 933 | 34.1 |
| Psychology | 2826 | 3215 | 46.8 |
| Agricultural Economics | 171 | 532 | 24.3 |
| Educational Psychology | 555 | 463 | 54.5 |
| Economics | 804 | 3039 | 20.9 |
| Criminal Justice and Criminology | 466 | 588 | 44.2 |
| Business | |||
| Accounting | 536 | 1186 | 31.1 |
| Marketing | 516 | 1069 | 32.6 |
| Management Information Systems | 231 | 867 | 21.0 |
| Finance | 377 | 1503 | 20.1 |
| Business Administration | 546 | 1473 | 27.0 |
| Management | 880 | 2136 | 29.2 |
| Medicine | |||
| Genetics | 324 | 612 | 34.6 |
| Pharmaceutical Sciences | 444 | 912 | 32.7 |
| Epidemiology | 778 | 747 | 51.0 |
| Pharmacology | 512 | 1268 | 28.8 |
| Pharmacy | 567 | 639 | 47.0 |
| Physiology | 620 | 1446 | 30.0 |
| Veterinary Medical Sciences | 956 | 1281 | 42.7 |
| Immunology | 677 | 1303 | 34.2 |
| Natural Sciences | |||
| Entomology | 191 | 494 | 27.9 |
| Soil Science | 163 | 506 | 24.4 |
| Anatomy | 387 | 763 | 33.7 |
| Natural Resources | 340 | 877 | 27.9 |
| Plant Sciences | 250 | 656 | 27.6 |
| Plant Pathology | 166 | 446 | 27.1 |
| Biophysics | 223 | 689 | 24.5 |
| Food Science | 353 | 474 | 42.7 |
| Pathology | 1199 | 1868 | 39.1 |
| Horticulture | 117 | 394 | 22.9 |
| Biostatistics | 457 | 676 | 40.3 |
| Agronomy | 149 | 526 | 22.1 |
| Animal Sciences | 337 | 749 | 31.0 |
| Forestry and Forest Resources | 229 | 655 | 25.9 |
| Geology | 770 | 2098 | 26.8 |
| Biological Sciences | 1895 | 3656 | 34.1 |
| Physics | 800 | 4364 | 15.5 |
| Chemistry | 1024 | 3691 | 21.8 |
| Biochemistry | 1001 | 2884 | 25.8 |
| Chemical Engineering | 405 | 1692 | 19.3 |
| Environmental Sciences | 624 | 1416 | 30.6 |
| Atmospheric Sciences and Meteorology | 267 | 757 | 26.1 |
| Biomedical Engineering | 426 | 1284 | 24.9 |
| Microbiology | 884 | 1815 | 32.8 |
| Cell Biology | 844 | 1699 | 33.2 |
| Marine Sciences | 279 | 722 | 27.9 |
| Astronomy | 416 | 1937 | 17.7 |
| Evolutionary Biology | 293 | 521 | 36.0 |
| Ecology | 370 | 662 | 35.9 |
| Neuroscience | 721 | 1443 | 33.3 |
| Molecular Biology | 732 | 1669 | 30.5 |
| Mathematics and Computing | |||
| Statistics | 474 | 1598 | 22.9 |
| Mathematics | 1072 | 4688 | 18.6 |
| Computer Engineering | 584 | 3581 | 14.0 |
| Computer Science | 885 | 4291 | 17.1 |
| Information Technology | 211 | 759 | 21.8 |
| Information Science | 404 | 723 | 35.8 |
| Engineering | |||
| Mechanical Engineering | 562 | 3428 | 14.1 |
| Systems Engineering | 152 | 654 | 18.9 |
| Aerospace Engineering | 209 | 1364 | 13.3 |
| Electrical Engineering | 613 | 3914 | 13.5 |
| Agricultural Engineering | 378 | 1386 | 21.4 |
| Operations Research | 149 | 632 | 19.1 |
| Environmental Engineering | 517 | 1854 | 21.8 |
| Civil Engineering | 585 | 2217 | 20.9 |
| Materials Engineering | 340 | 1439 | 19.1 |
| Industrial Engineering | 212 | 838 | 20.2 |
Additional files
Download links
A two-part list of links to download the article, or parts of the article, in various formats.
Downloads (link to download the article as PDF)
Open citations (links to open the citations from this article in various online reference manager services)
Cite this article (links to download the citations from this article in formats compatible with various reference manager tools)
Gendered hiring and attrition on the path to parity for academic faculty
eLife 13:RP93755.
https://doi.org/10.7554/eLife.93755.3


