Olfactory ensheathing cells from adult female rats are hybrid glia that promote neural repair
- Department of Integrative Biology and Physiology, UCLA, United States
Figures
Figure 1
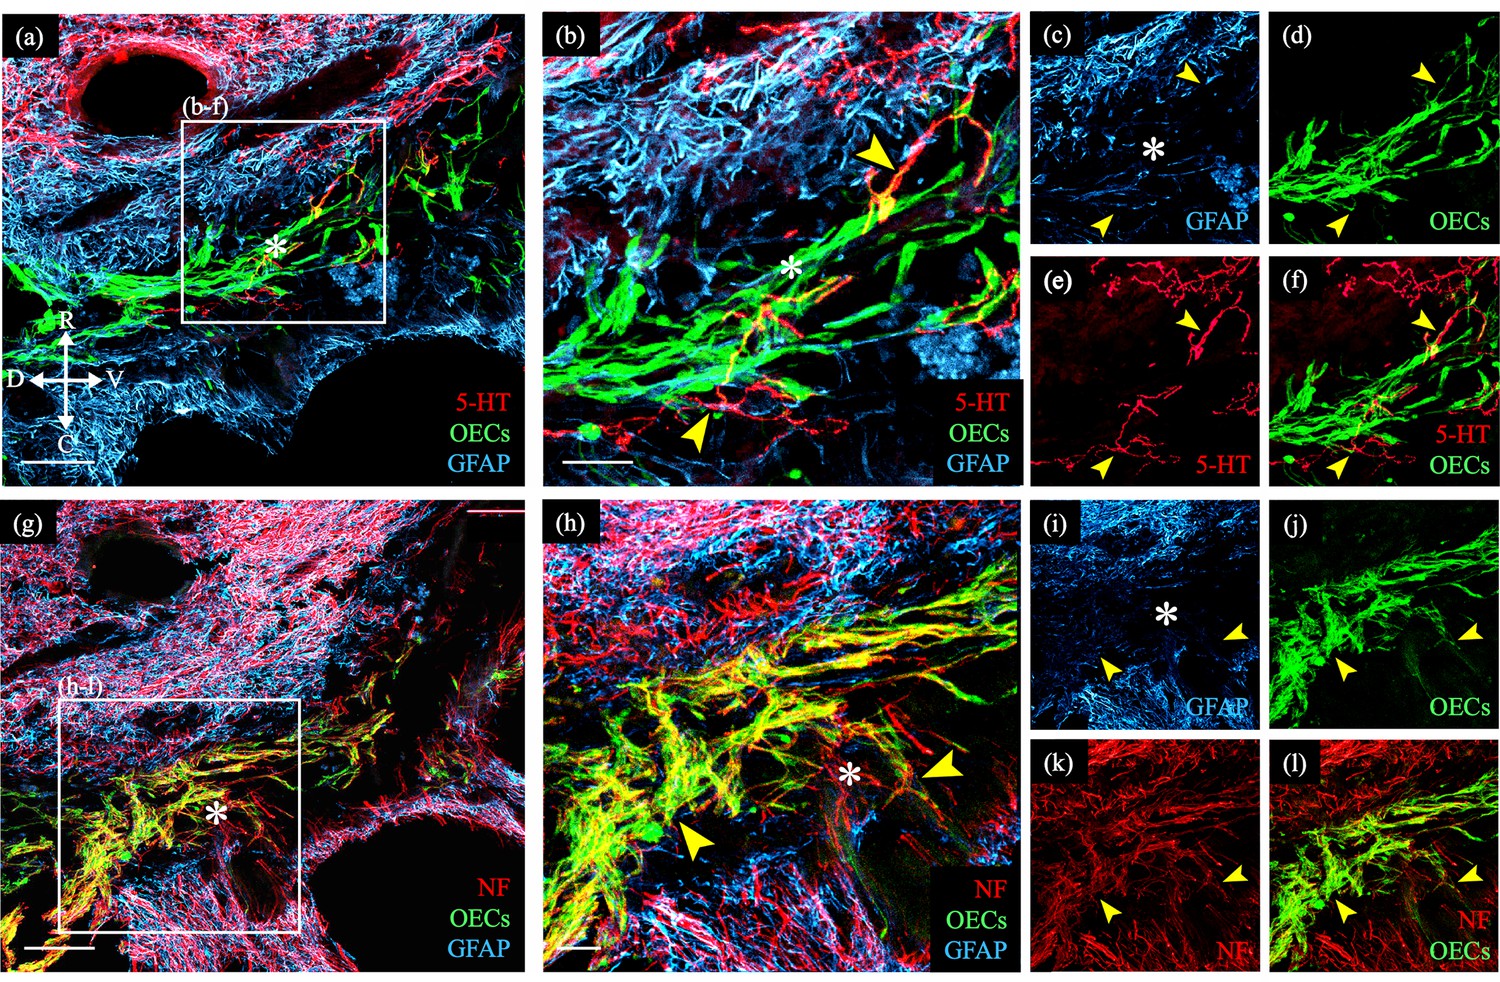
Transplanted GFP-OECs in the center of the lesion core associate with numerous axons.
Sagittal sections show rostral and caudal glial scar borders of the injury site which are identified with glial fibrillary acidic protein (GFAP, blue). The GFAP-negative lesion core contains GFP-OECs (green) and is marked with asterisks. Arrowheads mark axons crossing into the lesion core. (a–f) Serotonergic axons (5-HT, red) are found in the rostral spinal cord stump and associate with olfactory ensheathing cells (OECs) (green) in the lesion core. Single channels for GFAP (c), OECs (d), 5-HT (e), and a combination of 5-HT and OECs (f). (g–l) Nearby injury site section from the same rat (a). Numerous neurofilament-positive axons (white) are associated with the OECs (green) in the lesion core. Single channels for GFAP (i), OECs (j), neurofilament (k), and a combination of neurofilament and OECs (l). Bridge formation across the injury site was observed in 2 of 8 OEC-transplanted and 0 of 11 fibroblast- or media-transplanted, spinal cord transected rats. Combined with the 1/5 OEC-transplanted rats with axons crossing the injury and 0/5 fibroblast controls in our previous study (Thornton et al., 2018), we observed bridges in 3/13 OEC-transplanted rats versus 0/16 controls (p = 0.042, two-sample proportion test). Scale bars: a, g = 500 µm; b, h = 100 µm. Reprinted from Dixie, 2019, UCLA. ProQuest ID: Dixie_ucla_0031D_18445.
Figure 2 with 2 supplements
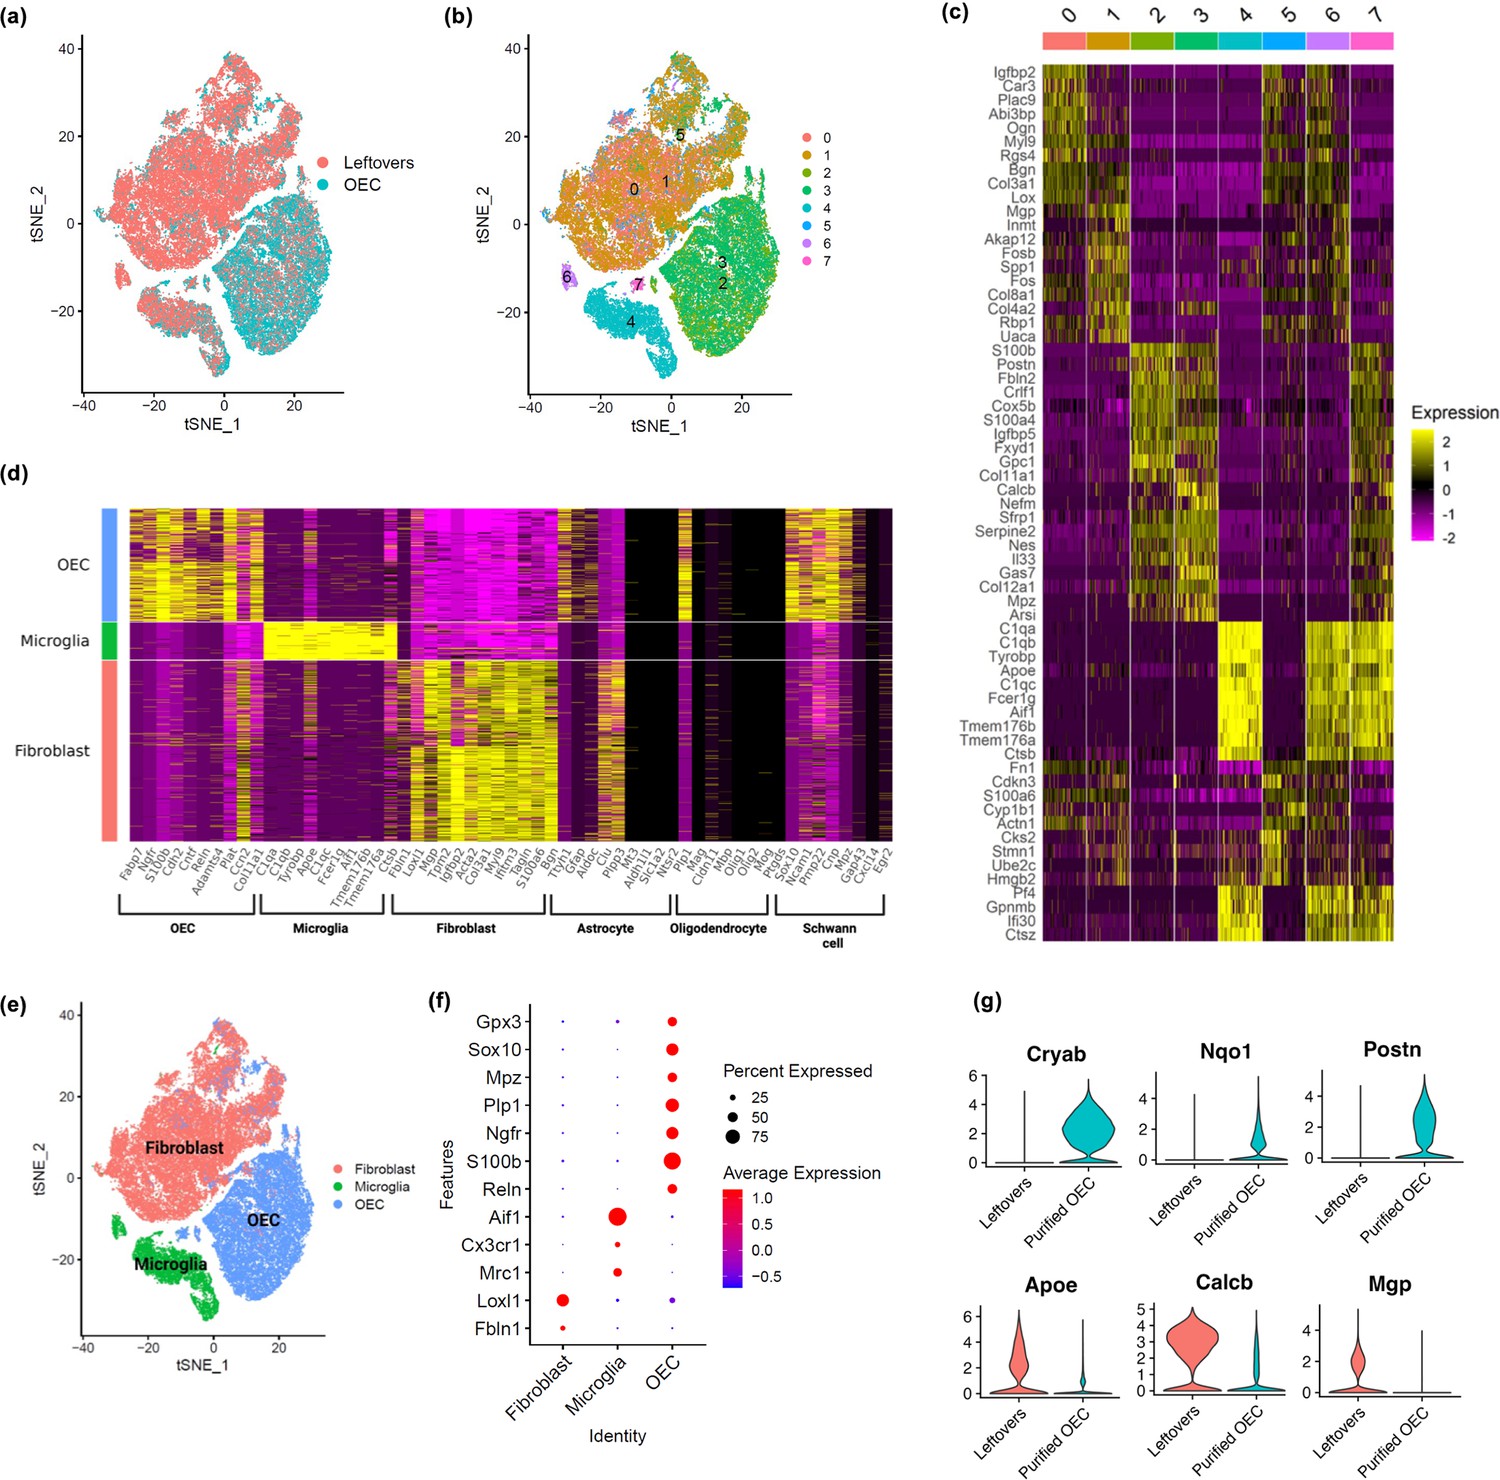
Single-cell RNA-sequencing (scRNA-seq) results show distinct clusters of olfactory ensheathing cells (OECs) and leftover cell samples.
(a) Cells in t-distributed stochastic neighbor embedding (tSNE) plot colored by sample source, with cells from leftover samples in pink and cells from immunopurified OECs in cyan. Quality control plots in Figure 2—figure supplement 2. (b) Clustering analysis revealed a total of eight distinct cell clusters (0-7), each indicated with a different color. (c) A heatmap showing expression patterns of top marker genes of the eight individual cell clusters. (d) Cell clusters showed distinct expression patterns for known cell type markers for fibroblasts, microglia, and OECs. Clusters 0, 1, and 5 had high expression of fibroblast markers and are labeled as fibroblast in the y-axis; clusters 4 and 6 showed high expression of microglia markers and are labeled as microglia; clusters 2, 3, and 7 showed high expression of OEC markers and are labeled as OEC. Known marker genes for different cell types are on the x-axis. Feature and violin plots for select marker genes are in Figure 2—figure supplement 1. (e) Based on known cell type markers, cell clusters in tSNE plot were labeled with the corresponding cell types. (f) The expression of cell-type-specific marker genes is depicted in a dot plot. (g) Genes that distinguish purified OECs versus OECs in leftover cultures are shown. The top 3 genes were higher in purified OECs, whereas the bottom 3 genes were higher in ‘leftover’ cultures.
Figure 2—figure supplement 1
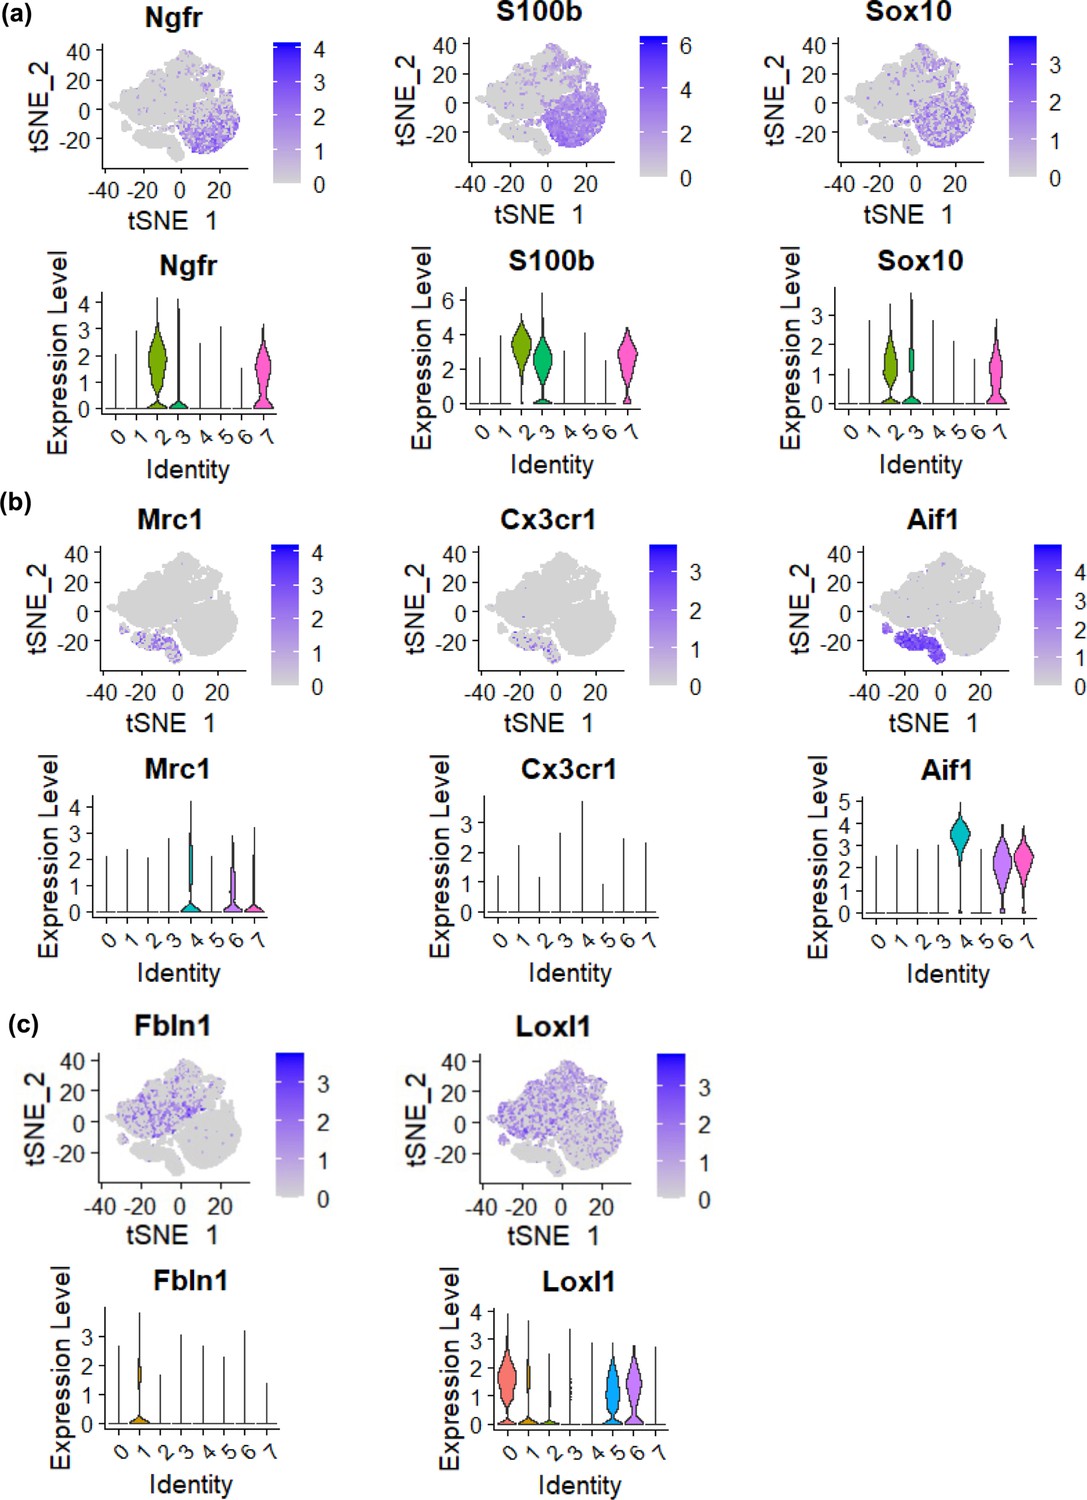
Marker genes were expressed specifically in different areas.
Marker genes characteristic of olfactory ensheathing cells (OECs) (a), microglia (b), and fibroblasts (c) are shown in their t-distributed stochastic neighbor embedding (tSNE) plots (top) and violin plots (bottom).
Figure 2—figure supplement 2
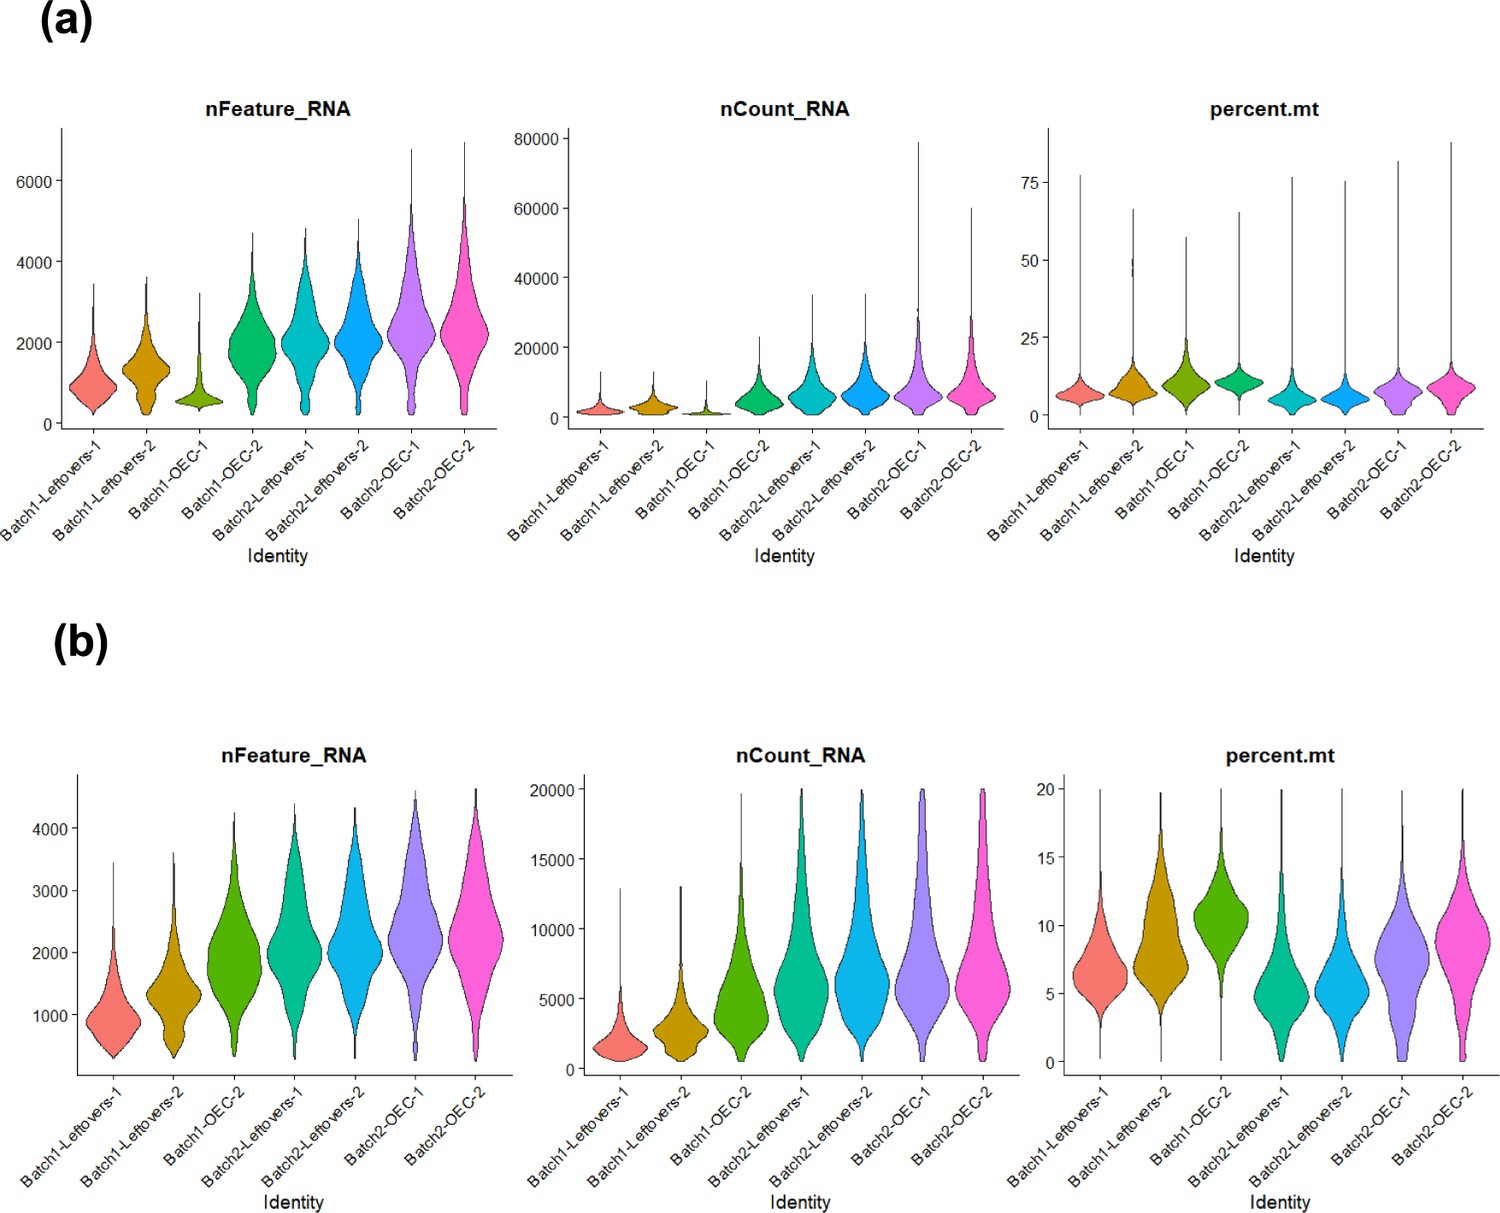
Violin plots for quality control associated with Figure 2a, b.
(a) Before quality control measurement. (b) After quality control measurement. nFeature_RNA indicates gene counts; nCount RNA indicates unique molecular identifier (UMI) counts; percent.mt indicates mitochondria content. Samples (x-axis) are labeled by concatenation of batch (1 or 2), type (olfactory ensheathing cell [OEC] or leftover), and sample ID.
Figure 3
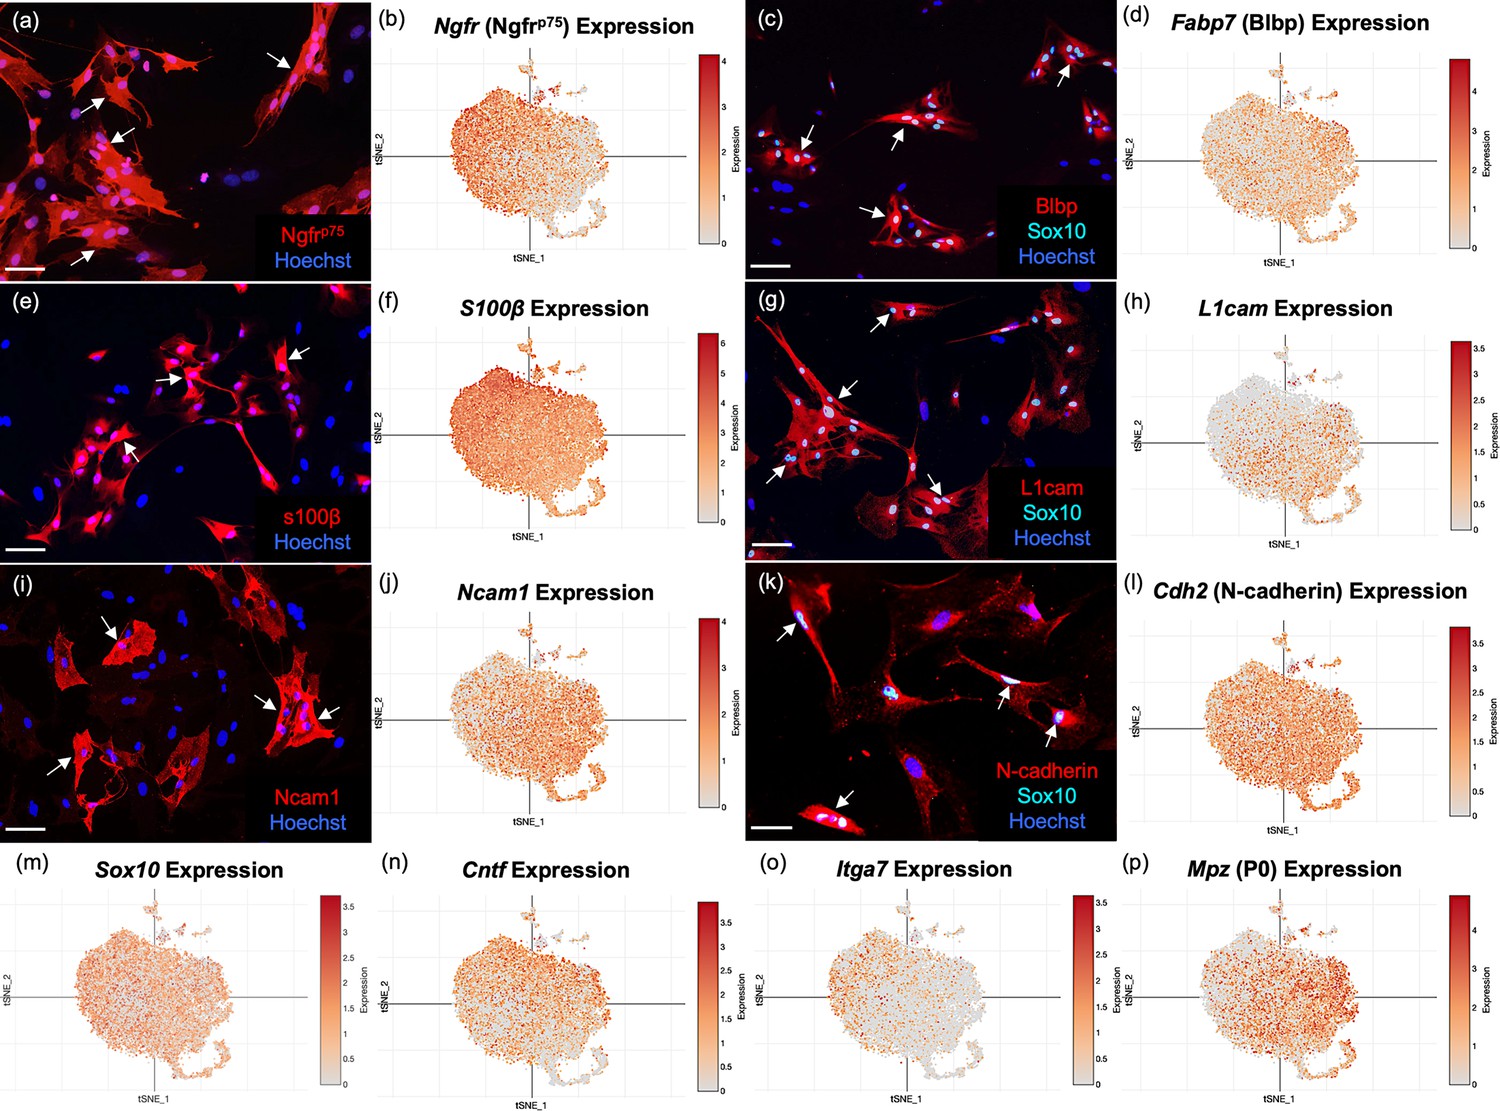
Well-established olfactory ensheathing cell (OEC) markers are revealed by single-cell RNA-sequencing (scRNA-seq) and immunofluorescence.
OEC cultures were replated from extra cells prepared for scRNA-seq. Immunolabeled OECs are marked with arrows and all cell nuclei are stained with Hoechst (blue nuclei). t-Distributed stochastic neighbor embedding (tSNE) maps of the gene expression in the five clusters are shown next to the protein expression in a–l. (a, b) Cultured OECs express Ngfrp75 protein and Ngfrp75 gene expression. (c, d) Blbp and Sox10 immunoreactive OECs with Fabp7 gene expression. (e, f) S100β-labeled OECs together with S100β expression. (g, h) L1cam and Sox 10 labeling next to L1cam expression. (i, j) Ncam1 protein and gene expression. (k, l) N-Cadherin and Sox10 markers with Cdh2 expression. (m–p) scRNA-seq data for Sox10, Cntf, Itga7, and Mpz (references in text). Scale bars: a, c, e, g, i, k = 50 µm.
Figure 4
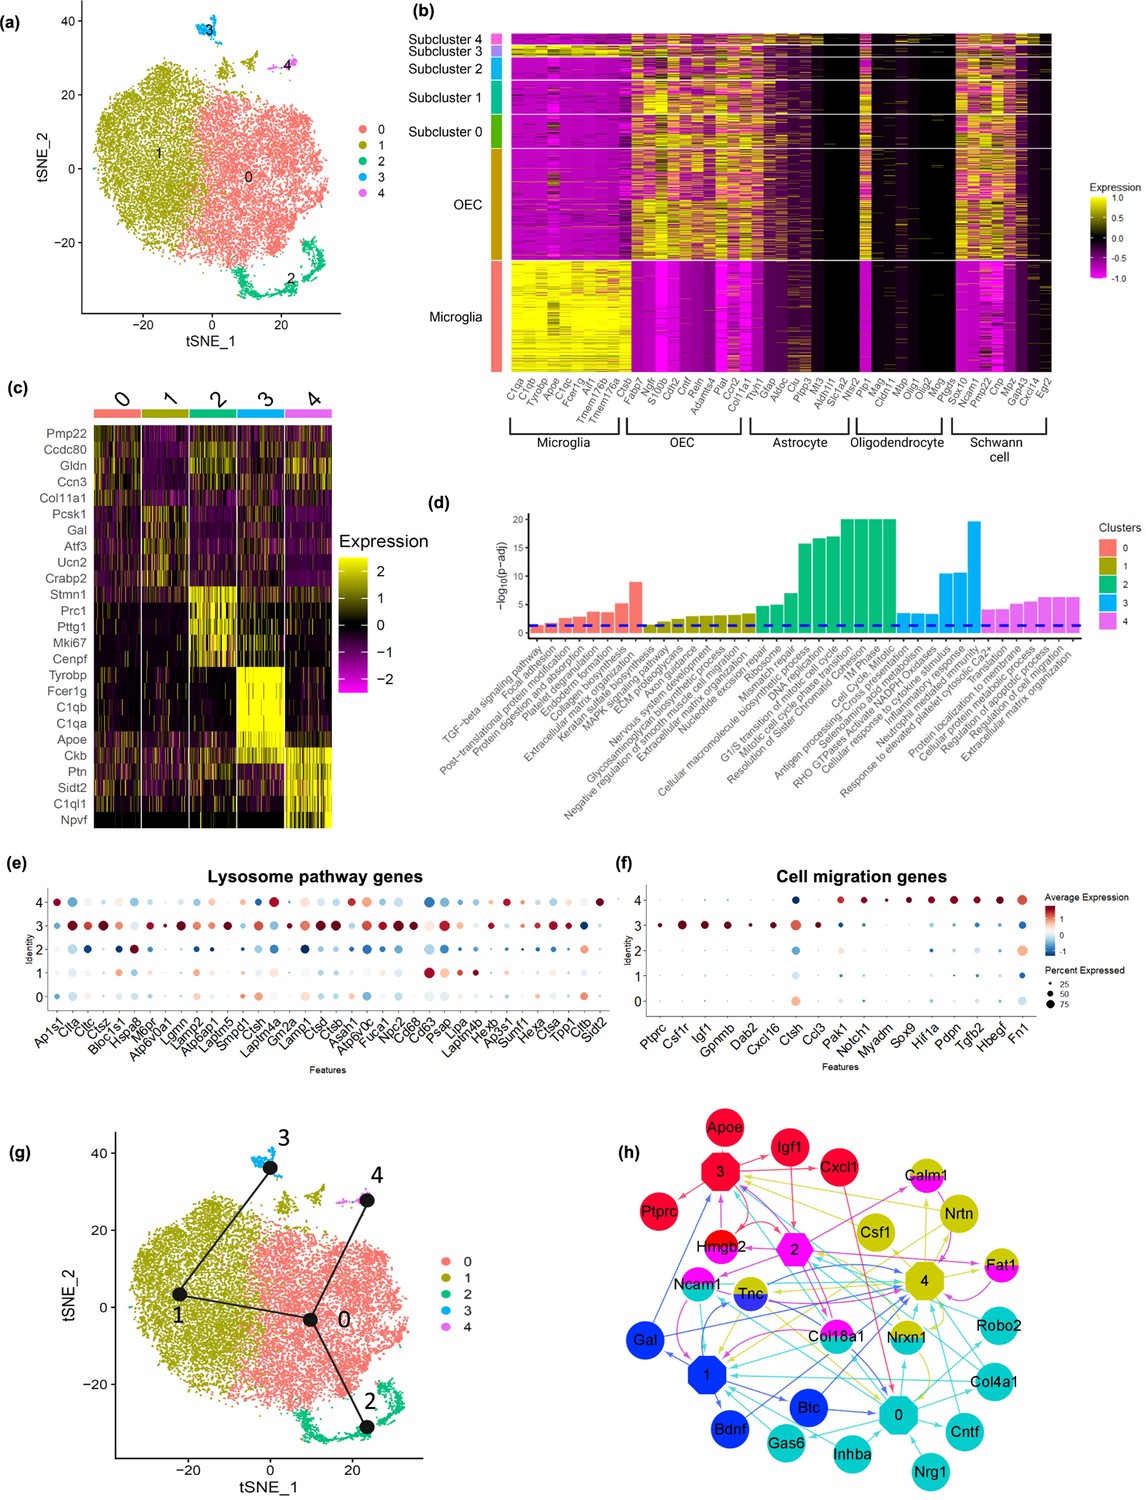
Olfactory ensheathing cell (OEC) subclusters, marker genes, and enriched pathways.
(a) Clustering analysis of OECs revealed five separate clusters (0–4). (b) Heatmap depicts the expression patterns of known marker genes of glial cell types (x-axis) versus microglia, all OECs and OEC subclusters (y-axis). OEC subclusters express select markers of other glial cell types. (c) Heatmap depicts the top 5 marker genes (y-axis) for each OEC subcluster (x-axis). (d) Pathways associated with marker genes of different OEC clusters are shown. The dashed line indicates the false discovery rate (FDR) <0.05 in the pathway analysis. (e) Dot plot showing that cluster 3 has higher potential lysosomal function based on lysosome pathway genes than the other clusters. (f) Both clusters 3 and 4 express select genes involved in positive regulation of cell migration. (g) Trajectory analysis reveals two trajectories, one including subclusters 2, 0, and 4, and another involving subclusters 2, 0, 1, and 3. (h) NicheNet ligand–receptor network plot demonstrates intracellular communication between OEC subtypes. Hexagons represent subclusters 0–4 and circles indicate ligands secreted from subclusters. Edges (arrows) point to clusters where receptors of the ligands are expressed. Different colors represent different OEC subclusters.
Figure 5
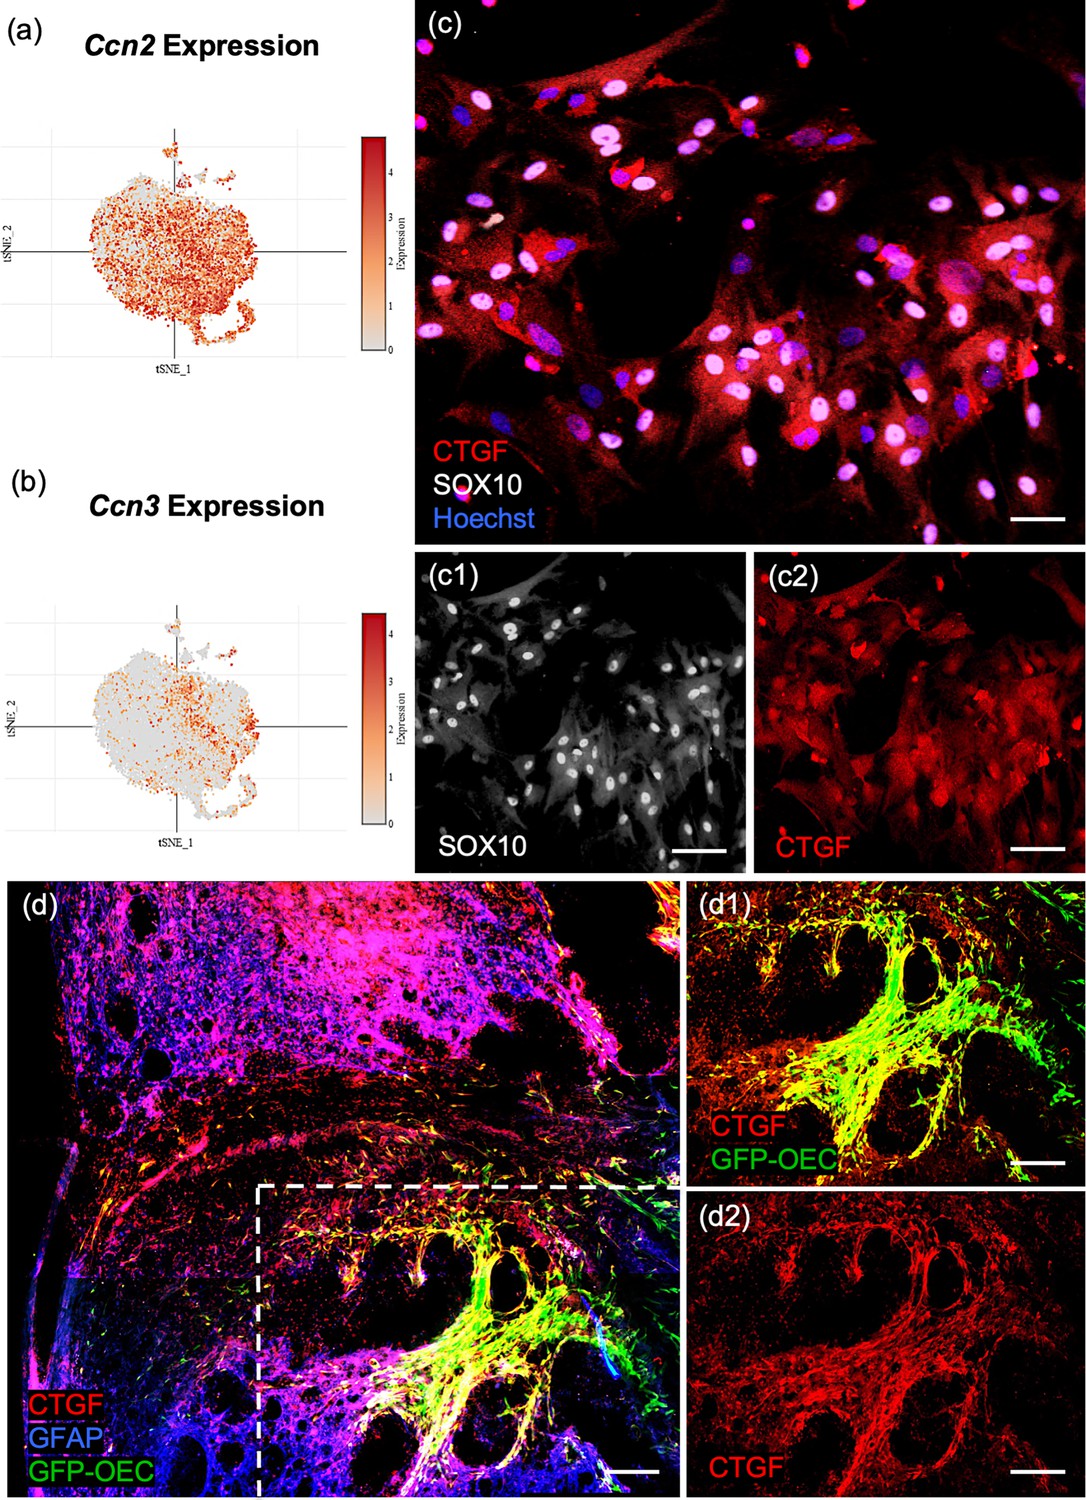
Confirmation of Ccn2/Ctgf (Connective tissue growth factor) in cultured olfactory ensheathing cells (OECs) and following OEC implantation after spinal cord injury.
(a, b) The single-cell RNA-sequencing (scRNA-seq) plots of the ninth (Ccn2/Ctgf) and fourth (Ccn3/Nov) highest ranked marker genes are strongly expressed in subcluster 0. (c, c1, c2) The well-known matricellular protein Connective tissue growth factor (Ctgf) identifies OECs in cell cultures (red, c, c2), and Sox10 nuclear expression (white nuclei, c, c1) confirms they are neural crest-derived cells. (d, d1, d2) A sagittal section from a rat that received a complete spinal cord transection followed by green fluorescent protein (GFP)-OEC implantation was fixed 2 weeks postinjury. Glial fibrotic acidic protein (d, Gfap, blue) marks the edges of the borders of the glial scar. GFP-OECs (green) that express Ctgf (red) in the injury site are outlined by the box in d. High expression of Ctgf is detected by GFP-OECs that bridge part of the injury site in d1. The single channel of Ctgf is shown in d2. Scale bars: c–c2 = 50 µm, d–d2 = 250 µm.
Figure 6
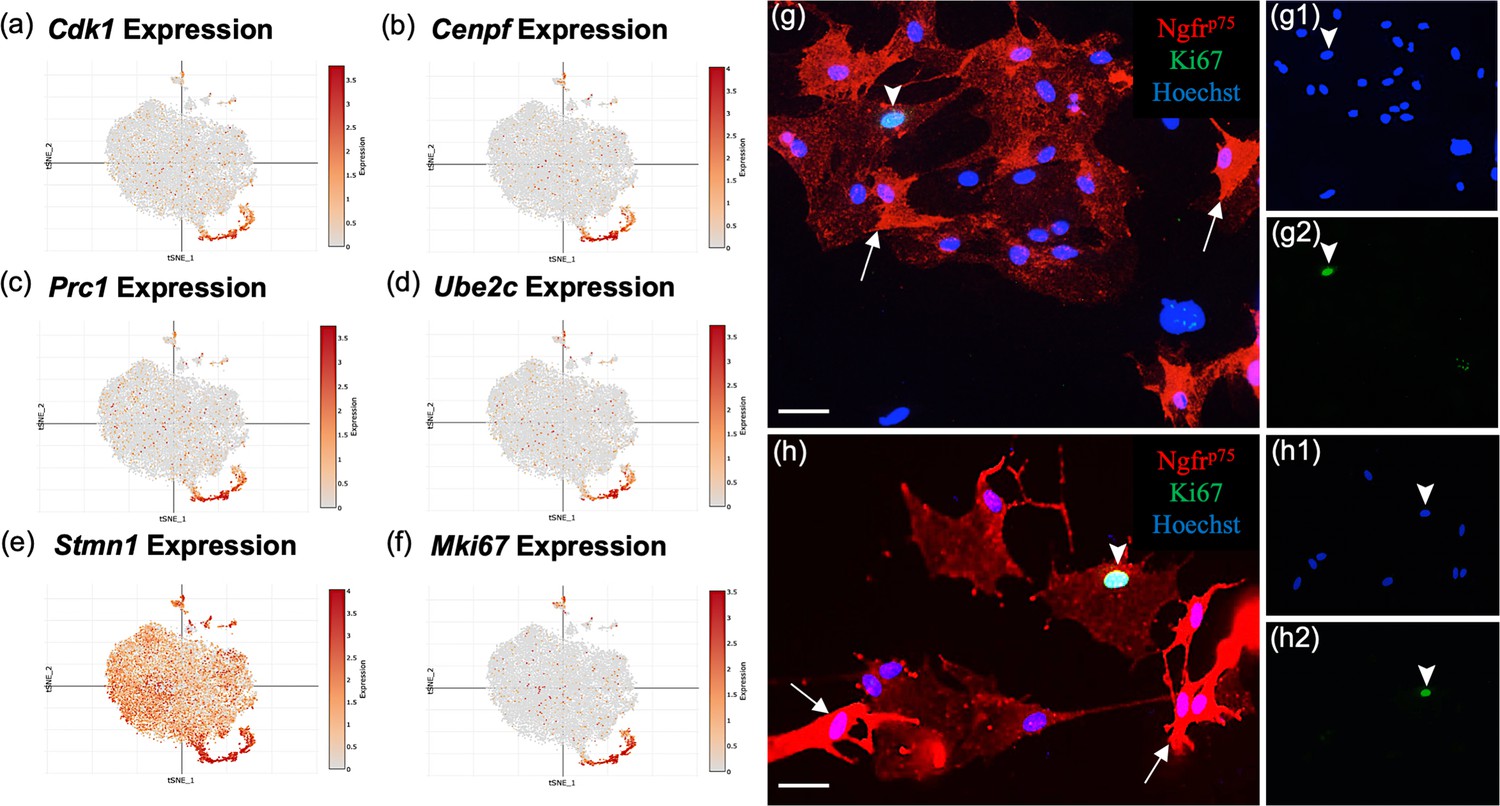
Subcluster 2 is characterized by cell cycle and proliferative markers.
(a–f) These single-cell RNA-sequencing (scRNA-seq) plots show high expression of cell proliferation markers in cluster 2, supporting their function as olfactory ensheathing cell (OEC) progenitor cells. Only Stmn1 (e, Stathmin, a microtubule destabilizing protein) is broadly expressed across all five clusters. (g–g2, h–h2) Most cultured OECs are spindle-shaped and have high Ngfrp75 expression (red, white arrows). Of the OEC progenitors that express Ki67, 76% ± 8 of them display low levels of Ngfrp75 immunoreactivity and a ‘flat’ morphology (g2, h2; green nuclei, arrowheads). The remainder of Ki67-expressing OECs express high levels of Ngfrp75 and are fusiform in shape (24% ± 8%, n = 4 cultures, Student’s t-test, p = 0.023). Hoechst marks all nuclei (g1, h1, blue nuclei, arrowheads). Scale bars: g, h = 50 μm.
Figure 7 with 1 supplement
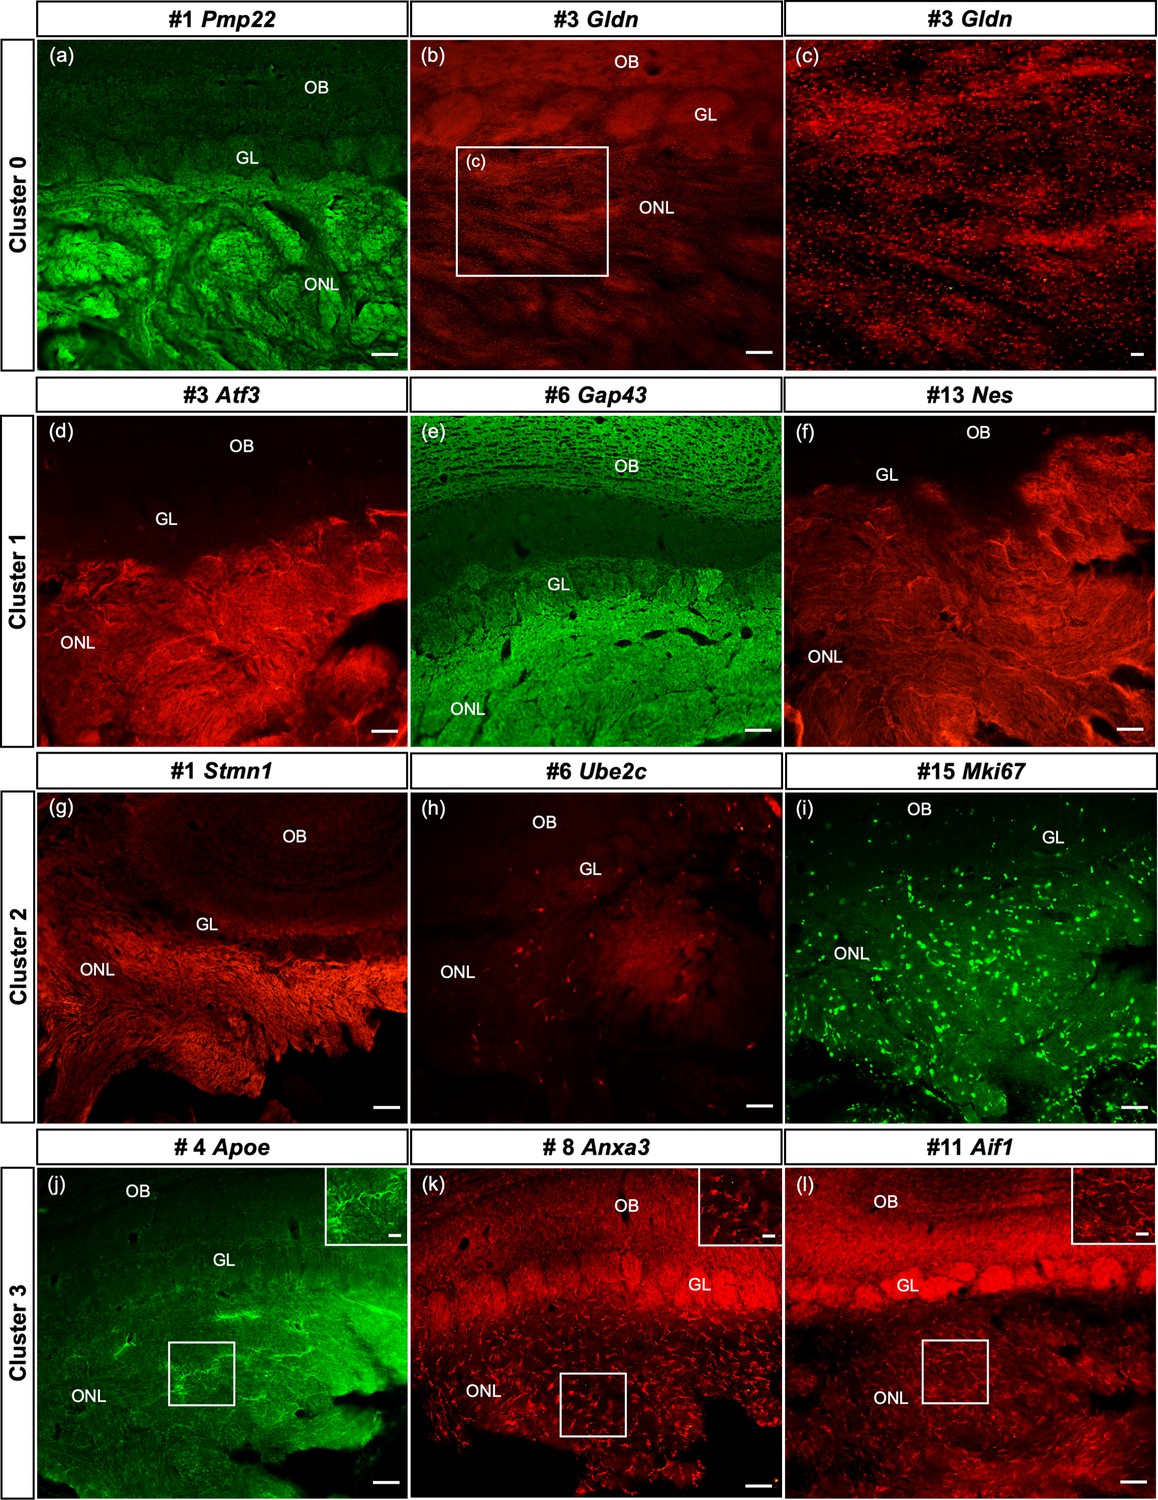
Spatial confirmation of the defined olfactory ensheathing cells (OECs) subclusters within the olfactory nerve layer (ONL).
The protein expression of a number of top 20 genes from this single-cell RNA-sequencing (scRNA-seq) study of purified OEC cultures is verified in olfactory bulb sections. In all images, the ONL (layer I) is at the bottom of the image, the glomeruli (GL, layer II) next, and the remainder of the olfactory bulb toward the top. Figure 7—figure supplement 1 illustrates the corresponding t-distributed stochastic neighbor embedding (tSNE) plots for each gene in the figure. (a–c) The top gene in the largest cluster, Peripheral myelin protein 22, is highly expressed throughout the ONL. Gliomedin, the third-ranked gene in cluster 0, is detected as small discrete dot-like structures overlaying the ONL (b, box enlarged in c). (d–f) OECs in cluster 1 are immunolabeled by antibodies against the axonal growth factor Atf3 (d) and the intermediate filament Nestin (f). High levels of Gap43 in the ONL (e) are due to expression by OECs and axons of immature olfactory sensory neurons. (g–i) Strong immunoreactivity of Stathmin-1 in the ONL reflects labeled axons from immature olfactory sensory neurons and OECs. Ube2c, a G2/M cell cycle regulator, is expressed in a small number of cells in the ONL, whereas Mki67-labeled cells are widespread. (j–l) The immune function of this cluster is confirmed by antibodies against Apoe (j), Anxa3 (k), and Aif1/Iba1 (l), markers expressed by microglia and macrophages. Scale bars: a, b, d–l = 50 µm; c, insets in j–l = 25 µm.
Figure 7—figure supplement 1
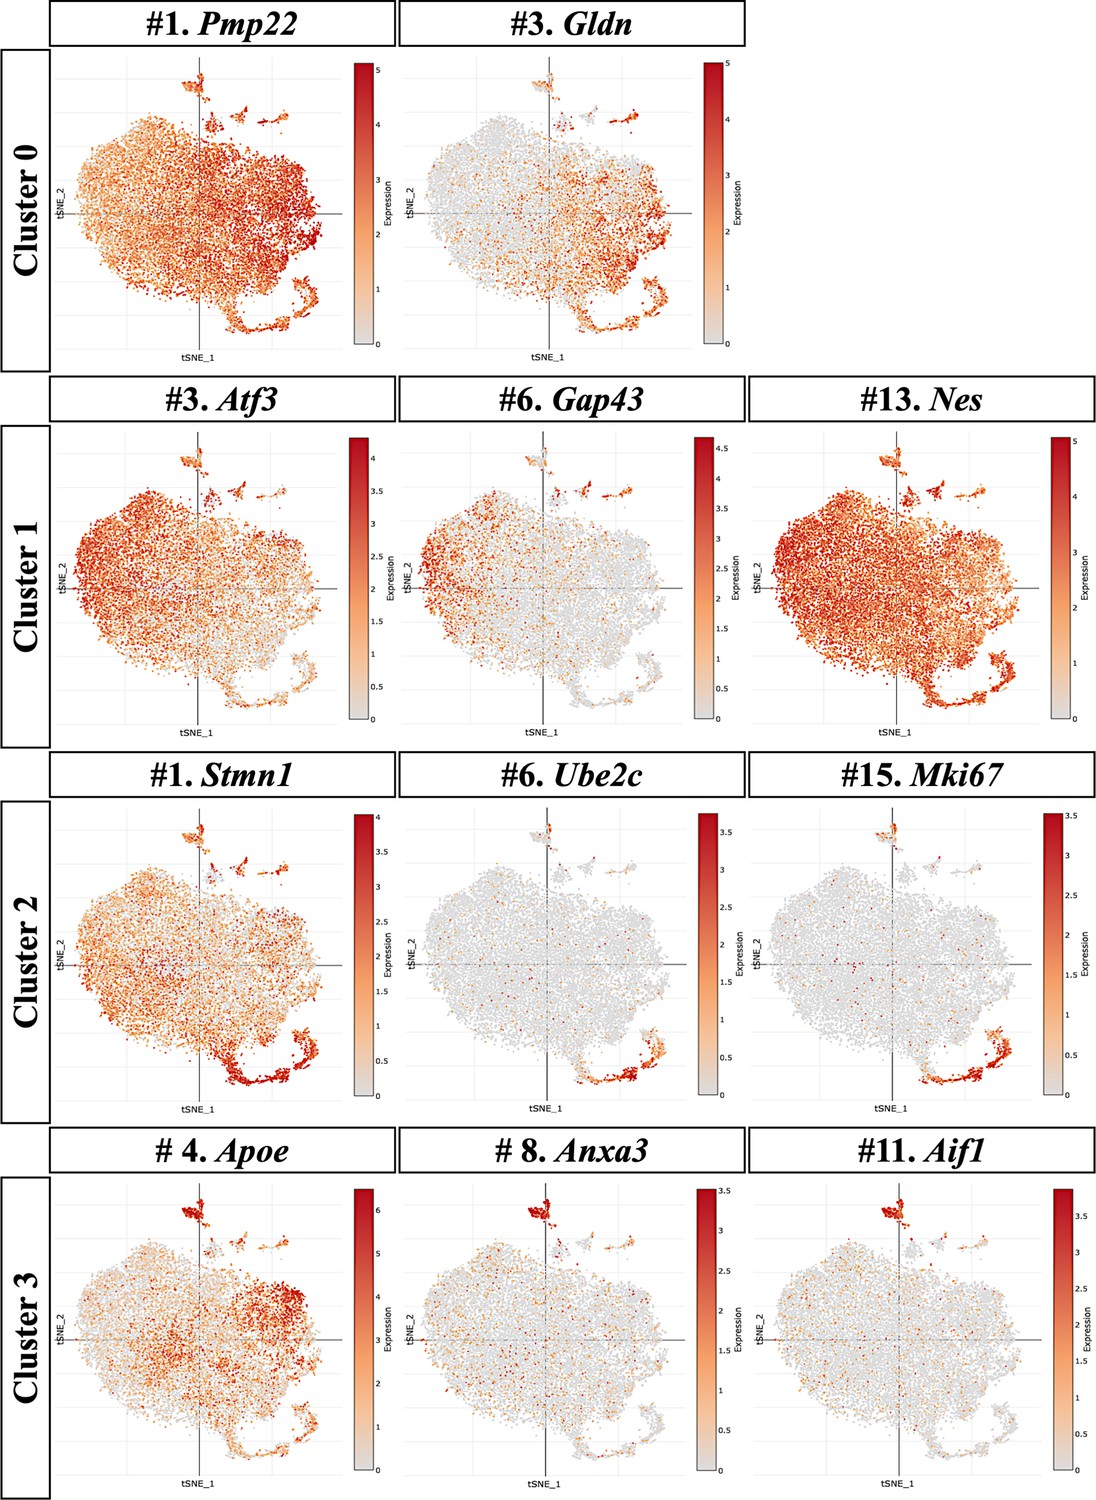
The t-distributed stochastic neighbor embedding (tSNE) plots corresponding to the OEC subclusters are illustrated.
(a, b) Cluster 0 tSNE plots show that Pmp22 is expressed in all five clusters with Gldn concentrated in clusters 0, 2, and 4. (d–f) For cluster 1, tSNE plots illustrate a wide distribution of Atf3 and Nes, whereas GAP43 is found primarily in cluster 1. (g–i) The cell cycle and proliferative markers, Ube2c and Mki67, appear limited to cluster 2, but Stmn1 is detected in all clusters but most heavily concentrated in cluster 2. (j–l) Cluster 3 tSNE plots show high expression of Apoe, Anxa3, and Aif1, but Apoe is also expressed in other clusters.
Figure 8
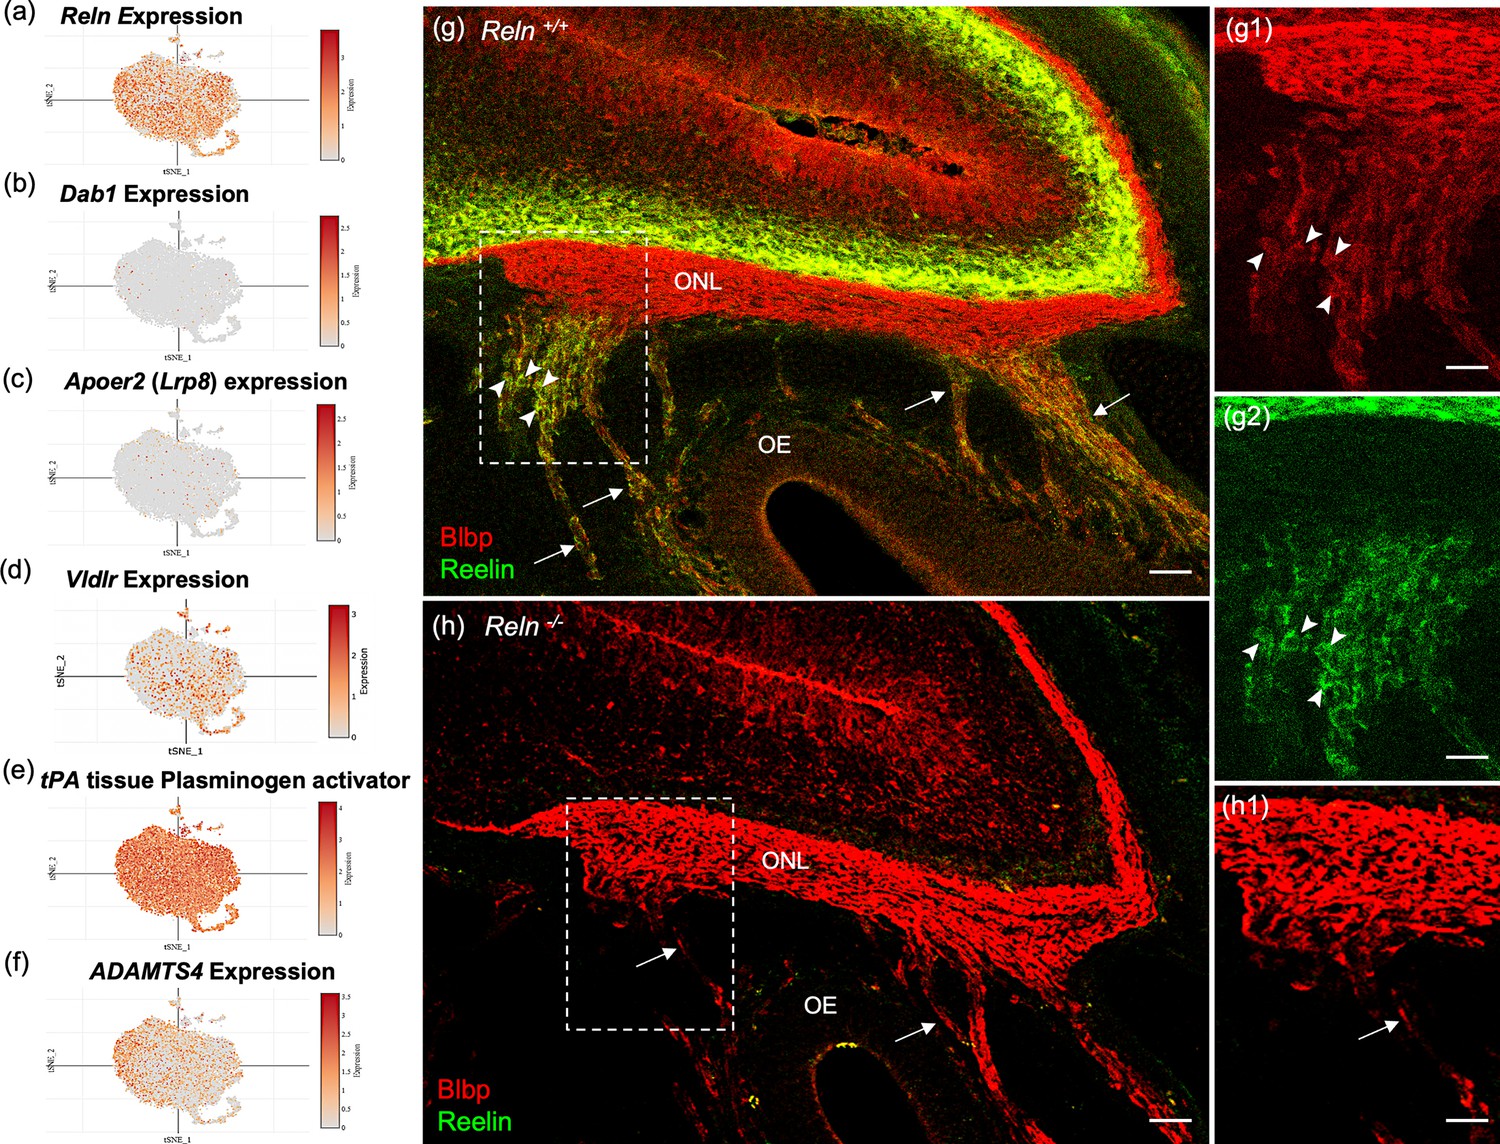
Reelin-signaling pathway marker genes in olfactory ensheathing cell (OEC) clusters and Reelin immunoreactivity in embryonic olfactory system.
(a–f) These six t-distributed stochastic neighbor embedding (tSNE) plots show OEC gene expression levels associated with Reelin signaling. Reln is highly expressed in most OEC clusters (a), Disabled-1 (Dab1, b), and Apolipoprotein E receptor 2 (Apoer2, c) show little expression, and Very-low-density lipoprotein receptor has moderate expression (Vldlr, d). The serine protease tissue Plasminogen Activator (e, tPA) is highly expressed in all OEC subsets and cleaves secreted Reelin only at its C-terminus. ADAMTS-4 cleaves both the N- and C-terminals of Reelin, and is expressed at low levels by OECs (f). (g–g2) Sagittal section of the olfactory epithelium (OE) and olfactory bulb from an E16.5 Reln+/+ mouse immunolabeled for Blbp (g, g1; red) and Reelin (g, g2; green). Boxed area in g is enlarged in g1 and g2. Axons of olfactory sensory neurons (arrows) are surrounded by peripheral OECs that express both Blbp (g1, arrowheads) and Reelin (g2, arrowheads). High Reln expression is obvious in olfactory bulb neurons (g, g1, green) but the olfactory nerve layer (ONL) only expresses Blbp (g, g2). (h, h1) No Reelin is detected in a sagittal section from a Reln−/− mouse, yet Blbp expression in the ONL appears normal. Scale bars: g–h = 50 µm; g1, g2, h1 = 50 µm.
Figure 9
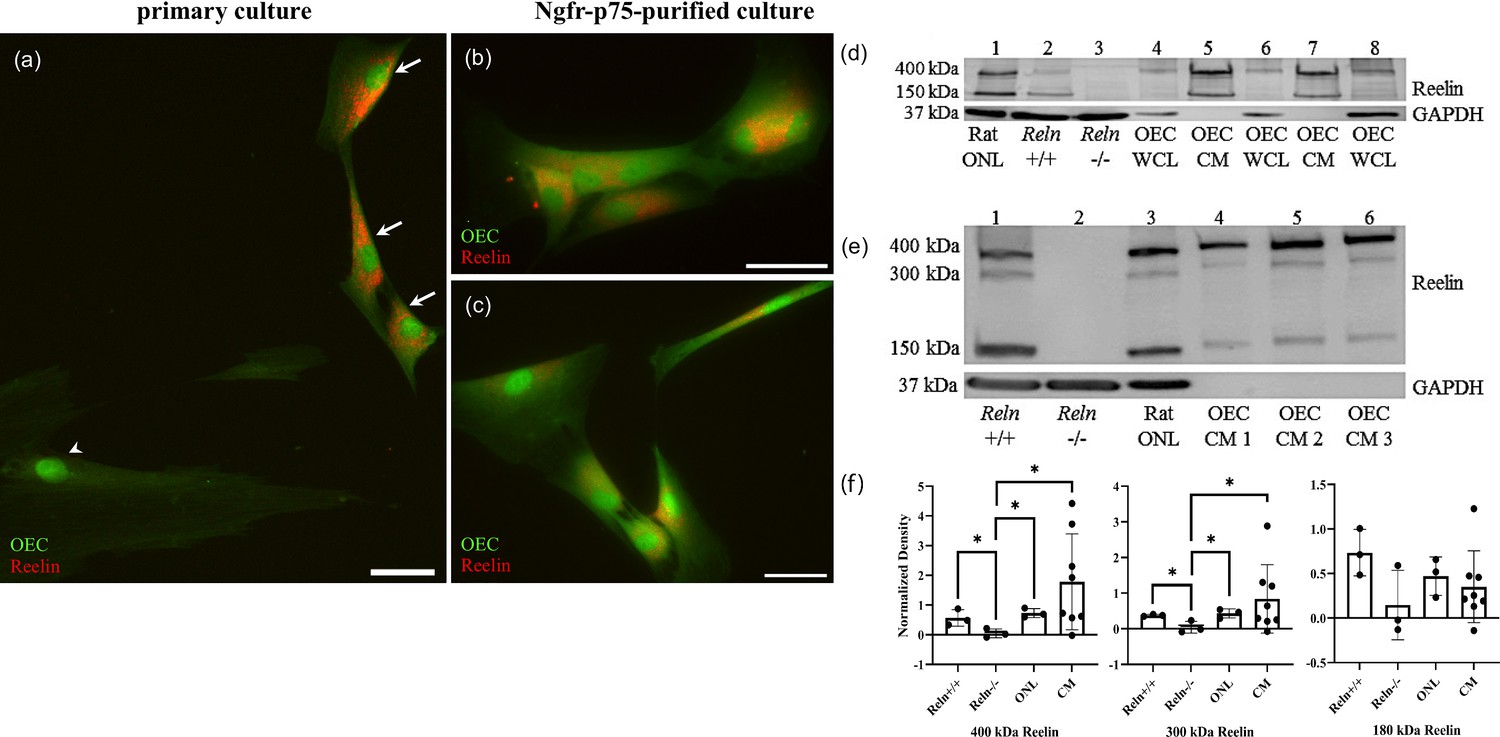
Reelin is expressed and secreted by olfactory ensheathing cells (OECs).
(a–c) Rat OEC cultures were treated with Brefeldin-A to inhibit protein transport and subsequent secretion. Reelin immunoreactivity (red) in a primary culture was detected in green fluorescent protein (GFP)-labeled OECs (a, arrows), but not in another cell type (arrowhead). GFP-labeled OECs which were immunopurified with anti-Ngfrp75 also express Reelin (red; b, c). (d) Western blot confirms the expression of Reelin in rat Olfactory Nerve Layer I and II (ONL; lane 1 of western blot). Reln+/+ and Reln−/− mouse olfactory bulbs were used as positive and negative controls, respectively (lanes: 2 and 3). Reelin synthesized by cultured OECs was found at low levels in whole-cell lysates (WCL; lanes: 4, 6, and 8), compared to Reelin secreted by cultured OECs into tissue culture medium, termed OEC ‘conditioned medium’ (CM; lanes: 5 and 7). GAPDH was the loading control for tissue homogenates (lanes: 1–4, 6, and 8). (e) All three Reelin isoforms (400, 300, and 150 kDa) were detected with a 4–15% gradient gel. Reln+/+ and Reln−/− mouse cortices were used as controls (lanes: 1 and 2). Reelin was detected in the rat ONL (lane 3) and in three rat OEC-CM samples (lanes: 4, 5, and 6). GAPDH was the loading control for tissue homogenates (lanes: 1–3). (f) Quantitation of multiple isoforms of Reelin from 4% to 15% gradient gels. Positive and negative controls are Reln+/+ and Reln−/− mouse cortices. Both rat tissue from the ONL (n = 3) and CM (n = 9) contain significantly more 400 and 300 kDa Reelin than the Reln−/− mice. Bars represent the standard deviation of the mean. One-sided Mann–Whitney U test was used to test that protein expression levels in the other groups are greater than those in the Reln−/− group, indicative of significant expression of Reln in the test groups. *p < 0.05. Scale bars: a–c = 40 μm.
-
Figure 9—source data 1
Original images for the western blots shown in Figure 9d and e.
- https://cdn.elifesciences.org/articles/95629/elife-95629-fig9-data1-v1.zip
-
Figure 9—source data 2
Labeled images for the western blots shown in Figure 9d and e.
- https://cdn.elifesciences.org/articles/95629/elife-95629-fig9-data2-v1.zip
Tables
Key resources table
| Reagent type (species) or resource | Designation | Source or reference | Identifiers | Additional information |
|---|---|---|---|---|
| Strain, strain background (mouse) | Reeler mouse (B6C3Fe-ala-Relnrl) | Jackson Laboratory | Strain 000235 | Used for OEC mouse tissue sections cultures, and western blots |
| Strain, strain background (rat) | GFP-expressing Sprague-Dawley rats (SD-Tg) | SLC, Shizuoka, Japan7 | Z-004 SD-Tg (Act-EGFP) | Used for breeding |
| Strain, strain background (rat) | Unlabeled Sprague-Dawley female rats (SD) | Charles Rivers Laboratory | Strain 001 CD IGS | Used for breeding with SD-Tg males |
| Strain, strain background (rat) | GFP-SD-Tg males bred with SD females | Sources noted above | Used to derive 8- to 10-week-old female GFP-SD-Tg rats | OECs used for scRNA-Seq analysis and rat cultures |
| Antibody | Atf3; Mouse monoclonal | Abcam | Cat# ab191513, RRID:AB_2868437 | 1:4000; TSA + citric acid |
| Antibody | Aif1/Iba1, Rabbit polyclonal | Wako (Osaka, Japan) | Cat# 019-19741, RRID:AB_839504 | 1:5000; IF |
| Antibody | Anxa3, Rabbit polyclonal | Gene Tex | Cat# GTX103330, RRID:AB_11174712 | 1:5000; TSA + citric acid |
| Antibody | Apolipoprotein E (Apoe), Goat polyclonal | Sigma-Aldrich | Cat# AB947, RRID:AB_2258475 | 1:2000; TSA + citric acid |
| Antibody | Brain lipid-binding protein (Blbp), Rabbit monoclonal | Sigma-Aldrich | Cat# ZRB13190, RRID:AB_2920766 | 1:5000; IF |
| Antibody | Brain lipid-binding protein (Blbp), Rabbit polyclonal | Sigma-Aldrich | Cat# ABN14, RRID:AB_10000325 | 1:1500; IF |
| Antibody | Connective tissue growth factor (Ctgf, Ccn2), Rabbit polyclonal | Abcam | Cat# ab6992, RRID:AB_305688 | 1:500, IF |
| Antibody | Gliomedin (Gldn), Rabbit polyclonal | Abcam | Cat# ab24483, RRID:AB_2111616 | 1:100; IF + citric acid |
| Antibody | Growth-associated protein (Gap43), Rabbit polyclonal | Abcam | Cat# ab16053, RRID:AB_443303 | 1:500; IF |
| Antibody | Green fluorescent protein (GFP), Chicken polyclonal | Aves Labs Inc | Cat# GFP-1020, RRID:AB_10000240 | 1:1000; IF |
| Antibody | Glial fibrillary acidic protein (GFAP), Mouse monoclonal | BD Biosciences | Cat# 556327, RRID:AB_396365 | 1000; IF |
| Antibody | Glial fibrillary acidic protein (GFAP), goat polyclonal | Sigma | Cat# SAB2500462, RRID:AB_10603437 | 1:2000; IF |
| Antibody | Glyceraldehyde-3-phosphate dehydrogenase (GAPDH), Mouse monoclonal | Sigma-Aldrich | Cat# MAB374, RRID:AB_2107445 | 1:100K; WB |
| Antibody | L1, Rabbit polyclonal | Gift from Dr. V Lemmon Brittis et al., 1995 | 1:10,000; IF | |
| Antibody | Marker of proliferation ki-67 (Mki67), Rabbit polyclonal | Abcam | Cat# ab15580, RRID:AB_443209 | 1:500; IF 1:5000; TSA |
| Antibody | Nestin (Nes), Mouse monoclonal | Developmental Studies Hybridoma Bank | Cat# Rat-401, RRID:AB_2235915 | 1:1000; TSA + citric acid |
| Antibody | Neurofilament-200 (NF), Rabbit polyclonal | Sigma-Aldrich | Cat# AB1989, RRID:AB_91202 | 1000; IF |
| Antibody | N-Cadherins, Mouse monoclonal | Invitrogen | Cat# 33-3900, RRID:AB_2313779 | 1:500; IF |
| Antibody | Neural cell adhesion molecule (NCAM), Rabbit polyclonal | Sigma | Cat# AB5032, RRID:AB_2291692 | 1:5000; IF |
| Antibody | Nerve growth factor receptor, p75 (Ngfrp75), Mouse monoclonal | Hybridoma gift from Dr. EM Shooter (Chandler et al., 1984) | 192-IgG | 1:50; IF 1:5; immuno-purification for OECs |
| Antibody | Nerve growth factor receptor, p75 (Ngfrp75), Rabbit polyclonal | Sigma-Aldrich | Cat# AB1554, RRID:AB_90760 | 1:30K; IF 1:1500; immuno-purification |
| Antibody | Peripheral myelin protein 22 (Pmp22), Rabbit polyclonal | Gene Tex | Cat# GTX85834, RRID:AB_10733560 | 1:1000; TSA + MeOH* |
| Antibody | Reelin (Reln), Goat polyclonal | R&D Systems | Cat# AF3820, RRID:AB_2253745 | 1:250; IF |
| Antibody | Reelin (Reln), Mouse monoclonal G10 | Sigma-Aldrich | Cat# MAB5364, RRID:AB_2179313 | 1:1000; F 1:750; WB |
| Antibody | S100 calcium-binding protein β (S100β), Rabbit polyclonal | Dako A/S (Glostrup, Denmark) | Cat# GA50461-2, RRID:AB_2811056 | 1:500; IF |
| Antibody | Serotonin (5HT), Goat polyclonal | Immunostar | Cat# 20079, RRID:AB_572262 | 5000; IF |
| Antibody | Stathmin 1 (Stmn1), Rabbit monoclonal | Abcam | Cat# ab52630, RRID:AB_2197257 | 1:7000; TSA + citric acid |
| Antibody | SRY-Box transcription factor 10 (SOX10), Goat polyclonal | R&D Systems | Cat# AF2864, RRID:AB_442208 | 1:75; ICC |
| Antibody | Ubiquitin-conjugating enzyme E2 C (Ube2c), Rabbit monoclonal | Abcam | Cat# ab252940, RRID:AB_2910263 | 1:1000; TSA + citric acid |
| Antibody | Alexa Fluor 488 AffiniPure donkey anti-Chicken IgY | Jackson Immuno Research | Cat# 703-545-155, RRID:AB_2340375 | 1:200–500 |
| Antibody | Alexa Fluor 488 AffiniPure donkey anti-goat | Jackson Immuno Research | Cat# 705-545-003, RRID:AB_2340428 | 1:250 |
| Antibody | Alexa Fluor 488 AffiniPure donkey anti-mouse | Jackson Immuno Research | Cat# 715-545-150, RRID:AB_2340846 | 1:500 |
| Antibody | Alexa Fluor 488 donkey anti-rabbit | Invitrogen | Cat# A21206, RRID:AB_2535792 | 1:250 |
| Antibody | Alexa Fluor 555 donkey anti-mouse | Life Technologies | Cat# A31570 RRID:AB_2536180 | 1:200–500 |
| Antibody | Alexa Fluor 555 donkey anti-rabbit | Life Technologies | Cat# A31572, RRID:AB_162543 | 1:500 |
| Antibody | Alexa Fluor 647 donkey anti-rabbit | Jackson Immuno Research | Cat# 711-605-152, RRID:AB_2492288 | 1:200–500 |
| Antibody | Biotin-SP AffiniPure donkey anti-mouse IgG | Jackson Immuno Research | Cat# 715-065-150, RRID:AB_2307438 | 1:1000 |
| Antibody | Biotin-SP AffiniPure donkey anti-rabbit IgG | Jackson Immuno Research | Cat# 711-065-152, RRID:AB_2340593 | 1:1000 |
| Antibody | Biotin-SP AffiniPure goat anti-rabbit IgG, FC fragment specific | Jackson Immuno Research | Cat#111-065-008, RRID:AB_2337959 | 1:1000 hydrophobic Petri dishes |
| Antibody | Biotinylated horse anti-goat | Vector Laboratories | Cat# BA-9500, RRID:AB_2336123 | 1:1000 |
| Other | Streptavidin-conjugated horseradish peroxidase | PerkinElmer | Cat# NEL750001ET, RRID:AB_2617185 | 1:1000 |
| Commercial assay or kit | Tyramide Signal Amplification (TSA) plus Fluorescein | PerkinElmer | Cat# NEL741001KT | 1:150 |
| Commercial assay or kit | Tyramide Signal Amplification (TSA) plus Cyanine 3 | PerkinElmer | Cat# NEL74400KT | 1:100 |
Additional files
-
Supplementary file 1
Differentially enriched marker genes for fibroblasts, microglia, and olfactory ensheathing cells (OECs) identified by scRNA-seq.
The list of genes that are significantly enriched in each major cell type (fibroblast, microglia, or OEC) based on single-cell RNA-sequencing of immunopurified OECs and ‘leftover’ control cultures. For each gene, the table shows the nominal p-value, the multiple-testing adjusted p-value, the log2 fold change (relative to all other cell types), and the percentage of cells expressing that gene within the indicated cell type versus all other cell types. Genes are grouped by the cell type in which they are most significantly enriched.
- https://cdn.elifesciences.org/articles/95629/elife-95629-supp1-v1.xlsx
-
Supplementary file 2
Differentially enriched marker genes for each olfactory ensheathing cell (OEC) subcluster identified by scRNA-seq.
The list of genes that are significantly enriched in each of the five OEC subclusters identified by single-cell RNA-sequencing. The columns show the nominal p-value, the multiple-testing-adjusted P value, the log2 fold change (relative to all other OEC subclusters), and the OEC subcluster (0–4) in which each gene was most strongly enriched. Genes are grouped based on the subcluster where their expression is highly specific, providing a unique transcriptional signature for each OEC subtype.
- https://cdn.elifesciences.org/articles/95629/elife-95629-supp2-v1.xlsx
-
MDAR checklist
- https://cdn.elifesciences.org/articles/95629/elife-95629-mdarchecklist1-v1.docx
Download links
A two-part list of links to download the article, or parts of the article, in various formats.
Downloads (link to download the article as PDF)
Open citations (links to open the citations from this article in various online reference manager services)
Cite this article (links to download the citations from this article in formats compatible with various reference manager tools)
Olfactory ensheathing cells from adult female rats are hybrid glia that promote neural repair
eLife 13:RP95629.
https://doi.org/10.7554/eLife.95629.4


