Age-related decline in blood-brain barrier function is more pronounced in males than females in parietal and temporal regions
- USC Stevens Neuroimaging and Informatics Institute, Keck School of Medicine, University of Southern California, United States
- Department of Population and Public Health Sciences, Keck School of Medicine, University of Southern California, United States
- Department of Ophthalmology, Keck School of Medicine, University of Southern California, United States
- Department of Neuroscience, College of Medicine, University of Kentucky, United States
- Maryland Psychiatric Research Center, Department of Psychiatry, University of Maryland School of Medicine, United States
- Interventional Psychiatry Program, Department of Psychiatry, Weill Cornell Medicine, United States
- Louis A. Faillace Department of Psychiatry and Behavioral Sciences at McGovern Medical School, The University of Texas Health Science Center at Houston, United States
- Department of Radiology and Neurology, Keck School of Medicine, University of Southern California, United States
Figures
Figure 1 with 1 supplement
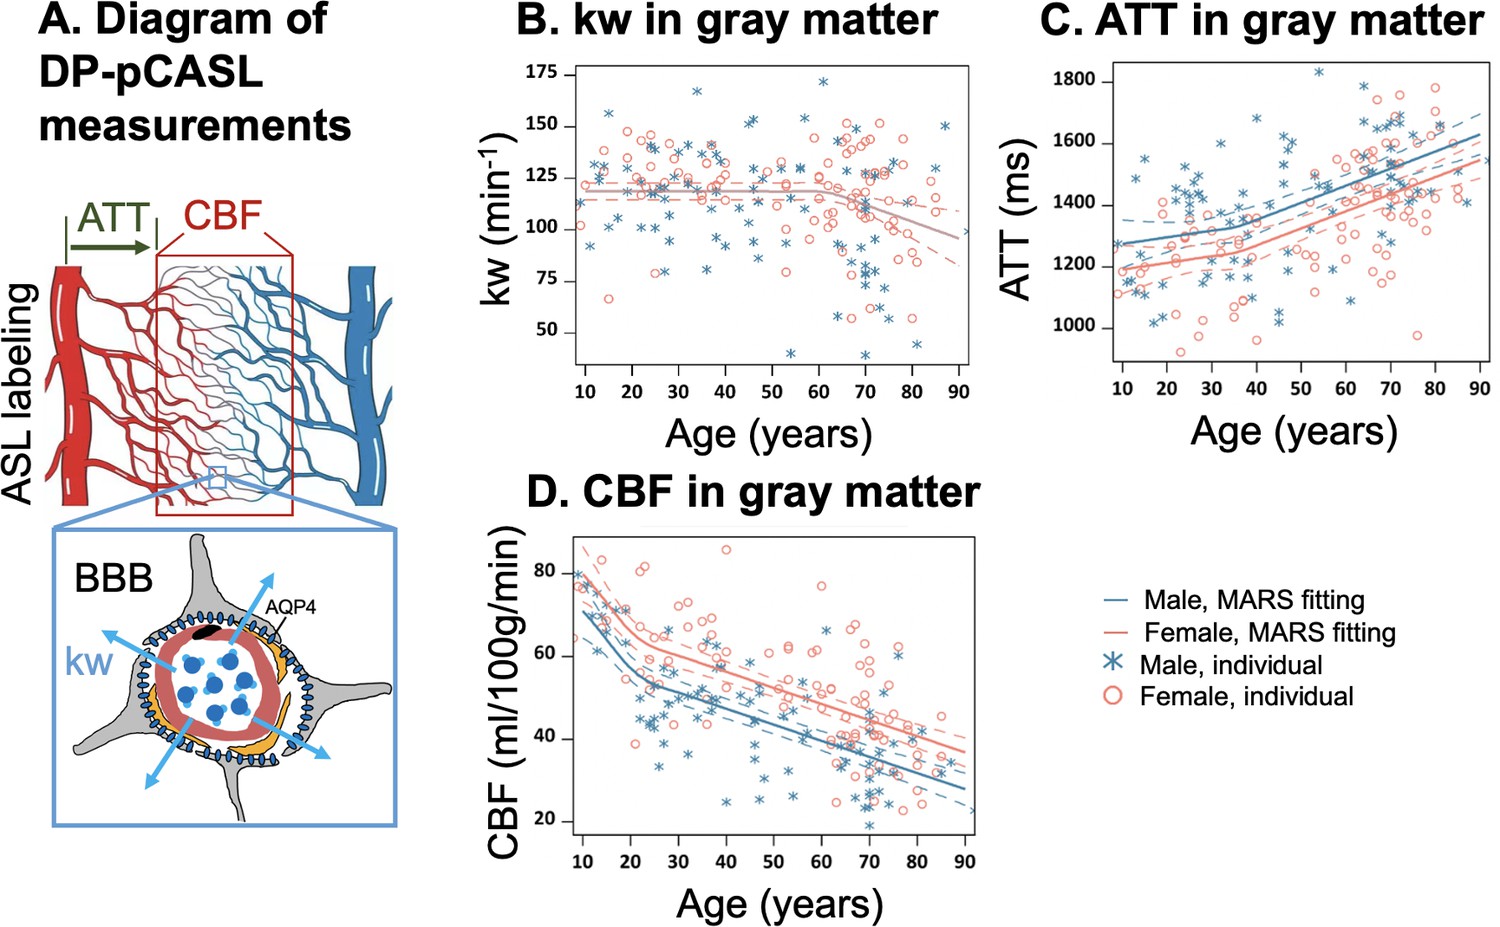
Illustration of diffusion prepared pseudo-continuous arterial spin labeling (DP-pCASL) measurements and age-related trends in kw, arterial transit time (ATT), and cerebral blood flow (CBF) in gray matter.
(A) Diagram illustrating the DP-pCASL measurements. ATT represents the transit time of the labeled blood traveling from DP-pCASL labeling plane to the imaging voxel, CBF refers to the amount of labeled blood supplied to the brain per unit of time (or perfusion), and kw describes the rate of blood water exchanging from intravascular space (capillaries) into extravascular space (tissue) facilitated by multiple transport mechanisms including AQP-4 water channel assisted transport. (B–D) Scatter plots representing age-related distribution of kw (B), ATT (C) and CBF (D) values in the gray matter. In all scatter plots, individual data points for males and females are indicated by blue asterisk symbols and red circles, respectively, while the corresponding MARS fitting curves and 95% confidence interval for expected value at each age point are presented as continuous lines and dashed lines in matching colors.
Figure 1—figure supplement 1
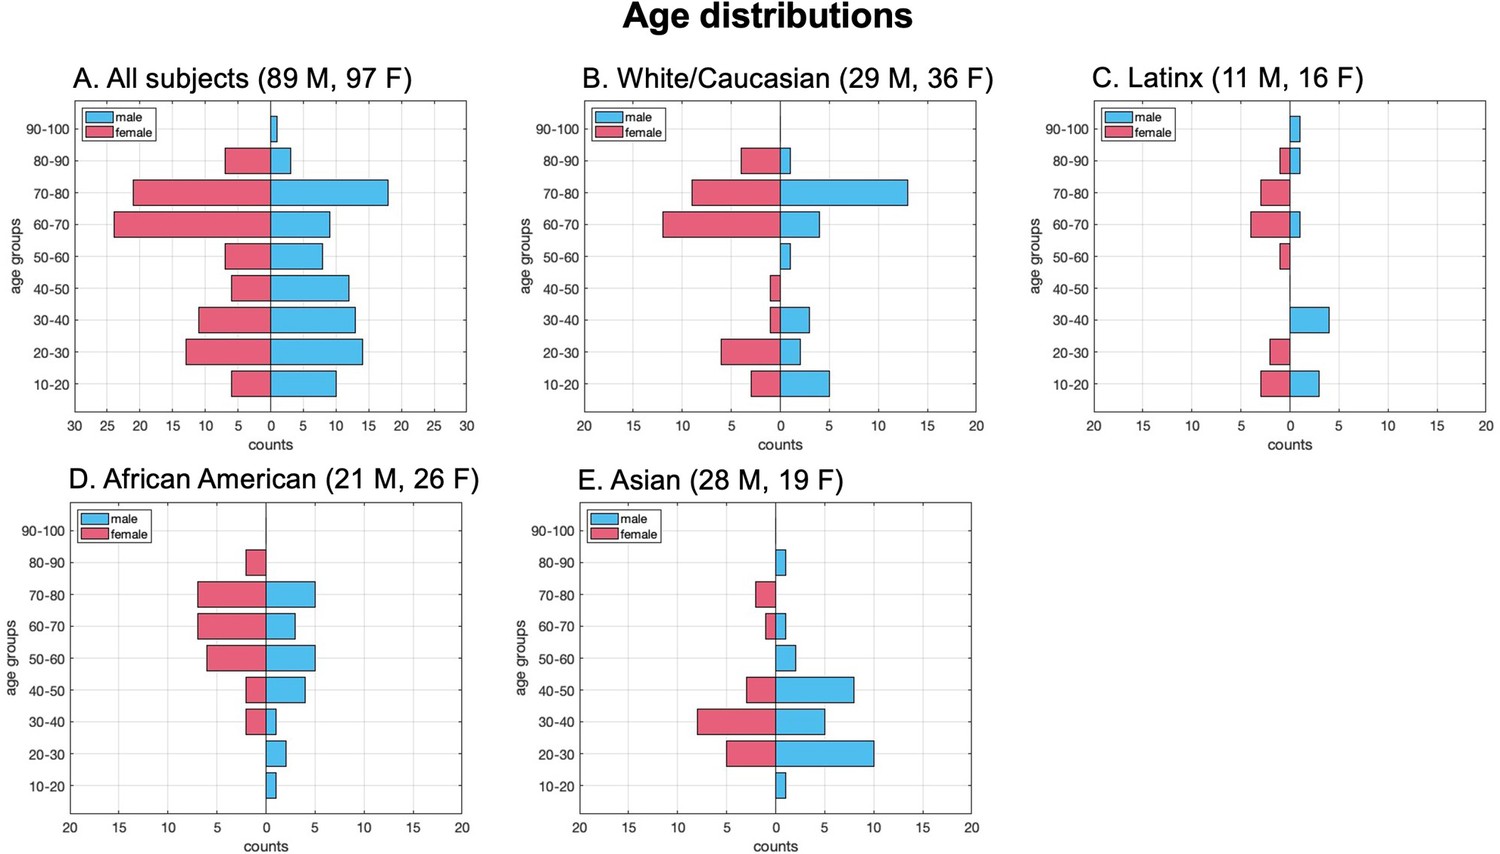
Participant age distribution by sex.
The study included 186 participants aged 8–92 years (89 males and 97 females). The racial distribution was as follows: 65 White/Caucasian (29 males, 36 females), 27 Latinx (11 males, 16 females), 47 African American (21 males, 26 females), and 47 Asian (28 males, 19 females). Since race may influence the changes in cerebral blood flow (CBF), arterial transit time (ATT), and kw with aging, it was incorporated as a covariate in the statistical analysis.
Figure 2 with 3 supplements
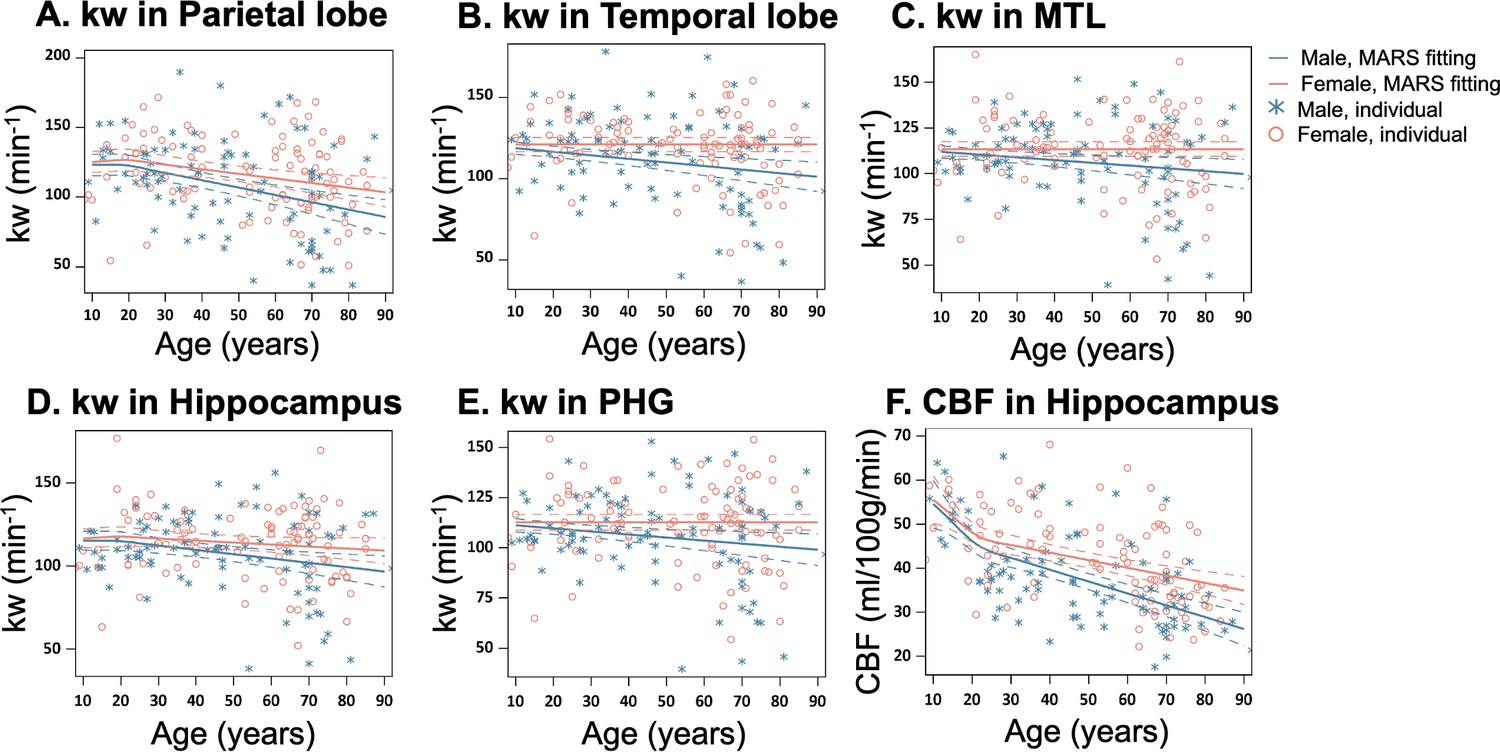
Sex-specific age trends in kw and cerebral blood flow (CBF).
(A–E) Scatter plots representing the age-related distribution of kw values in the parietal lobe (A), temporal lobe (B), MTL (C), hippocampus (D) and PHG (E). (E) Scatter plots representing an age-related distribution of CBF values in the hippocampus. In all scatter plots, individual data points for males and females are indicated by blue asterisk symbols and red circles, respectively, while the corresponding MARS fitting curves and 95% confidence interval for expected value at each age point are presented as continuous lines and dashed lines in matching colors. Abbreviation: MTL, medial temporal lobe; PHG, parahippocampal gyrus.
Figure 2—figure supplement 1
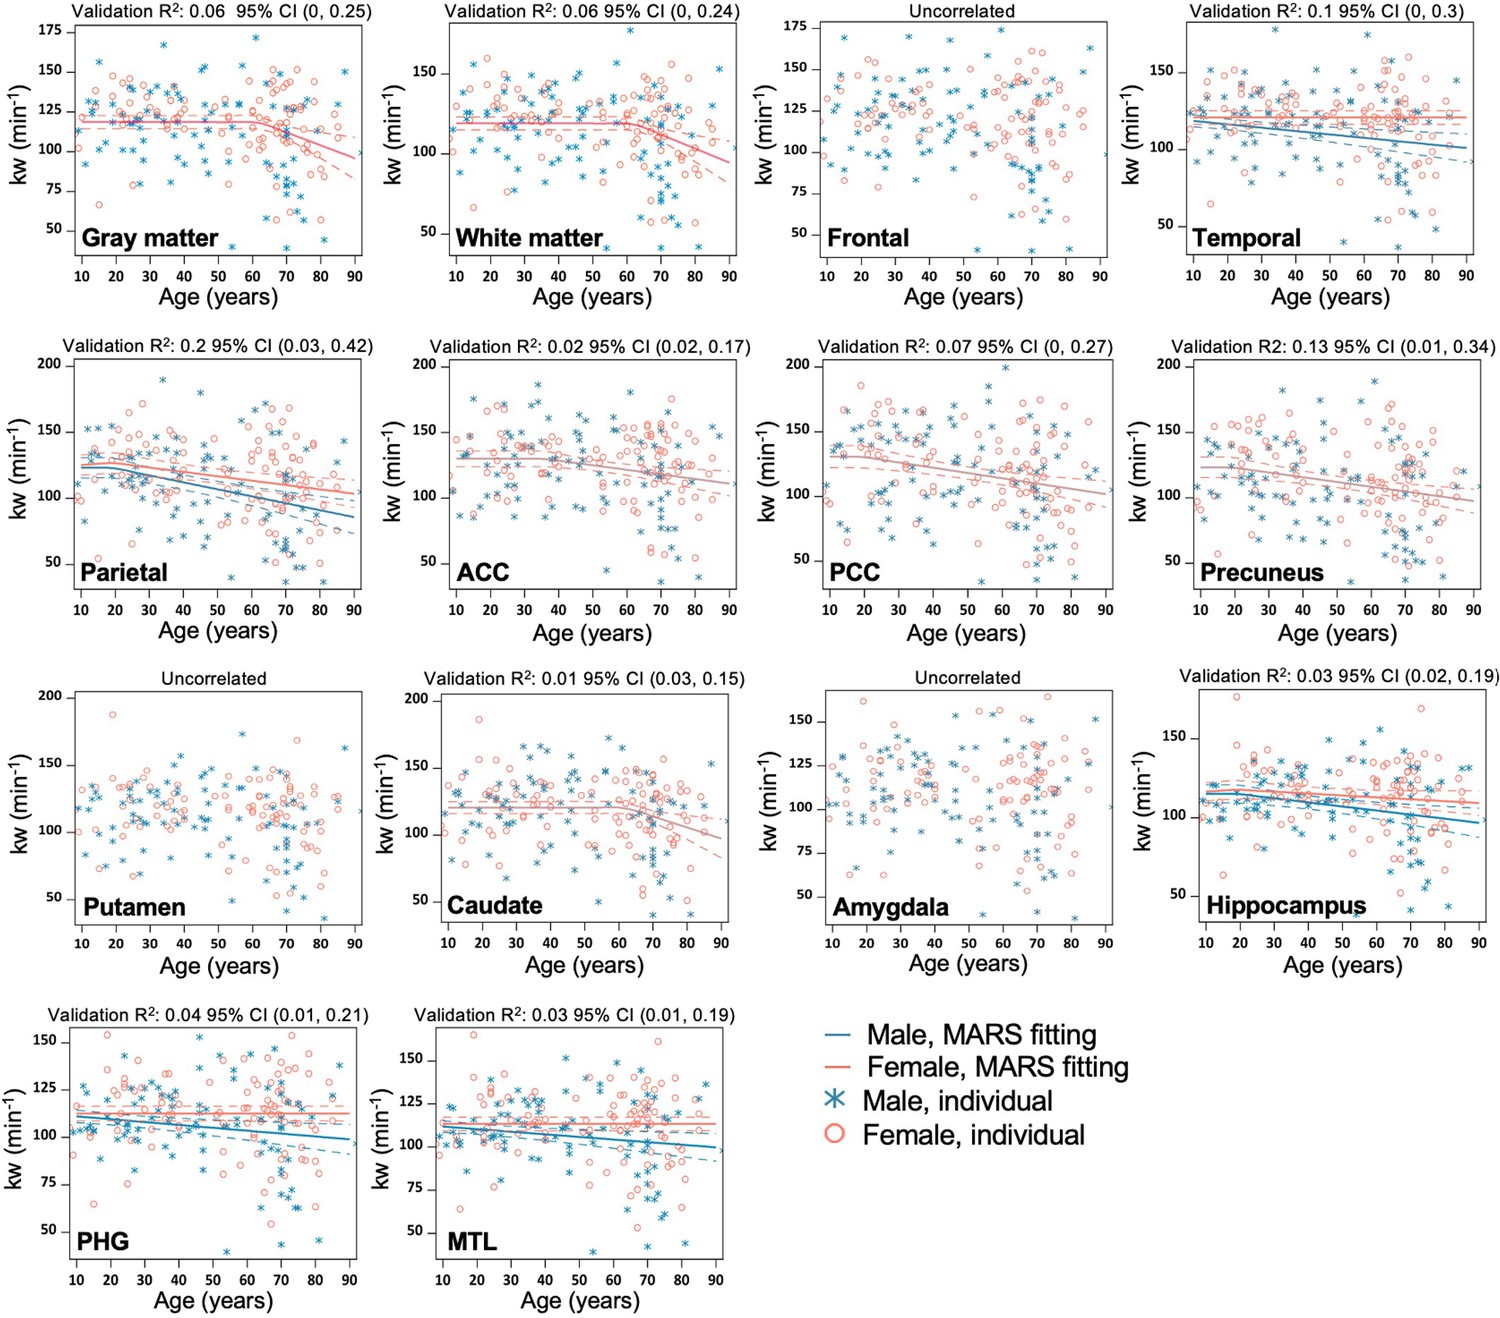
Regional MARS analysis to reveal the age and sex-dependent trajectories of kw in gray matter (GM), WM, Frontal lobe, Temporal lobe, Parietal lobe, Anterior Cingulate Cortex (ACC), Posterior Cingulate Cortex (PCC), Precuneus, Putamen, Caudate, Amygdala, Hippocampus, Parahippocampal gyrus (PHG), and Mediotemporal lobe (MTL).
Individual data points for males and females are indicated by blue asterisk symbols and red circles, respectively, while the corresponding MARS fitting curves (solid lines) and 95% confidence interval for predicted value (dash lines) are presented in matching colors. Validation R2 indicates the correlation between the observed value and a predicted value obtained through cross-validation.
Figure 2—figure supplement 2
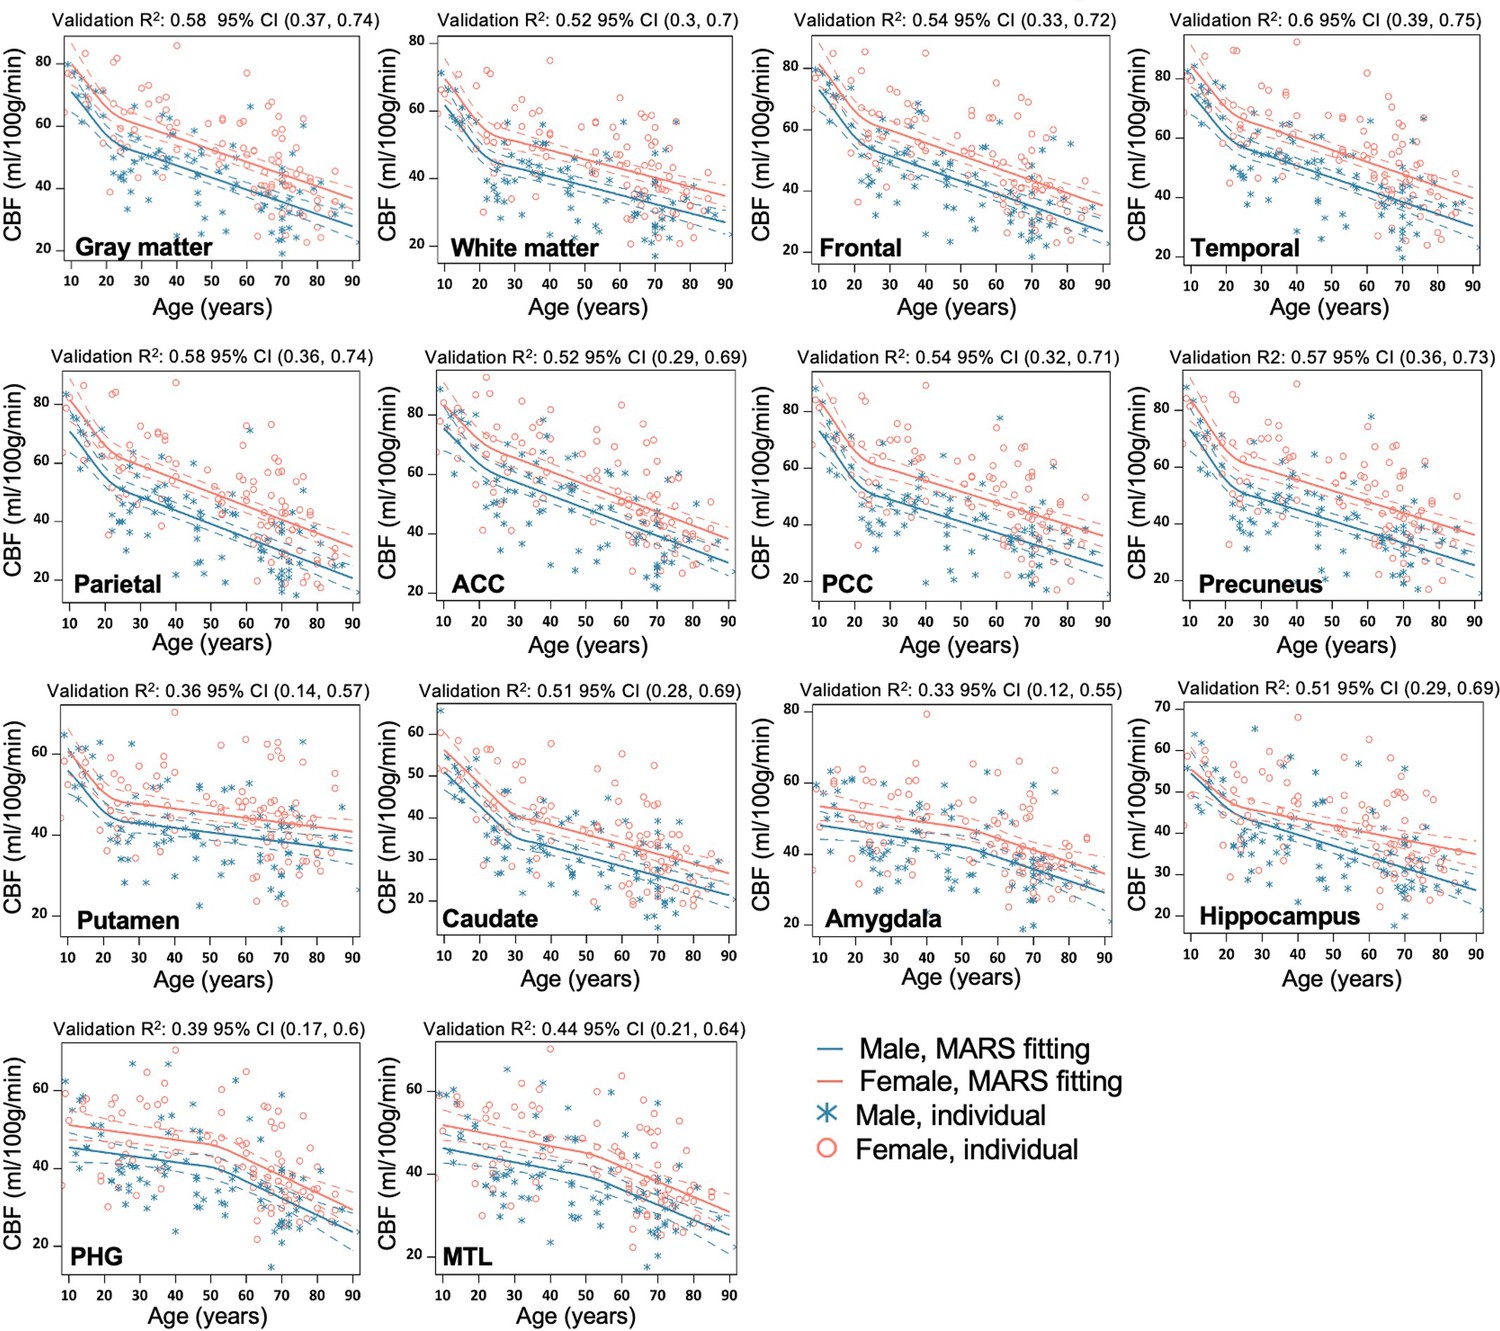
Regional MARS analysis to reveal the age and sex-dependent trajectories of cerebral blood flow (CBF) in gray matter (GM), WM, Frontal lobe, Temporal lobe, Parietal lobe, Anterior Cingulate Cortex (ACC), Posterior Cingulate Cortex (PCC), Precuneus, Putamen, Caudate, Amygdala, Hippocampus, Parahippocampal gyrus (PHG), and Mediotemporal lobe (MTL).
Individual data points for males and females are indicated by blue asterisk symbols and red circles, respectively, while the corresponding MARS fitting curves (solid lines) and 95% confidence interval for predicted value (dash lines) are presented in matching colors. Validation R2 indicates the correlation between the observed value and a predicted value obtained through cross-validation.
Figure 2—figure supplement 3
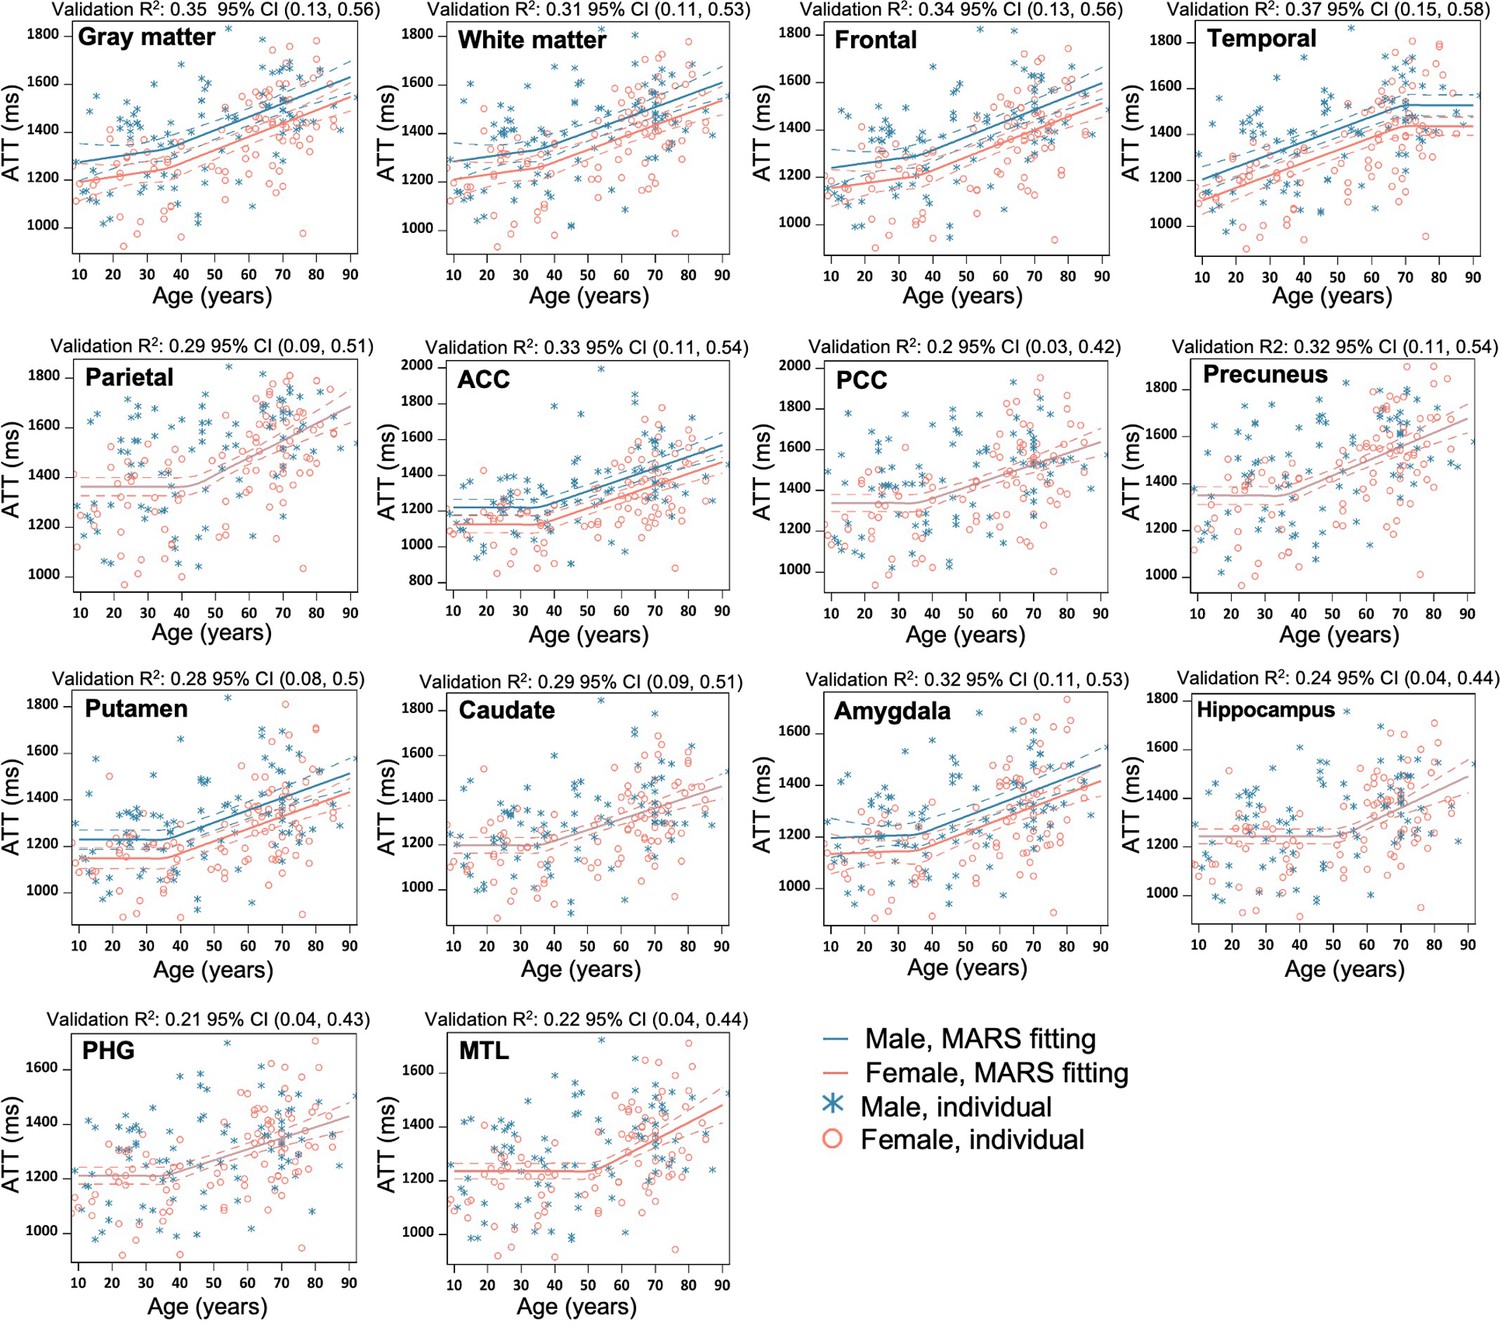
Regional MARS analysis to reveal the age and sex dependent trajectories of arterial transit time (ATT) in gray matter (GM), WM, Frontal lobe, Temporal lobe, Parietal lobe, Anterior Cingulate Cortex (ACC), Posterior Cingulate Cortex (PCC), Precuneus, Putamen, Caudate, Amygdala, Hippocampus, Parahippocampal gyrus (PHG), and Mediotemporal lobe (MTL).
Individual data points for males and females are indicated by blue asterisk symbols and red circles, respectively, while the corresponding MARS fitting curves (solid lines) and 95% confidence interval for predicted value (dash lines) are presented in matching colors. Validation R2 indicates the correlation between observed value and predicted value obtained through cross-validation.
Figure 3 with 1 supplement
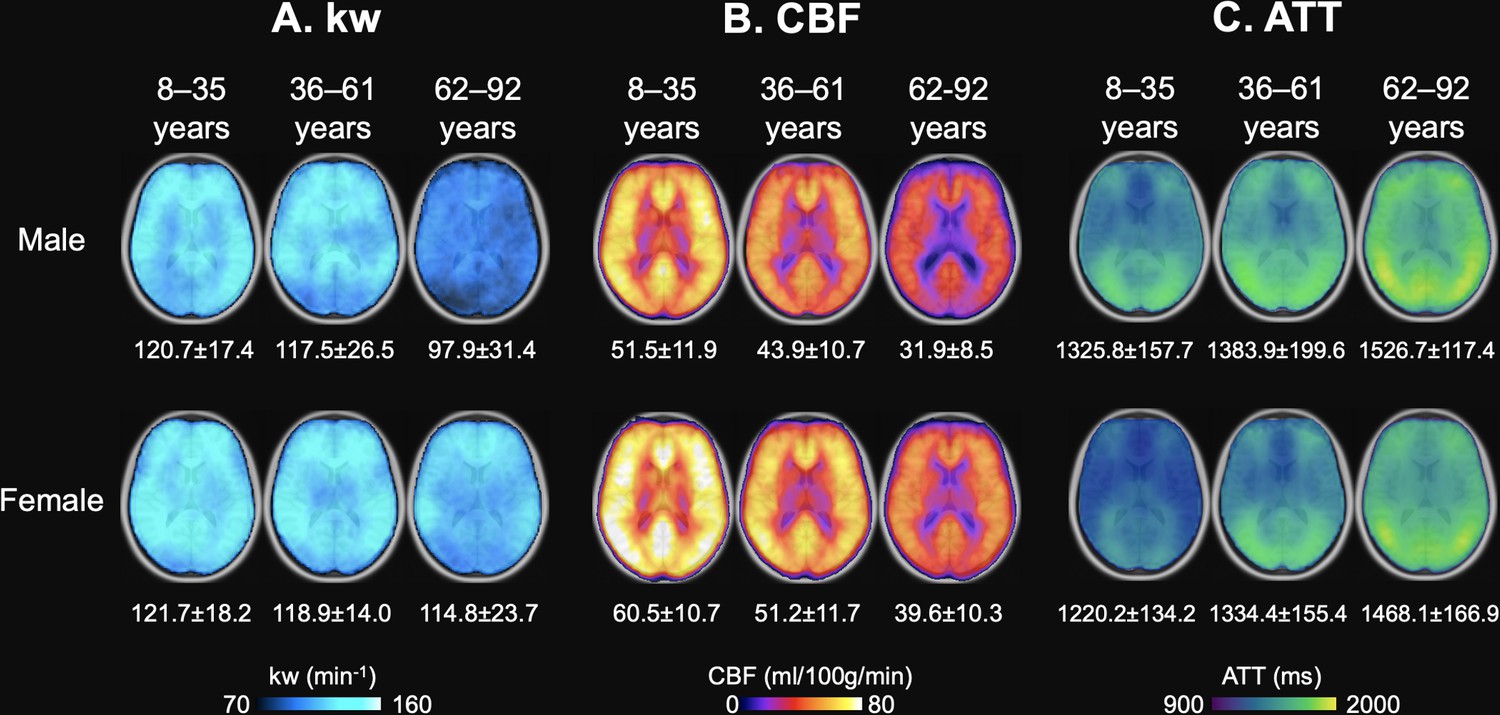
Age and Sex-based Variations in kw, arterial transit time (ATT), and cerebral blood flow (CBF).
(A) kw maps, (B) CBF maps, and (C) ATT maps, average across three age groups: 8–35 years (Males: n=31, average age 23.0 years; Females: n=26, average age 22.7 years), 36–63 years (Males: n=28, average age 46.8 years; Females: n=28, average age 51.3 years), and 62–92 years (Males: n=30, average age 72.7 years; Females: n=43, average age 72.8 years). These maps are superimposed on T1w anatomical images. Corresponding average kw, CBF, and ATT values are provided beneath each map. Across the spectrum, kw values remained relatively consistent between males and females, though a marked reduction in kw can be observed in males aged 62–92 years. Patterns in the maps suggest an age-related a crease in CBF and increase in ATT, while males generally had lower CBF and longer ATT values compared to females.
Figure 3—figure supplement 1
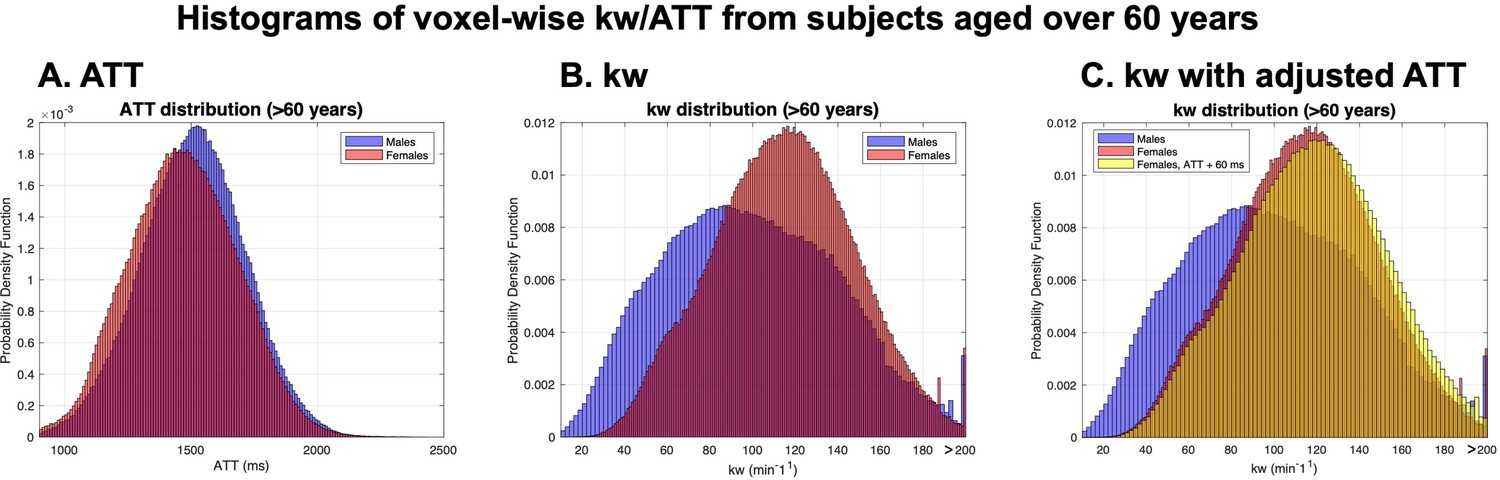
Voxel-wise distributions of arterial transit time (ATT) and kw for participants aged over 62 years.
(A) ATT distribution demonstrates a slightly longer ATT values in males (blue) than females (red), with similar distribution widths. (B) kw distribution reveals a higher mean kw in females (red), while males (blue) show greater variability. (C) Simulated kw distribution for females with ATT adjusted by +60 ms, aligning with male ATT, indicates marginally higher kw values compared to. These patterns suggest that differences in kw between males and females are not directly attributable to ATT variations. cerebral blood flow (CBF) values were not included in the simulations, as they do not affect kw quantification in the SPA model.
Figure 4
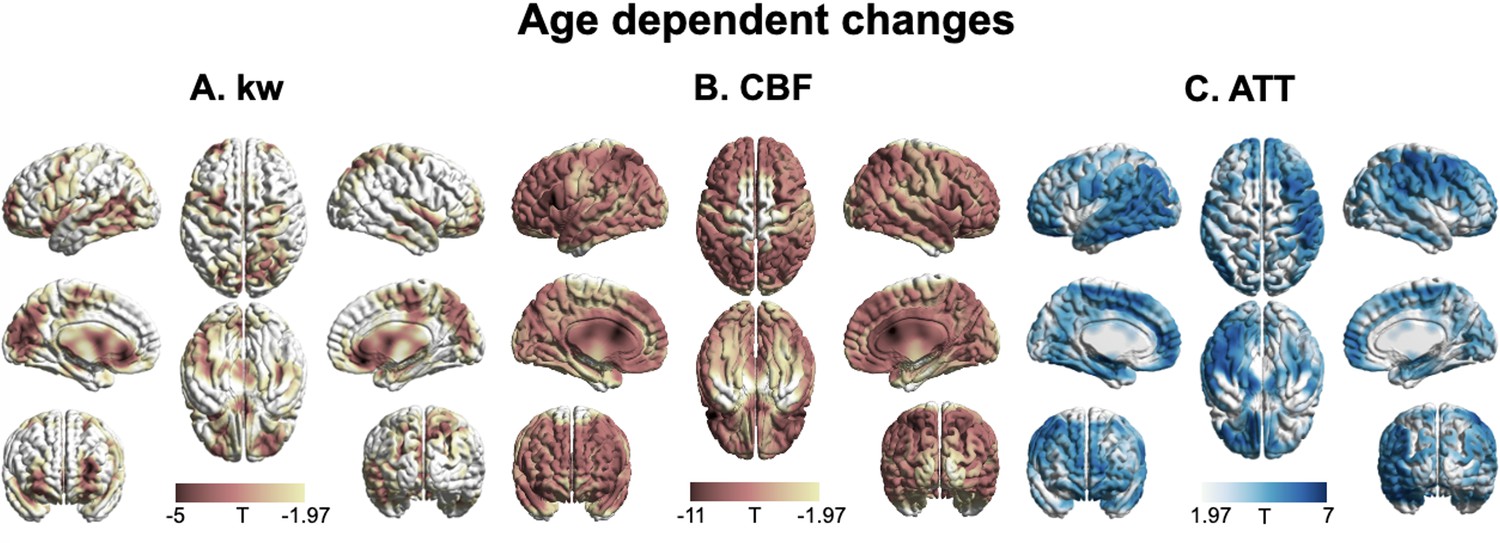
3D renderings of T maps depicting age-related differences.
Highlighted areas indicate significant age-related decreases in kw (A), decreased cerebral blood flow (CBF) (B), and increased arterial transit time (ATT) (C). The most pronounced decrease in kw was observed in the lateral and medial prefrontal cortices, anterior cingulate cortex (ACC), posterior cingulate cortex (PCC), temporal lobe, parietal lobe, occipital lobe, and insula. A broad range of brain regions exhibits both CBF reduction and ATT increase. The color scale represents T values, and clusters consisting of over 501 voxels with an absolute T value greater than 1.97 are considered significant and displayed in the figure. The limited slice coverage of diffusion prepared pseudo-continuous arterial spin labeling (DP-pCASL) (96 mm) may account for the absence of detected effects in the upper and lower regions of the brain. The effects of decrease or increase were represented by warm colors (yellow to red) and cold (gray to blue) colors, respectively.
Figure 5
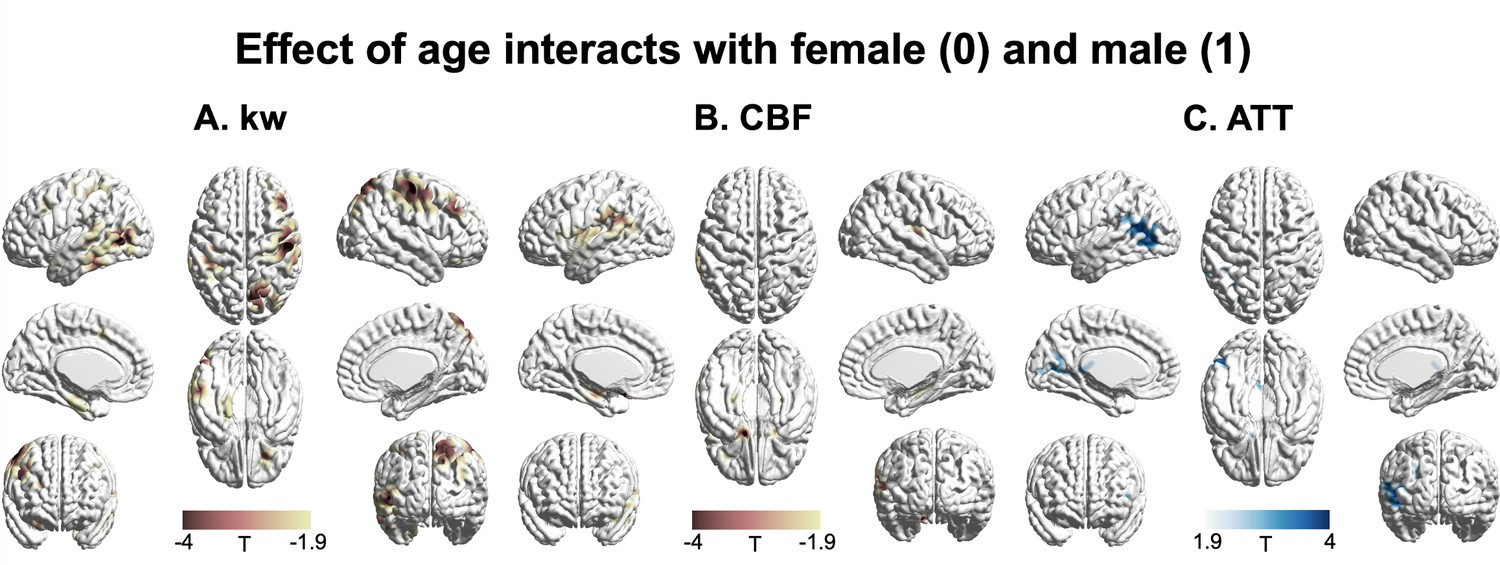
3D renderings of T maps illustrating the interaction effects of age with sex.
Highlighted areas indicate: (A) Accelerated decrease in kw with aging in males compared to females, most evident in the lateral prefrontal cortex, parietal, and lateral and medial temporal areas. (B) Accelerated decrease in cerebral blood flow (CBF) with aging in males compared to females, prominently observed in the supramarginal gyrus, hippocampus, and frontal areas. (C) Accelerated increase in arterial transit time (ATT) with aging in males compared to females, with marked changes in supramarginal gyrus, posterior temporal lobe, and calcarine sulcus. The distinct interaction patterns between age and sex across kw, CBF, and ATT can be observed. The color scale denotes T values. Clusters comprising over 501 voxels and possessing an absolute T value exceeding 1.90 are deemed significant and showcased in the figure. The effects of decrease or increase were represented by warm colors (yellow to red) and cold (gray to blue) colors, respectively.
Author response image 1

Step 1: Loading raw data and calculate T1 map.
Author response image 2

Step 2: Motion correction and skull stripping.
Author response image 3

Step 3: kw, CBF and ATT quantification (nii files will be saved).
Additional files
-
Supplementary file 1
Supplementary tables.
(a) Analysis of age and sex-dependent kw variations in 14 brain regions using MARS. Threshold ages when kw starts declining have been identified. The age ×sex interaction terms being negative suggest a more pronounced decline in kw in males compared to females. For females, the post-threshold age kw decline slope is presented with 95% confidence intervals (CI) and P values. The male kw decline slopes were estimated from the female slope and the age ×sex interaction. Entries labeled 'N.A. (N.S.)' indicate non-significant changes. (b) Analysis of age and sex dependent CBF variations in 14 brain regions using MARS. Threshold ages where CBF slope changes occur were identified. A negative age ×sex interaction term was detected only in the hippocampus, suggesting a more pronounced CBF decline in males compared to females. In other brain regions, the rate of CBF decline with age is largely similar between males and females, although males consistently exhibit lower CBF. For both males and females, the CBF decline slopes before and after the threshold age are presented with 95% confidence intervals (CIs) and P values. (c) Analysis of age and sex dependent ATT variations in 14 brain regions using MARS. Threshold ages where ATT slope changes occur were identified. The rate of ATT increase with age is largely similar between males and females, although males consistently exhibit longer ATT. For both males and females, the ATT increase slopes before and after the threshold age are presented with 95% confidence intervals (CIs) and P values. (d) Voxel-wise analysis of age trend in kw. Brain regions with significant negative correlations between kw and age with corresponding location (AAL template), cluster size, T values, and P values. (e) Voxel-wise analysis of age and sex effect in kw, CBF, and ATT. Brain regions with significant age ×sex effects in kw, CBF, and ATT with corresponding locations (AAL template), cluster sizes, T values, and P values. (f) Association between kw and CBF or ATT in 14 brain regions for participants aged between 8–61 years and 62–92 years. Linear regressions incorporating sex as a covariate were conducted, and the estimated coefficients were presented with 95% confidence intervals (CI) and P values.
- https://cdn.elifesciences.org/articles/96155/elife-96155-supp1-v1.docx
-
MDAR checklist
- https://cdn.elifesciences.org/articles/96155/elife-96155-mdarchecklist1-v1.docx
Download links
A two-part list of links to download the article, or parts of the article, in various formats.
Downloads (link to download the article as PDF)
Open citations (links to open the citations from this article in various online reference manager services)
Cite this article (links to download the citations from this article in formats compatible with various reference manager tools)
Age-related decline in blood-brain barrier function is more pronounced in males than females in parietal and temporal regions
eLife 13:RP96155.
https://doi.org/10.7554/eLife.96155.3


