Circadian regulation of endoplasmic reticulum calcium response in cultured mouse astrocytes
- Neuroscience Graduate Program, Department of Biomedical Sciences, Ajou University Graduate School of Medicine, Republic of Korea
- Department of Brain Science, Ajou University School of Medicine, Republic of Korea
- Interdisciplinary Program in Bioinformatics, Seoul National University, Republic of Korea
- Department of Psychiatry, Ajou University School of Medicine, Republic of Korea
- Department of Oral Microbiology, College of Dentistry, Kyung Hee University, Republic of Korea
Figures
Figure 1 with 2 supplements
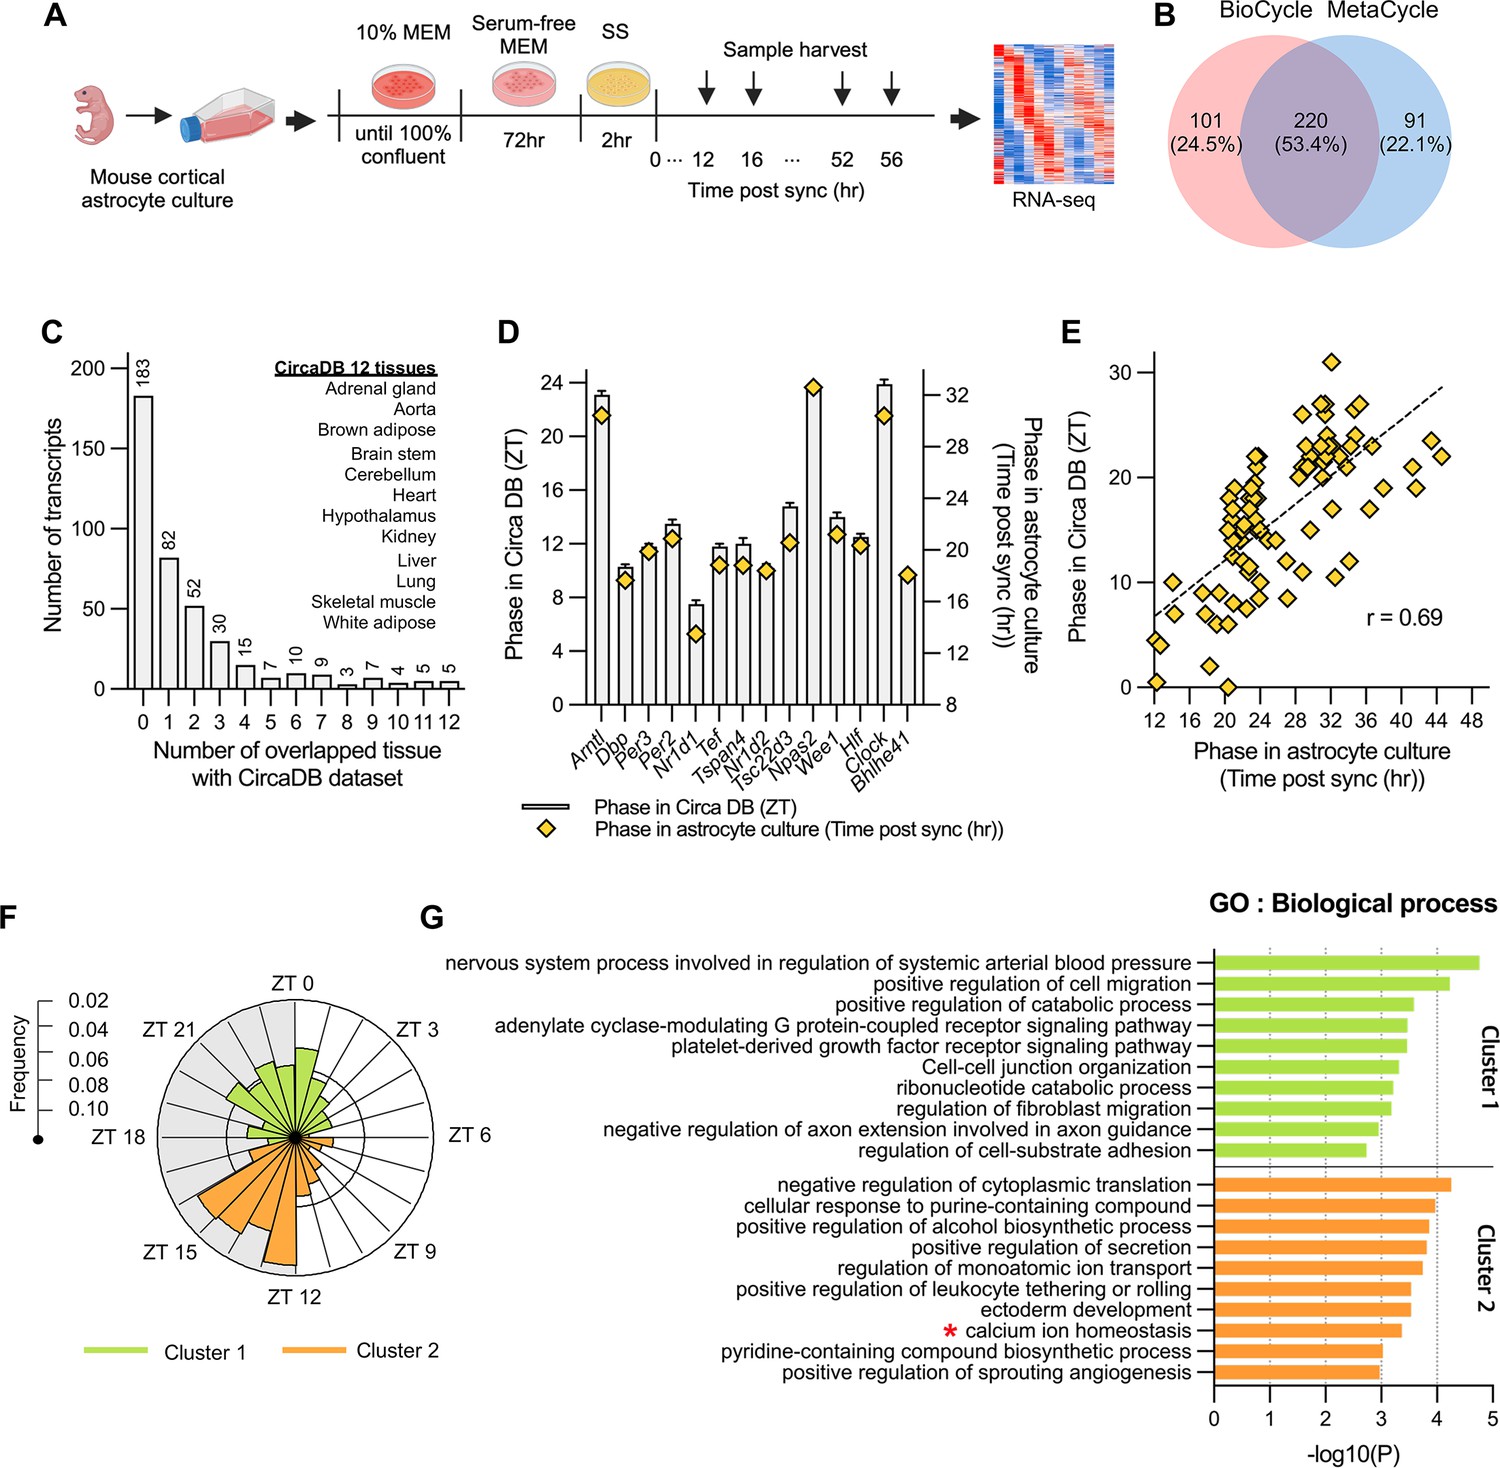
Circadian rhythmic transcripts in mouse cultured cortical astrocytes.
(A) Experimental scheme for synchronizing circadian rhythms in mouse cultured cortical astrocytes followed by RNA-sequencing over 2 days. (B) Venn diagram displaying the number of circadian rhythmic transcripts identified by two algorithms (q<0.05 in MetaCycle or BioCycle). (C) Number of transcripts that overlapping with 12 tissues in mouse circadian transcriptome ss from CircaDB (http://circadb.hogeneschlab.org). (D) Comparison of mean phase (ZT) from CircaDB and peak phase (Time post sync) from cultured astrocytes for 14 transcripts that are rhythmic in 10 or more tissues. (E) Scatter plot showing phase in CircaDB and peak phase of cultured astrocytes for transcripts that are rhythmic in one tissue. (F) Radial histogram of the distribution of phases of rhythmic genes in the astrocyte transcriptome. (G) Top 10 enriched GO Biological Process (BP) terms for significant circadian rhythmic genes in astrocytes (p<0.01) identified by Metascape (https://metascape.org). Panel A was created with BioRender.com.
Figure 1—figure supplement 1
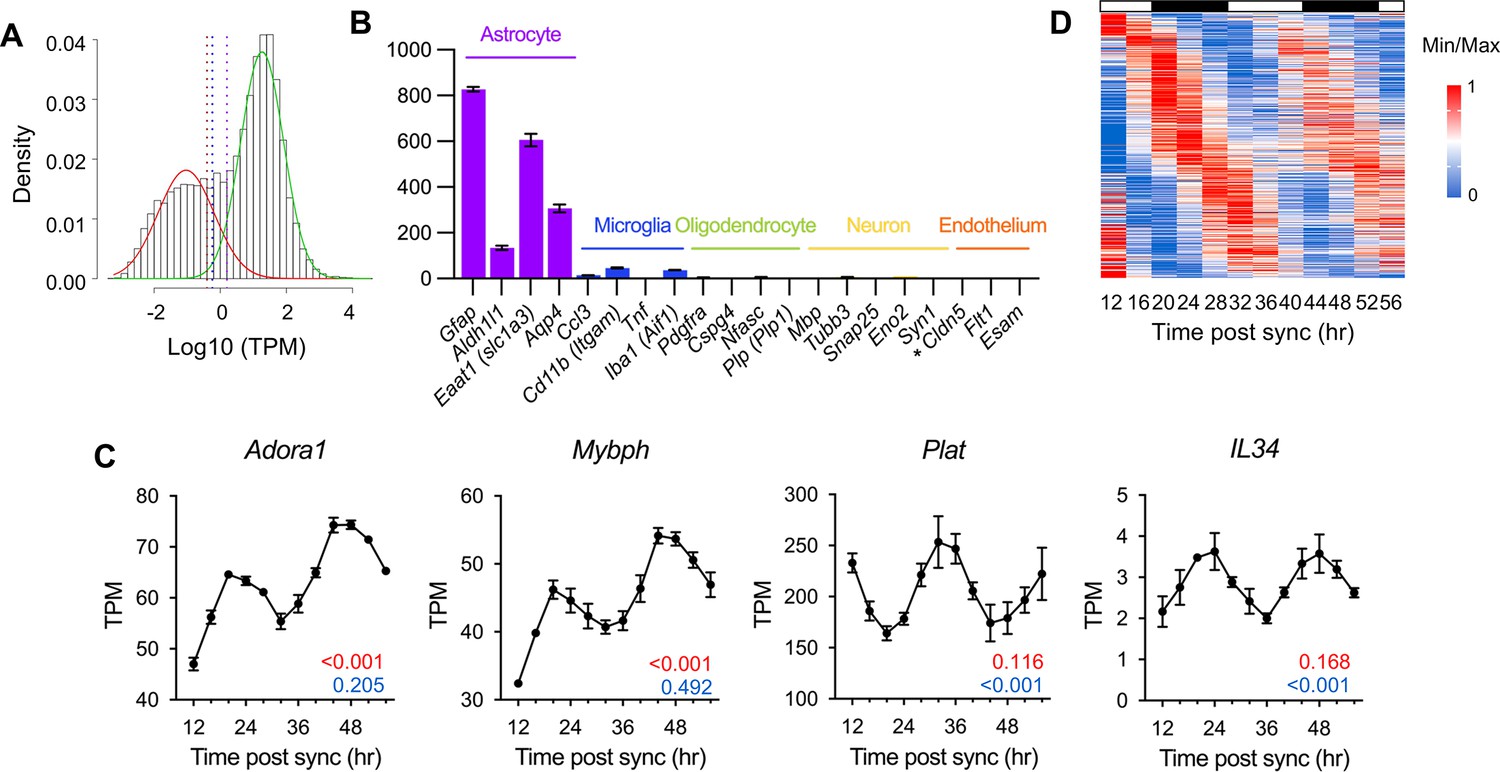
Identification of circadian rhythmic transcripts in mouse cultured astrocytes.
(A) Histogram showing the distribution of mean expression levels of transcripts. Transcripts with low (red) and high (green) expression were identified using a Gaussian mixture model. Dashed vertical lines represent cut-off points for highly expressed transcripts: maroon line (99.5%, TPM 0.40), blue line (99.0%, TPM 0.57), and purple line (95.0%, TPM 1.59). (B) Time-averaged expression levels of marker genes for astrocytes, microglia, oligodendrocytes, neurons, and endothelial cells in astrocyte cultures. Values are mean TPM ± S.E.M (n=2); *, not detected. (C) Expression profiles of Plat, Il34, Adora1, and Mybph in SS-synchronized cultured astrocytes from RNA-seq data. The q-values for BioCycle (red) and MetaCycle (blue) are shown in the bottom right corner. (D) Heatmap of 412 candidate genes from RNA-seq data, ordered by MetaCycle phase. Expression levels were normalized using Min-Max normalization.
Figure 1—figure supplement 2
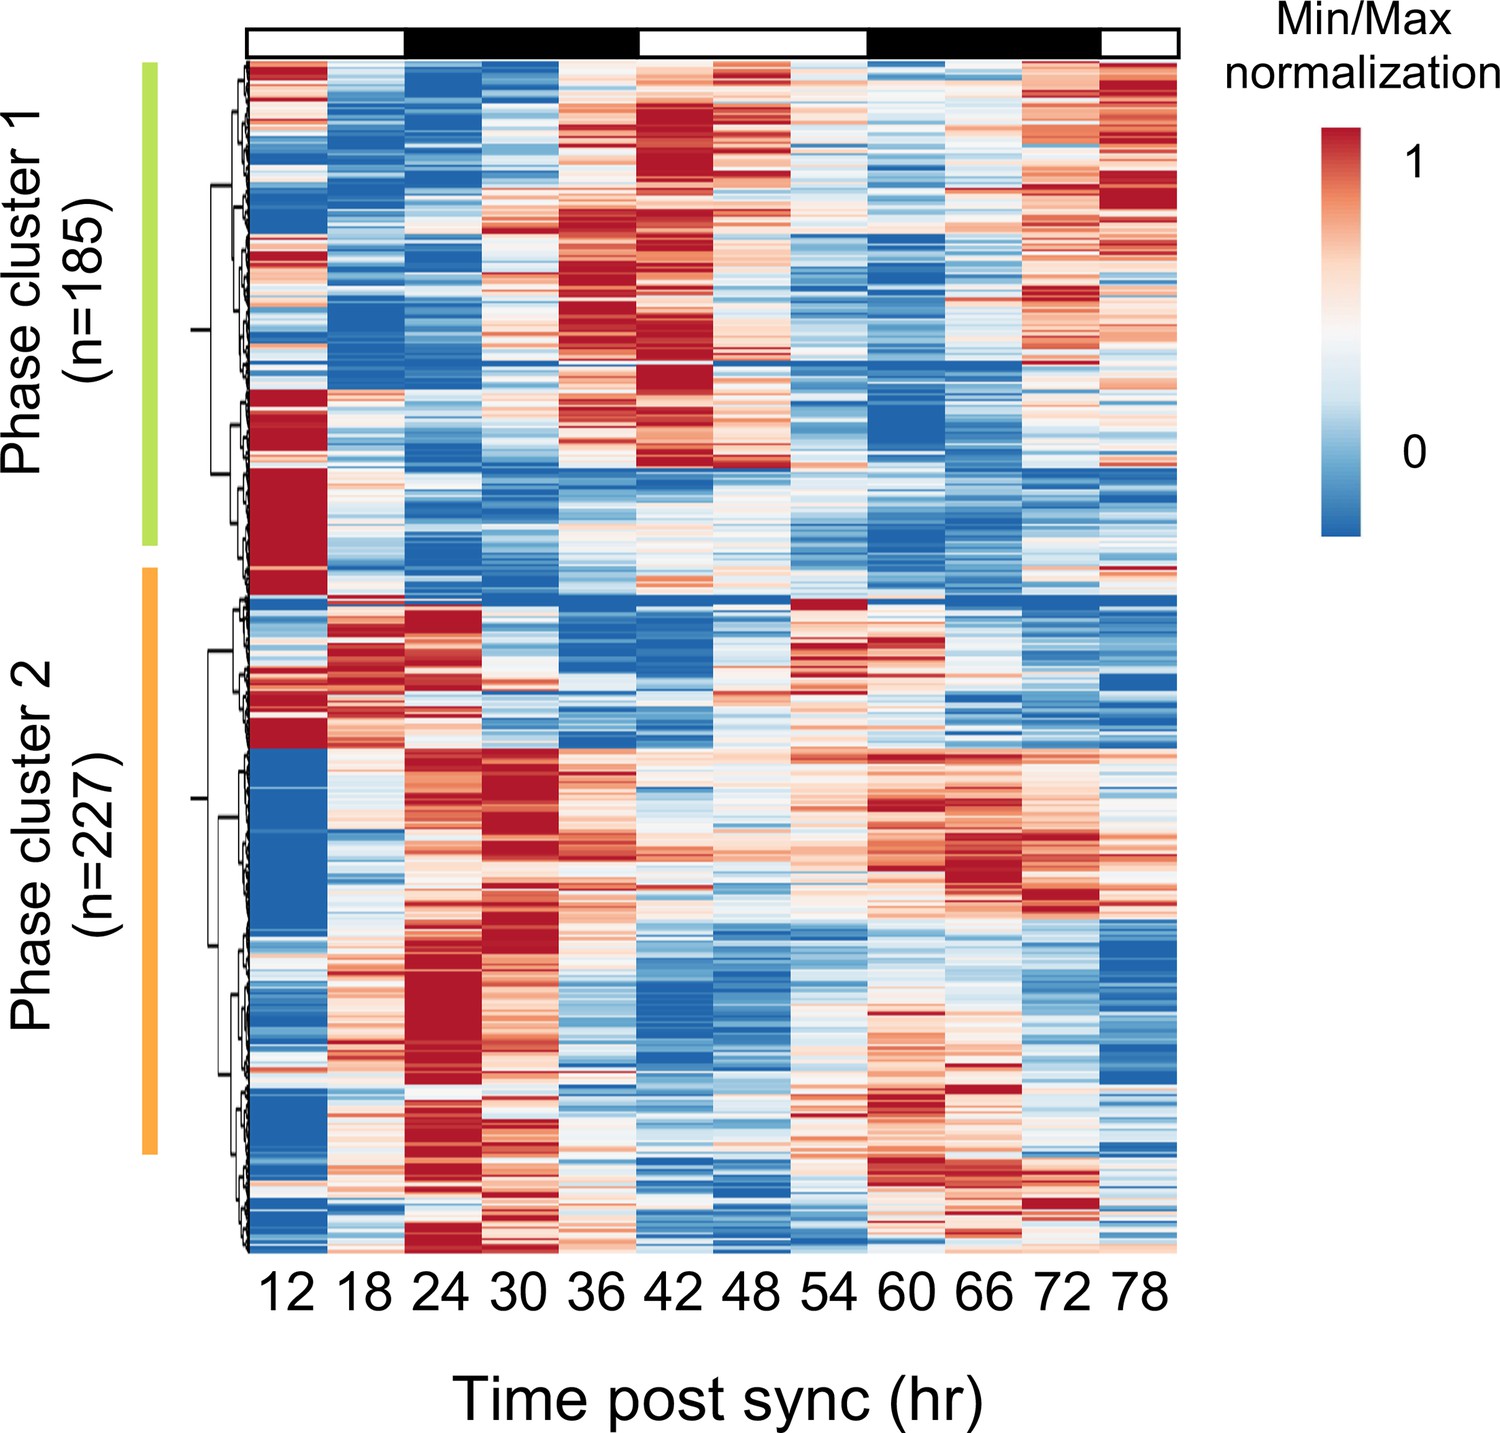
Cluster analysis of circadian rhythmic transcripts.
Cluster analysis of 412 candidate genes was performed using ClustVis (https://biit.cs.ut.ee/clustvis/; Metsalu and Vilo, 2015). Expression levels were normalized using Min-Max normalization. Green bar indicates Cluster 1; orange bar indicates Cluster 2.
Figure 2 with 1 supplement
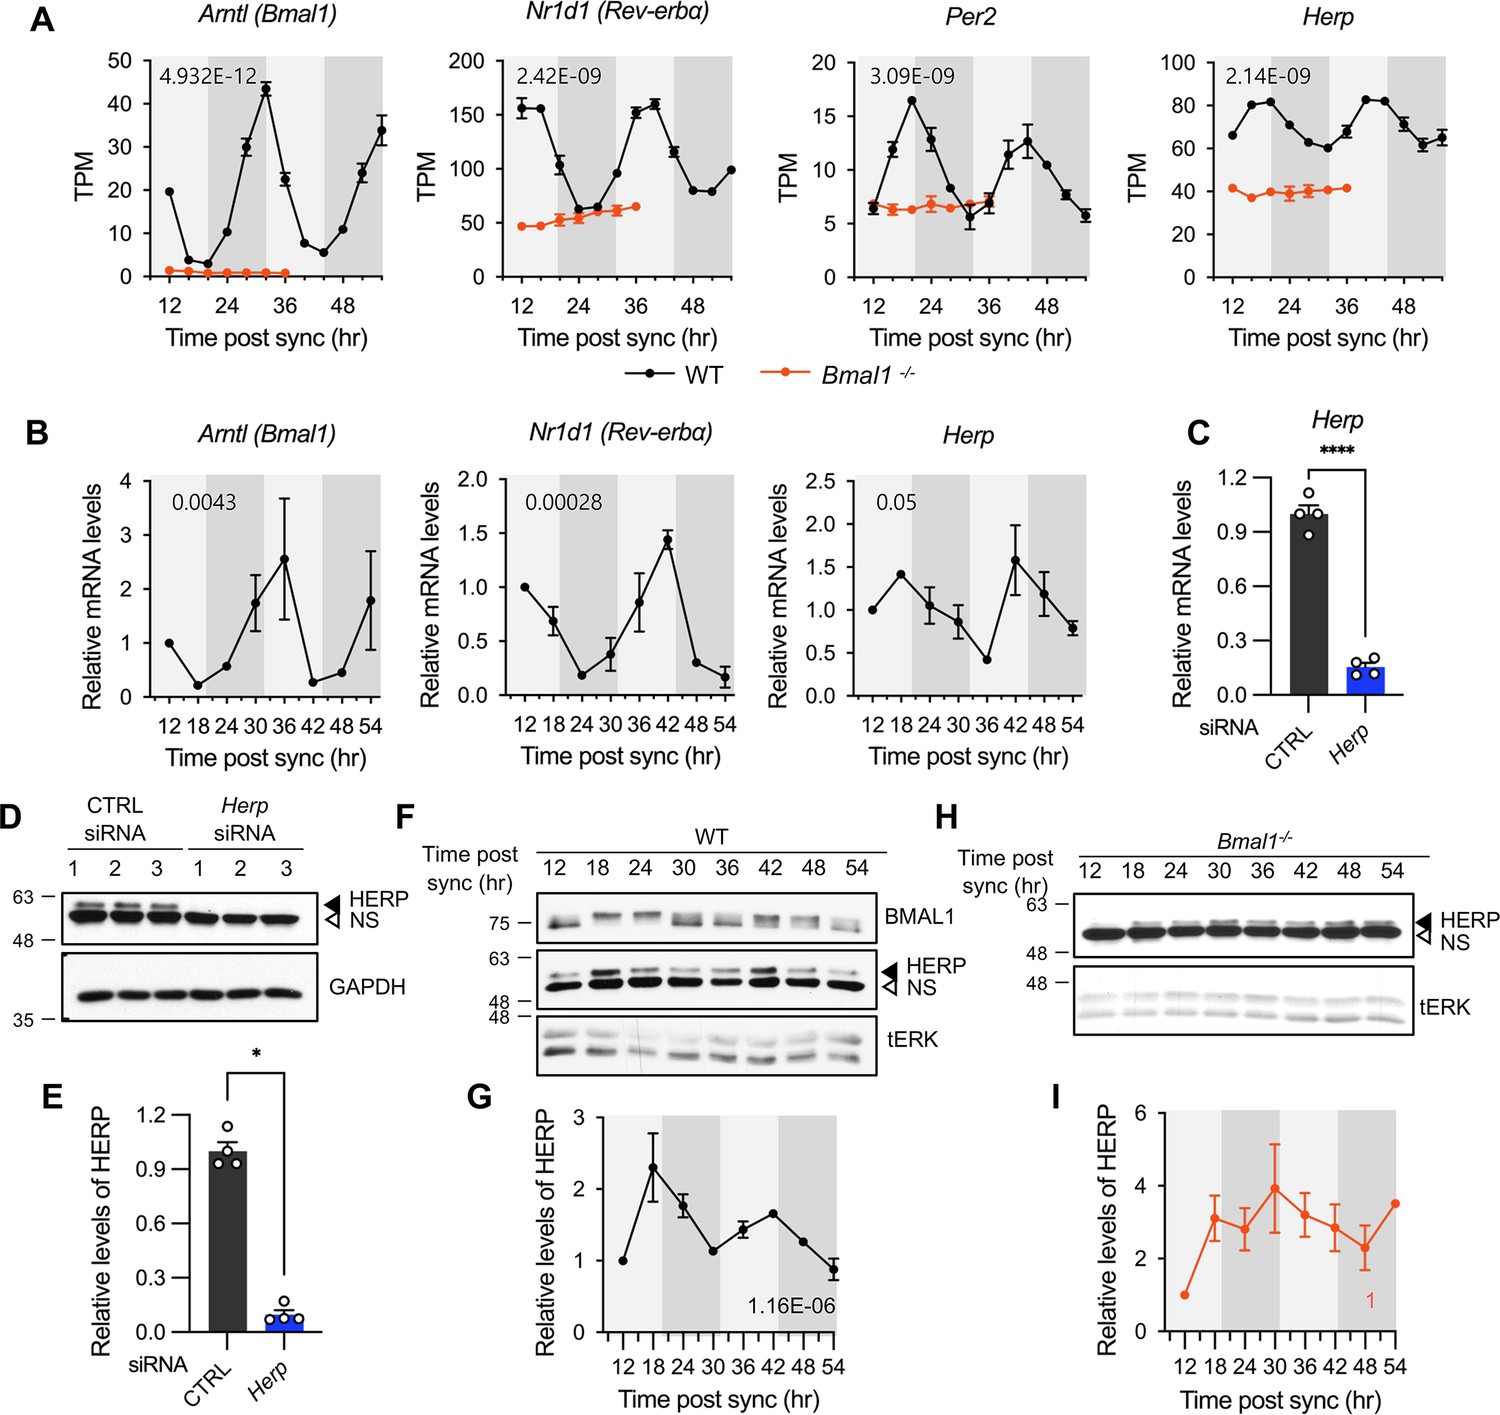
Herp is rhythmically expressed in mouse cultured astrocytes and its expression is controlled by BMAL1.
(A, B) Astrocyte cultures from rom WT (black) and Bmal1-/- (orange) mice were synchronized and harvested at the indicated time. Expression was analyzed for rhythmicity using MetaCycle, and expression levels of given genes were quantified using RNA-seq (A) and real-time qRT-PCR (B) data. Values are mean ± SEM (n=2; p-values are indicated by insets in graphs). Light gray and dark gray backgrounds represent subjective day and subjective night, respectively, based on the phase analysis from Figure 1D. (C–E) Cultured astrocytes were transfected with the indicated siRNA (20 nM) and processed for real-time qRT-PCR (C) and western blot (D, E) analyses at 48 hrs post transfection. (C) Values are mean ± SEM (n=4; *p<0.05, **p<0.005, ***p<0.0005, and ****p<0.00005; t-test). (D) Representative western blot images of four independent experiments are shown. GAPDH served as loading control. (E) Densitometric quantification of HERP levels, normalized to GAPDH levels. Values are mean ± SEM (n=4; ***p<0.0005; Mann-Whiteny U test). (F–I) Astrocyte cultures from rom WT (F, G) and Bmal1-/- (H, I) mice were synchronized and harvested at the indicated time for western blot analysis. Total ERK (tERK) served as a loading control. HERP/tERK values at different times were normalized to those at 12 hr post sync (set to 1). Meta2d p values are indicated by insets in graphs. Light gray and dark gray backgrounds represent subjective day and subjective night, respectively. (F) Representative western blot images from five independent experiments are shown. (H) Representative western blot images from two independent experiments are shown.
-
Figure 2—source data 1
PDF file containing original western blot for Figure 2D, indicating the relevant bands and treatments.
- https://cdn.elifesciences.org/articles/96357/elife-96357-fig2-data1-v1.zip
-
Figure 2—source data 2
Original files for western blot analysis displayed in Figure 2D.
- https://cdn.elifesciences.org/articles/96357/elife-96357-fig2-data2-v1.zip
-
Figure 2—source data 3
PDF file containing original western blot for Figure 2F, indicating the relevant bands and treatments.
- https://cdn.elifesciences.org/articles/96357/elife-96357-fig2-data3-v1.zip
-
Figure 2—source data 4
Original files for western blot analysis displayed in Figure 2F.
- https://cdn.elifesciences.org/articles/96357/elife-96357-fig2-data4-v1.zip
-
Figure 2—source data 5
PDF file containing original western blot for Figure 2H, indicating the relevant bands and treatments.
- https://cdn.elifesciences.org/articles/96357/elife-96357-fig2-data5-v1.zip
-
Figure 2—source data 6
Original files for western blot analysis displayed in Figure 2H.
- https://cdn.elifesciences.org/articles/96357/elife-96357-fig2-data6-v1.zip
Figure 2—figure supplement 1
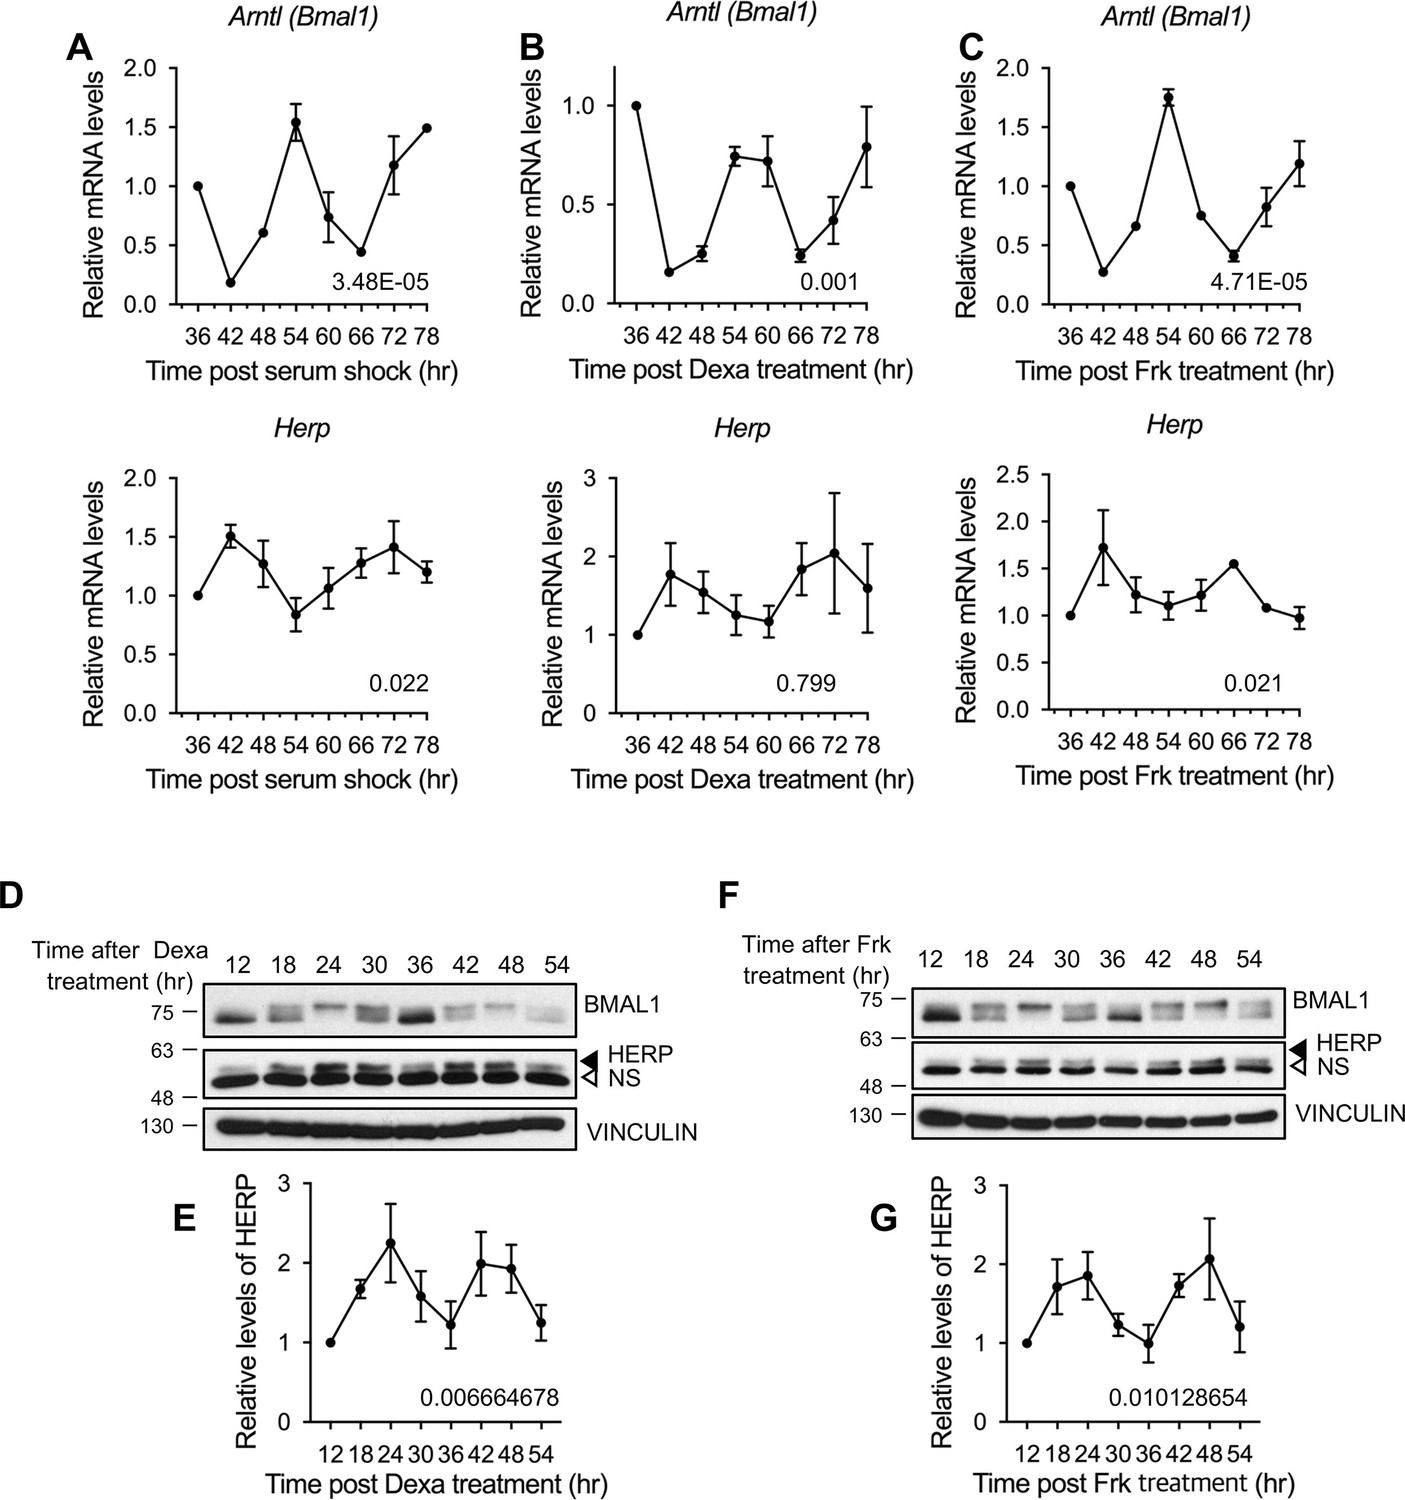
Herp is rhythmically expressed in mouse cultured astrocytes synchronized by forskolin or dexamethasone.
Astrocytes were synchronized using 50% horse serum (A), 100 nM dexamethasone (B, D–E), or 10 μM forskolin (C, F–G), and harvested at the indicated times. (A–C) Real-time qRT-PCR was performed to examine mRNA levels of the indicated genes (D–G) Western blot analysis for BMAL1 and HERP was conducted, with VINCULIN as a loading control. HERP/VINCULIN values at different times were normalized to those at 12 hrs post-shock (set to 1). (D, F) Representative Western blot images from three independent experiments. (E, G) Densitometric quantification of Western blots. Rhythmicity was analyzed using MetaCycle. Meta2d p values are indicated by insets in graphs. Values are mean ± SEM (n=3); p-values are indicated in the graph insets.
-
Figure 2—figure supplement 1—source data 1
PDF file containing original western blot for Figure 2—figure supplement 1F, indicating the relevant bands and treatments.
- https://cdn.elifesciences.org/articles/96357/elife-96357-fig2-figsupp1-data1-v1.zip
-
Figure 2—figure supplement 1—source data 2
Original files for western blot analysis displayed in Figure 2—figure supplement 1F.
- https://cdn.elifesciences.org/articles/96357/elife-96357-fig2-figsupp1-data2-v1.zip
-
Figure 2—figure supplement 1—source data 3
PDF file containing original western blot for Figure 2—figure supplement 1D, indicating the relevant bands and treatments.
- https://cdn.elifesciences.org/articles/96357/elife-96357-fig2-figsupp1-data3-v1.zip
-
Figure 2—figure supplement 1—source data 4
Original files for western blot analysis displayed in Figure 2—figure supplement 1D.
- https://cdn.elifesciences.org/articles/96357/elife-96357-fig2-figsupp1-data4-v1.zip
Figure 3 with 2 supplements
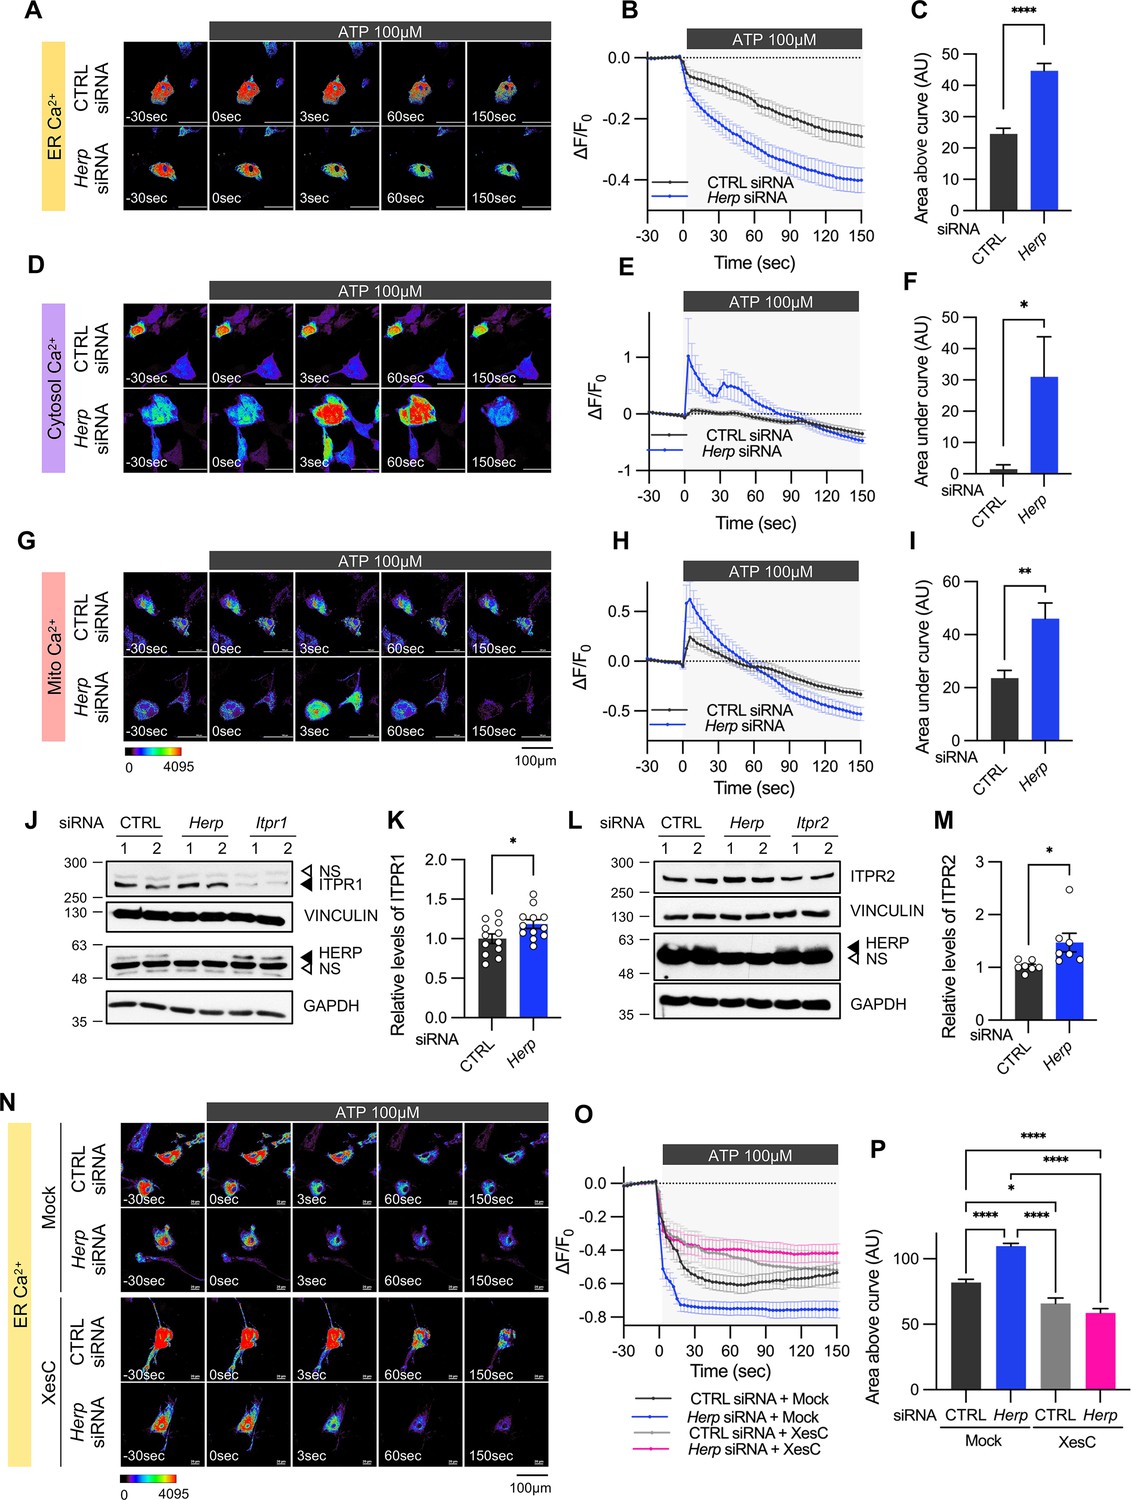
Herp knockdown altered ATP-induced ER Ca2+ response.
(A–I) Cultured astrocytes were co-transfected with 20 μM non-targeting (CTRL) siRNA or Herp siRNA together with G-CEPIA1er (A–C), R-GECO1 (D–F) or mito-R-GECO1 (G–I). At 48 hr post transfection, cultured astrocytes were treated with 100 µM ATP and Ca2+ imaging analysis was performed. Images were acquired every 3 seconds. (A, D, G) Representative time-lapse images of each Ca2+ indicator. (B, E, H) ΔF/F0 values over time following ATP application. (C, F, I) Area above or area under the curve values, calculated from panels B, E, and H. (A–C) CTRL siRNA, n=19; Herp siRNA, n=22. (D–F) CTRL siRNA, n=20; Herp siRNA, n=25. (G–I) CTRL siRNA, n=16; Herp siRNA, n=16. (J–M) Cultured astrocytes were transfected with the indicated siRNA (20 nM) and processed for Western blot analysis 48 hr post transfection. Vinculin and GAPDH served as loading control for ITPRs and HERP, respectively. (J) Representative western blot images from twelve independent experiments are shown. NS, non-specific band (K) Densitometric quantification of western blot data showing relative levels of ITPR1 in Herp siRNA-transfected astrocytes compared to CTRL siRNA transfected astrocytes. (L) Representative Western blot images from five independent experiments. (M) Densitometric quantification of western blot data showing relative levels of ITPR2 in Herp siRNA-transfected astrocytes compared to Control astrocytes. Values are mean ± SEM (*p<0.05, **p<0.005, ***p<0.0005, ****p<0.00005; t-test). (N–P) Cultured astrocytes were treated with 10 μM Xestospongin C (XesC), an IP3R inhibitor, for 30 min before live imaging. Cells were then treated with 100 μM ATP, and images were captured every 3 s. (N) Representative time-lapse images of ER Ca2+ indicator. (O) ΔF/F0 values over time following ATP application. (P) Area above the curve values were calculated from panel O. CTRL siRNA + Mock, n=9; Herp siRNA + Mock, n=9; CTRL siRNA + XesC, n=8; Herp siRNA + XesC, n=14. Values are means ± SEM (*p<0.05, **p<0.005, ***p<0.0005, ****p<0.00005; one-way ANOVA).
-
Figure 3—source data 1
PDF file containing original western blot for Figure 3J, indicating the relevant bands and treatments.
- https://cdn.elifesciences.org/articles/96357/elife-96357-fig3-data1-v1.zip
-
Figure 3—source data 2
Original files for western blot analysis displayed in Figure 3J.
- https://cdn.elifesciences.org/articles/96357/elife-96357-fig3-data2-v1.zip
-
Figure 3—source data 3
PDF file containing original western blot for Figure 3L, indicating the relevant bands and treatments.
- https://cdn.elifesciences.org/articles/96357/elife-96357-fig3-data3-v1.zip
-
Figure 3—source data 4
Original files for western blot analysis displayed in Figure 3L.
- https://cdn.elifesciences.org/articles/96357/elife-96357-fig3-data4-v1.zip
Figure 3—figure supplement 1
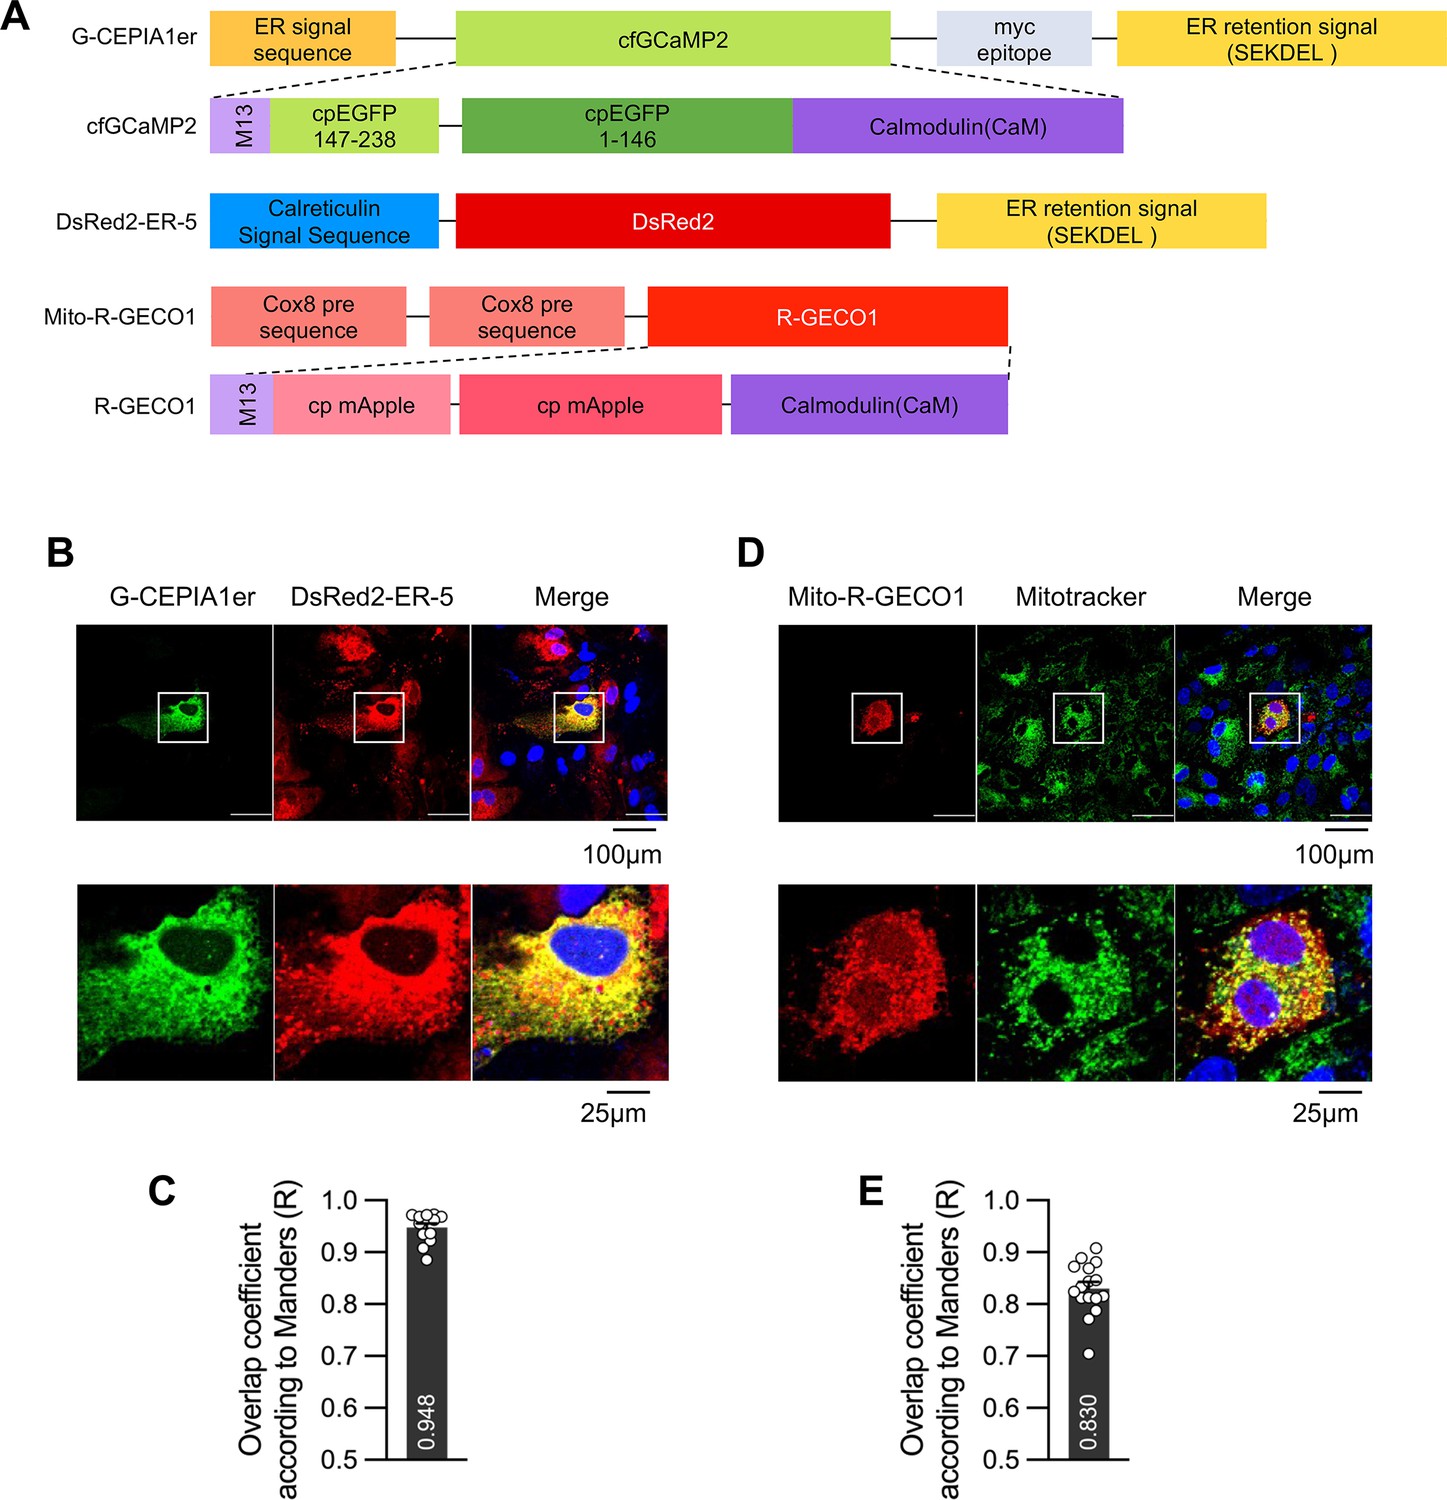
Co-localization of organelle-specific Ca2+ sensors with organelle markers.
(A) Schematic diagram showing organelle-specific Ca2+ sensors and DsRed2-ER-5. Astrocytes were transfected with Ca2+ sensors specific for G-CEPIA1er (B, C) or mito-R-GECO1 (D, E). (B, C) G-CEPIA1er was co-transfected with DsRed2-ER-5 containing calreticulin signal sequence. Live-cell imaging was performed 48 hr post transfection. (D, E) Mito-R-GECO1 was transfected, and live-cell imaging was performed 48 hr post transfection. Before imaging, 200 nM Mitotracker was applied for 30 min to stain the mitochondria. (C, E) The overlap coefficient (Manders' R value) was calculated from the images. (B, C) n=13; (D, E) n=16.
Figure 3—figure supplement 2
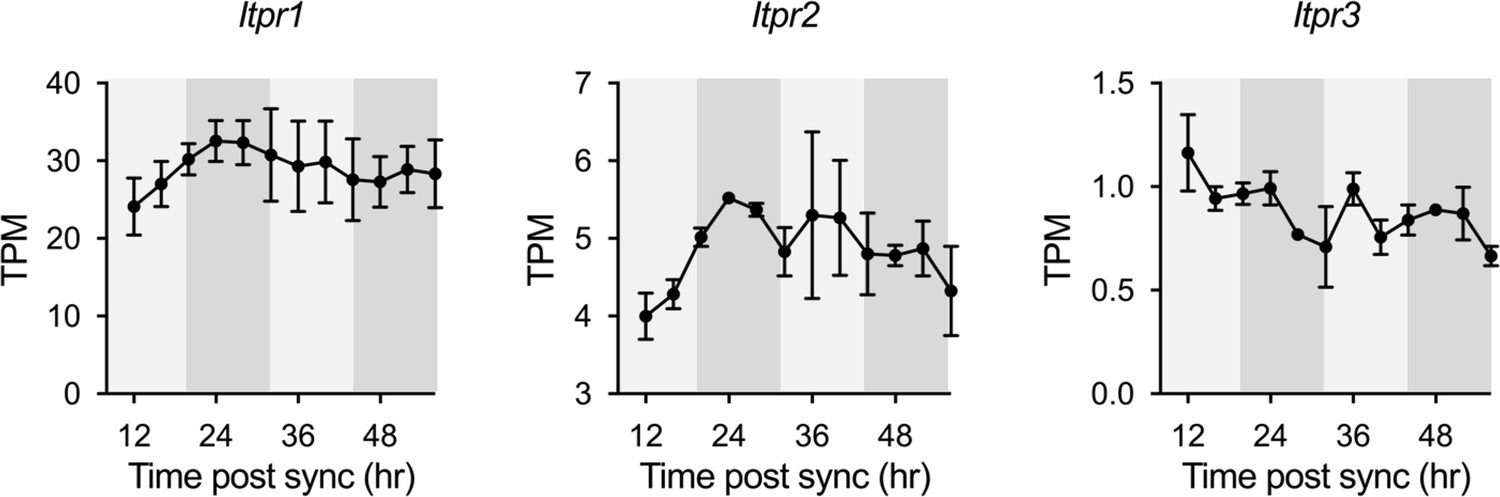
Expression profiles of Itpr1, Itpr2 and Itpr3 in cultured astrocytes from RNA-seq data.
White and gray backgrounds represent subjective day and subjective night, respectively.
Figure 4
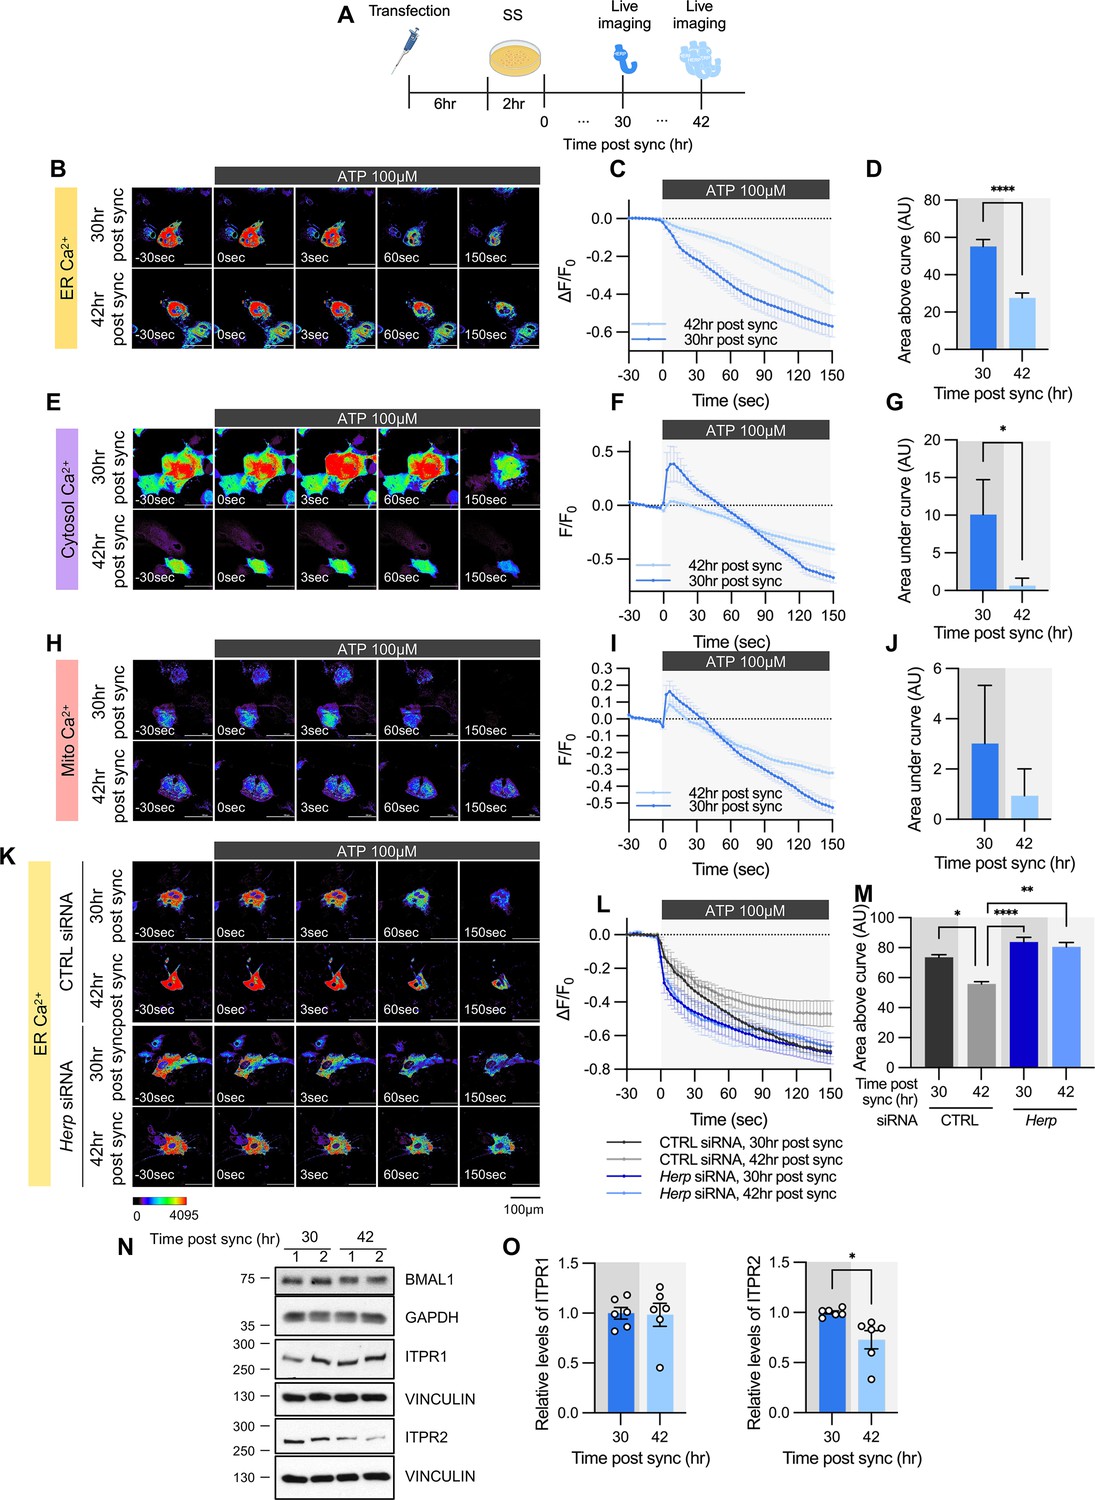
ATP-induced ER Ca2+ release varies according to time post sync.
(A) Schematic diagram of the experimental scheme from transfection to live-cell Ca2+ imaging at different times. (B–M) Cultured astrocytes were transfected with G-CEPIA1er (B–D, K–M), R-GECO1 (E–G), or mito-R-GECO1 (H–J) compartment-specific Ca2+ indicators (denoted at left) and then their circadian rhythm was synchronized by SS. (K–M) The indicated siRNA was co-transfected with the ER Ca2+ indicator. After transfection, cells were allowed 48 hr for the siRNA to take effect and stabilize before synchronization by serum shock. At the indicated times, astrocytes were treated with 100 µM ATP and Ca2+ imaging was performed. (B, E, H, K) Representative time-lapse images of each Ca2+ indicator. (C, F, I, L) ΔF/F0 values over time following ATP application. (D, G, J, M) Area above or area under the curve values, calculated from panels C, F, I, and L. (B–D) 30 hr post sync, n=24; 42 hr post sync, n=19. (E–G) 30 hr post sync, n=33; 42 hr post sync, n=38. (H–J) 30 hr post sync, n=50; 42 hr post sync, n=54. (K–M) CTRL siRNA, 30 hr post sync, n=5; CTRL siRNA, 42 hr post sync, n=4; Herp siRNA, 30 hr post sync, n=11; Herp siRNA, 42 hr post sync, n=5. Values in graphs are mean ± SEM (*p<0.05, ****p<0.00005); (D, G, J) t-test, (M) one-way ANOVA. (N–O) Cells were harvested at the indicated times and processed for western blot analysis. Vinculin and GAPDH served as loading controls for ITPR and BMAL1, respectively. (N) Representative western blot images from six independent experiments. (O) Densitometric quantification of western blot data showing relative levels of ITPR1 and ITPR2 at different times. Values in graphs are mean ± SEMs (*p<0.05, ****p<0.00005; t-test). Panel A was created with BioRender.com.
-
Figure 4—source data 1
PDF file containing original western blot for Figure 4N, indicating the relevant bands and treatments.
- https://cdn.elifesciences.org/articles/96357/elife-96357-fig4-data1-v1.zip
-
Figure 4—source data 2
Original files for western blot analysis displayed in Figure 4N.
- https://cdn.elifesciences.org/articles/96357/elife-96357-fig4-data2-v1.zip
Figure 5
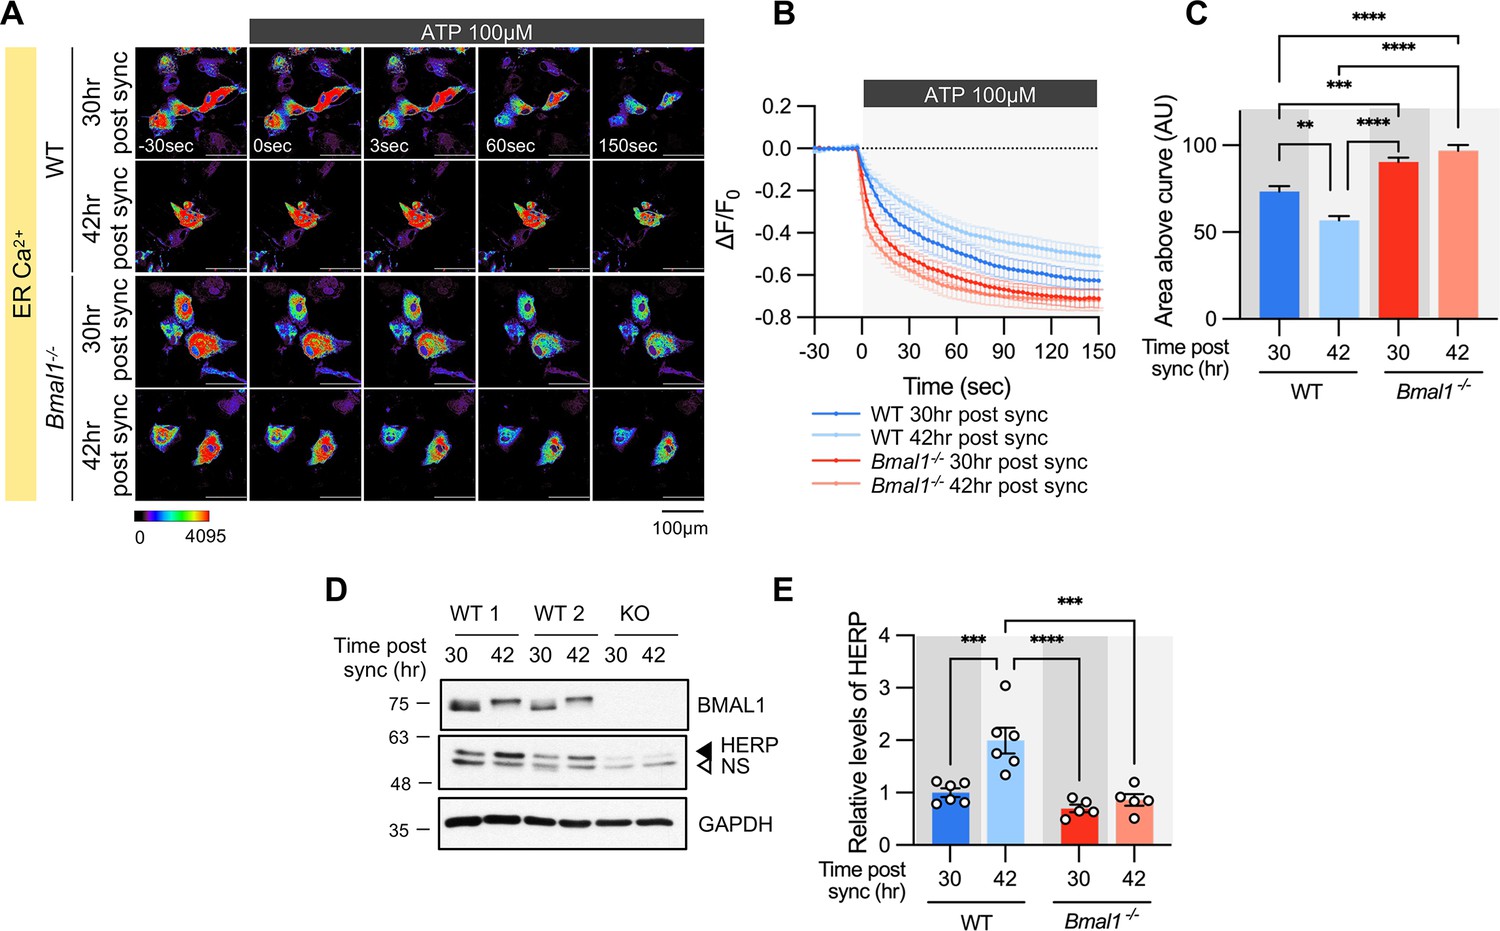
Time-dependent ER Ca2+ release is abolished in cultured astrocytes from Bmal1-/- mice.
Cultured astrocytes Bmal1-/- mice and WT littermates were transfected with G-CEPIA1er and then their circadian rhythm was synchronized by SS. At the indicated Time, astrocytes were treated with 100 μM ATP and Ca2+ imaging was performed. (A) Representative time-lapse images of ER Ca2+ indicator. (B) ΔF/F0 values over time following ATP application. (C) Area above the curve values, calculated from panel B. (A–C) WT 30 hr post sync, n=17; WT 42 hr post sync, n=15; KO 30 hr post sync, n=19; KO 42 hr post sync, n=21. Values are mean ± SEM (*p<0.05, **p<0.005, ***p<0.0005, ****p<0.00005; one-way ANOVA). (D, E) Cultured astrocytes from Bmal1-/- mice and WT littermates were synchronized by SS. Cells were harvested at the indicated times and processed for western blot analysis. (D) Representative western blot images from six independent experiments. GAPDH served as a loading control. (E) Values are mean ± SEM (*p<0.05, **p<0.005, ***p<0.0005, ****p<0.00005; two-way ANOVA).
-
Figure 5—source data 1
PDF file containing original western blot for Figure 5D, indicating the relevant bands and treatments.
- https://cdn.elifesciences.org/articles/96357/elife-96357-fig5-data1-v1.zip
-
Figure 5—source data 2
Original files for western blot analysis displayed in Figure 5D.
- https://cdn.elifesciences.org/articles/96357/elife-96357-fig5-data2-v1.zip
Figure 6 with 1 supplement
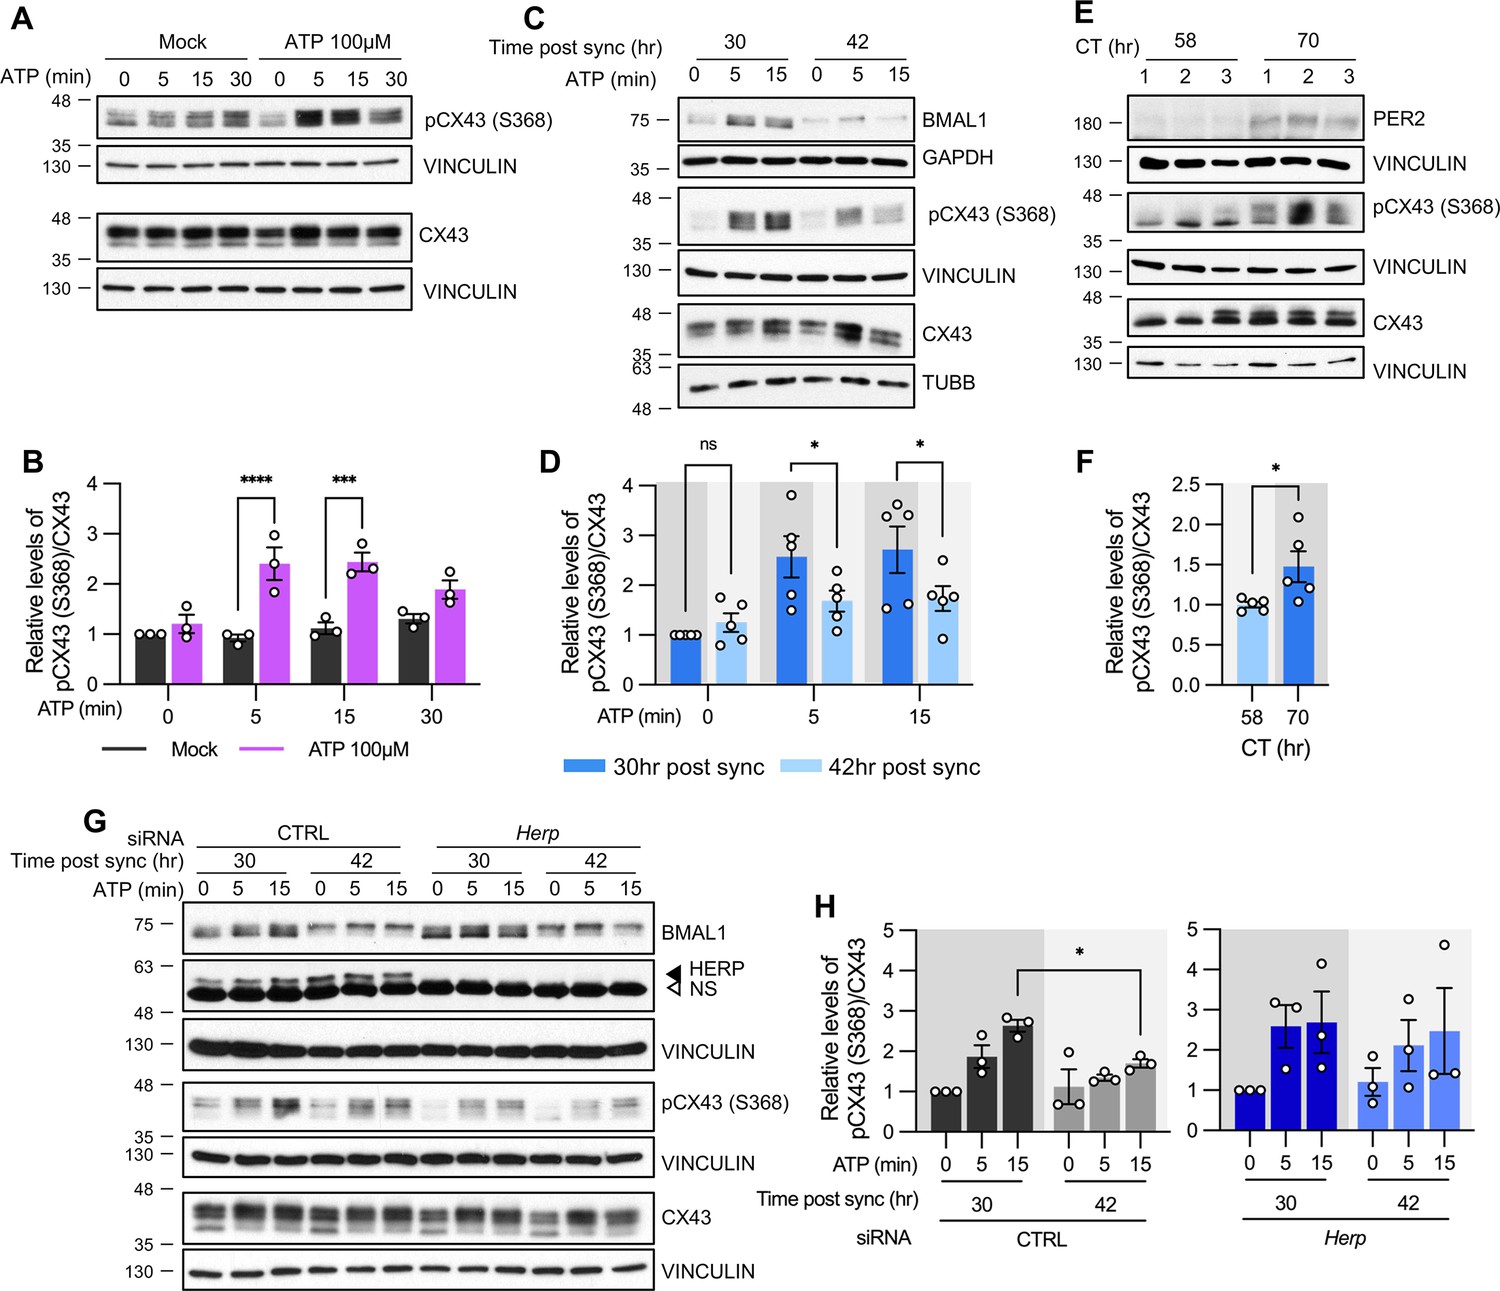
ATP-induced pCX43 (S368) levels varies according to time post sync.
(A–D, G, H) Cultured astrocytes with (C, D) or without (A, B) synchronization, were treated with 100 µM ATP either at 30 hr post sync or 42 hr post sync and processed for western blot analysis at the indicated times. Vinculin, GAPDH, and/or β-tubulin (TUBB) served as loading controls. The intensity of pCX43 (S368) and Cx43 for each sample was normalized to that of Vinculin. (A) Representative western blot images from more three independent experiments. Vinculin served as a loading control. (B) Densitometric quantification of western blot data, showing relative pCX43 (S368)/CX43 levels. Values are normalized to those for mock-treated samples at time zero (set to 1). (C) Representative western blot images from three independent experiments. Vinculin, GAPDH, and β-tubulin (TUBB) served as loading controls. (D) Densitometric quantification of western blot data, showing relative pCX43 (S368)/CX43 levels. Values are normalized to those for mock-treated samples at ATP zero for 30 hr post sync (set to 1). (E, F) Changes in CX43 phosphorylation in vivo. Mice were entrained to a 12 hr light/dark cycle followed by constant dark conditions. At the indicated times, the prefrontal cortex area was dissected and processed for western blot analysis. (E) Representative western blot images from three independent experiments. (F) Densitometric quantification of western blot data showing relative levels of pCX43 (S368). (G, H) 48 hr post siRNA transfection, cells were synchronized by serum shock. At the indicated times post sync, 100 μM ATP was treated and processed for Western blot analysis (G) Representative western blot images from three independent experiments. Vinculin served as a loading control. (H) Densitometric quantification of Western blot data, showing relative pCX43 (S368)/CX43 levels. Values are normalized to those for 30 hr post sync at ATP zero (min) (set to 1). Values are mean ± SEM (*p<0.05, **p<0.005, ***p<0.0005, ****p<0.00005; (B, D, H) two-way ANOVA, (F) t-test).
-
Figure 6—source data 1
PDF file containing original western blot for Figure 6A, indicating the relevant bands and treatments.
- https://cdn.elifesciences.org/articles/96357/elife-96357-fig6-data1-v1.zip
-
Figure 6—source data 2
Original files for western blot analysis displayed in Figure 6A.
- https://cdn.elifesciences.org/articles/96357/elife-96357-fig6-data2-v1.zip
-
Figure 6—source data 3
PDF file containing original western blot for Figure 6C, indicating the relevant bands and treatments.
- https://cdn.elifesciences.org/articles/96357/elife-96357-fig6-data3-v1.zip
-
Figure 6—source data 4
Original files for western blot analysis displayed in Figure 6C.
- https://cdn.elifesciences.org/articles/96357/elife-96357-fig6-data4-v1.zip
-
Figure 6—source data 5
PDF file containing original western blot for Figure 6E, indicating the relevant bands and treatments.
- https://cdn.elifesciences.org/articles/96357/elife-96357-fig6-data5-v1.zip
-
Figure 6—source data 6
Original files for western blot analysis displayed in Figure 6E.
- https://cdn.elifesciences.org/articles/96357/elife-96357-fig6-data6-v1.zip
-
Figure 6—source data 7
PDF file containing Original western blot for Figure 6G, indicating the relevant bands and treatments.
- https://cdn.elifesciences.org/articles/96357/elife-96357-fig6-data7-v1.zip
-
Figure 6—source data 8
Original files for western blot analysis displayed in Figure 6G.
- https://cdn.elifesciences.org/articles/96357/elife-96357-fig6-data8-v1.zip
Figure 6—figure supplement 1
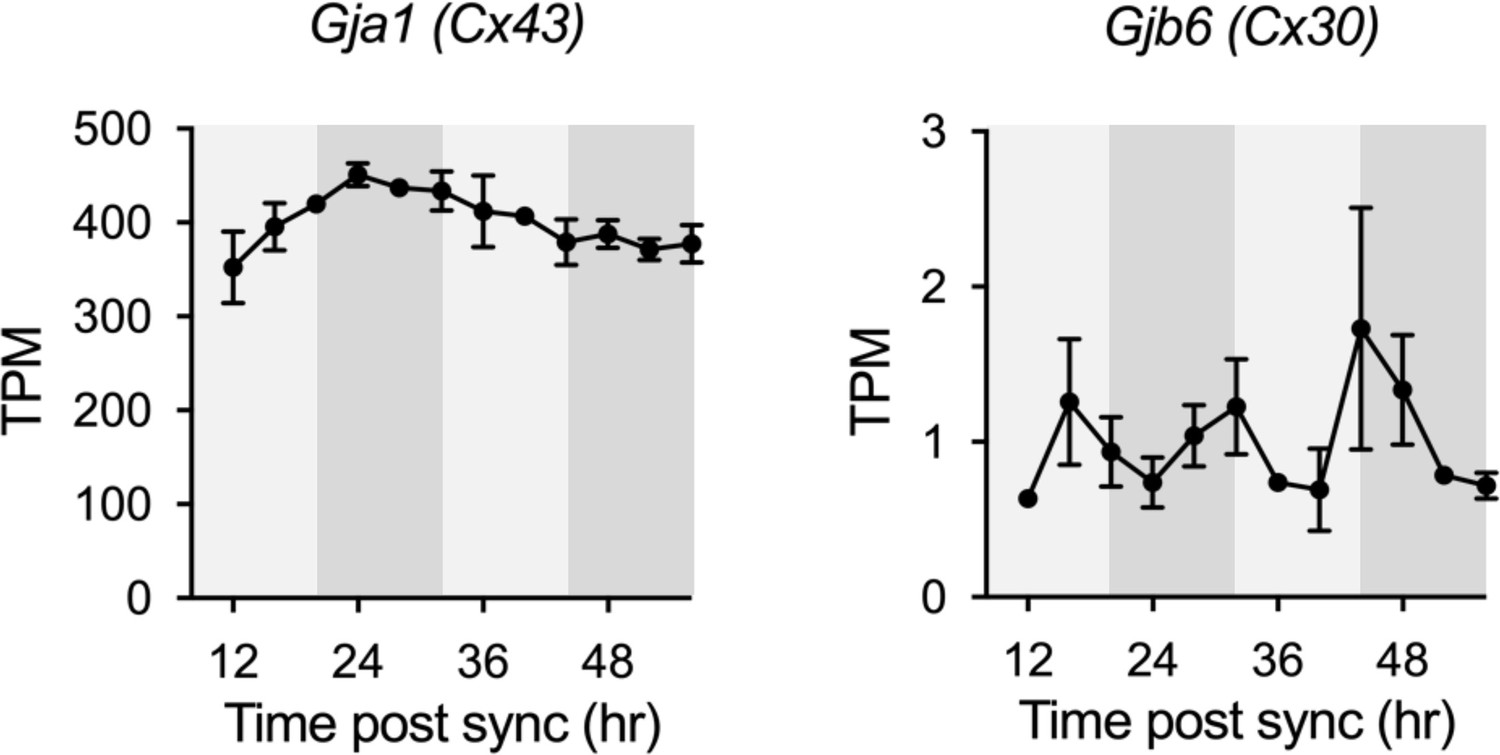
Expression profiles of Cx43 and Cx30 in cultured astrocytes from RNA-seq data.
White and gray backgrounds represent subjective day and subjective night, respectively.
Figure 7
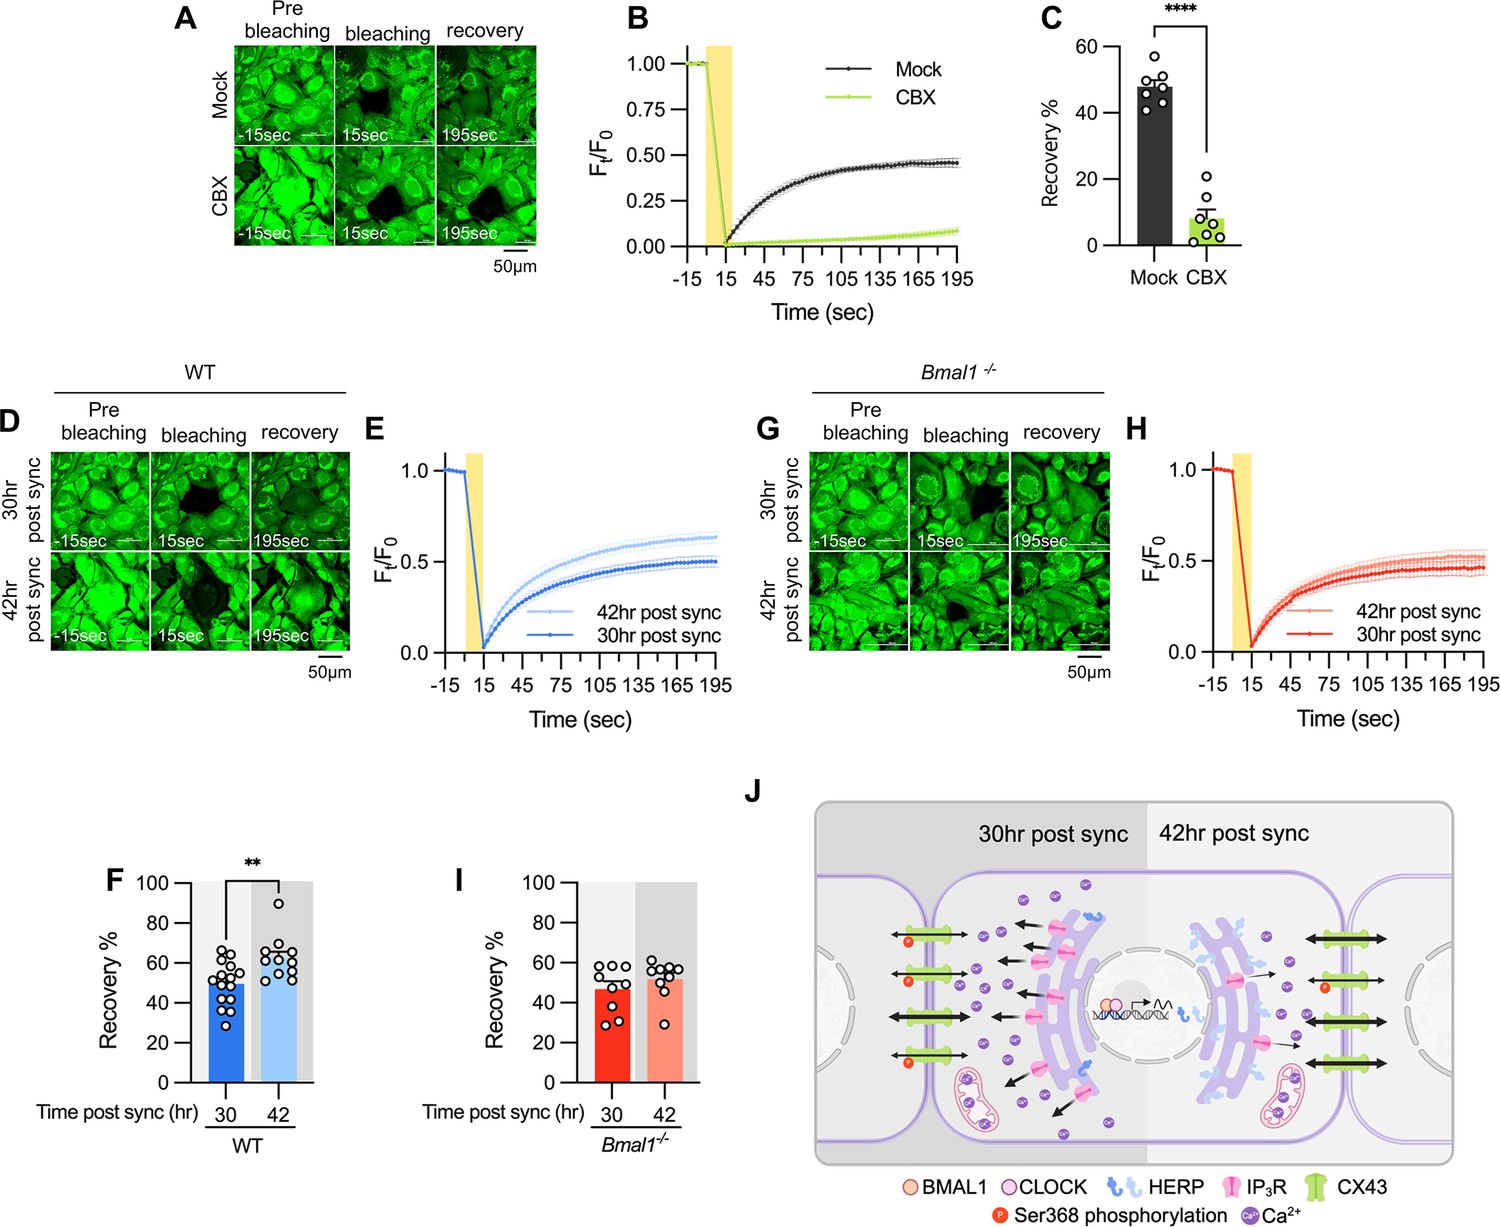
Gap junction conductance varies according to time post sync.
(A–C) 20 μM carbenoxolone (CBX), a gap junction channel block, was applied to cultured astrocytes for 30 min before gap-FRAP analysis. (A) Representative time-lapse images of prebleaching, bleaching and recovery condition during gap-FRAP analysis. (B) Ft/F0 values over time following photobleaching (yellow rectangle). (C) Recovery % values, calculated from panel B. Mock, n=7; CBX, n=7. Values in graphs are mean ± SEM (*p<0.05, **p<0.005, ***p<0.0005, and ****p<0.00005; Mann-Whitney U test). (D–I) Cultured astrocytes from WT (D–F) and Bmal1-/- (G–I) mice were synchronized by SS. At the indicated time, gap-FRAP was performed. (D, G) Representative time-lapse images of prebleaching, bleaching and recovery condition during gap-FRAP analysis at 30 hr post sync and 42 hr post sync. (E, H) Ft/F0 values over time following photobleaching (yellow rectangle). (F, I) Recovery % values, calculated from panel H and L, respectively. (D–F) 30 hr post sync, n=15; 42 hr post sync, n=11. (G–I) 30 hr post sync, n=9; 42 hr post sync, n=9. Values in graphs are mean ± SEM (*p<0.05, **p<0.005, ***p<0.0005, and ****p<0.00005; F: t-test, I: Mann-Whiteny U test). (J) Schematic diagram illustrating the regulation of ER Ca2+ response by the circadian clock through rhythmic oscillation of HERP. Refer to the text for the detailed explanation. Panel J was created with BioRender.com.
Author response image 1

HERP levels were constant at CT58 and CT70.
(A, B) Mice were entrained under 12h:12h LD cycle and maintained in constant dark. Prefrontal cortices were harvested at indicated time and processed for Western blot analysis. Representative image shows three independent samples. (B) Quantification of HERP levels normalized to VINCULIN. Values in graphs are mean ± SEM (*p < 0.05, **p < 0.005, ***p < 0.0005, and ****p < 0.00005; t-test)
Author response image 2

Author response image 3

Cultured astrocytes were transfected with G-CEPIA1er ER and at 48hrs post transfection, cultured astrocytes were treated with various concentrations of ATP and Ca2+ imaging analysis was performed.
(A) ΔF/F0 values over time following ATP application. (B) Area above curve values. Values in graphs are mean ± SEM (*p < 0.05, **p < 0.005, ***p < 0.0005, and ****p < 0.00005; one-way ANOVA).
Tables
Key resources table
| Reagent type (species) or resource | Designation | Source or reference | Identifiers | Additional information |
|---|---|---|---|---|
| Gene (Mus musculus) | Herpud1 (Herp) | Mouse Genome Informatics | MGI:1927406 | |
| Gene (M. musculus) | Bmal1 | Mouse Genome Informatics | MGI:1096381 | |
| Gene (M. musculus) | Rev-Erbα (Nr1d1) | Mouse Genome Informatics | MGI:2444210 | |
| Gene (M. musculus) | Per2 | Mouse Genome Informatics | MGI:1195265 | |
| Gene (M. musculus) | Itpr1 | Mouse Genome Informatics | MGI:96623 | |
| Gene (M. musculus) | Itpr2 | Mouse Genome Informatics | MGI:99418 | |
| Gene (M. musculus) | Cx43 (Gja1) | Mouse Genome Informatics | MGI:95713 | |
| Strain, strain background (M. musculus, male) | C57BL/6 J | Charles River Japan | N/A | Adult PFC experiment |
| Strain, strain background (M. musculus, male and female) | B6.129-Bmal1tm1Bra/J | Jackson Laboratory | Cat# 009100; RRID:IMSR_JAX:009100 | Primary Bmal1 KO astrocyte culture |
| Strain, strain background (M. musculus, male and female) | 1 day old C75BL/6 N | Koatch | N/A | Primary WT astrocyte culture |
| Transfected construct (M. musculus) | CMV-G-CEPIA1er | Suzuki et al., 2014 | Addgene plasmid # 58215 | ER Ca2+ indicator |
| Transfected construct (M. musculus) | CMV-mito-R-GECO1 | Wu et al., 2013 | Addgene plasmid # 46021 | Mitochondria Ca2+ indicator |
| Transfected construct (M. musculus) | CMV-R-GECO1 | Zhao et al., 2011 | Addgene plasmid # 32444 | Cytosol Ca2+ indicator |
| Antibody | Rabbit polyclonal anti-Bmal1 | Abcam | Cat# ab93806; RRID:AB_10675117 | 1:2000 |
| Antibody | Rabbit monoclonal anti-Herpud1 | Abcam | Cat# ab150424; RRID:AB_2857374 | 1:1000 |
| Antibody | Rabbit polyclonal anti-ITPR1 | Alomone Labs | Cat# ACC-019; RRID:AB_2039923 | 1:1000 |
| Antibody | Rabbit polyclonal anti-ITPR2 | Alomone Labs | Cat# ACC-116; Lot: ACC116AN015; RRID:AB_2340910 | 1:1000 |
| Antibody | Rabbit polyclonal anti-Connexin43 | Sigma-Aldrich | Cat# C6219; RRID:AB_476857 | 1:5000 |
| Antibody | Rabbit polyclonal anti-phospho Connexin43(Ser368) | Cell Signaling Technology | Cat# 3511 S; RRID:AB_2110169 | 1:1000 |
| Antibody | Rabbit polyclonal anti-GAPDH | Novus | Cat# NB100-56875; RRID:AB_2107610 | 1:5000 |
| Antibody | Mouse monoclonal anti-Vinculin | Sigma-Aldrich | Cat# V4505; RRID:AB_477617 | 1:5000 |
| Antibody | Rabbit polyclonal anti-Total ERK | Cell Signaling Technology | Cat# 9102 S; RRID:AB_330744 | 1:5000 |
| Sequence-based reagent | Primer used for qRT-PCR | This paper | Supplementary file 2c: Table of primers used in quantitative RT-PCR | |
| Sequence-based reagent | ON-TARGETplus Non-targeting siRNA negative control #1 | Horizon Discovery | Cat# D-001810–01 | 20 nM |
| Sequence-based reagent | ON-TARGETplus Mouse Herpud1 siRNA | Horizon Discovery | Cat# L-049714–01 | 20 nM |
| Sequence-based reagent | ON-TARGETplus Mouse Itpr1 siRNA | Horizon Discovery | Cat# L-040933–00 | 20 nM |
| Sequence-based reagent | ON-TARGETplus Mouse Itpr2 siRNA | Horizon Discovery | Cat# L-041018–00 | 20 nM |
| Commercial assay or kit | RNeasy Plus Kits | QIAGEN | CAT# 74034 | |
| Chemical compound, drug | Xestospongin C (XesC) | Sigma-Aldrich | Cat# X2628 | 10 μM |
| Chemical compound, drug | Adenosine 5′-triphosphate disodium salt hydrate | Sigma-Aldrich | A7699; CAS: 34369-07-8 | 100 μM |
| Chemical compound, drug | Calcein-AM | Invitrogen | C1430; CAS: 148504-34-1 | 0.5 μM |
| Chemical compound, drug | 0.05% Pluronic-127 | Invitrogen | P6866; CAS: 9003-11-6 | 0.05% |
| Chemical compound, drug | Carbenoxolone disodium salt (CBX) | Sigma-Aldrich | C4790; CAS: 7421-40-1 | 20 μM |
| Software, algorithm | ImageJ | Schneider et al., 2012; https://imagej.nih.gov/ij/ | RRID:SCR_003070 | |
| Software, algorithm | GraphPad Prism 7 | GraphPad Software; https://www.graphpad.com/ | RRID:SCR_002798 | |
| Software, algorithm | Nikon Element | Nikon | V5.21.00; RRID:SCR_014329 | |
| Software, algorithm | Metacycle | Wu et al., 2016; https://CRAN.R-project.org/package=MetaCycle | RRID:SCR_025729 | |
| Software, algorithm | BioCycle | Agostinelli et al., 2016; http://circadiomics.igb.uci.edu | ||
| Other | Confocal Microscope | Nikon | A1R | |
| Other | HiSeq 2000 system | Illumina | N/A | |
| Other | Metascape | Zhou et al., 2019; https://metascape.org | RRID:SCR_016620 | |
| Other | ChIP-Atlas | Zou et al., 2022; Oki et al., 2018; https://chip-atlas.org | RRID:SCR_015511 | |
| Other | BioRender | https://www.biorender.com/ | RRID:SCR_018361 |
Additional files
-
Supplementary file 1
A total of 412 circadian rhythmic transcripts identified by MetaCycle or BioCycle, selected based on an FDR-corrected q-value <0.05.
- https://cdn.elifesciences.org/articles/96357/elife-96357-supp1-v1.xlsx
-
Supplementary file 2
Supplementary tables.
(A) A table of transcripts associated with the "Calcium ion homeostasis" GO term from the GO Biological Process analysis, ordered by ascending MetaCycle p-values. (B) A comprehensive list of all non-canonical E-boxes identified in the 6 kb upstream region of Herp through non-canonical E-box analysis. (C) Primer sequences used for quantitative RT-PCR.
- https://cdn.elifesciences.org/articles/96357/elife-96357-supp2-v1.docx
-
MDAR checklist
- https://cdn.elifesciences.org/articles/96357/elife-96357-mdarchecklist1-v1.pdf
Download links
A two-part list of links to download the article, or parts of the article, in various formats.
Downloads (link to download the article as PDF)
Open citations (links to open the citations from this article in various online reference manager services)
Cite this article (links to download the citations from this article in formats compatible with various reference manager tools)
Circadian regulation of endoplasmic reticulum calcium response in cultured mouse astrocytes
eLife 13:RP96357.
https://doi.org/10.7554/eLife.96357.3


