PVN-mPFC OT projections modulate pup-directed pup care or attacking in virgin mandarin voles
- Shaanxi Normal University, China
Figures
Figure 1
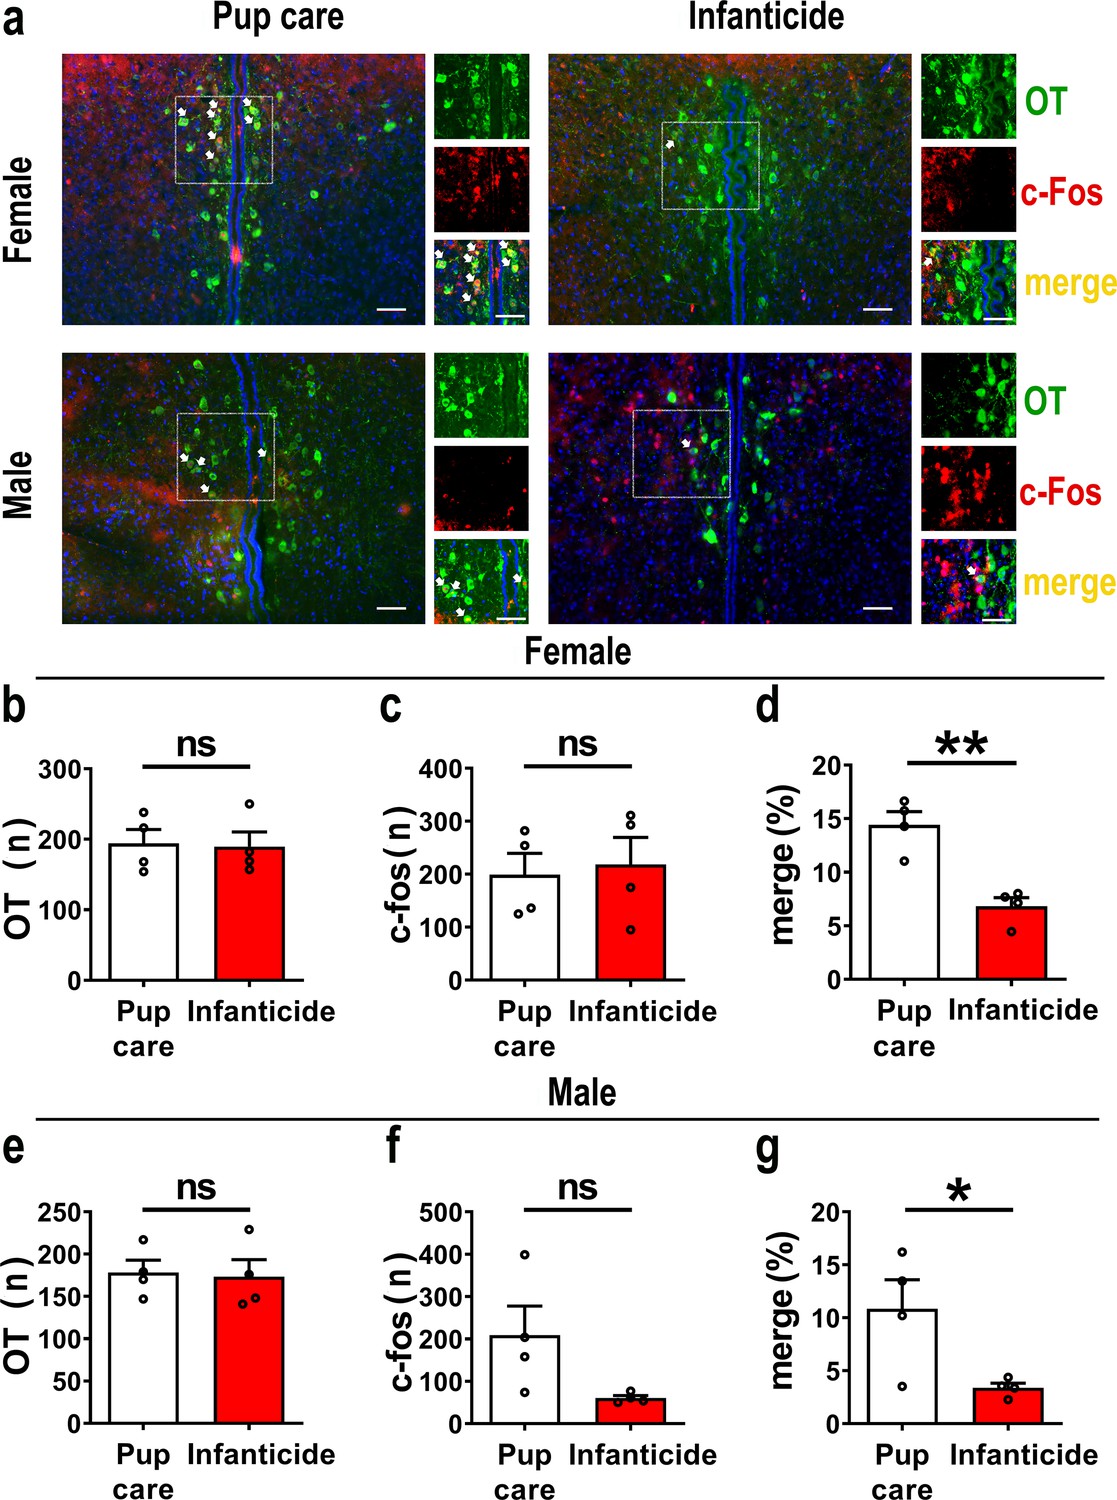
Activated oxytocin (OT) neurons in the paraventricular nucleus (PVN) of mandarin voles during pup care (n = 4) and infanticide (n = 4).
(a) Representative histological images of OT (green) and c-Fos (red)-positive cells in PVN: Blue, DAPI; yellow, merged cells. Enlarged views of the boxed area are shown on the right of each image, and white arrows indicate the overlap of OT and c-Fos-positive cells. Objective: ×20. Scale bars, 50 μm. (b) Number of OT-positive cells in pup care and infanticide female voles. (c) Number of c-Fos-positive cells in pup care and infanticide female voles. (d) Percentage of c-Fos-expressing cells in OT cells of PVN from pup care and infanticide female voles. **p<0.01. Independent-samples t-tests. (e) Number of OT cells in pup care and infanticide male voles. (f) Number of c-Fos cells in pup care and infanticide male voles. (g) Percentage of c-Fos-expressing cells in OT cells of PVN from pup care and infanticide male voles. *p<0.05. Independent-samples t-tests. Error bars indicate SEM.
-
Figure 1—source data 1
Statistical results of the number of OT-positive cells, the number of c-Fos-positive cells, and the percentage of OT and c-Fos merged neurons in the total PVN OT neurons in female and male pup care and infanticide voles.
- https://cdn.elifesciences.org/articles/96543/elife-96543-fig1-data1-v1.xlsx
Figure 2
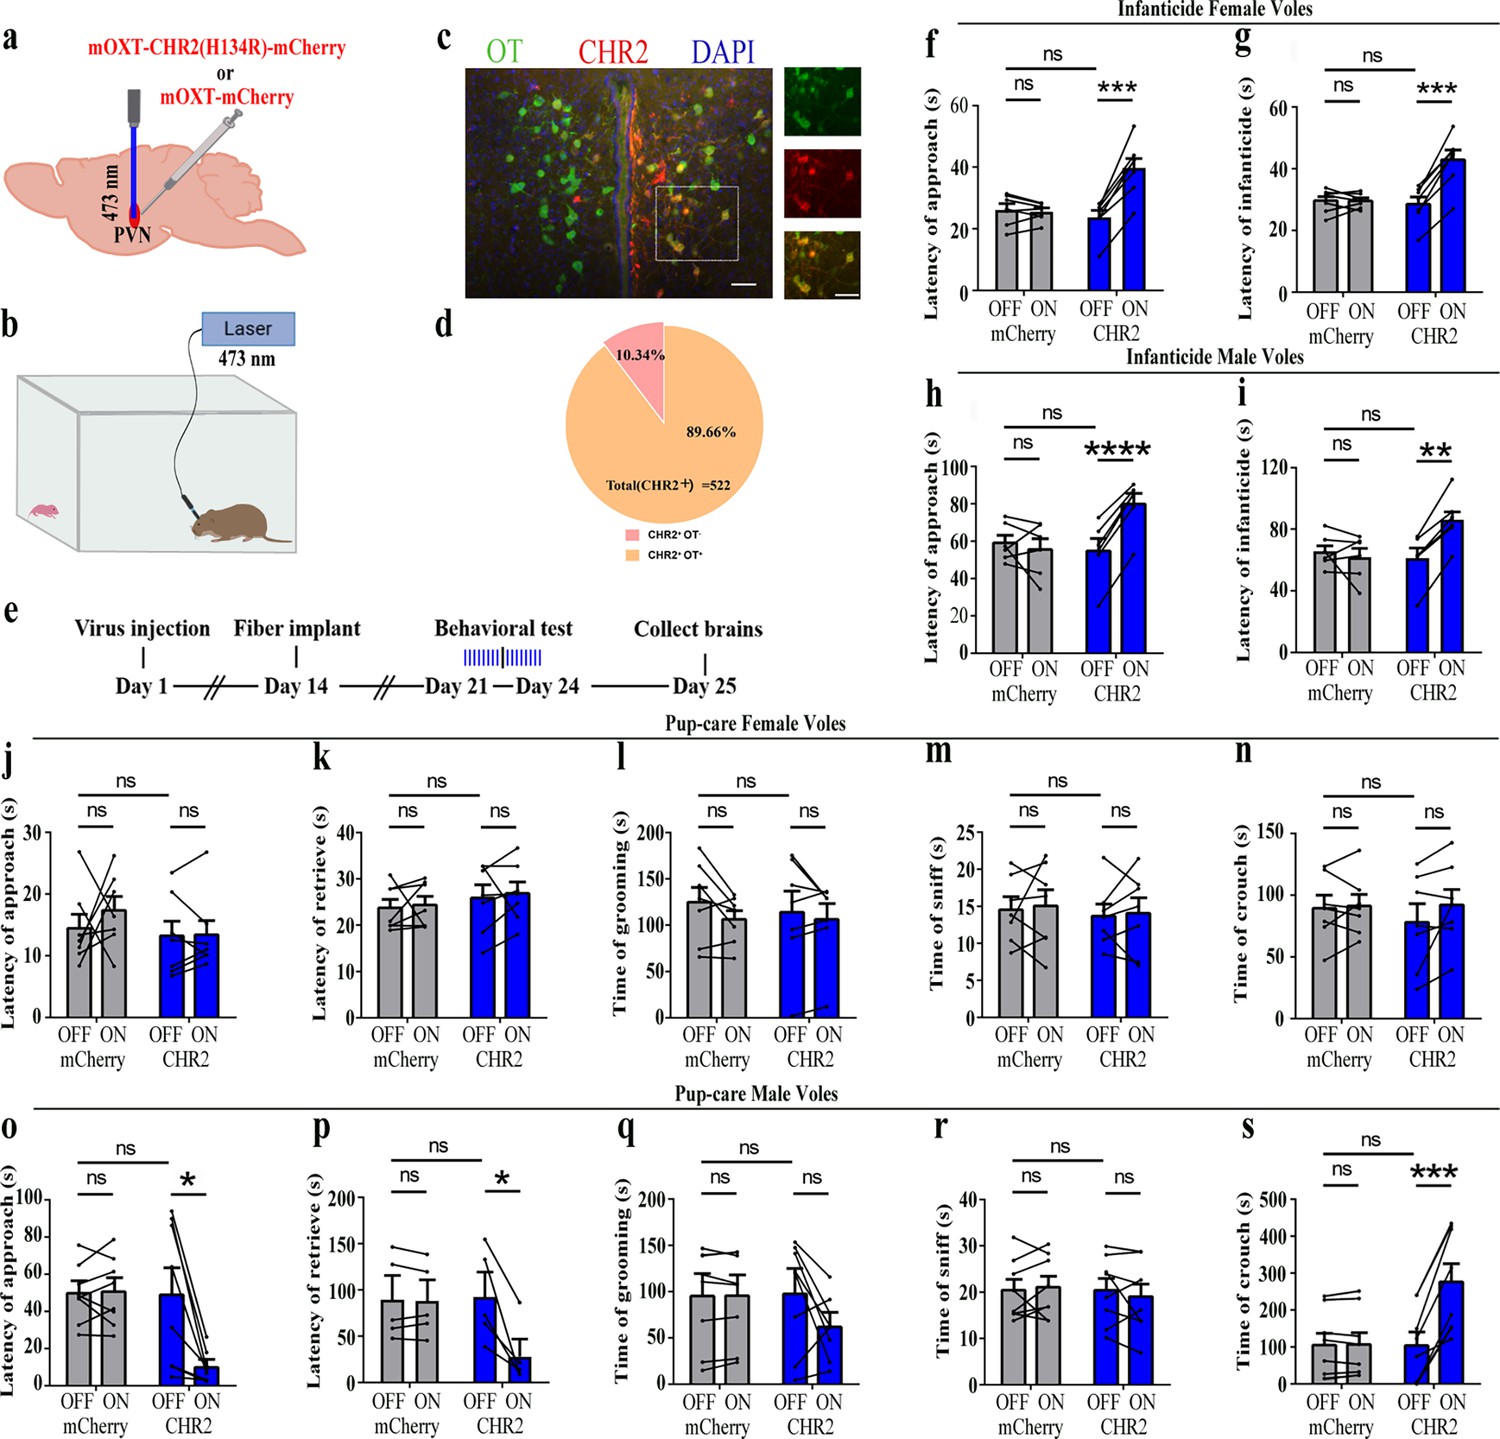
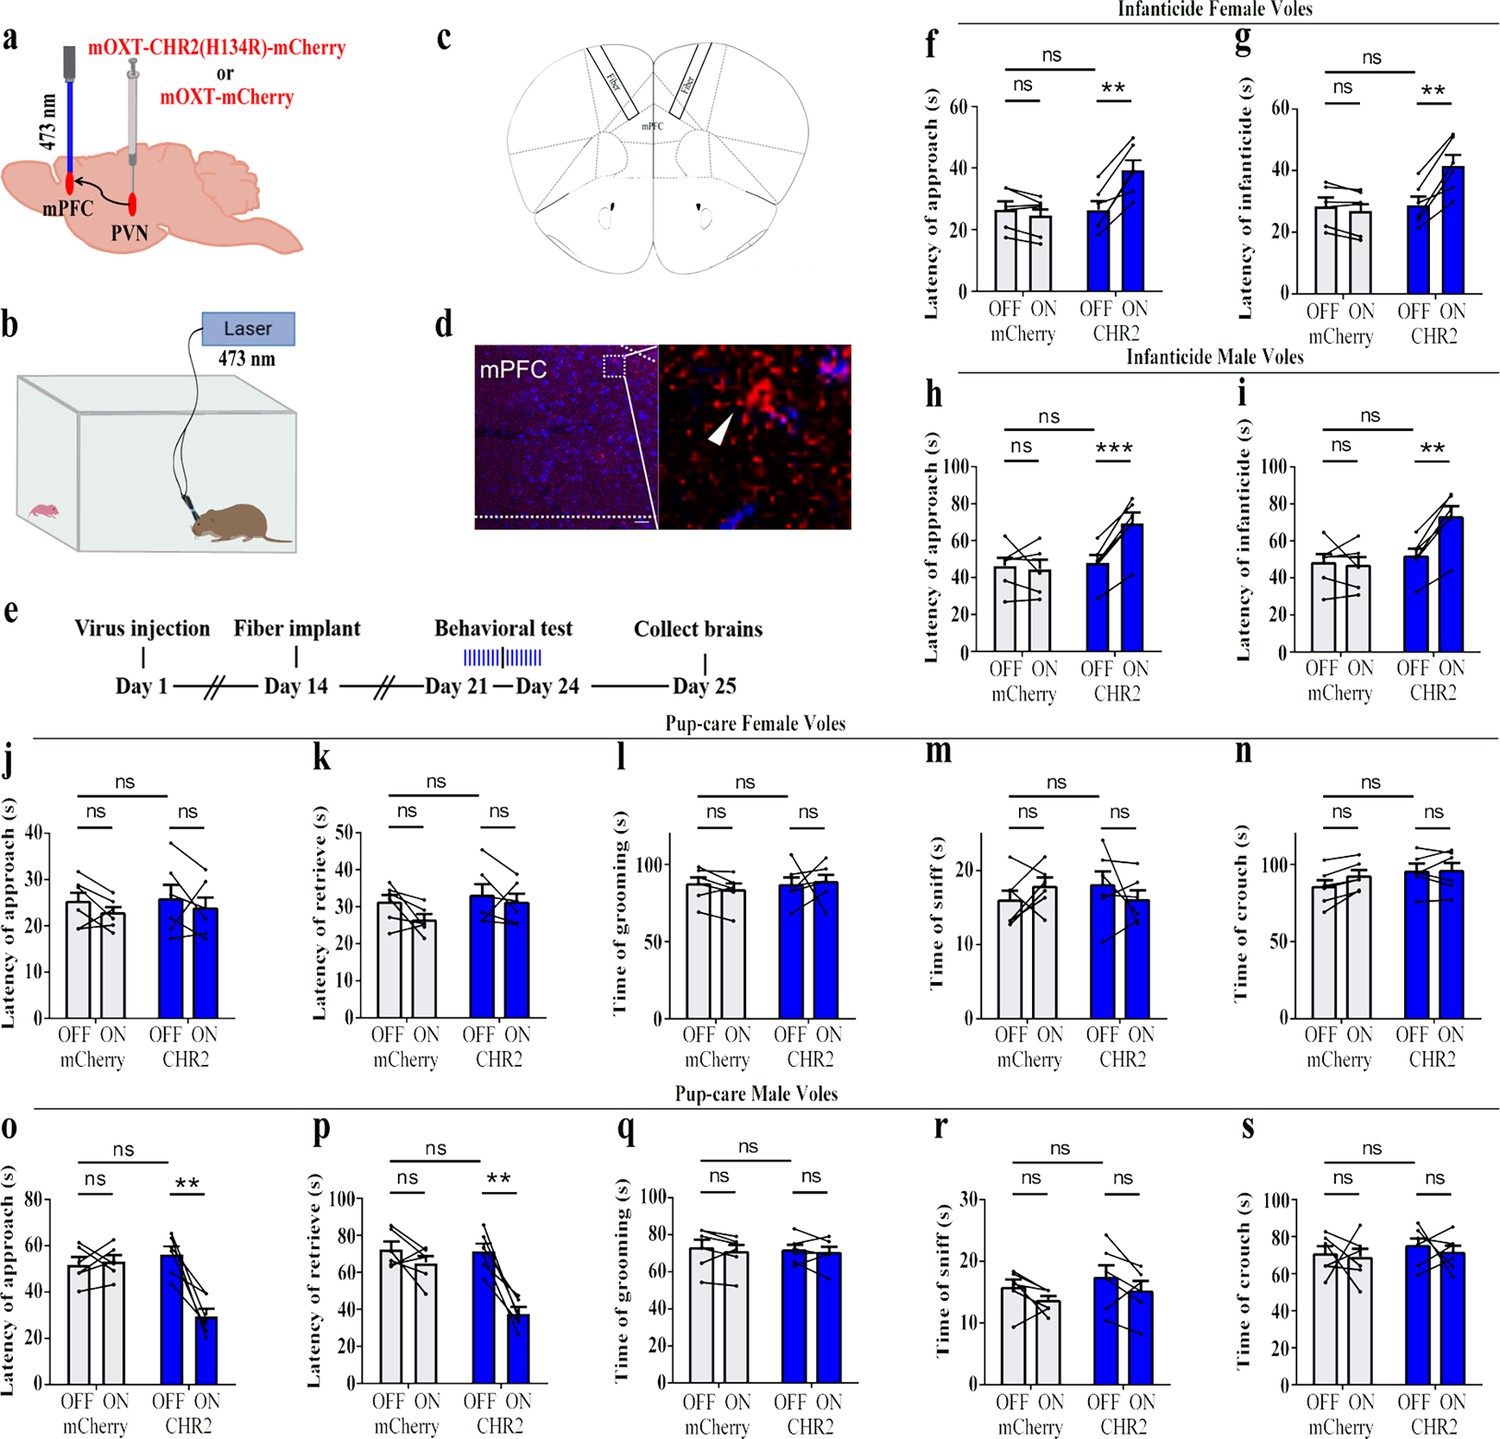
Effects of optogenetic activation of paraventricular nucleus (PVN) oxytocin (OT) neurons on pup-directed behaviors.
(a) Schematic of virus injection and optical fiber implantation. (b) Schematic diagram of the behavioral test. (c) Representative histological images of CHR2 (red) expression and OT staining (green), enlarged view of the boxed area is on the right side. Blue, DAPI. Objective: ×20. Scale bars, 50 μm. (d) Statistics of the specificity of CHR2 expression in three voles; more than 89% of CHR2-positive neurons overlapped with OT-positive neurons. (e) Timeline of the experiment. (f–i) Approach (f, h) and infanticide (g, i) latency of seven female (n = 7) and six male (n = 6) voles in mCherry (control virus group) and CHR2 groups. **p<0.01 vs. CHR2 OFF; ***p<0.001 vs. CHR2 OFF; ****p<0.0001 vs. CHR2 OFF. Two-way rmANOVA (factors: treatment × stimulus). (j–n) Latency to approach (j), latency to retrieve (k), grooming time (l), sniffing time (m), and crouching time (n) of seven pup-care female voles (n = 7) in female control virus and CHR2 groups. (o–s) Latency to approach (o), latency to retrieve (p), grooming time (q), sniffing time (r), and crouching time (s) of eight pup-care male voles (n = 8) in male control virus and CHR2 groups. *p<0.05 vs. CHR2 OFF, ***p<0.001 vs. CHR2 OFF. Two-way rmANOVA (factors: treatment × stimulus). Error bars indicate SEM.
-
Figure 2—source data 1
Statistical results of the number of cells expressing only CHR2 and co-expressing CHR2 and OT in the PVN of three voles with injection of optogenetic virus, the latency to approach and attack pups in infanticide voles, and the latency to approach, retrieve, duration of grooming, sniffing, and crouching in pup-care voles.
- https://cdn.elifesciences.org/articles/96543/elife-96543-fig2-data1-v1.xlsx
Figure 3 with 1 supplement
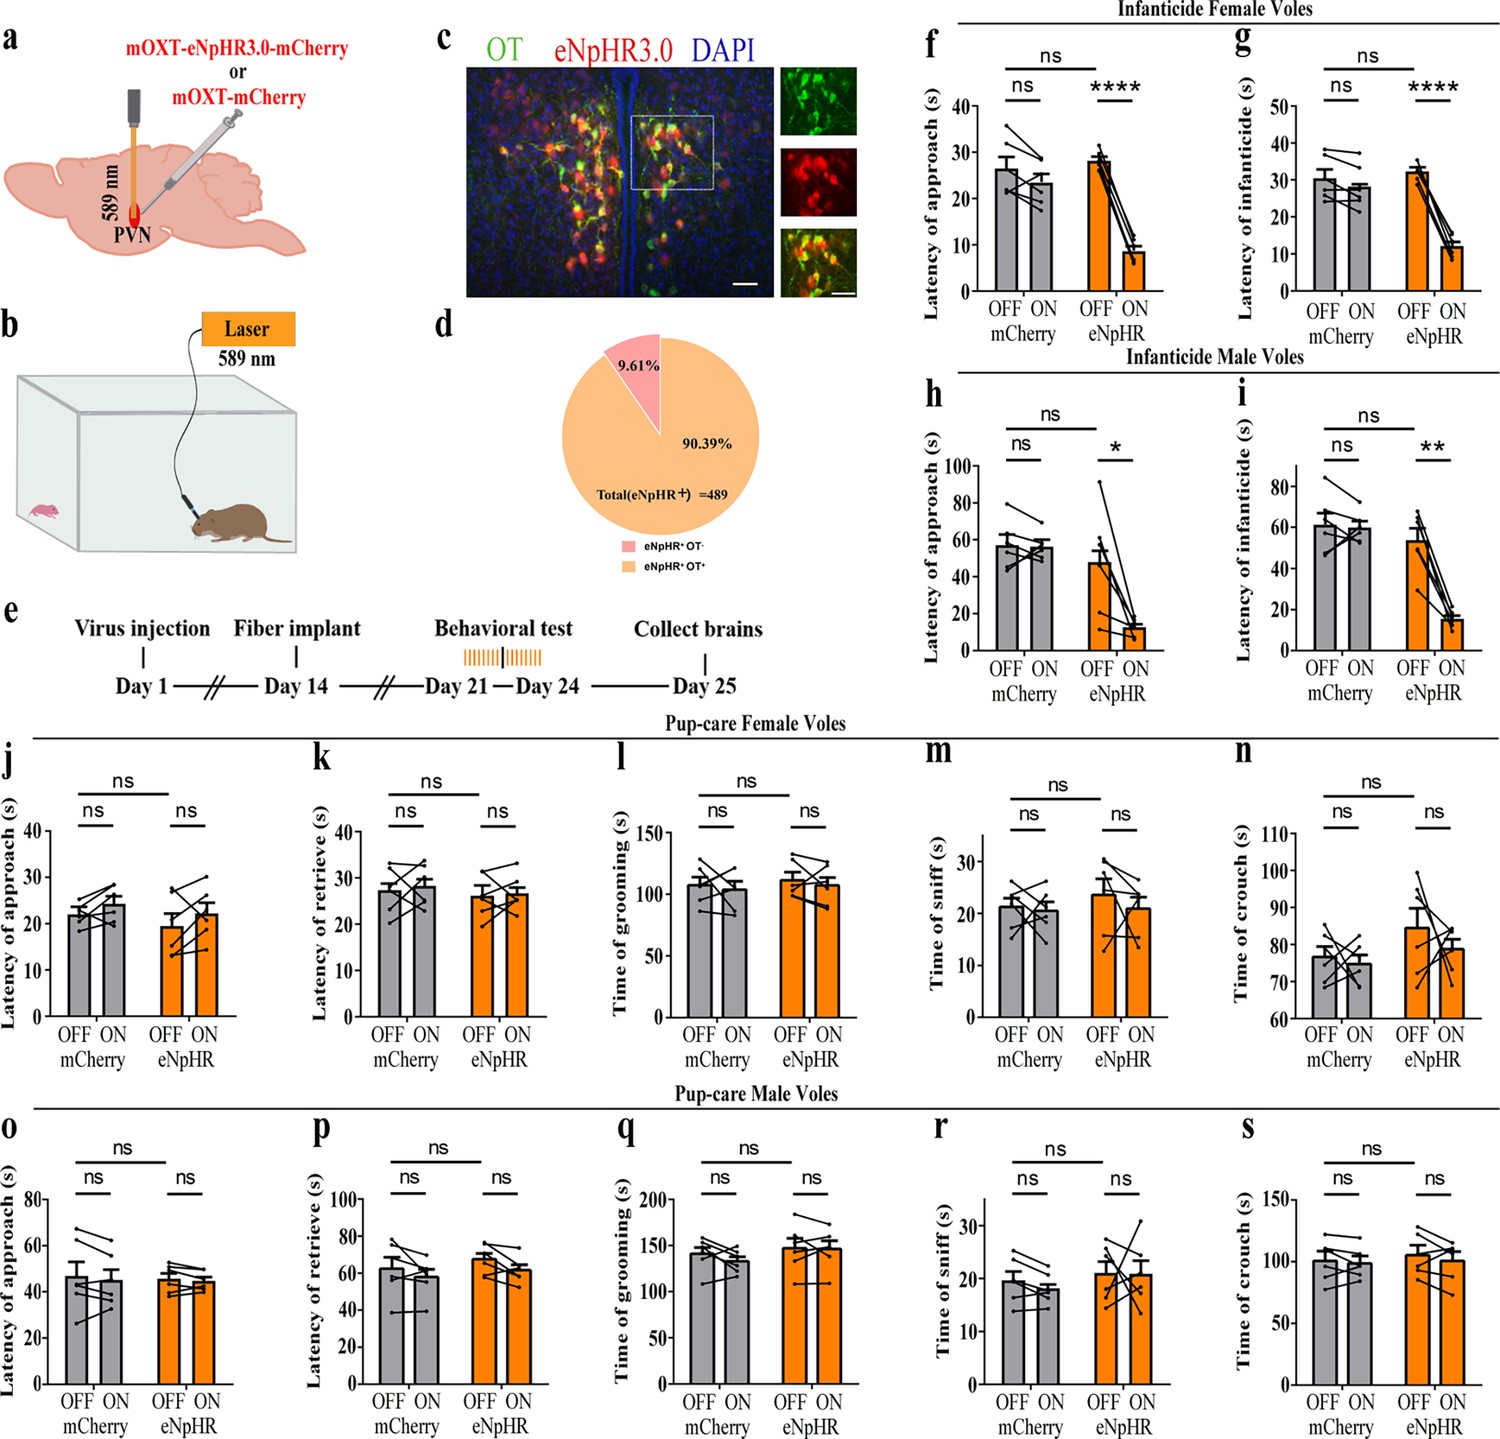
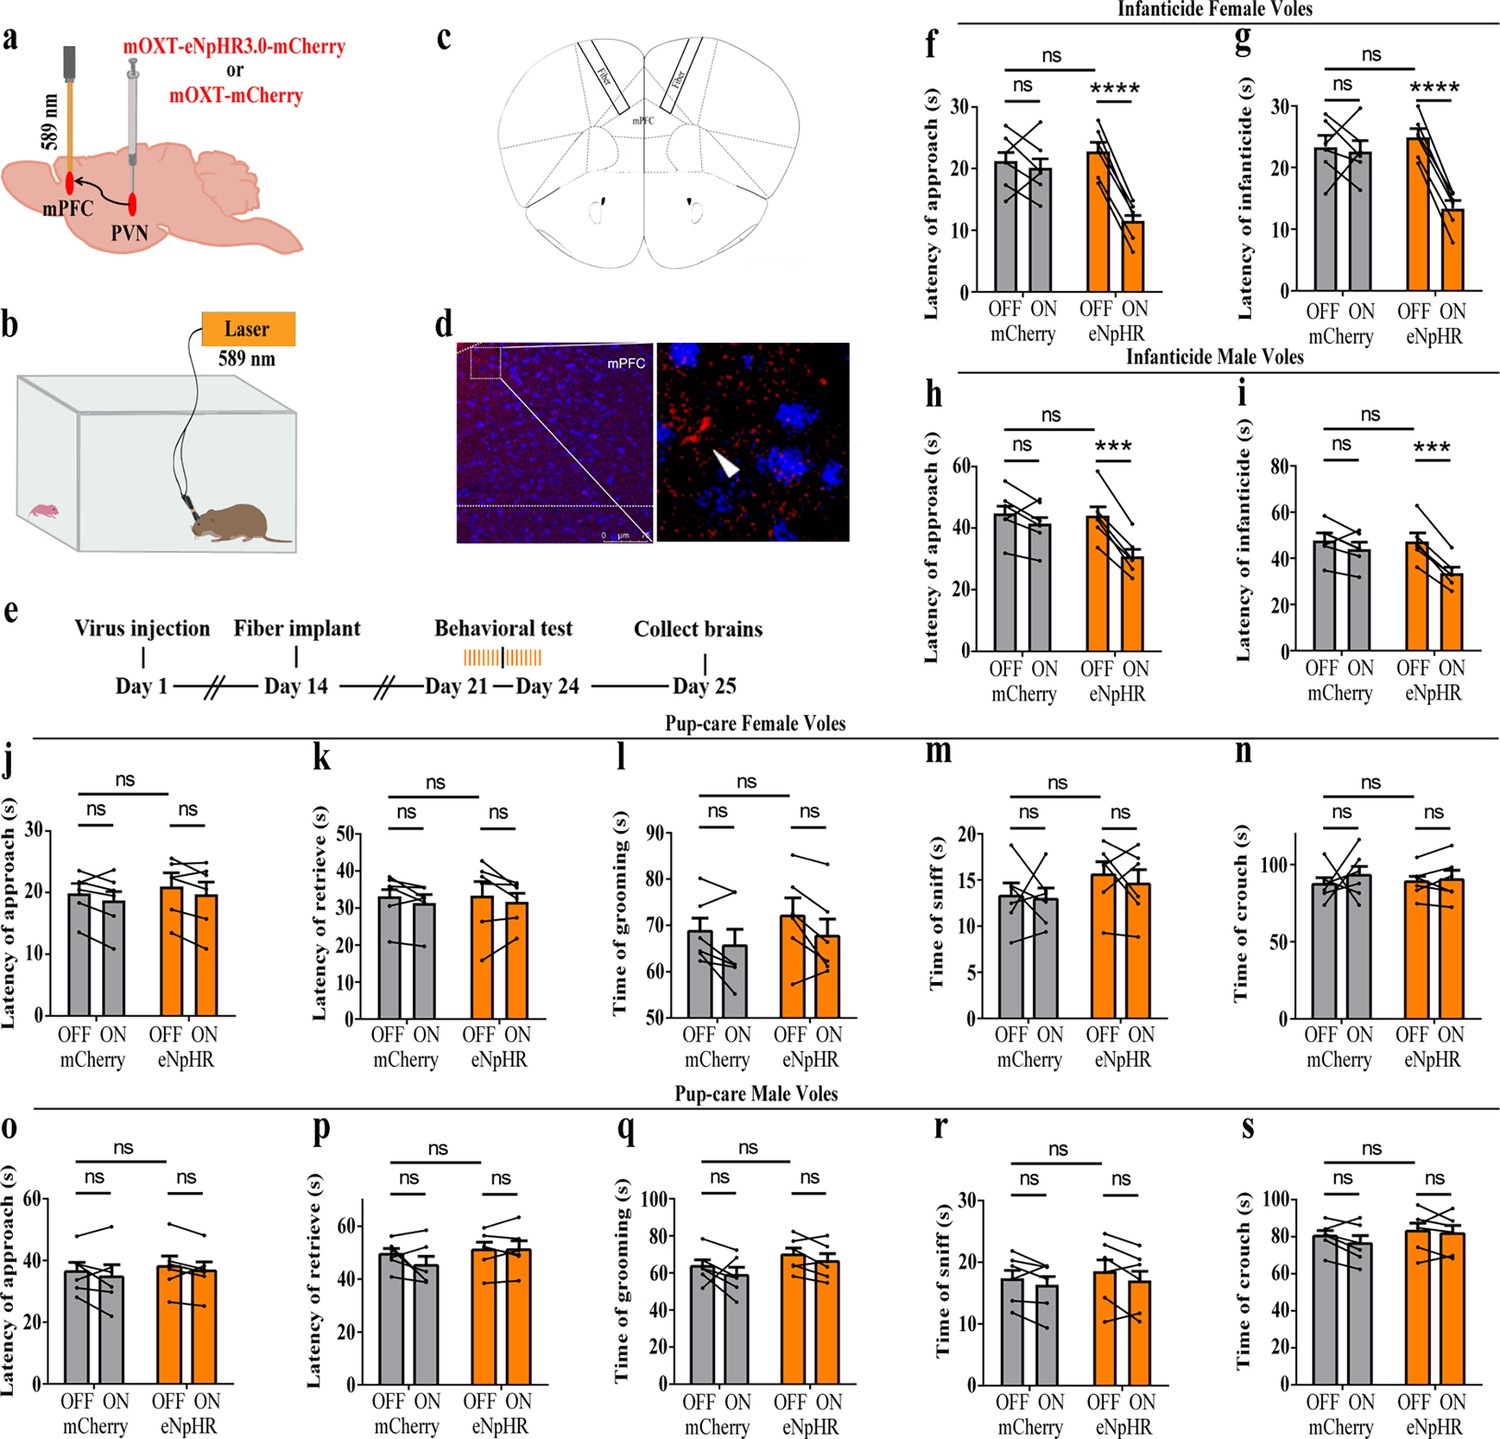
Effects of optogenetic inhibition of paraventricular nucleus (PVN) oxytocin (OT) neurons on pup-directed behaviors.
(a) Schematic of virus injection and optical fiber implantation. (b) Schematic diagram of the behavioral test. (c) Representative histological images of OT staining (green) and eNpHR (red) expression, enlarged view of the boxed area is shown on the right side. Blue, DAPI. Objective: ×20. Scale bars, 50 μm. (d) Statistics of the specificity of CHR2 expression in three voles; more than 90% of eNpHR expression overlapped with OT. (e) Timeline of the experiment. (f–i) Approach (f, h) and infanticide (g, i) latency of six female (n = 6) (f, g) and six male (n = 6) (h, i) infanticide voles. *p<0.05 vs. eNpHR OFF; **p<0.01 vs. eNpHR OFF; ****p<0.0001 vs. eNpHR OFF. Two-way rmANOVA (factors: treatment × stimulus). (j–n) Approach latency (j), retrieval latency (k), grooming time (l), sniffing time (m), and crouching time (n) in six control mCherry (n = 6) and eNpHR (n = 6) groups of pup-care female voles. (o–s) Approach latency (o), retrieval latency (p), grooming time (q), sniffing time (r), and crouching time (s) in six control mCherry (n = 6) and eNpHR (n = 6) groups of pup-care male voles. Error bars indicate SEM.
-
Figure 3—source data 1
Statistical results of the number of cells expressing only eNpHR and co-expressing eNpHR and OT in the PVN of three voles with injection of optogenetic virus, the latency to approach and attack pups in infanticide voles, and the latency to approach, retrieve pups, duration of grooming, sniffing, and crouching in pup-care voles.
- https://cdn.elifesciences.org/articles/96543/elife-96543-fig3-data1-v1.xlsx
Figure 3—figure supplement 1
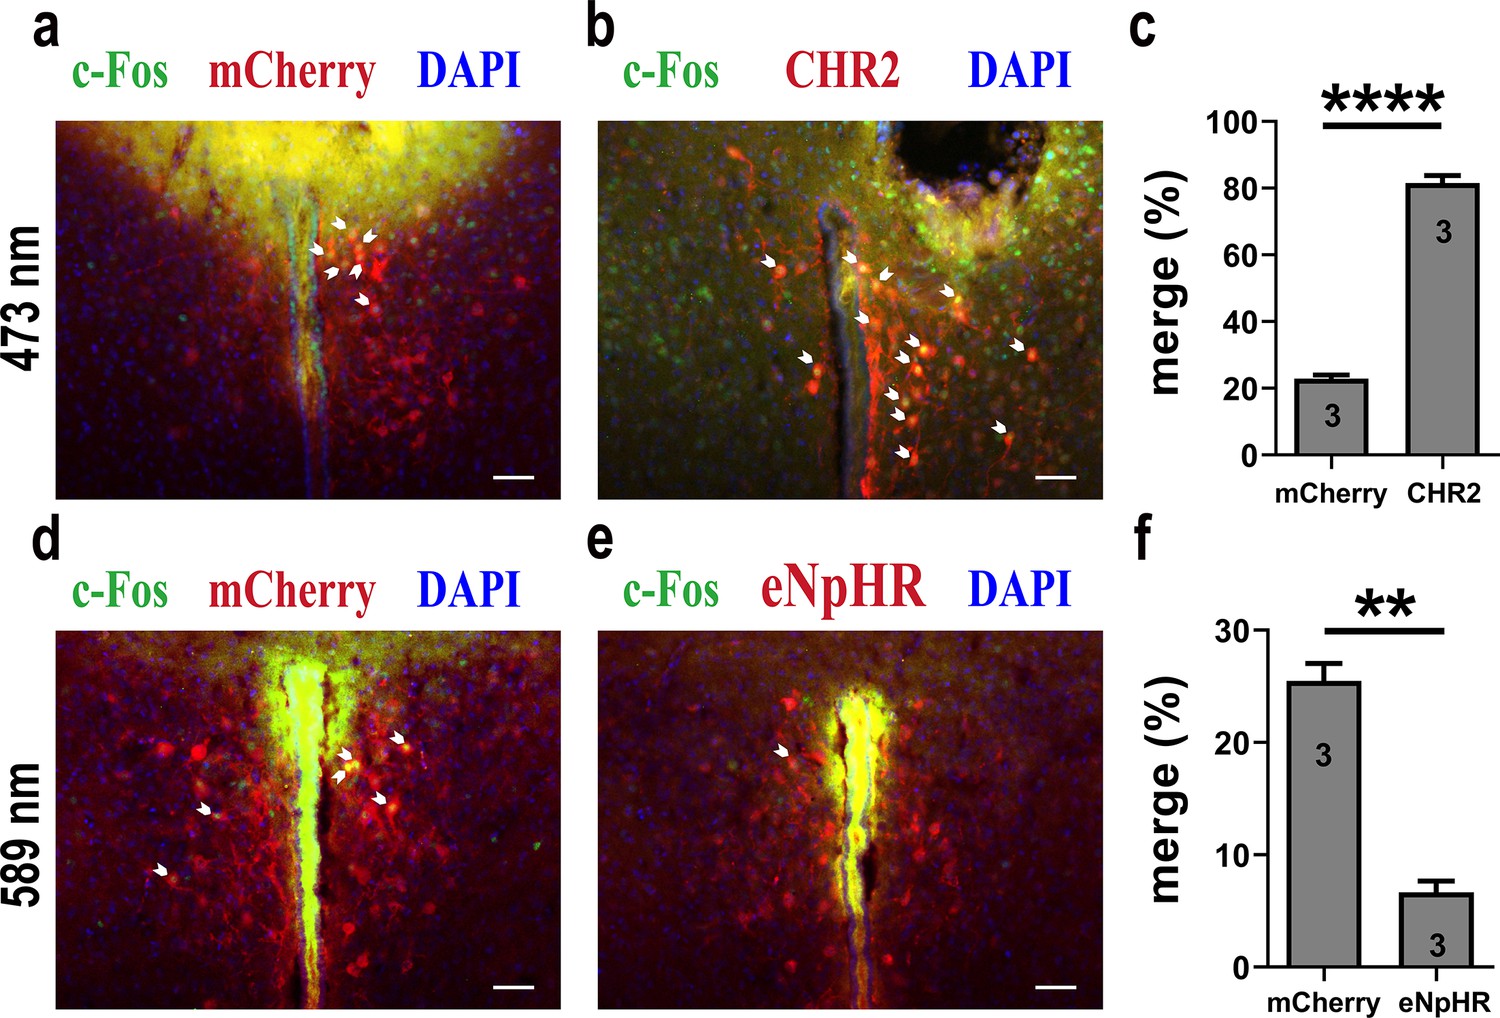
Light-induced c-Fos expression overlapping with mCherry, CHR2, or eNpHR.
(a) 473 nm light-induced c-Fos (green) expression overlapping with mCherry (red). Blue, DAPI. Objective: ×20. Scale bars, 50 μm. (b) 473 nm light-induced c-Fos (green) expression overlapping with CHR2 (red). Blue, DAPI. Objective: ×20. Scale bars, 50 μm. (c) 473 nm light induced more c-Fos expression in CHR2, which indicated the effectiveness of CHR2 (n = 3). ****p<0.0001. Independent-samples t-test. (d) 589 nm light-induced c-Fos (green) expression overlapping with mCherry (red). Blue, DAPI. Objective: ×20. Scale bars, 50 μm. (e) 589 nm light-induced c-Fos (green) expression overlapping with eNpHR (red). Blue, DAPI. Objective: ×20. Scale bars, 50 μm. (f) 589 nm light induced less c-Fos expression in eNpHR, which indicated the effectiveness of eNpHR (n = 3). **p<0.01. Independent-samples t-test. Error bars indicate SEM. For (c, f), n = 3 per group, data are mean ± s.e.m. Statistical analysis was performed using independent-samples t-test (c, f). **p<0.01, ****p<0.0001. Details of the statistical analyses are as follows: (c) t(4) = –23.139, p=0.000021, (f) t(4) = 10.136, p=0.001.
-
Figure 3—figure supplement 1—source data 1
Statistical results of light-induced c-Fos expression overlapping with mCherry, CHR2, or eNpHR.
- https://cdn.elifesciences.org/articles/96543/elife-96543-fig3-figsupp1-data1-v1.xlsx
Figure 4 with 2 supplements
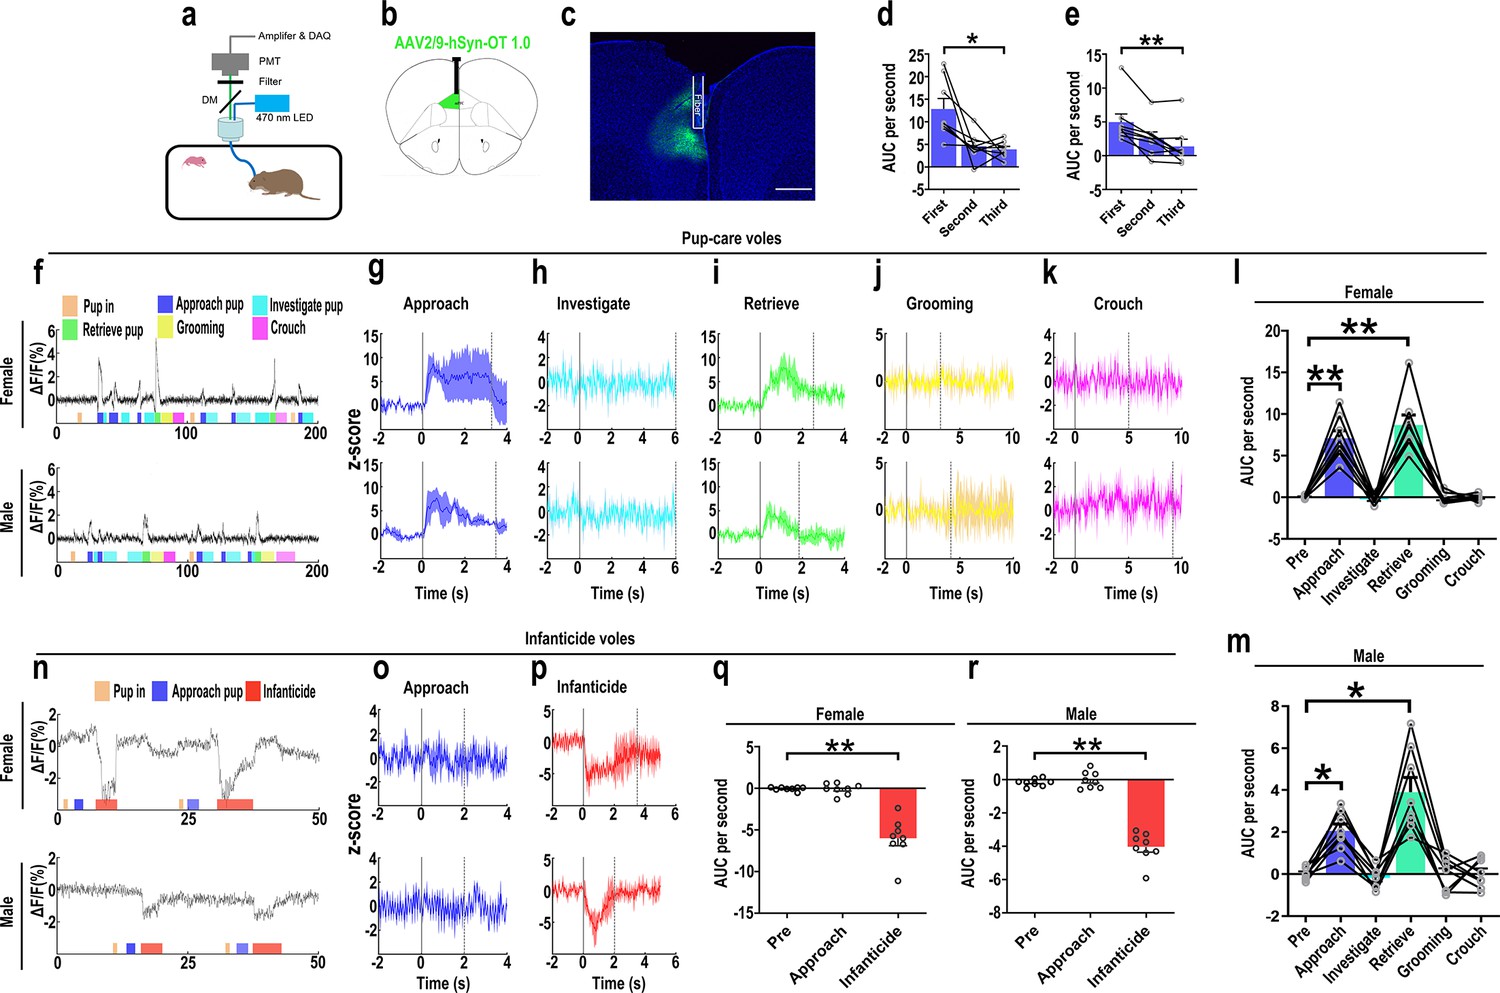
Oxytocin (OT) release in the medial prefrontal cortex (mPFC) upon pup-directed behaviors.
(a) Recording instrument settings. (b) Illustrations of viral expression and optical fiber location. (c) Representative histological image of OT1.0 sensor (green) and optical fiber locations. Blue, DAPI. Objective: ×4. Scale bars, 500 μm. (d, e) Area under the curve (AUC) per second for pup-care female (d) and male (e) voles approaching pups for the first, second, and third time (n = 8). *p<0.05 vs. first. **p<0.01 vs. first. One-way rmANOVA. (f) Representative ΔF/F traces in pup-care female (f, top) and male (f, bottom) voles during interaction with pups. (g–k) Post-event histograms (PETHs) of z-score of OT1.0 sensor for the following pup-directed behaviors: approach (g), investigate (h), retrieve (i), grooming (j), and crouch (k). (l, m) The mean AUC of z-scores for pup-care female (l) and male (m) voles across various pup-directed behaviors (n = 8). Female: **p<0.01 vs. approach. p<0.01 vs. retrieve. Male: *p<0.05 vs. approach. p<0.05 vs. retrieve. One-way rmANOVA. (n) Representative ΔF/F traces in infanticide female (n, top) and male (n, bottom) voles during interaction with pups. (o, p) PETHs of z-score of OT1.0 sensor for approach and infanticide in infanticide voles. (q, r) The mean AUC of z-score of OT1.0 sensor for pre-pup exposure, approach, and infanticide in infanticide female (q) and male (r) voles (n = 8). **p<0.01 vs. infanticide. One-way rmANOVA. Error bars indicate SEM.
-
Figure 4—source data 1
Area under the curve per second for pre-pup exposure, approach, and infanticide behaviors in infanticide voles and area under the curve per second for first, second, and third approaches to pups, as well as pre-pup exposure, approach, investigation, retrieval, grooming, and crouching behaviors in pup-care voles.
- https://cdn.elifesciences.org/articles/96543/elife-96543-fig4-data1-v1.xlsx
Figure 4—figure supplement 1
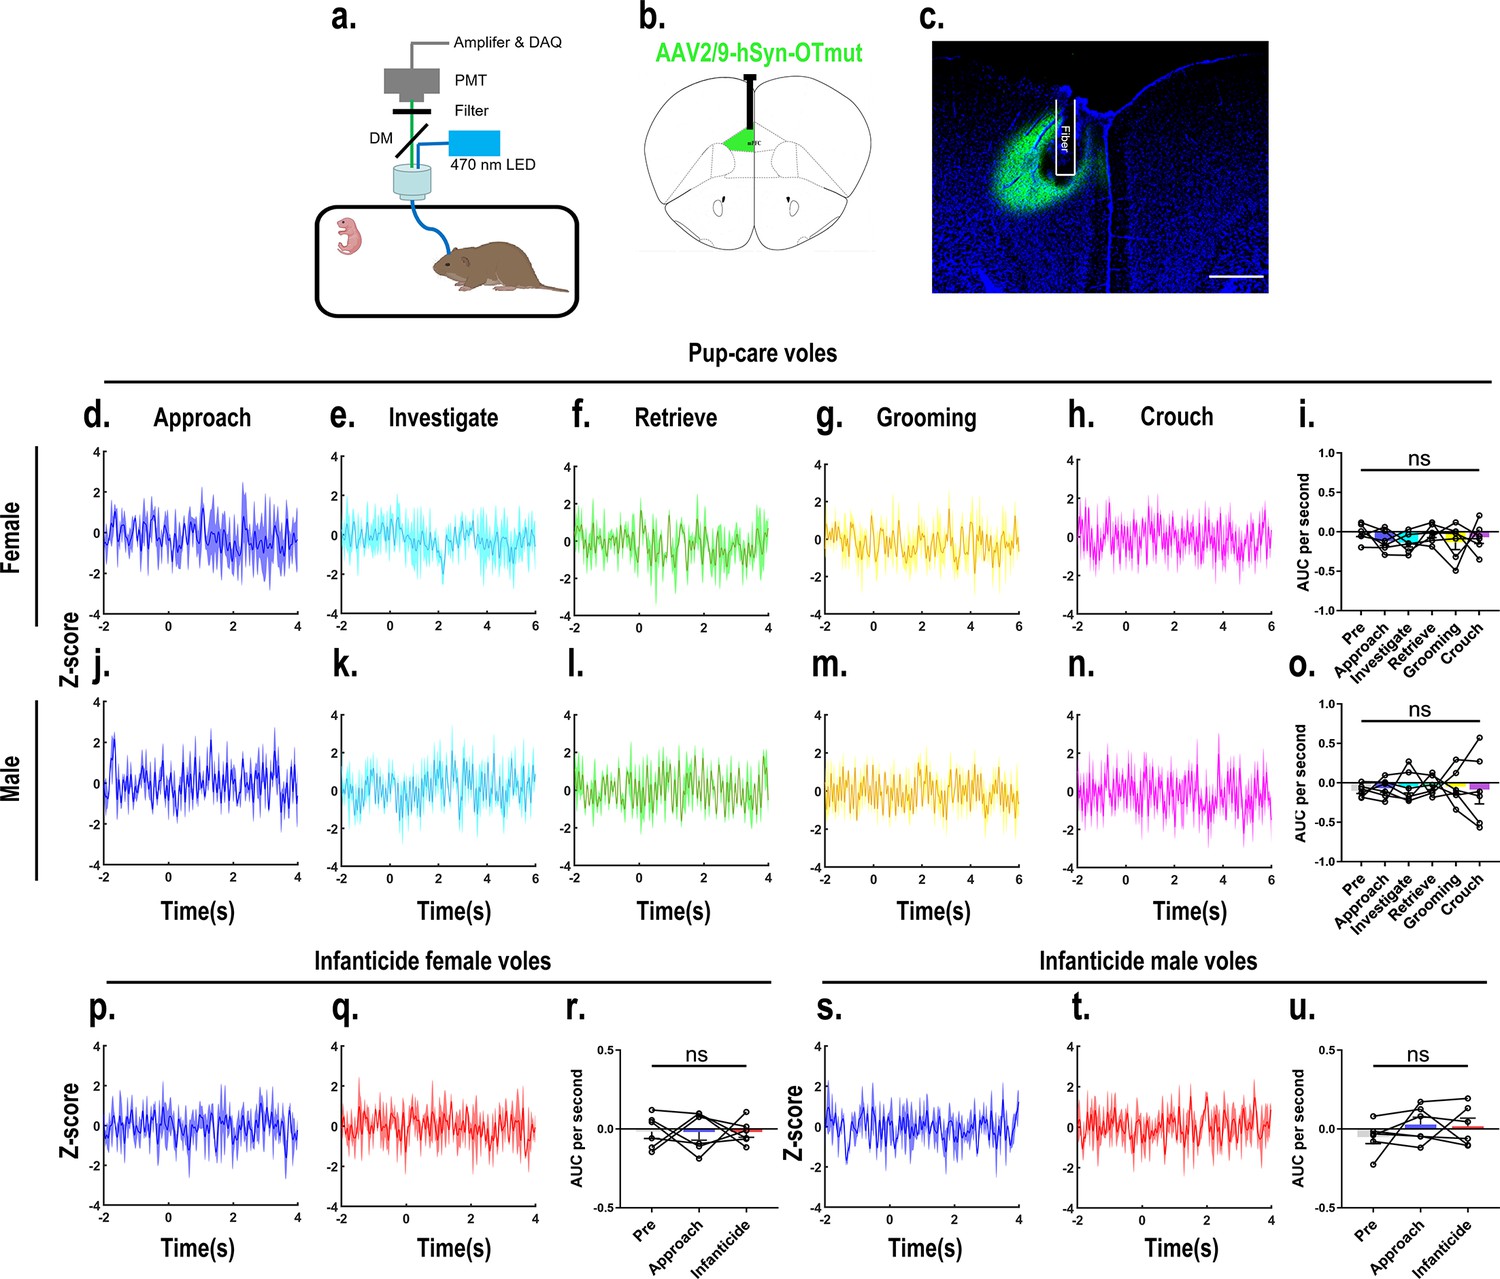
Recordings of OTmut sensor signals in the medial prefrontal cortex (mPFC) on oxytocin (OT) release.
(a) Recording instrument settings. (b) Illustrations of viral expression and optical fiber location. (c) Representative histological image of OTmut sensor (green) and optical fiber locations. Blue, DAPI. Objective: ×4. Scale bars, 500 μm. (d–h, j–n) Post-event histograms (PETHs) of z-score of OTmut sensor signals for the following pup-directed behaviors: approach (d, j), investigate (e, k), retrieve (f, l), grooming (g, m), and crouch (h, n). (i, o) Area under the curve (AUC) per second of z-scores for pup-care female (n = 6, i) and male (n = 6, o) voles across various pup-directed behaviors. (p, q, s, t) PETHs of z-score of OTmut sensor signals for approach and infanticide in infanticide voles. (r, u,) AUC per second of z-score of OTmut sensor signals for pre-pup exposure, approach, and infanticide in infanticide female (n = 6, r) and male (n = 6, u) voles. Error bars indicate SEM. For (i, o, r, u), n = 6 per group, data are mean ± s.e.m. Statistical analysis was performed using one-way rmANOVA (i, o, r, u). Details of the statistical analyses are as follows: (i) F(5, 25) = 0.680, p=0.643; (o) F(2, 25) = 0.074, p=0.996; (r) F(2, 10) = 0.002, p=0.998; (u) F(2, 10) = 0.665, p=0.536.
-
Figure 4—figure supplement 1—source data 1
Area under the curve per second for pre-pup exposure, approach, and infanticide behaviors in infanticide voles and area under the curve per second for pre-pup exposure, approach, investigation, retrieval, grooming, and crouching behaviors in pup-care voles.
- https://cdn.elifesciences.org/articles/96543/elife-96543-fig4-figsupp1-data1-v1.xlsx
Figure 4—figure supplement 2
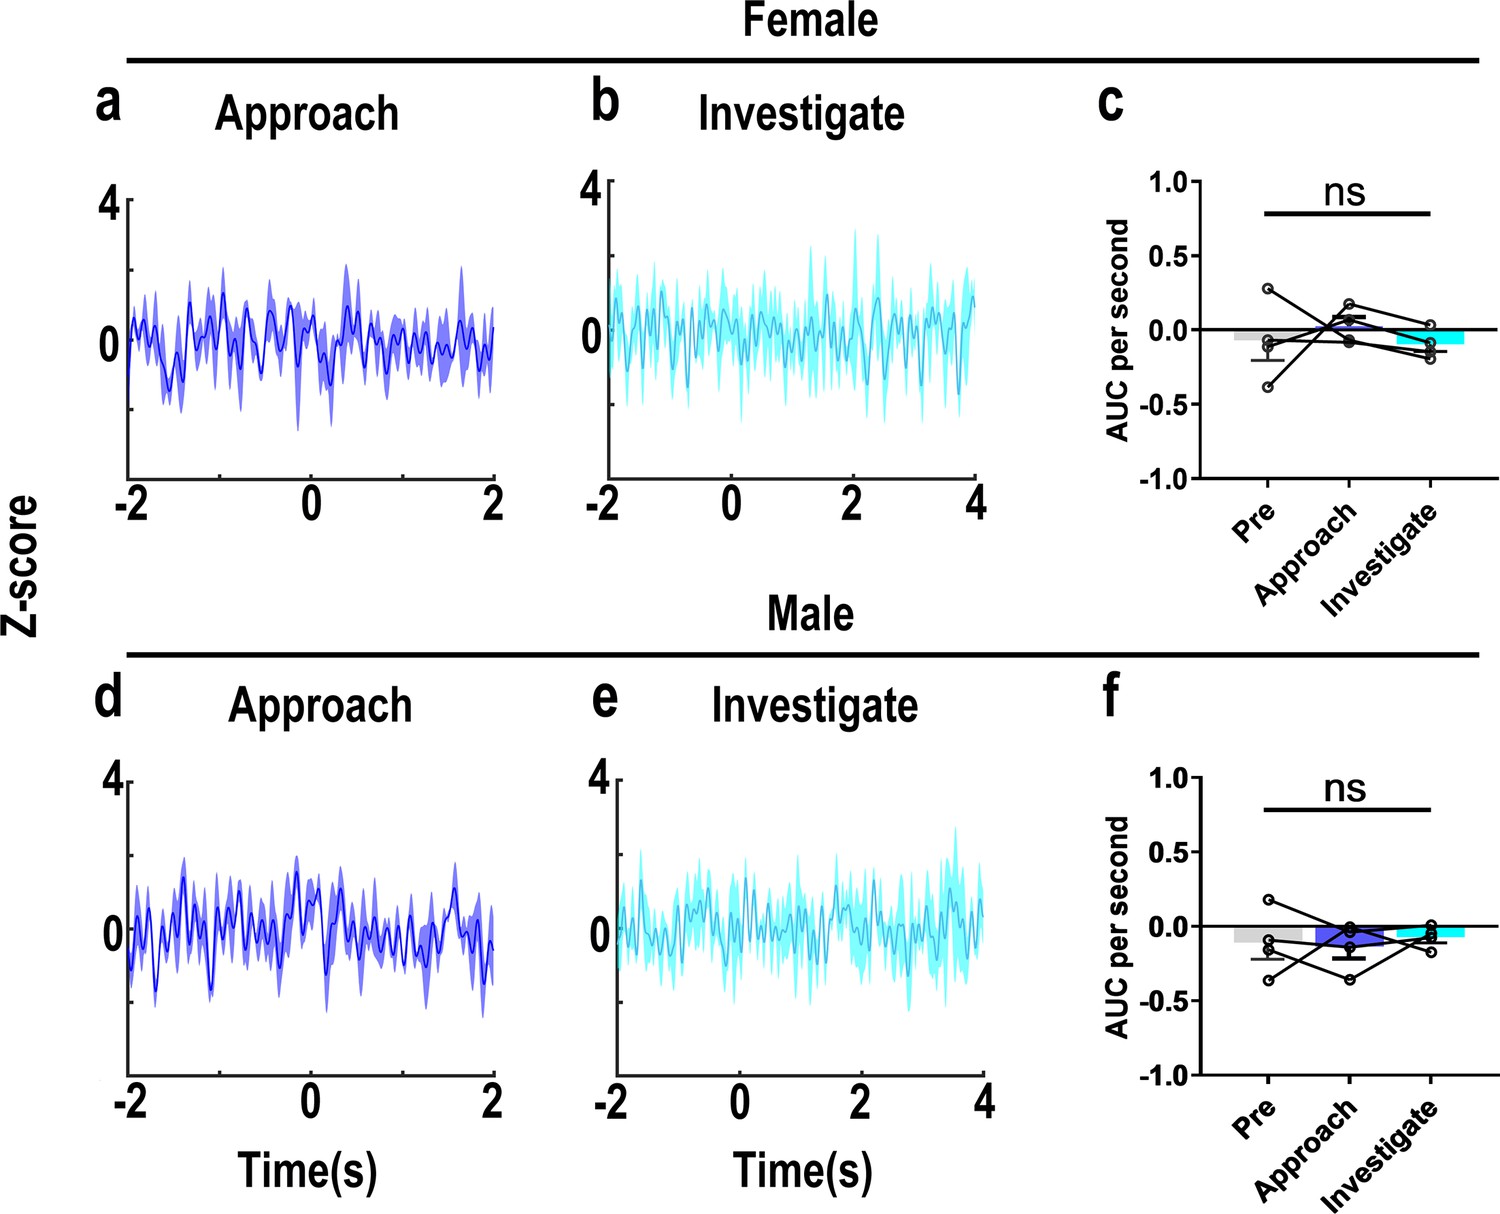
Recordings of OT1.0 sensor signals for investigating object.
(a, b, d, e) Post-event histograms (PETHs) of z-score of OT1.0 sensor for approaching and investigating object in female (a, b) and male (d, e) voles. (c, f) Area under the curve (AUC) per second of z-scores for pre object, approaching, and investigating behaviors in female (n = 4, c) and male (n = 4, f) voles. Error bars indicate SEM. For (c, f), n = 4 per group, data are mean ± s.e.m. Statistical analysis was performed using one-way rmANOVA. Details of the statistical analyses are as follows: (c) F(1.016, 3.047) = 0.346, p=0.601; (f) F(2,6) = 0.183, p=0.838.
-
Figure 4—figure supplement 2—source data 1
Area under the curve per second for pre-object exposure, approach, and investigating in female and male voles.
- https://cdn.elifesciences.org/articles/96543/elife-96543-fig4-figsupp2-data1-v1.xlsx
Figure 5 with 1 supplement
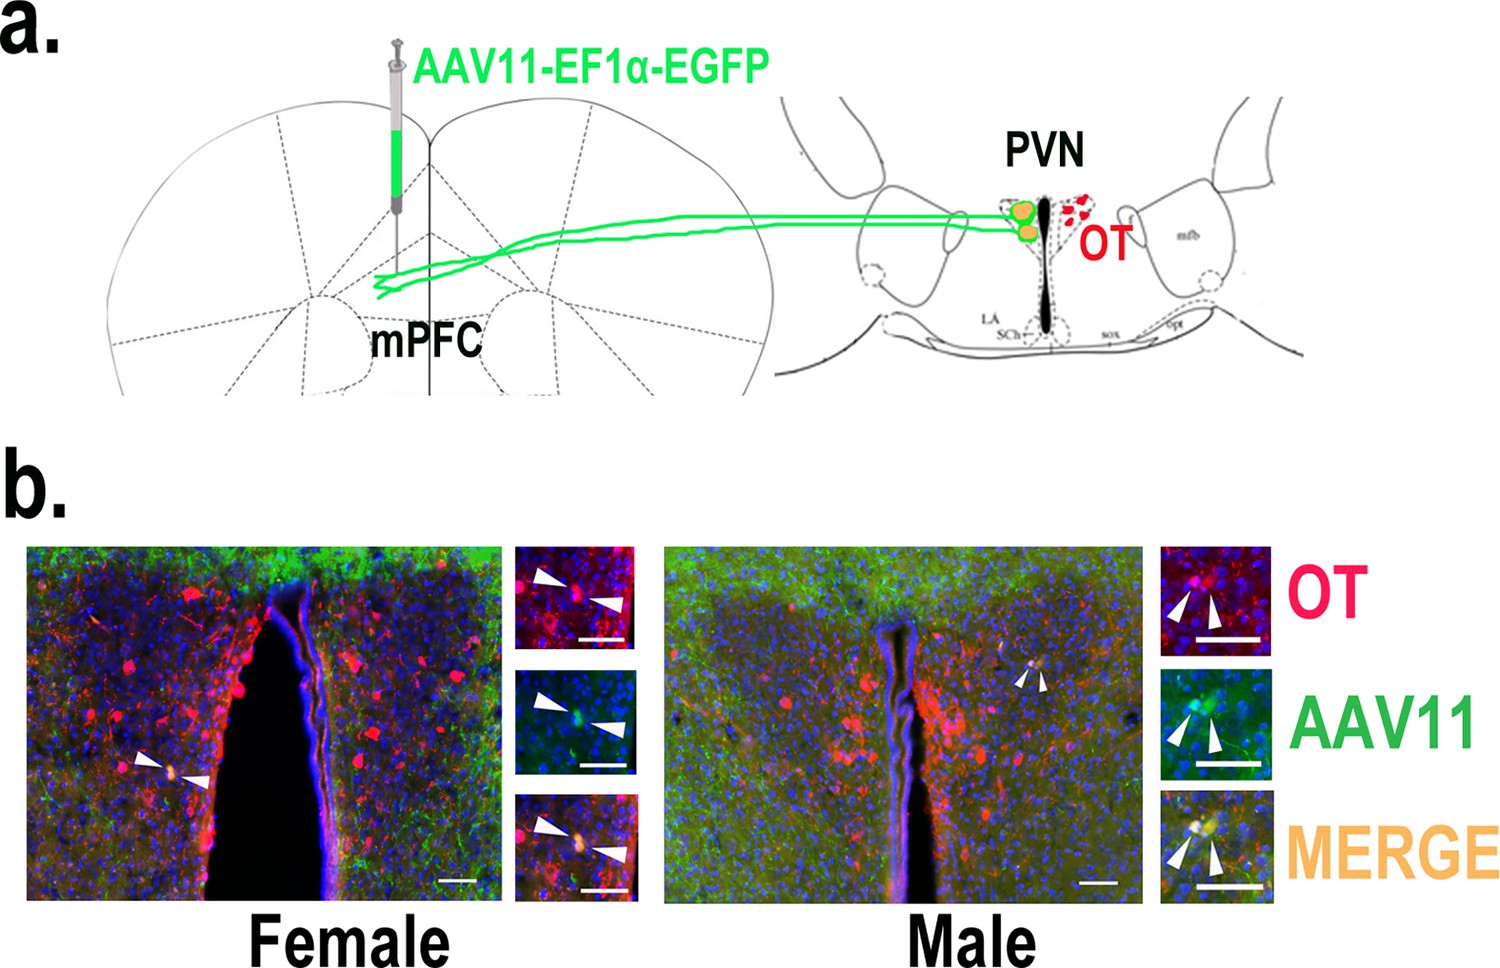
Determination of paraventricular nucleus (PVN) to medial prefrontal cortex (mPFC) oxytocin projection.
(a) Schematic diagram of mPFC virus injection and oxytocin (OT) staining. (b) Histological pictures of OT (red) and AAV11 (green) co-staining in male and female. Yellow, merged; blue, DAPI. Objective: ×20. Scale bars, 50 μm.
Figure 5—figure supplement 1
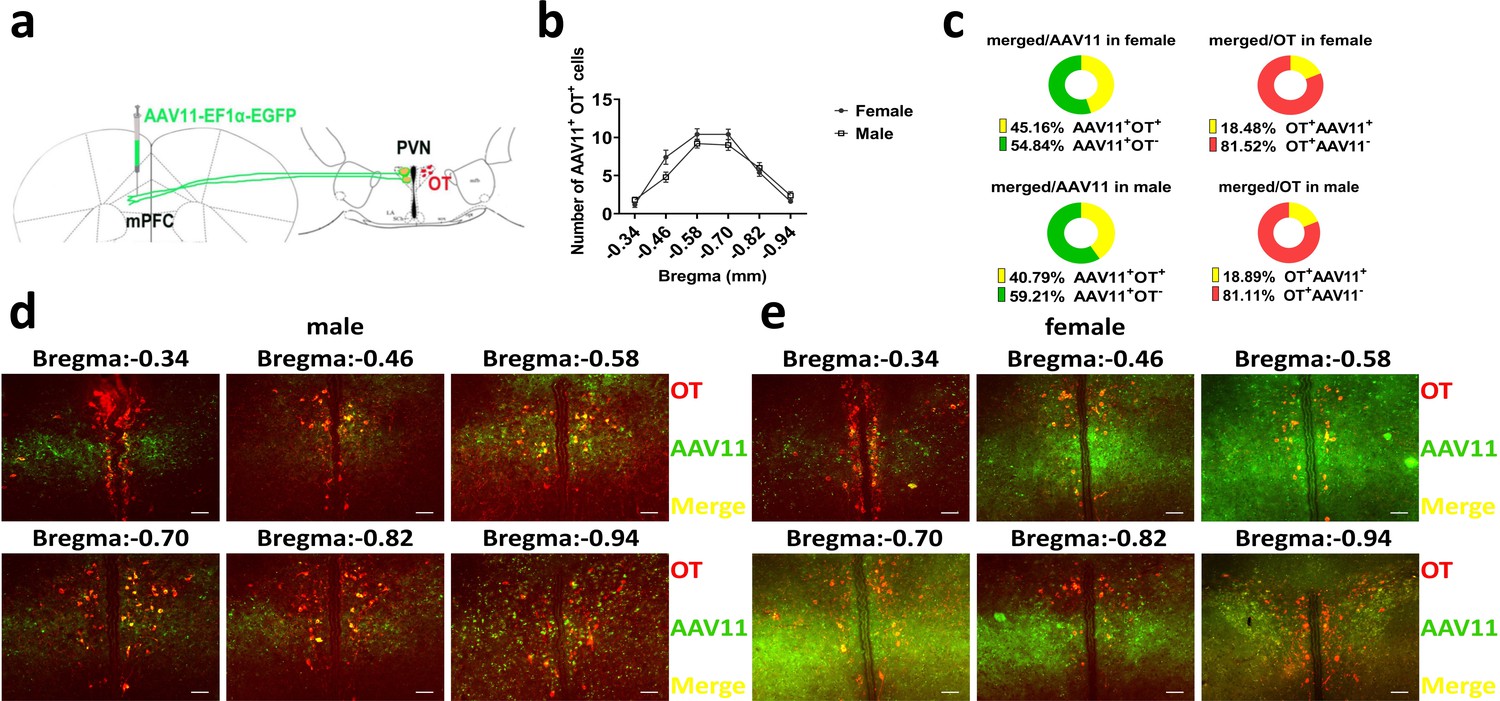
Number of paraventricular nucleus (PVN) oxytocin (OT) neurons projecting to medial prefrontal cortex (mPFC).
(a) Schematic diagram of virus injection and immunohistological staining. (b) Statistics of PVN to mPFC OT projection extent (female: n = 5, male: n = 5). Error bars indicate SEM. (c) Percentage of OT-positive cells in PVN projecting to mPFC and percentage of OT cells in PVN that project to mPFC (female: n = 5, male: n = 5). (d, e) Representative histological images of male and female. Red, OT; green, AAV11; yellow, merged. Objective: ×20. Scale bars, 50 μm.
-
Figure 5—figure supplement 1—source data 1
Counts of AAV11, OT, and co-expressed cells.
- https://cdn.elifesciences.org/articles/96543/elife-96543-fig5-figsupp1-data1-v1.xlsx
Figure 6
Effects of optogenetic activation of the paraventricular nucleus (PVN) oxytocin (OT) neuron projection fibers on pup-directed behaviors.
(a) Schematic of virus injection and optical fiber implantation. (b) Schematic diagram of the behavioral test. (c) Illustration of optical fiber implantation in the target brain region. (d) Representative histological pictures of the fiber position and projection fibers. Blue, DAPI. Objective: ×20. Scale bars, 50 μm. (e) Timeline of the experiment. (f–i) Changes in approach latency (f, h) and infanticide latency (g, i) of female (f, g) and male (h, i) infanticide voles in CHR2 and control mCherry group before and after delivery of light (n = 6). **p<0.01 vs. CHR2 OFF; ***p<0.001 vs. CHR2 OFF. Two-way ANOVA (factors: treatment × stimulus). (j–n) Approach latency (j), retrieval latency (k), grooming time (l), sniffing time (m), and crouching time (n) in control mCherry and CHR2 group of pup-care female voles (n = 6). (o–s) Approach latency (o), retrieval latency (p), grooming time (q), sniffing time (r), and crouching time (s) in control mCherry and CHR2 group of pup-care male voles (n = 6). **p<0.01 vs. CHR2 OFF. Two-way rmANOVA (factors: treatment × stimulus). Error bars indicate SEM.
-
Figure 6—source data 1
Statistical results of the latency to approach and attack pups in infanticide voles, and the latency to approach, retrieve pups, duration of grooming, sniffing, and crouching in pup-care voles.
- https://cdn.elifesciences.org/articles/96543/elife-96543-fig6-data1-v1.xlsx
Figure 7 with 1 supplement
Optogenetic inhibition of the paraventricular nucleus (PVN) oxytocin (OT) neuron projection fibers promoted the onset of infanticide.
(a) Illustration of virus injection and optical fiber implantation. (b) Schematic of the behavioral test. (c) Diagram of optical fiber implantation in the target brain region. (d) Representative histological pictures of the fiber location and projection fibers. Blue, DAPI. Objective: ×20. Scale bars, 75 μm. (e) Timeline of the experiment. (f–i) Changes in approach (f, h) and infanticide (g, i) latency of female and male infanticide voles in eNpHR (n = 6) and control mCherry groups (n = 6) before and after light delivery. ***p<0.001 vs. eNpHR OFF. ****p<0.0001 vs. eNpHR OFF. Two-way rmANOVA (factors: treatment × stimulus). (j–n) Approach latency (j), retrieval latency (k), grooming time (l), sniffing time (m), and crouching time (n) in control mCherry (n = 6) and eNpHR (n = 6) group of pup-care female voles. (o–s) Approach latency (o), retrieval latency (p), grooming time (q), sniffing time (r), and crouching time (s) in control mCherry (n = 6) and eNpHR group (n = 6) of pup-care male voles. Error bars indicate SEM.
-
Figure 7—source data 1
Statistical results of the latency to approach and attack pups in infanticide voles, and the latency to approach and retrieve pups, duration of grooming, sniffing, and crouching in pup-care voles.
- https://cdn.elifesciences.org/articles/96543/elife-96543-fig7-data1-v1.xlsx
Figure 7—figure supplement 1
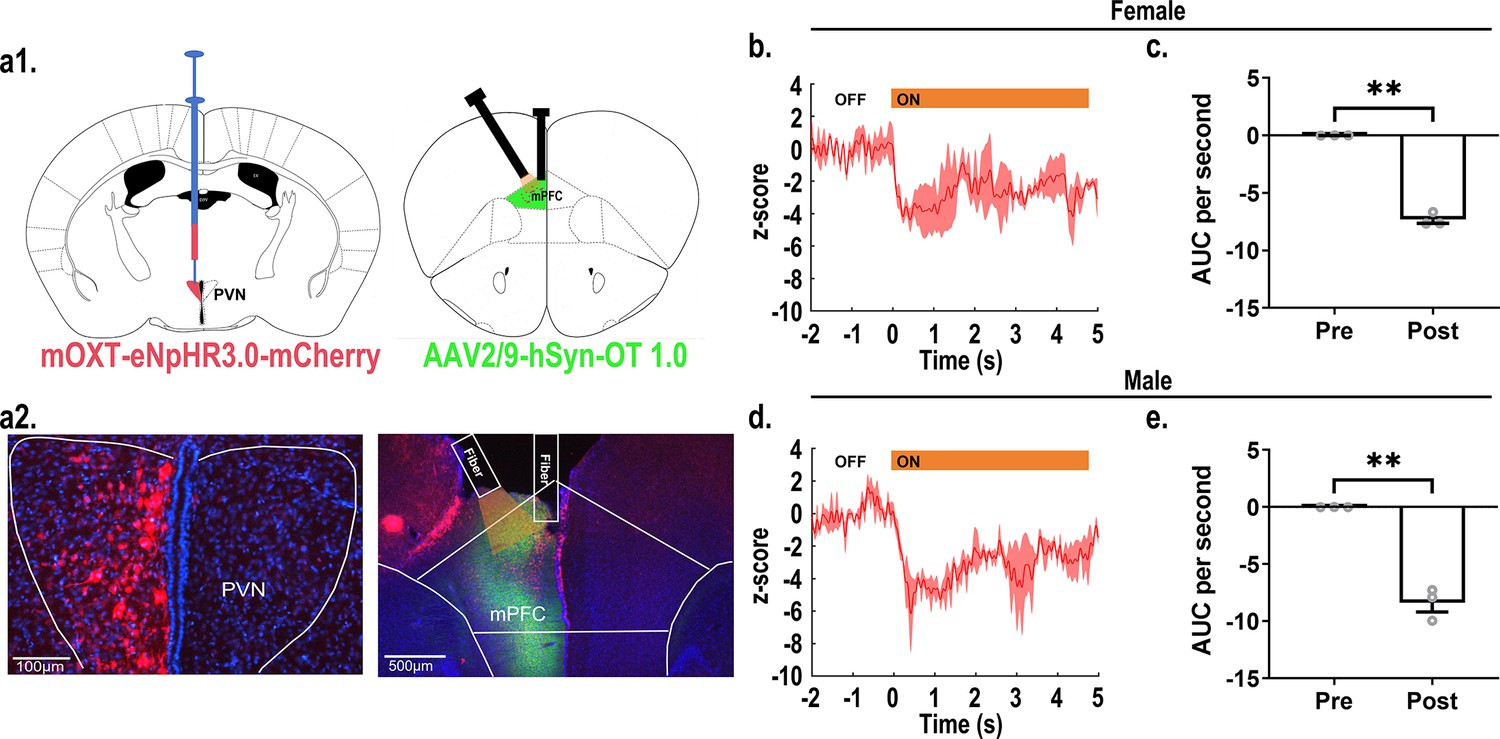
Recordings of oxytocin (OT) release during optogenetic inhibition of OT fibers in the medial prefrontal cortex (mPFC).
(a1) Schematic diagram of virus injection and optical fiber implanting. (a2) Representative histological images of viruses infection and fibers placement. Left: red: eNpHR3.0; blue: DAPI; objective: ×20, scale bars: 100 μm; Right: red: eNpHR3.0; green: OT1.0 sensors; blue: DAPI; objective: ×4, scale bars: 500 μm. (b) Representative histogram of OT release in female at 589 nm light. (c) Area under the curve (AUC) per second of OT1.0 sensors pre and post inhibition of optogenetics in females (n = 3). **p<0.01, Paired-samples t-test. (d) Representative histogram of OT release in male at 589 nm light. (e) AUC per second of OT release pre and post optogenetic inhibition in males (n = 3). **p<0.01, Paired-samples t-test. Error bars indicate SEM.
-
Figure 7—figure supplement 1—source data 1
Statistics of AUC before and after optogenetic inhibition.
- https://cdn.elifesciences.org/articles/96543/elife-96543-fig7-figsupp1-data1-v1.xlsx
Figure 8
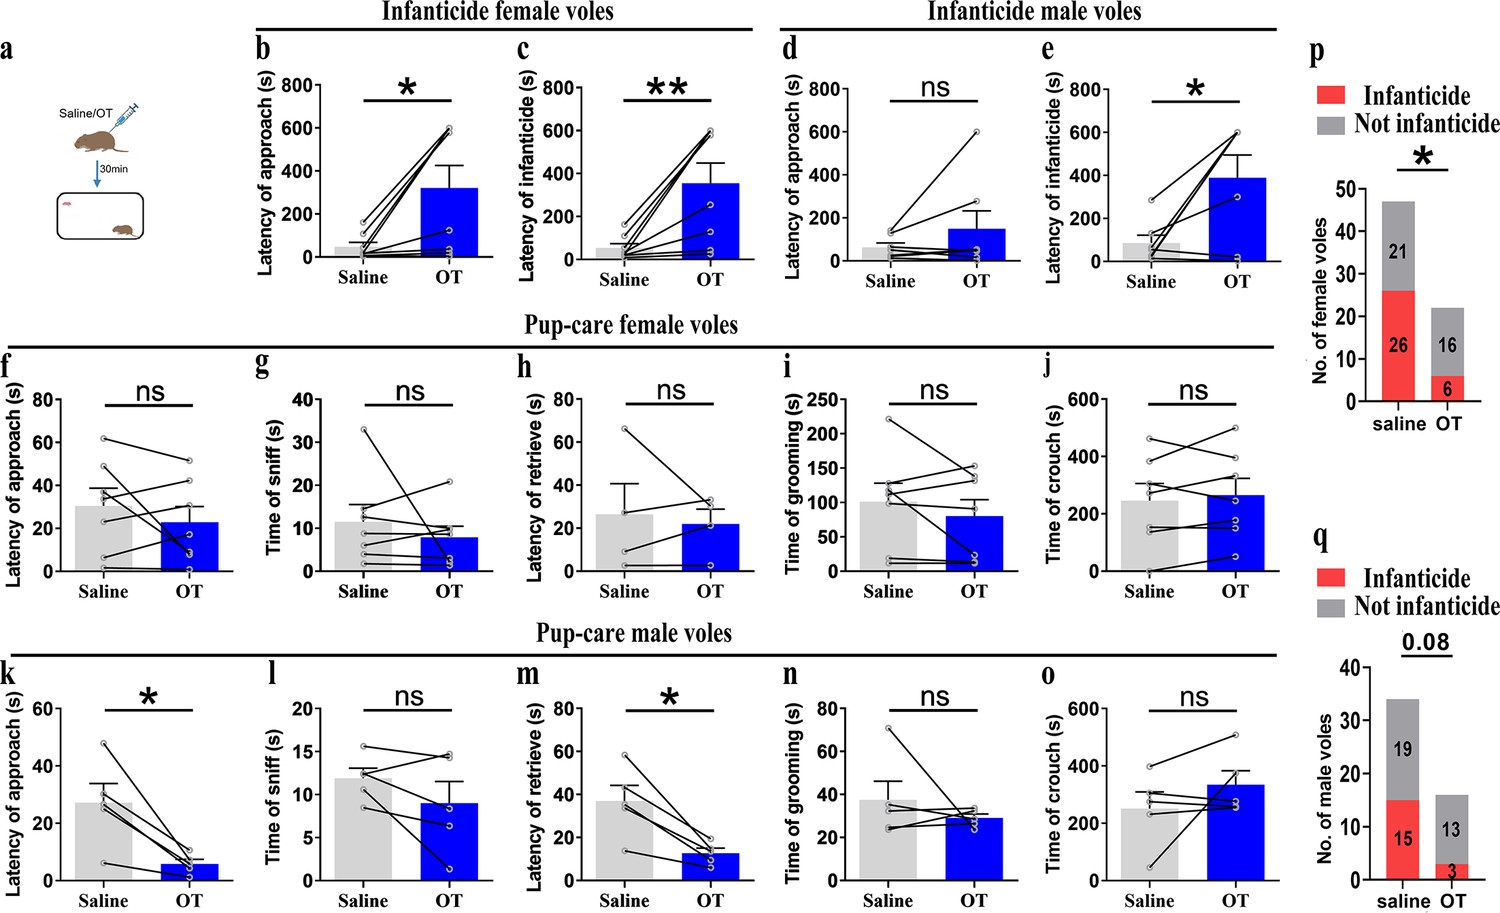
Pup-directed behaviors before and after intraperitoneal delivery of oxytocin (OT).
(a) Diagram of intraperitoneal OT delivery. (b, c) Approach (b) and infanticide latency (c) of infanticide female voles (n = 8). *p<0.05. Paired-samples t-test. **p<0.01. Wilcoxon signed-rank test. (d, e) Approach (d) and infanticide latency (e) of infanticide male voles (n = 7). *p<0.05. Paired-samples t-test. (f–j) Approach latency (f, n = 7), sniffing time (g, n = 7), latency to retrieve (h, n = 4), grooming time (i, n = 7), and crouching time (j, n = 7) before and after delivery of OT in pup-care female voles. (k–o) Approach latency (k), sniffing time (l), latency to retrieve (m), grooming time (n), and crouching time (o) before and after delivery of OT in pup-care male voles (n = 5). *p<0.05. Paired-samples t-test. (p, q) Changes in infanticide rates in female (p) and male (q) voles after administration of saline and OT. *p<0.05. Pearson chi-square test. Error bars indicate SEM.
-
Figure 8—source data 1
Statistical results of the latency to approach and attack pups in infanticide voles, and the latency to approach and retrieve pups, duration of grooming, sniffing, and crouching in pup-care voles.
Statistical results of the number of infanticide or non-infanticide voles induced by injection of saline and OT.
- https://cdn.elifesciences.org/articles/96543/elife-96543-fig8-data1-v1.xlsx
Figure 9
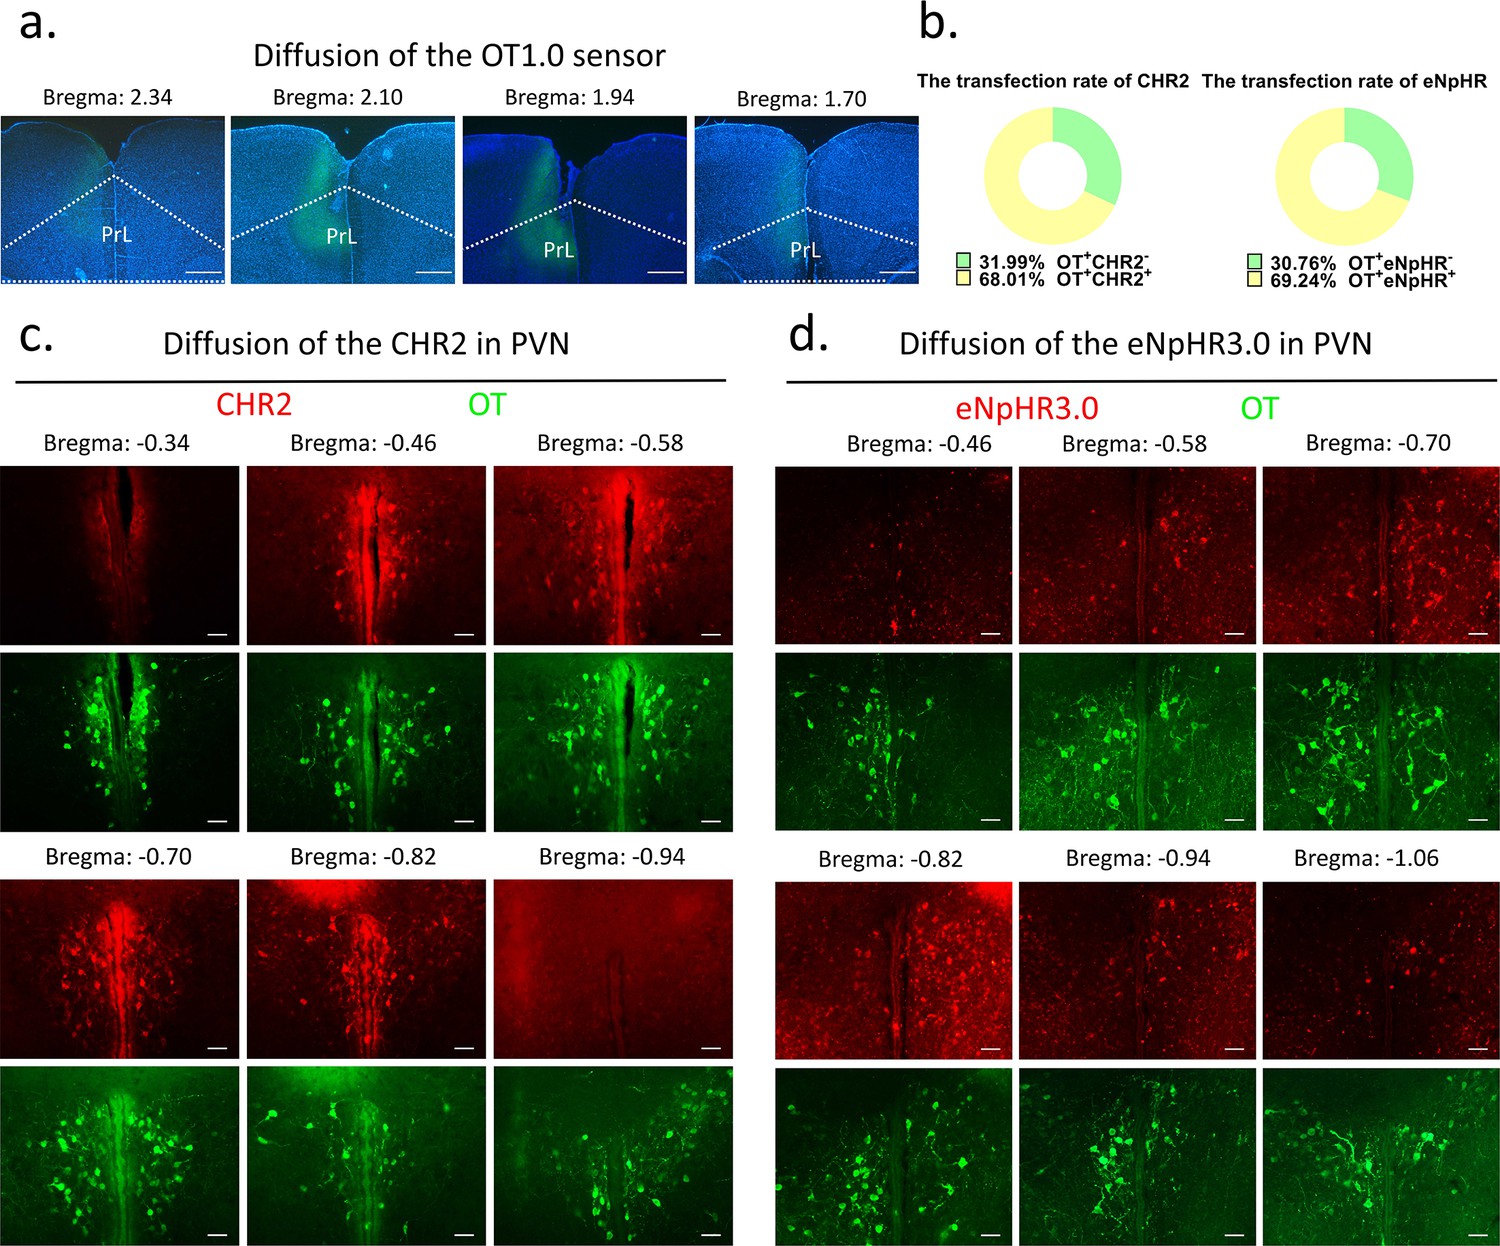
Diffusion of centrally injected agents.
(a) Diffusion of OT1.0 sensor in PrL. Green: OT1.0 sensors; blue: DAPI; objective: ×4. Scale bars: 500 μm. (b) The transfection rate of chr2 (n = 3) and eNpHR3.0 (n = 3) in OT cells. (c) Diffusion of CHR2 in PVN. Green: OT; red: CHR2; objective: ×20. Scale bars: 50 μm. (d) Diffusion of eNpHR3.0 in PVN. Green: OT; red: eNpHR3.0; objective: ×20. Scale bars: 50 μm.
-
Figure 9—source data 1
Counting of CHR2 and eNpHR3.0 virus-transfected OT cells.
- https://cdn.elifesciences.org/articles/96543/elife-96543-fig9-data1-v1.xlsx
Figure 10
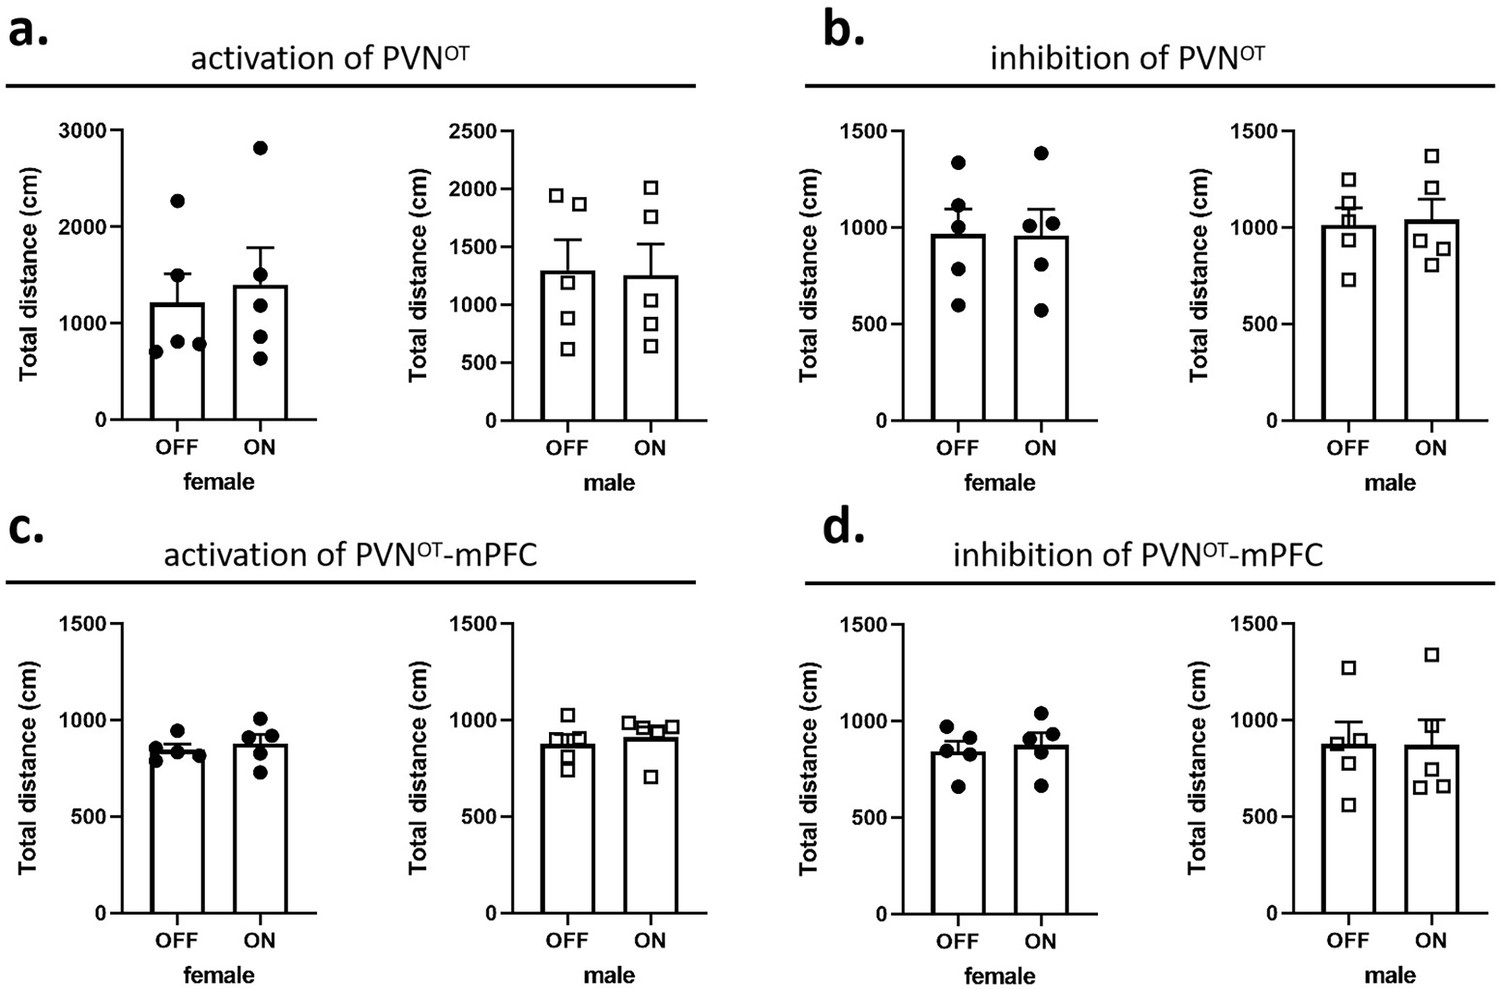
Effects of optogenetic manipulations on locomotion of the subjects.
(a, b) Total distance traveled by the subject before and after activation or inhibition of the paraventricular nucleus (PVN) oxytocin (OT) neurons (n = 5). (c, d) Total distance traveled by the subject before and after activation or inhibition of the PVN OT neurons projections to the medial prefrontal cortex (mPFC) (n = 5). Error bars indicate SEM. Statistical analyses were performed with paired samples t-tests.
-
Figure 10—source data 1
Statistics of distance traveled before and after optogenetic manipulation.
- https://cdn.elifesciences.org/articles/96543/elife-96543-fig10-data1-v1.xlsx
Author response image 1
Author response image 2

Tables
Key resources table
| Reagent type (species) or resource | Designation | Source or reference | Identifiers | Additional information |
|---|---|---|---|---|
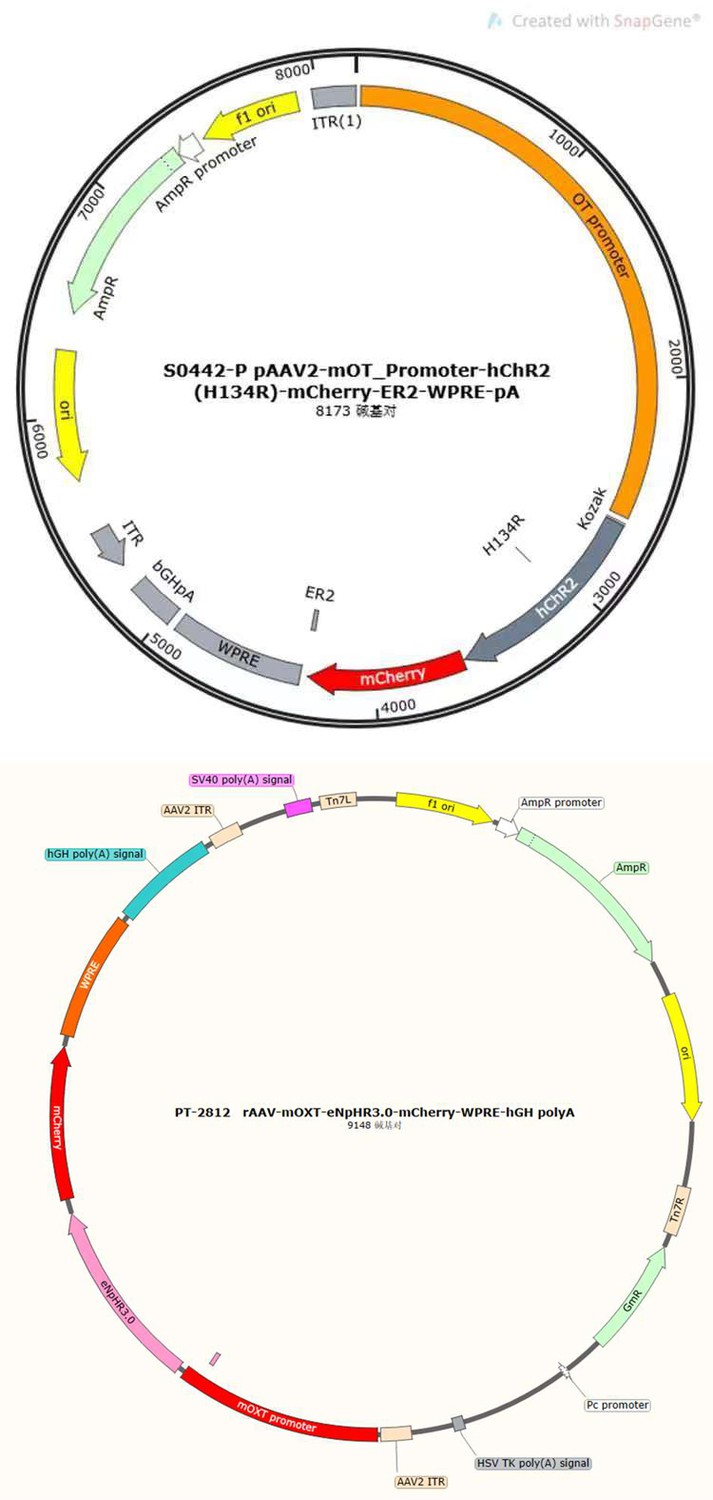
| Transfected construct (Mus musculus) | AAV2/9-mOXT: Promoter-hCHR2(H134R)–mCherry-ER2-WPRE-pA | Shanghai Taitool Bioscience | S0442-9-H20 | Adeno-associated virus construct to transfect and express CHR2 |
| Transfected construct (M. musculus) | AAV2/9-mOXT: Promoter-mCherry-pA | Shanghai Taitool Bioscience | S0443-9 | Adeno-associated virus constructs to transfect and express mCherry |
| Transfected construct (M. musculus) | AAV2/9-mOXT-eNpHR3.0-mCherry-WPRE-hGH-pA | BrainVTA | Cat#PT-2812 | Adeno-associated virus constructs to transfect and express eNpHR3.0 |
| Transfected construct (M. musculus) | AAV2/9-hSyn-OT 1.0 | Brain Case | BC-0293 | Adeno-associated virus constructs to transfect and express OT sensor |
| Transfected construct (M. musculus) | AAV2/9-hSyn-OTmut | Brain Case | BC-1119 | Adeno-associated virus constructs to transfect and express OTmut sensor |
| Transfected construct (M. musculus) | AAV11-EF1α-EGFP | Brain Case | BC-0012 | Adeno-associated virus constructs to transfect and express EGFP |
| Antibody | Mouse anti-OT (monoclonal antibody) | Millipore | Cat# MAB5296; RRID:AB_2157626 | 1:7000 |
| Antibody | Rabbit anti-c-Fos (polyclonal antibody) | Abcam | Cat# ab190289; RRID:AB_2737414 | 1:1000 |
| Antibody | Goat anti-mouse Alexa Fluor 488 | Jackson ImmunoResearch | Cat# 115-545-062; RRID:AB_2338845 | 1:200 |
| Antibody | Goat anti-rabbit Alexa Fluor 488 | Jackson ImmunoResearch | Cat# 111-545-003; RRID:AB_2338046 | 1:200 |
| Antibody | Goat anti-rabbit TRITC | Jackson ImmunoResearch | Cat# 111-025-003; RRID:AB_2337926 | 1:200 |
| Chemical compound, drug | Ready-to-use DAPI | Boster | Cat# AR1177 | |
| Chemical compound, drug | Ready-to-use goat serum | Boster | Cat# AR0009 | |
| Chemical compound, drug | OT | Bachem | Cat# 50-56-6 | |
| Software, algorithm | MATLAB | MathWorks | RRID:SCR_001622 | |
| Software, algorithm | JWatcher | http://www.jwatcher.ucla.edu/ | RRID:SCR_017595 | |
| Software, algorithm | SPSS | IBM | RRID:SCR_002865 |
Additional files
Download links
A two-part list of links to download the article, or parts of the article, in various formats.
Downloads (link to download the article as PDF)
Open citations (links to open the citations from this article in various online reference manager services)
Cite this article (links to download the citations from this article in formats compatible with various reference manager tools)
PVN-mPFC OT projections modulate pup-directed pup care or attacking in virgin mandarin voles
eLife 13:RP96543.
https://doi.org/10.7554/eLife.96543.3


