Combining radio-telemetry and radar measurements to test optimal foraging in an aerial insectivore bird
- Department of Evolutionary and Environmental Biology and Institute of Evolution, University of Haifa, Israel
- Blavatnik School of Computer Science, Tel-Aviv University, Israel
- Department of Ecology, Evolution, and Behaviour, Alexander Silberman Institute of Life Sciences, The Hebrew University of Jerusalem, Israel
Figures
Figure 1 with 1 supplement
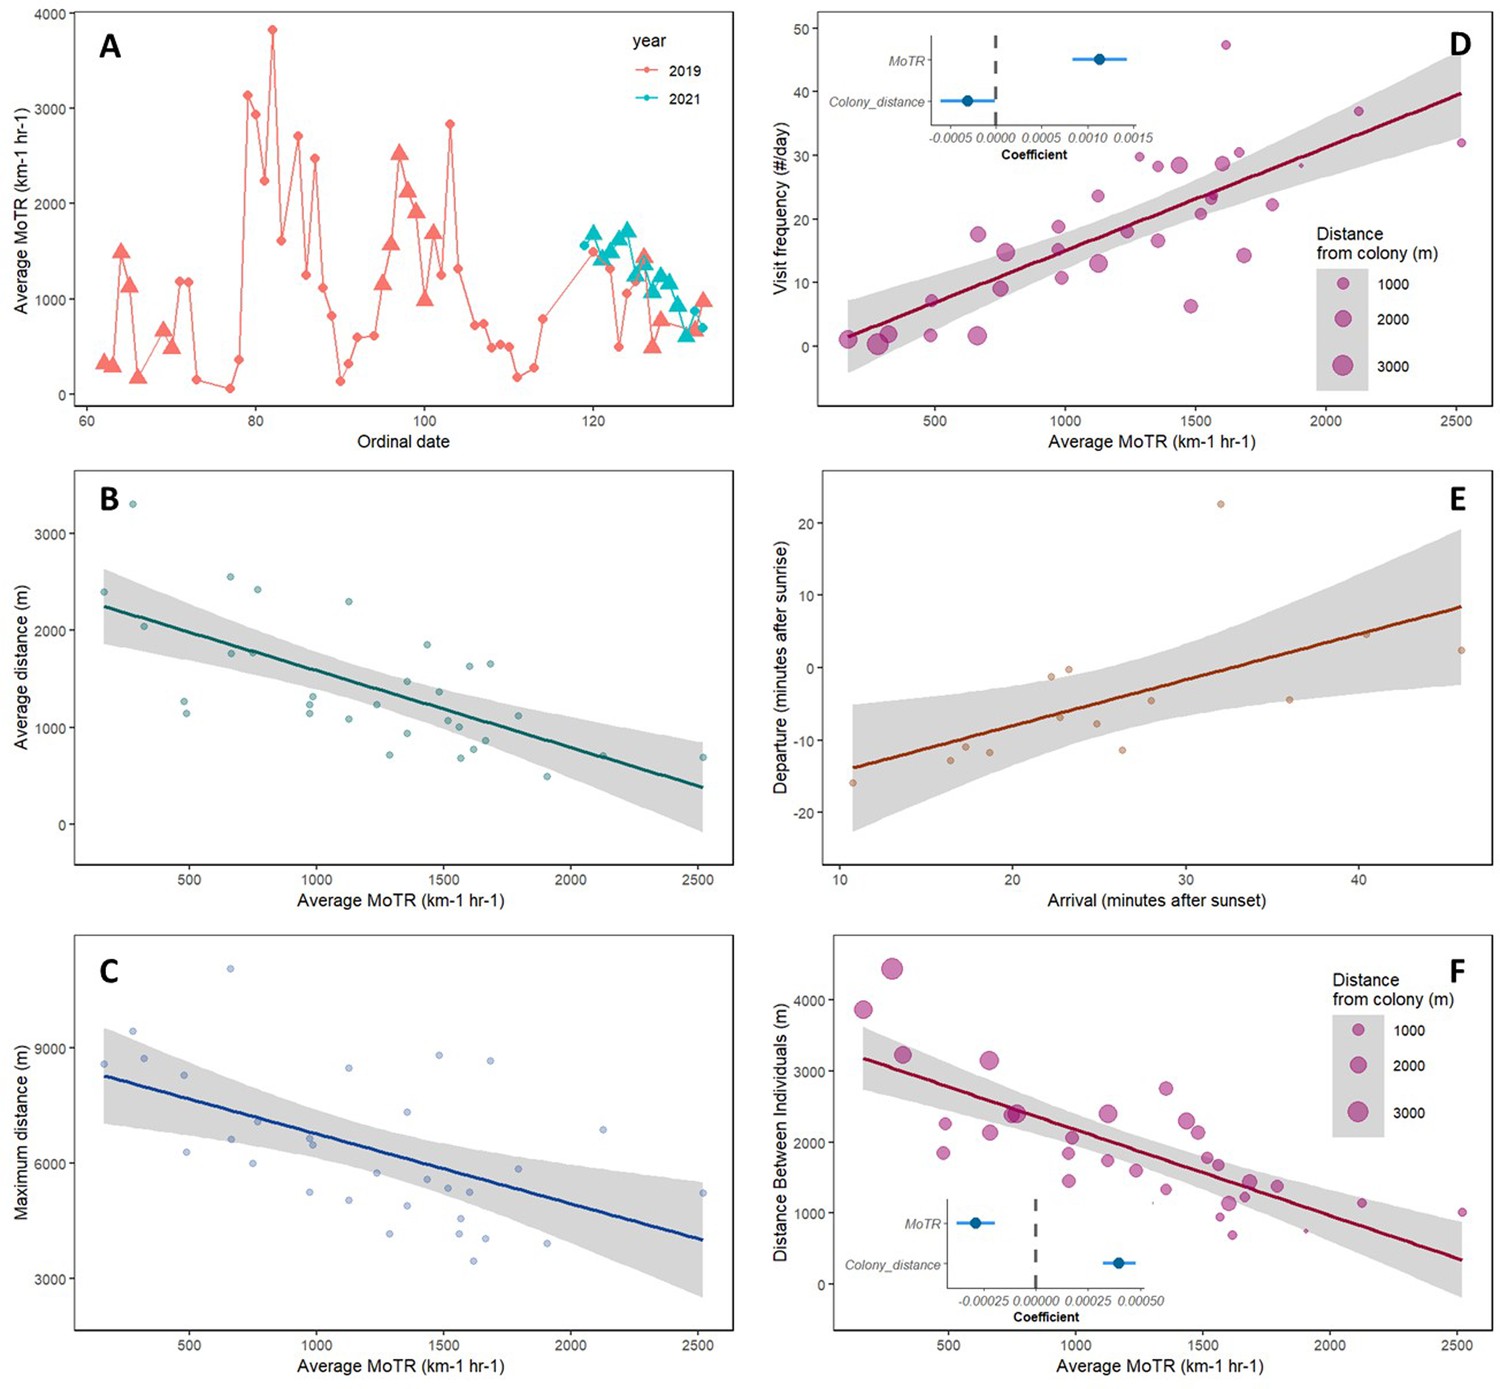
Insect traffic rate (movement traffic rate [MoTR]) and its effects on the aerial foraging of Little Swifts.
(A) Average daily insect abundance in relation to an ordinal date. Triangles represent days when data allowed examining swift movement in relation to MoTR. MoTR varied across days within the swifts’ breeding season by more than an order of magnitude. (B) The effect of MoTR on the average flight distance from the breeding colony. (C) The effect of MoTR on the maximal flight distance from the breeding colony. (D) The effect of MoTR on the average daily frequency of visits at the breeding colony; inset: coefficient value and confidence intervals of the coefficient resulting from the model testing the effects of MoTR and distance from the breeding colony on the frequency of visits. (E) The relationship between the time of departure from the breeding colony in the morning after the overnight stay and the time of arrival to the colony prior to the overnight stay the previous evening. (F) The effect of MoTR on the daily average distance between foraging individuals; inset: coefficient value and confidence intervals of the coefficient resulting from the model testing the effects of MoTR and distance from the colony on the distance between individuals.
Figure 1—figure supplement 1

An expected increase in the average distance between individuals with an increase in the distance from the breeding colony (black circle in the center of the figure).
Figure 2
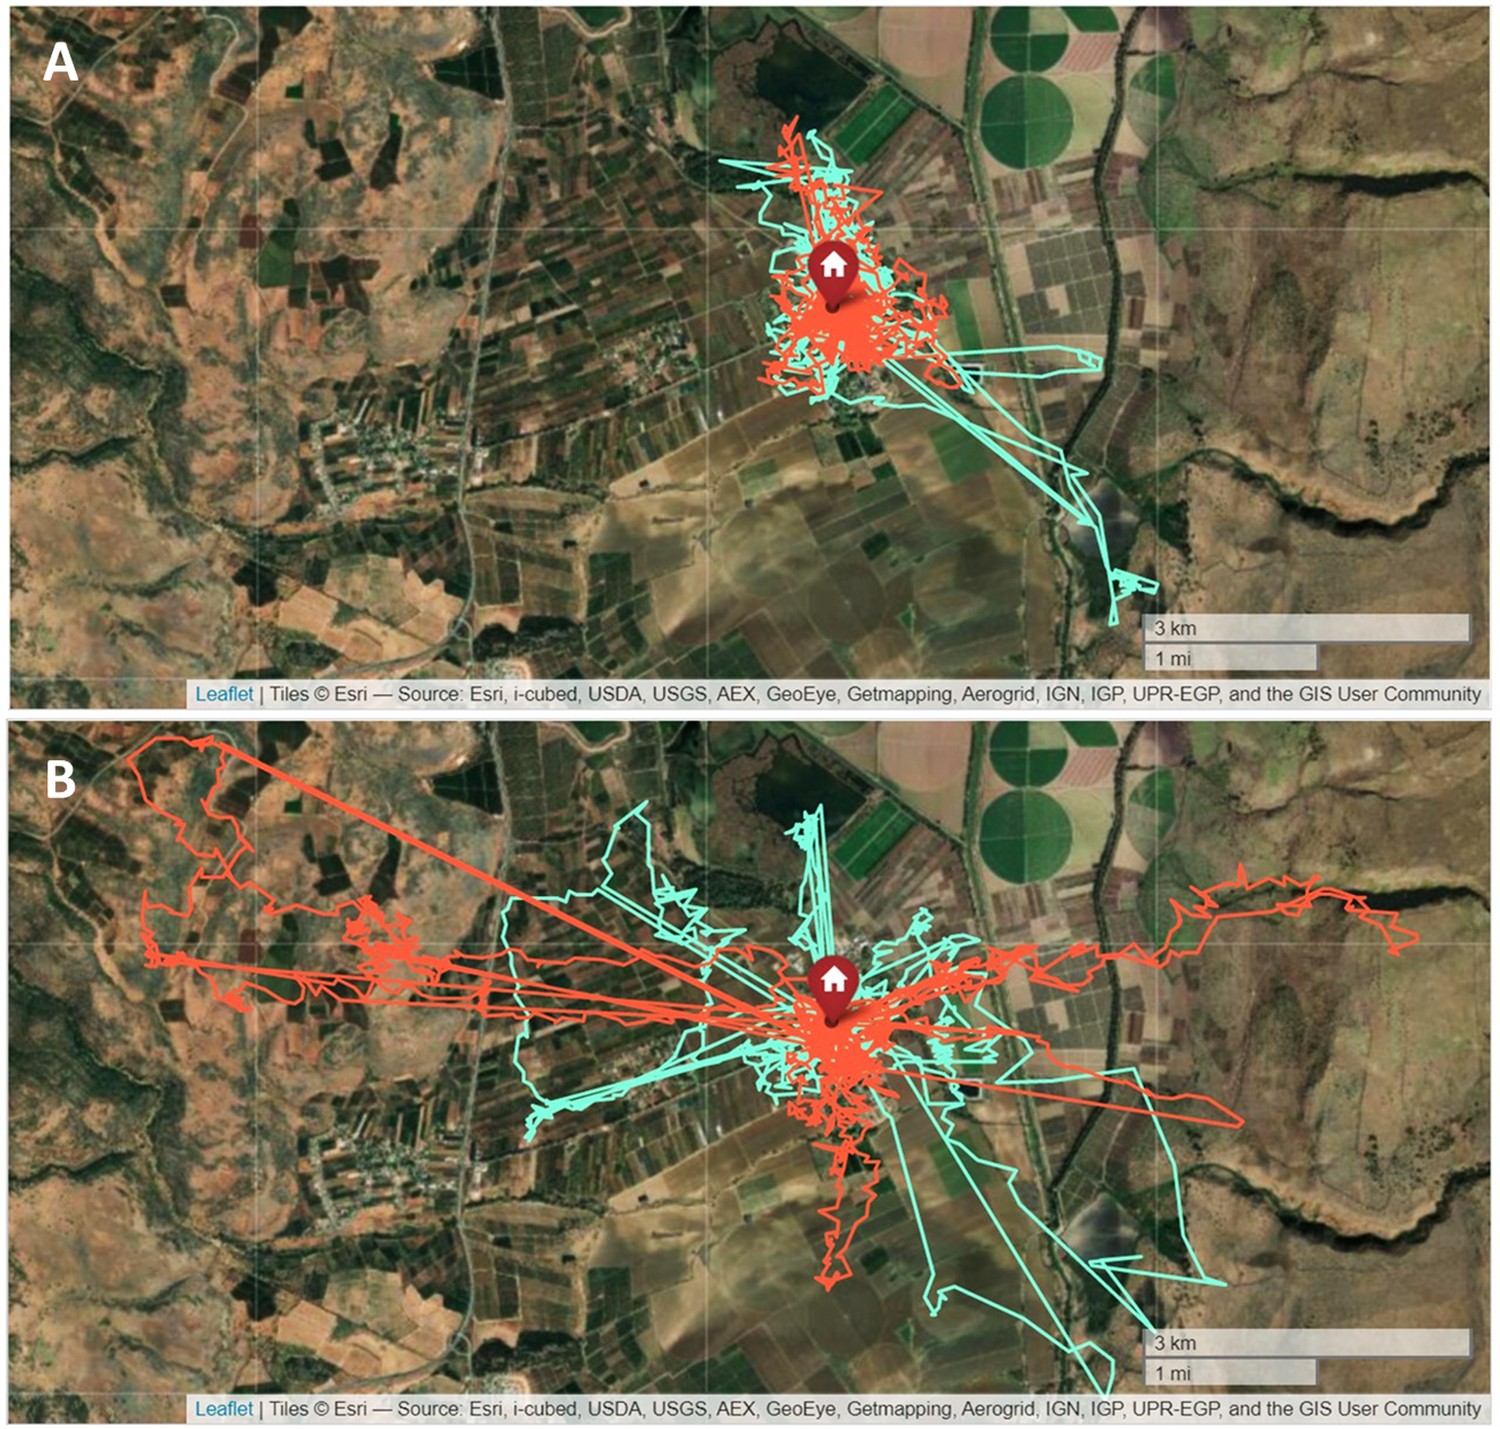
Foraging range in relation to insect abundance.
Differences in the movement routes of two individuals (marked in light blue and orange) on two consecutive days that were characterized by large differences in movement traffic rate (MoTR). (A) 09.04.2019 (average MoTR = 1904.2 insects km–1 hr–1). (B) 10.04.2019 (average MoTR = 983.5 insects km–1 hr–1).
Figure 3
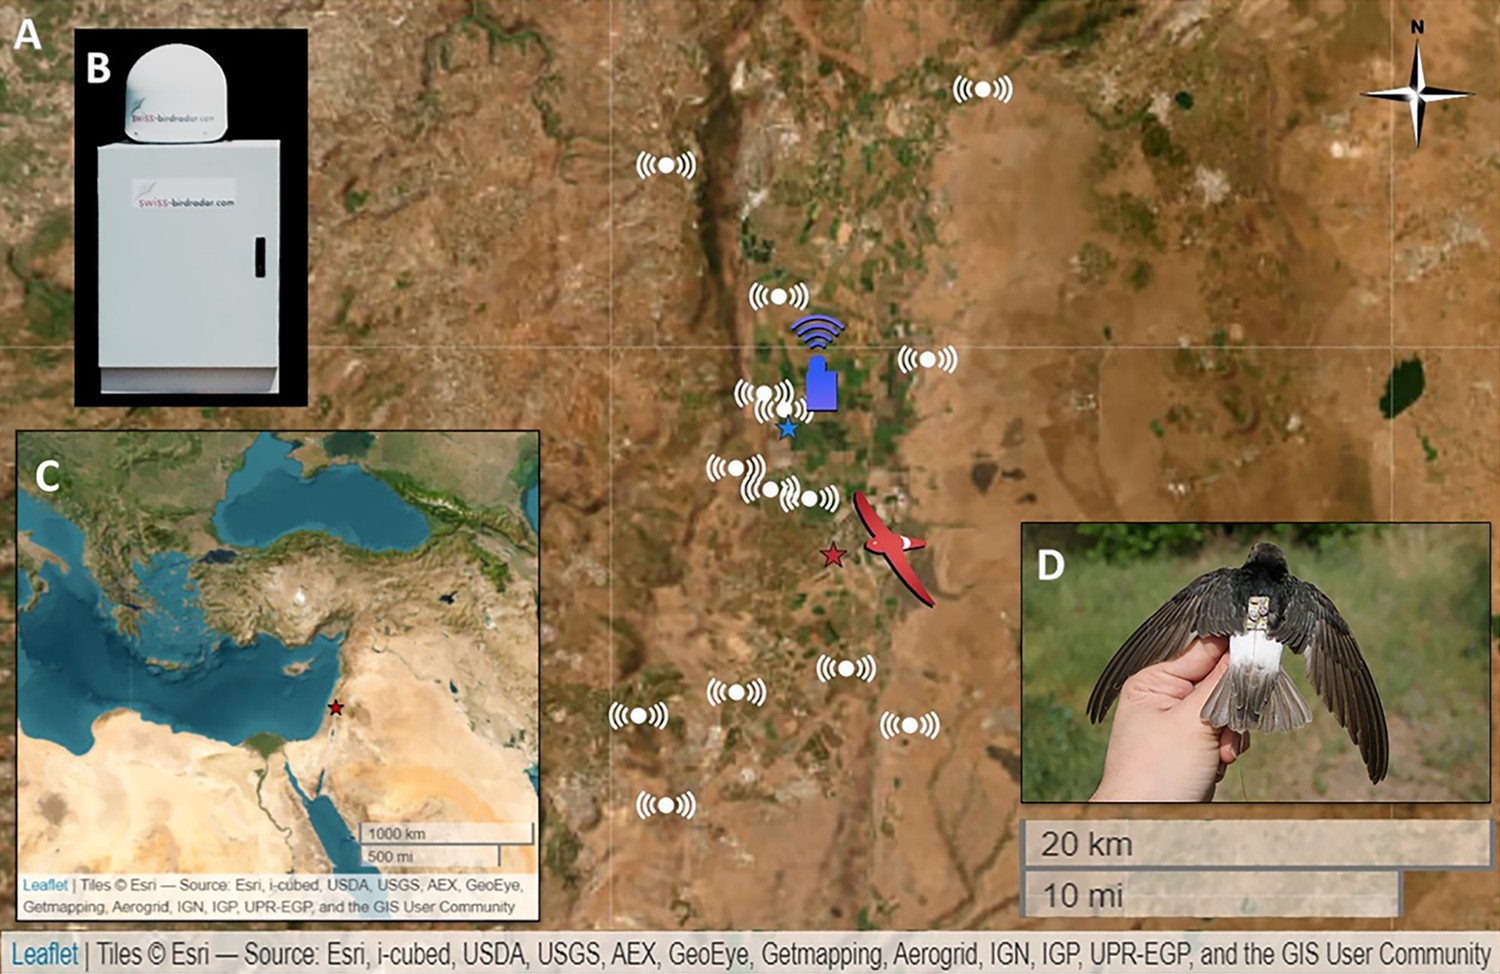
The research system.
(A) Map of the Hula Valley, Israel, and the surrounding area. The red star represents the location of the Little Swifts’ breeding colony. The blue star depicts the location of the radar. White markings indicate the locations of the Advanced Tracking and Localization of Animals in Real-Life Systems’ (ATLAS) antennas. (B) The BirdScan-MR1 radar. (C) The location of the research system in northeastern Israel within the Middle East is indicated by a red star. (D) A Little Swift with an ATLAS tag.
Tables
Table 1
Summary of the statistical analyses.
| Dependent variable | Independent variable | Estimate | t value | p value | Sample size (days) | Statistical test |
|---|---|---|---|---|---|---|
| Seasonal trend: average daily MoTR | Ordinal date | –0.007 | 0.971 | 31 | Spearman’s rank correlation | |
| Prediction 1: Average distance from breeding colony | Average daily MoTR | <−0.001 | –5.27 | <0.001 | 31 | Gamma GLM |
| Prediction 2: Maximum distance from breeding colony | Average daily MoTR | –1.818 | –3.52 | 0.001 | 31 | Gaussian GLM |
| Prediction 3: Daily route | Average daily MoTR | <−0.001 | –1.65 | 0.123 | 15 | Gamma GLM |
| Prediction 4: Daily duration of foraging | Average daily MoTR | 0.029 | 1.05 | 0.315 | 15 | Gaussian GLM |
| Prediction 5: Frequency of visits at breeding colony | Average daily MoTR (the first of two independent variables) | 0.001 | 3.78 | <0.001 | 31 | Gamma GLM |
| Distance from breeding colony (the second of two independent variables) | <−0.001 | 2.03 | 0.043 | 31 | ||
| Prediction 6: Average flight speed | Average daily MoTR | <−0.001 | –1.33 | 0.193 | 31 | Gaussian GLM |
| Prediction 7: Evening arrival time to breeding colony | Average daily MoTR | –0.011 | –2.27 | 0.034 | 23 | Gaussian GLM |
| Prediction 8: Departure from breeding colony (overnight stay) | MoTR on the previous day | 0.002 | 0.26 | 0.801 | 20 | Gaussian GLM |
| Prediction 9a: Departure from breeding colony (overnight stay) | Evening arrival time to breeding colony (previous day) | 0.634 | 2.81 | 0.016 | 14 | Gaussian GLM |
| Prediction 9b: Departure from breeding colony (overnight stay) | MoTR on the same day | –0.005 | –1.07 | 0.297 | 20 | Gaussian GLM |
| Prediction 10: Distance between individuals | Average daily MoTR (the first of two independent variables) | <−0.001 | –3.12 | 0.004 | 31 | Gamma GLM |
| Distance from breeding colony (the second of two independent variables) | <0.001 | 5.02 | <0.001 | 31 |
-
GLM, Generalized Linear Model; MoTR, movement traffic rate.
Table 2
Top models (ΔAIC <2) for colony visit frequency.
The best model includes ‘Distance from breeding colony’ and ‘Average daily MoTR’.
| Model | Intercept | Distance frombreeding colony | Average dailyMoTR | df | LogLik | AICc | Delta | Weight |
|---|---|---|---|---|---|---|---|---|
| 4 | 2.174 | <−0.001 | 0.001 | 4 | –108.2 | 225.9 | 0.00 | 0.626 |
| 3 | 1.093 | 0.001 | 3 | –110.1 | 227.1 | 1.13 | 0.356 |
Additional files
Download links
A two-part list of links to download the article, or parts of the article, in various formats.
Downloads (link to download the article as PDF)
Open citations (links to open the citations from this article in various online reference manager services)
Cite this article (links to download the citations from this article in formats compatible with various reference manager tools)
Combining radio-telemetry and radar measurements to test optimal foraging in an aerial insectivore bird
eLife 13:RP96573.
https://doi.org/10.7554/eLife.96573.4


