Fractal cycles of sleep, a new aperiodic activity-based definition of sleep cycles
- Radboud University Medical Centre, Donders Institute for Brain, Cognition and Behavior, Netherlands
- Child Development Center and Children’s Research Center, University Children's Hospital Zürich, University of Zürich, Switzerland
- Department of Child and Adolescent Psychiatry and Psychotherapy, Psychiatric University Hospital Zurich, Switzerland
- Max Planck Institute of Psychiatry, Germany
- Klinikum Ingolstadt, Centre of Mental Health, Germany
- Semmelweis University, Institute of Behavioural Sciences, Hungary
Figures
Figure 1 with 4 supplements
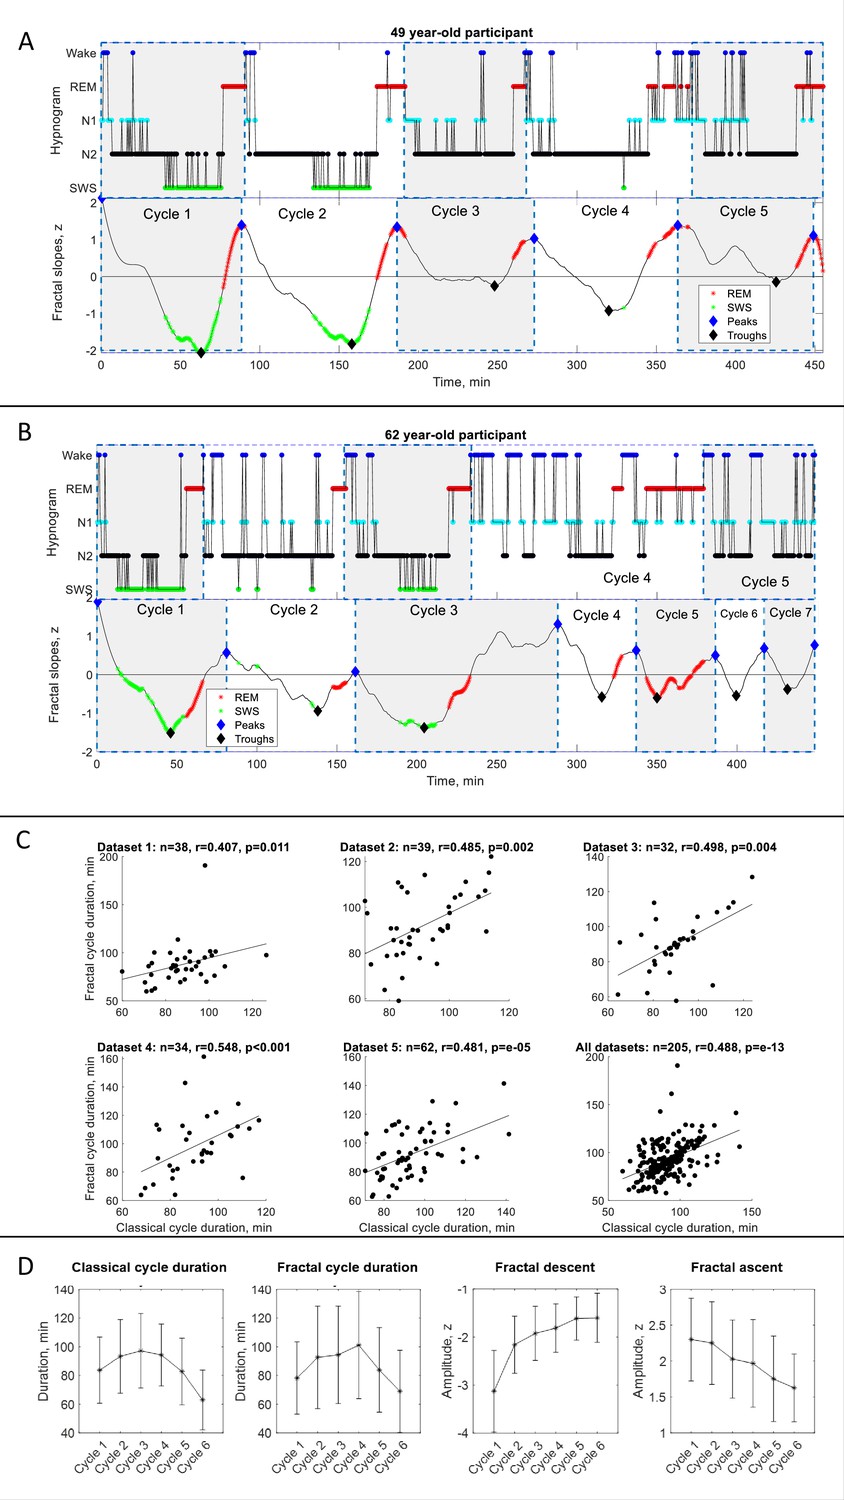
Fractal cycles in healthy adults.
(A – B) Individual fractal and classical sleep cycles. Time series of smoothed z-normalized fractal slopes (bottom) and corresponding hypnograms (top) observed in two different participants. The duration of the fractal cycle is a time interval between two successive peaks (blue diamonds). (A) S15 from Dataset 3 shows a one-to-one match between fractal cycles defined by the algorithm and classical (non-REM – REM) cycles defined by the hypnogram. (B) In S22 from dataset 5, the second part of night has many wake epochs, some of them are identified by the algorithm as local peaks. This results in a higher number of fractal cycles as compared to the classical ones and a poor match between the fractal cycles No. 3–7 and classical cycles No. 2–5. The algorithm does not distinguish between the wake and REM-related fractal slopes and can define both as local peaks. Since the duration of the fractal cycles is defined as an interval of time between two adjacent peaks, more awakenings/arousals during sleep (usually associated with aging) are expected to result in more peaks and, consequently, more fractal cycles, that is a shorter cycle duration. This is one of the possible explanations for the correlation between the fractal cycle duration and age (shown in Figure 1—figure supplement 4A). Time series of the fractal slopes and corresponding hypnograms for all participants are reported in Supplementary PowerPoint File shared on https://osf.io/gxzyd. SWS – slow-wave sleep, REM – rapid eye movement. (C) Scatterplots: each dot represents the duration of the cycles averaged over one participant. The durations of the fractal and classical sleep cycles averaged over each participant correlate in all analyzed datasets, raw (non-ranked) values are shown, r – Spearman’s correlation coefficient. (D) Cycle-to-cycle overnight dynamics show an inverted U shape of the duration of both fractal and classical cycles across a night and a gradual decrease in absolute amplitudes of the fractal descents and ascents from early to late cycles.
Figure 1—figure supplement 1
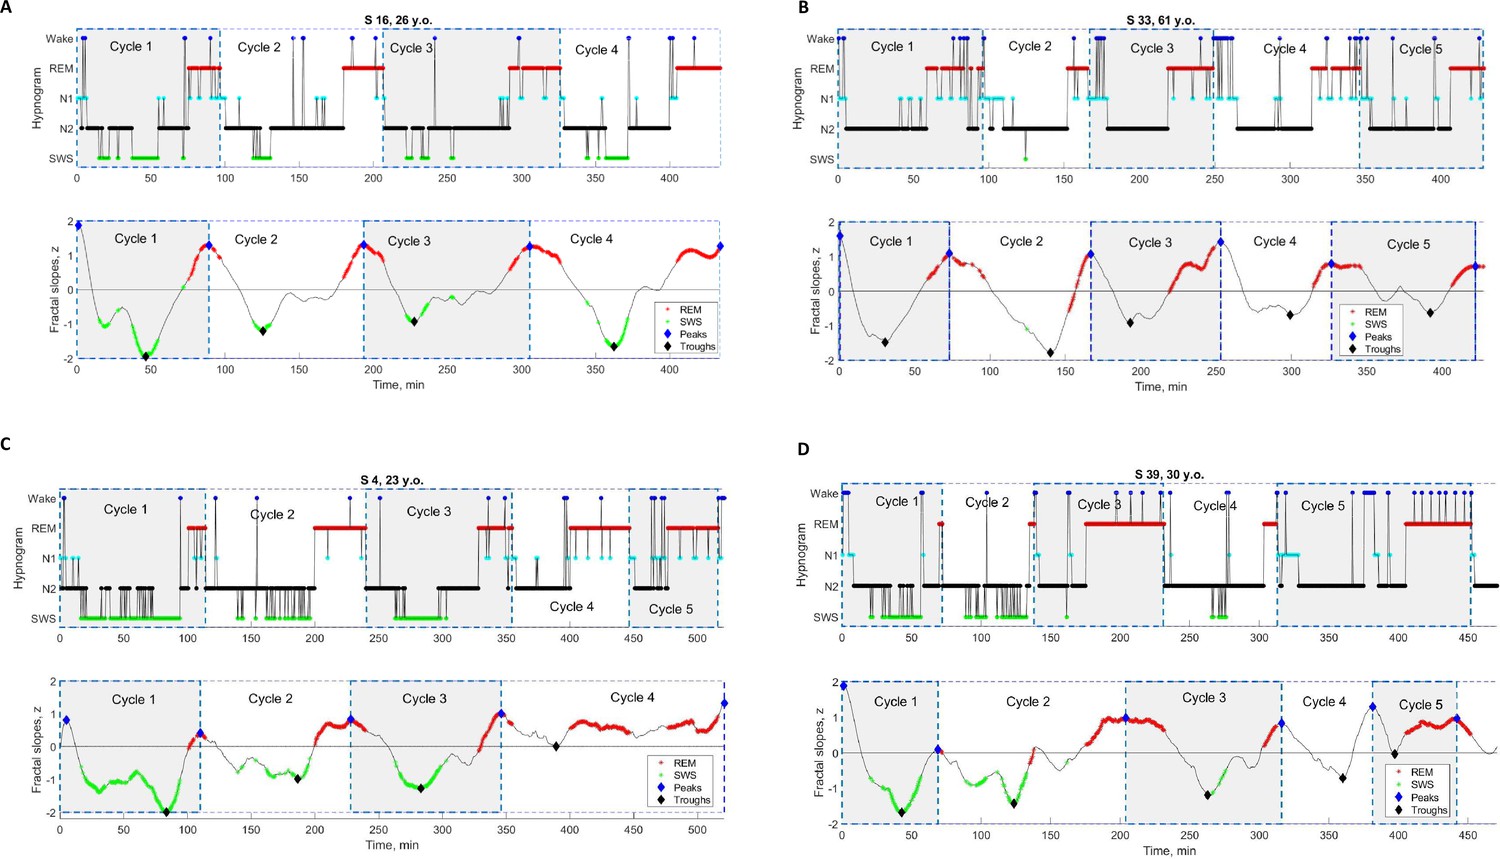
Individual fractal and classical sleep cycles in healthy adults.
Time series of smoothed z-normalized fractal slopes (bottom) and corresponding hypnograms (top). The duration of the fractal cycle is an interval of time between two successive peaks (blue diamonds) defined with Matlab’s function findpeaks with the minimum peak distance of 40 min and minimum peak prominence of 0.9 z. Supplementary PowerPoint File shared on https://osf.io/gxzyd presents these time series and hypnograms for all participants. (A – B) one-to-one match. In these two participants (from Dataset 3), there is an almost one-to-one match between fractal cycles defined by the algorithm and classical (non-REM – REM) cycles defined by the hypnogram. (C – D) algorithm’s misses. Two participants from Dataset. In S4, the fourth fractal cycle corresponds to two classical cycles, No.4 and No.5, since the algorithm misses the local fractal peak at the 410th minute, which is not high enough (< |0.9| z). In S39, the second fractal cycle corresponds to two classical cycles, No.2 and No.3: the algorithm misses the local fractal peak at the 140th minute (the time of the corresponding REM episode), as the amplitude of the subsequent fractal descent is < |0.9| z. Two fractal cycles, No. 4 and No. 5, correspond to one classical cycle, No. 5: the algorithm identifies the wake episode at the 380th minute (in the middle of the 5th classical cycle) as a local fractal peak, i.e., the end of the fractal cycle. SWS – slow-wave sleep, REM – rapid eye movement sleep.
Figure 1—figure supplement 2
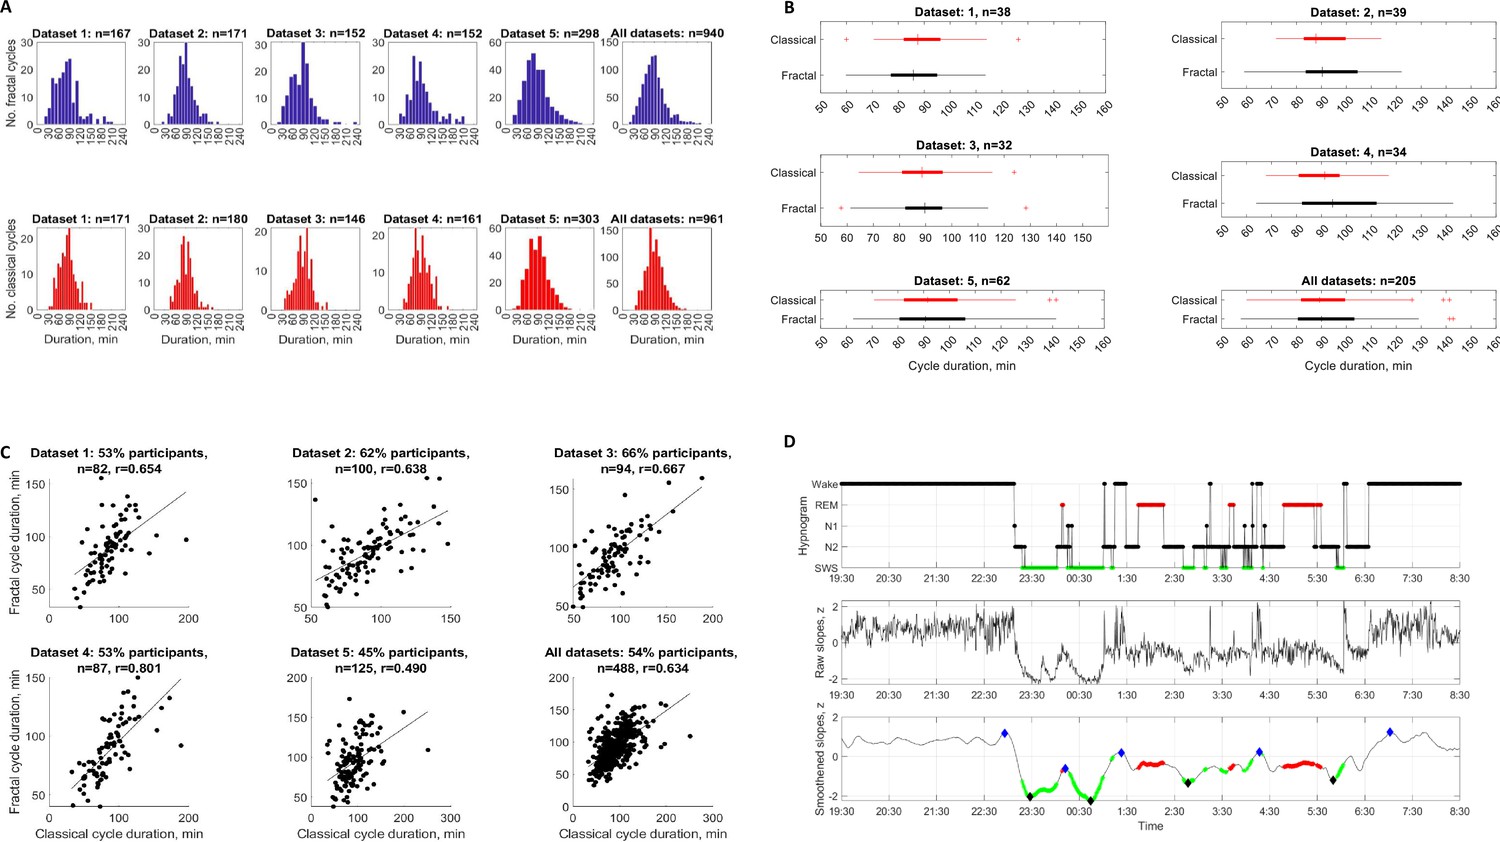
Fractal and classical cycles: distributions, means, correlations and an individual example.
(A) Frequency distribution of fractal and classical cycle durations. The individual fractal (top) and classical (bottom) cycles are counted (n) for each dataset separately and for all datasets merged. Across studies, 205 healthy adult participants provided 940 fractal cycles with a mean of 4.6±1.0 cycles per participant and 961 classical cycles with a mean of 4.7±0.9 cycles per participant. For both fractal and classical cycles, Kolmogorov-Smirnov test rejected the assumption that cycle duration comes from a standard normal distribution. (B) Box plots of fractal and classical cycle durations. In each box, a vertical central line represents the median, the left and right edges of the box indicate the 25th and 75th percentiles, respectively, the whiskers extend to the most extreme data points not considered outliers, and a plus sign represents outliers. (C) A subset of healthy adults with a one-to-one match between fractal and classical cycles durations (correlations). In a subset of the participants (from 45 to 66% in different datasets), there was a one-to-one match between fractal and classical cycles, each dot represents an individual cycle, n – number of cycles, all p-values < , r – Spearman’s correlation coefficient. (D) Individual fractal time series across 13 hr. Time series of raw (middle) and smoothed z-normalized fractal slopes (bottom) as well as the corresponding hypnograms (top) in a 25-year-old healthy male. In addition to sleep-related fractal activity, this figure shows fractal activity during 3 hr before the sleep onset and 2 hr after awakening. The graph shows that fractal cycles are not observed during wake, being specific to sleep. This participant does not come from the datasets depicted in the current study (where no recordings >8 h were available). The study, EEG device and preprocessing are described in Rosenblum et al., 2024b. EEG power was averaged over F4, C4, and O2 electrodes, differentiated into its components, z-scored and smoothed as described in Methods of the current paper. The duration of the fractal cycle is a time interval between two successive peaks (blue diamonds). SWS – slow-wave sleep (green dots), REM – rapid eye movement sleep (red dots).
Figure 1—figure supplement 3
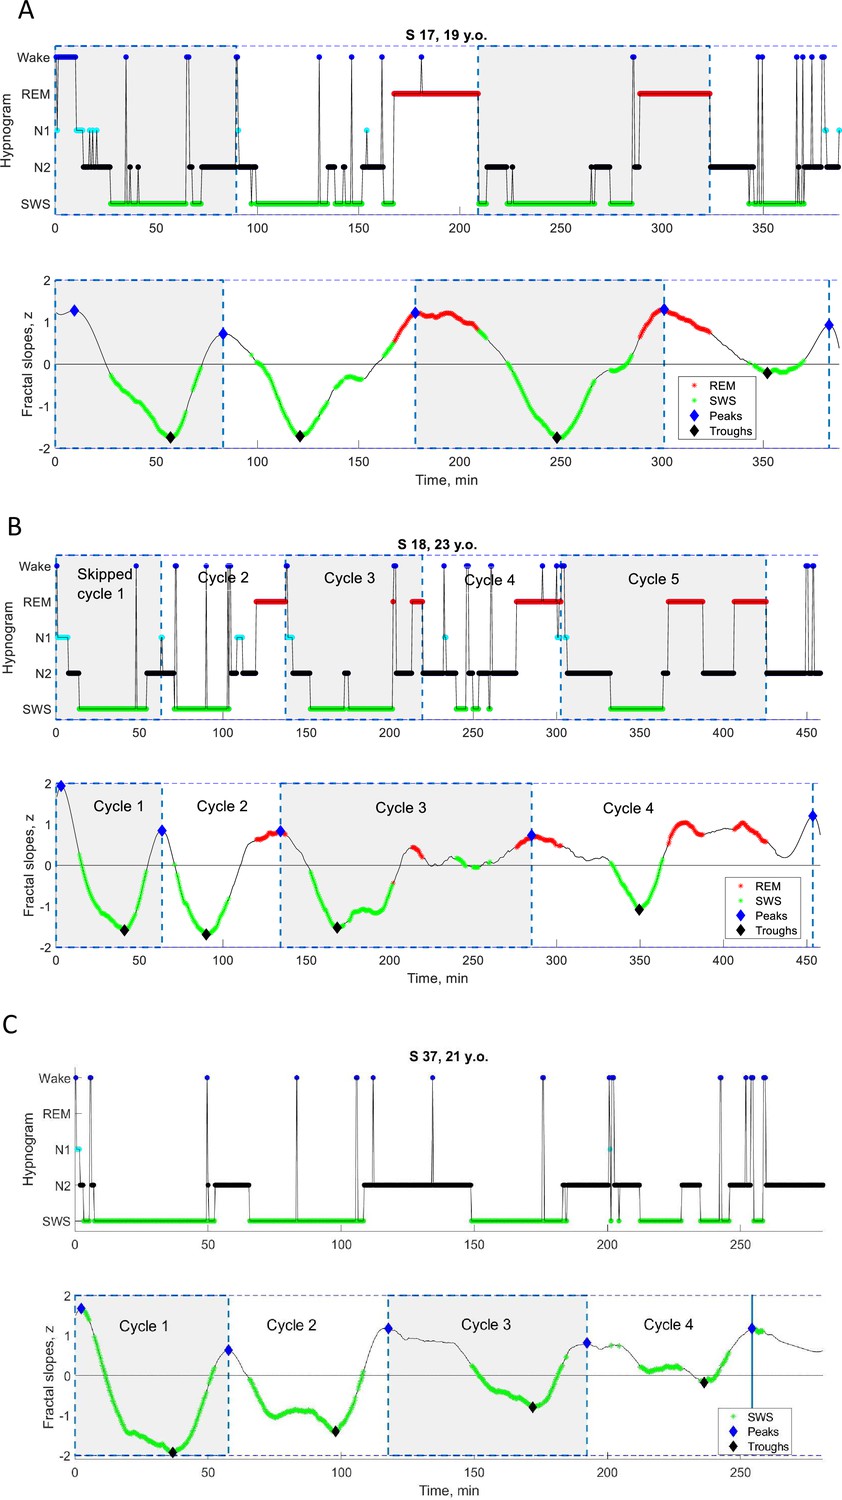
Individual cycles with skipped REM sleep.
Time series of smoothed z-normalized fractal slopes (bottom) and corresponding hypnograms (top) observed in three young healthy participants (from Dataset 4). Hypnograms show skipped first cycles (as well as the rest of the classical cycles). (A) In S17, at the 90th minute, an episode of REM sleep is expected to appear – except only a ‘lightening of sleep’ (wake, N1 and N2) is observed. We divided the long 209 min cycle into two cycles, the 90 min skipped cycle and the 119 min normal cycle. (B) In S18, at the 63rd minute, an episode of REM sleep is expected to appear – except only a ‘lightening of sleep’ (N1 and N2) is observed. We divided the long 138 min cycle into two cycles, the 63 min skipped cycle and the 75 min normal cycle. The fractal cycle algorithm was very effective in detecting skipped cycles, showing a one-to-one match with divided – but not long undivided – cycles. (C) S37’s hypnogram shows that she has no REM sleep at all, that is all her cycles are the ‘skipped’ ones. Based on this, S37 was even excluded from the formal analysis. This example is presented here to illustrate that the fractal cycle algorithm is sensitive enough in detecting sleep cycles even in the absence of REM sleep. SWS – slow-wave sleep, REM – rapid eye movement sleep.
Figure 1—figure supplement 4
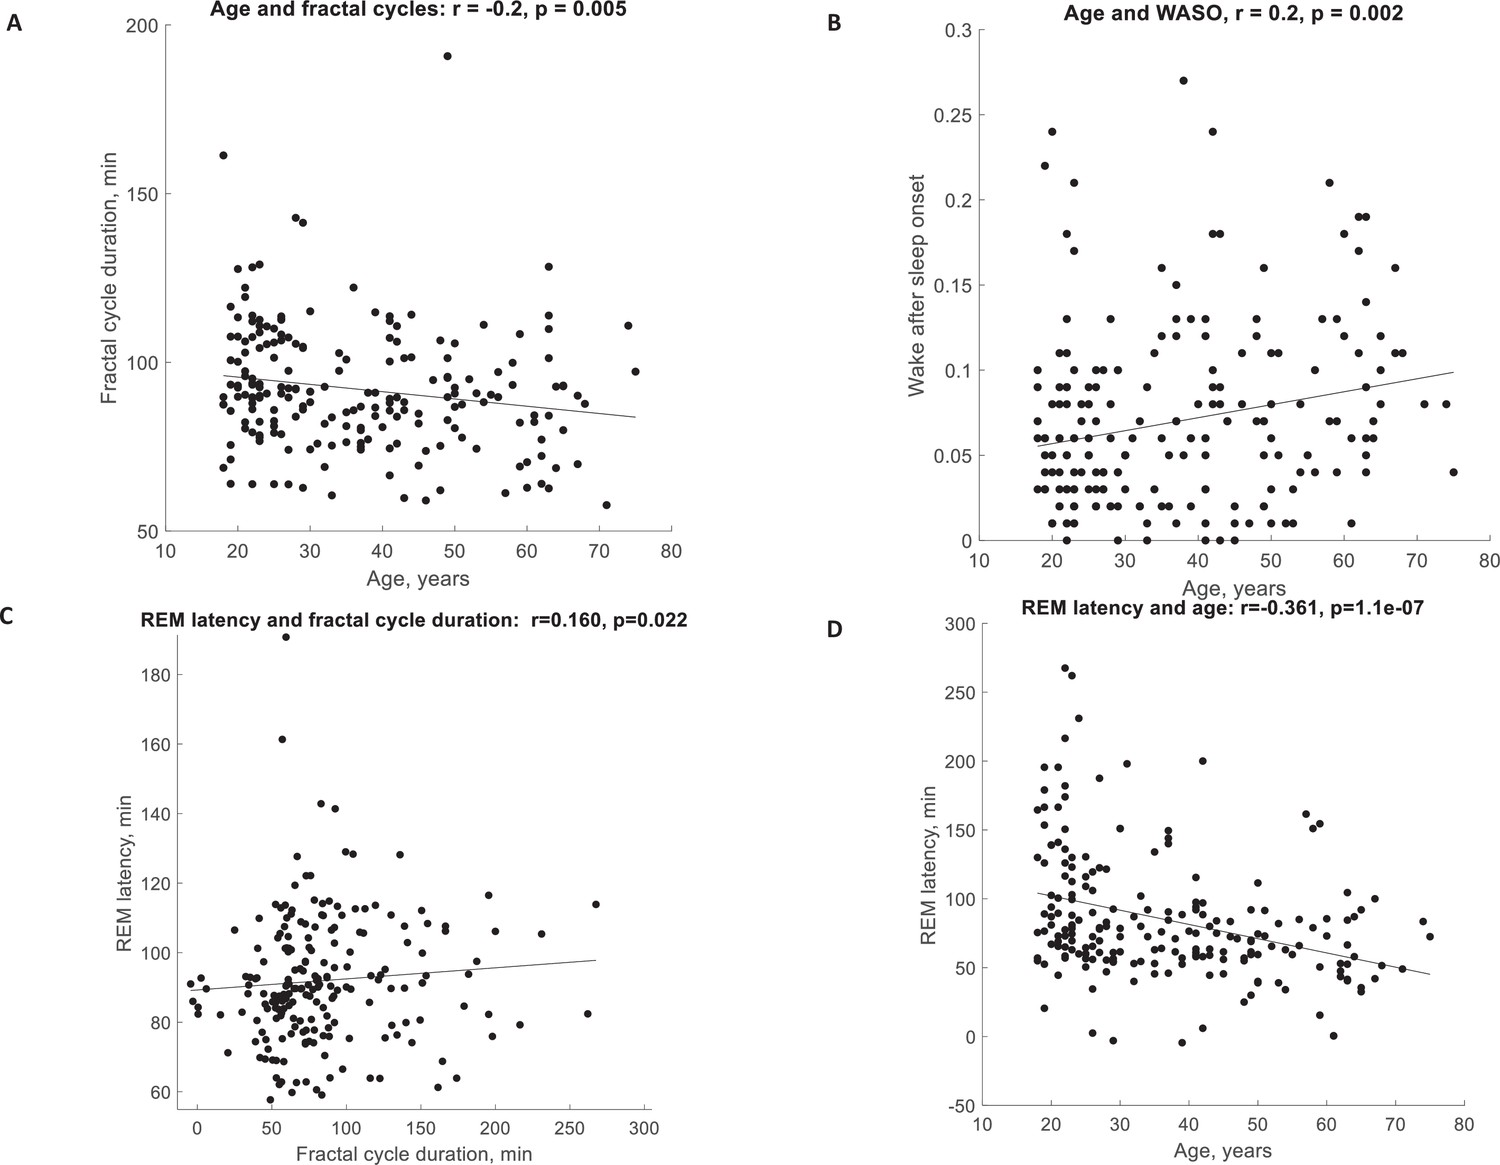
Correlations.
(A) Fractal cycle duration negatively correlates with the age of healthy participants. (B) The WASO proportion positively correlates with the age of healthy participants. The partial correlations between the fractal cycle duration and age adjusted for WASO and REM latency remained significant. (C) Fractal cycle duration positively correlates with REM latency of the healthy participants. (D) REM latency negatively correlates with the participant’s age. The partial correlation between the fractal cycle duration and REM latency adjusted for the participant’s age is non-significant. Age range: 18–75 years, median: 33.5 years, n=205 (pooled Datasets 1–5), raw (non-ranked) values are presented, r – Spearman’s correlation coefficient where values <0.3 are considered as weak correlations, REM – rapid eye movement, WASO – wakefulness after sleep onset.
Figure 2
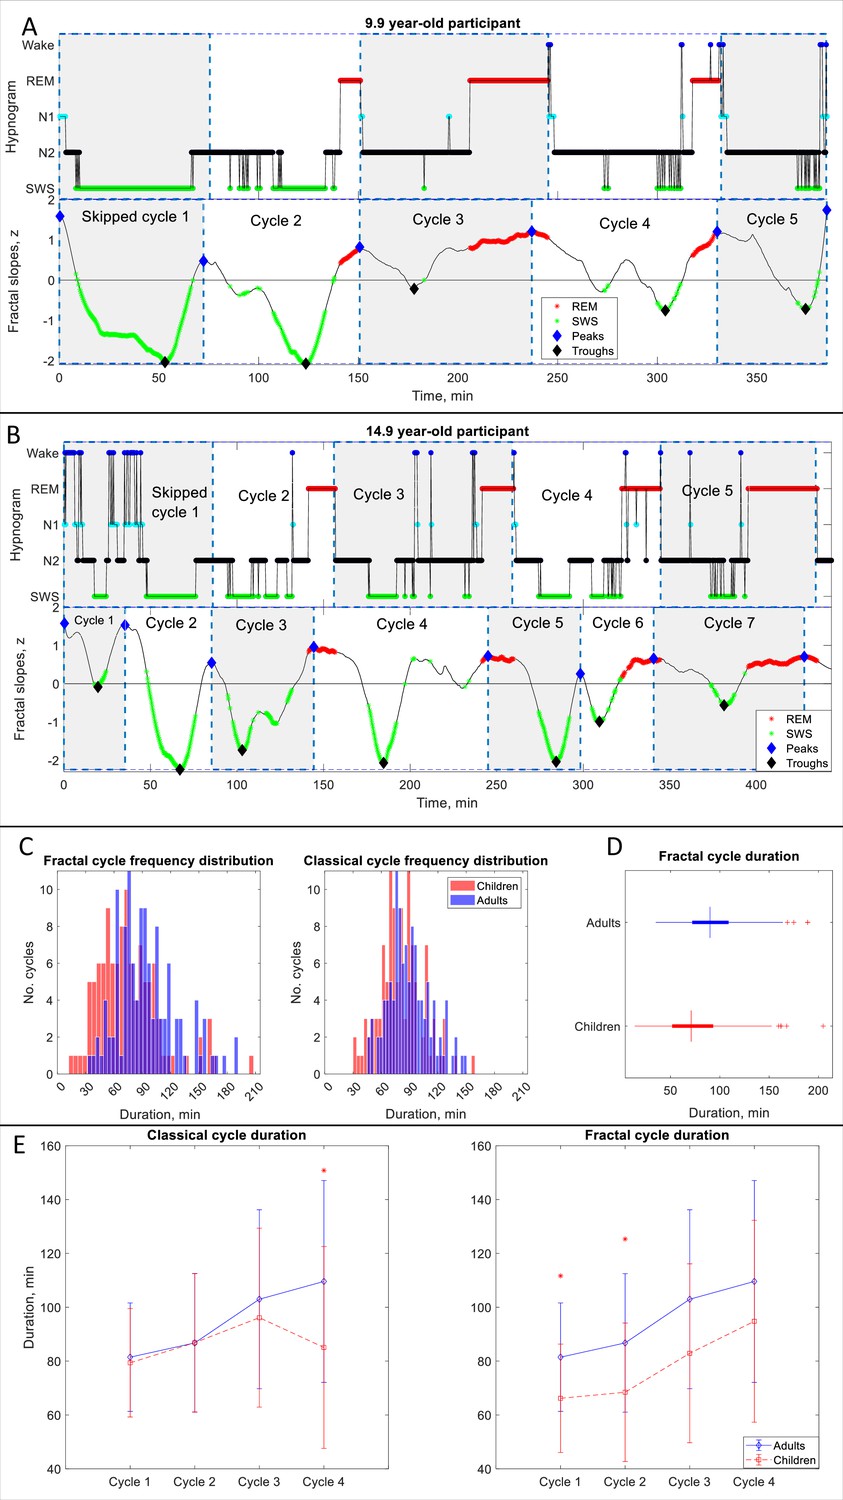
Fractal cycles in children and adolescents.
(A, B) Individual cycles: time series of smoothed z-normalized fractal slopes (bottom) and corresponding hypnograms (top). The duration of the fractal cycle is a time interval between two successive peaks (blue diamonds) defined with the Matlab function findpeaks with a minimum peak distance of 20 min and minimum peak prominence of 0.9 z. SWS – slow-wave sleep, REM – rapid eye movement sleep. (A) In this 9.9-year-old participant (from Dataset 6), we split the first 150-min-long classical cycle into two cycles according to the definitions of a ‘skipped’ cycle presented in Materials and methods. The fractal cycle algorithm successfully detected this skipped cycle. (B) This 14.9-year-old participant has a 156-min-long first classical cycle. Visual inspection shows that it should be divided into 3 skipped cycles, however, our a priori definition of skipped cycles did not include an option to subdivide a long cycle into three short cycles; hence, we split it into two short cycles. The fractal cycle algorithm was sensitive to these sleep lightenings and detected all three short cycles. Classical cycle 4 looks like a skipped cycle as it has two clear episodes of slow-wave sleep separated by non-REM stage 2. However, the length of this cycle is shorter than 110 min (the threshold defined a priori), therefore, we did not split the classical cycle 4 into two cycles. The fractal cycle algorithm was sensitive to this lightening of sleep and defined two fractal cycles during this period. (C) Histograms: The frequency distribution of fractal (left) and classical (right) cycle durations in children and adolescents (mean age: 12.4±3.1 years) compared to young adults (mean age: 24.8±0.9 years). Kolmogorov-Smirnov’s test rejected the assumption that cycle duration comes from a standard normal distribution. (D) Box plots: in each box, a vertical central line represents the median, the left and right edges of the box indicate the 25th and 75th percentiles, respectively, the whiskers extend to the most extreme data points not considered outliers, and a plus sign represents outliers. Children and adolescents show shorter fractal cycle duration compared to young adults. (E) Overnight dynamics: cycle-to-cycle dynamics show that the first and the second fractal cycles are shorter in the pediatric compared to control group, * marks a statistically significant difference between the groups.
Figure 3 with 2 supplements
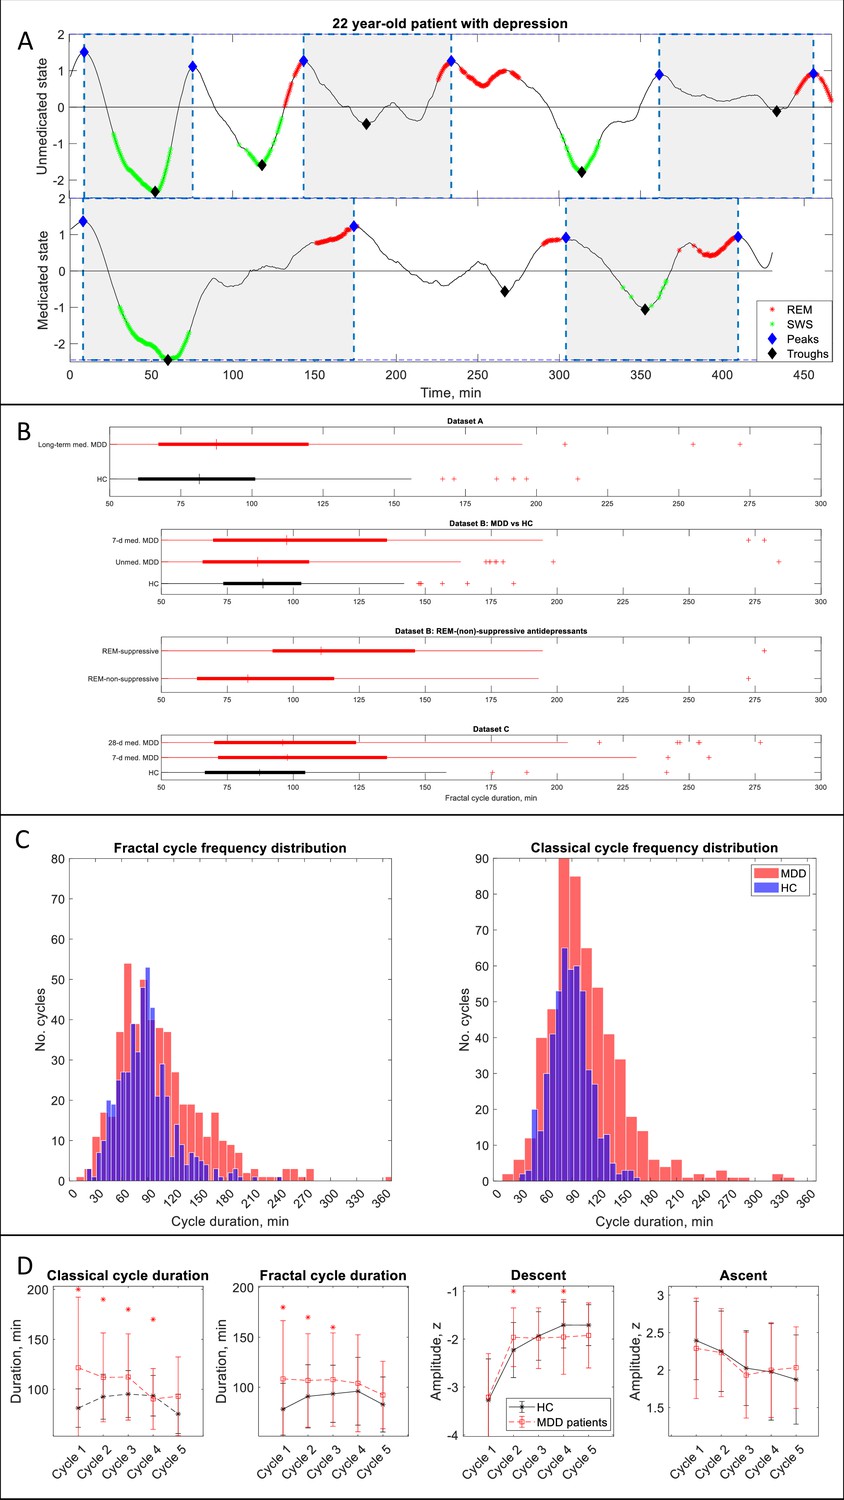
Fractal cycles in MDD.
(A) Individual fractal cycles: time series of smoothed z-normalized fractal slopes observed in a 22 y.o. MDD patient (Dataset B) in their unmedicated (top) and 7-day medicated (bottom) states. Peaks (blue diamonds) are defined with the Matlab function findpeaks with the minimum peak distance of 20 min and minimum peak prominence of 0.9 z. Fractal cycles duration (defined as an interval of time between two successive peaks) is longer in the medicated compared to unmedicated states, reflecting shallower fluctuations of fractal (aperiodic) activity. Two additional patients are shown in Figure 3—figure supplement 1. (B) Box plots: the fractal cycle duration is longer in medicated MDD patients (red) compared to age and gender-matched healthy controls (black) in all datasets. In Dataset B, fractal cycles are longer in the medicated vs patients’ own unmedicated state and in patients who took REM-suppressive vs REM-non-suppressive antidepressants. A vertical central line represents the median in each box, the left and right edges of the box indicate the 25th and 75th percentiles, respectively, the whiskers extend to the most extreme data points not considered outliers, and a plus sign represents outliers (individual cycles). (C) Frequency distribution: individual fractal and classical cycles pooled from three MDD datasets (A – C) are counted separately for medicated MDD patients and HC. (D) Overnight dynamics: cycle-to-cycle dynamics of the duration of both fractal and classical cycles show a gradual decrease in medicated patients vs an inverted U shape in controls. The between-group difference in cycle duration is the largest for the first cycle. Patients show flatter fractal descents of the second cycle and steeper fractal descents of the fourth cycle compared to controls. Contrary to controls, patients do not show a gradual decrease in absolute amplitudes of the fractal descents from the second to the fourth cycles. Patients and controls show comparable cycle-to-cycle dynamics of fractal ascents, * marks a statistically significant difference between the groups. MDD – major depressive disorder, HC – healthy controls, unmed. – unmedicated, med. – medicated, SWS – slow-wave sleep, REM – rapid eye movement.
Figure 3—figure supplement 1
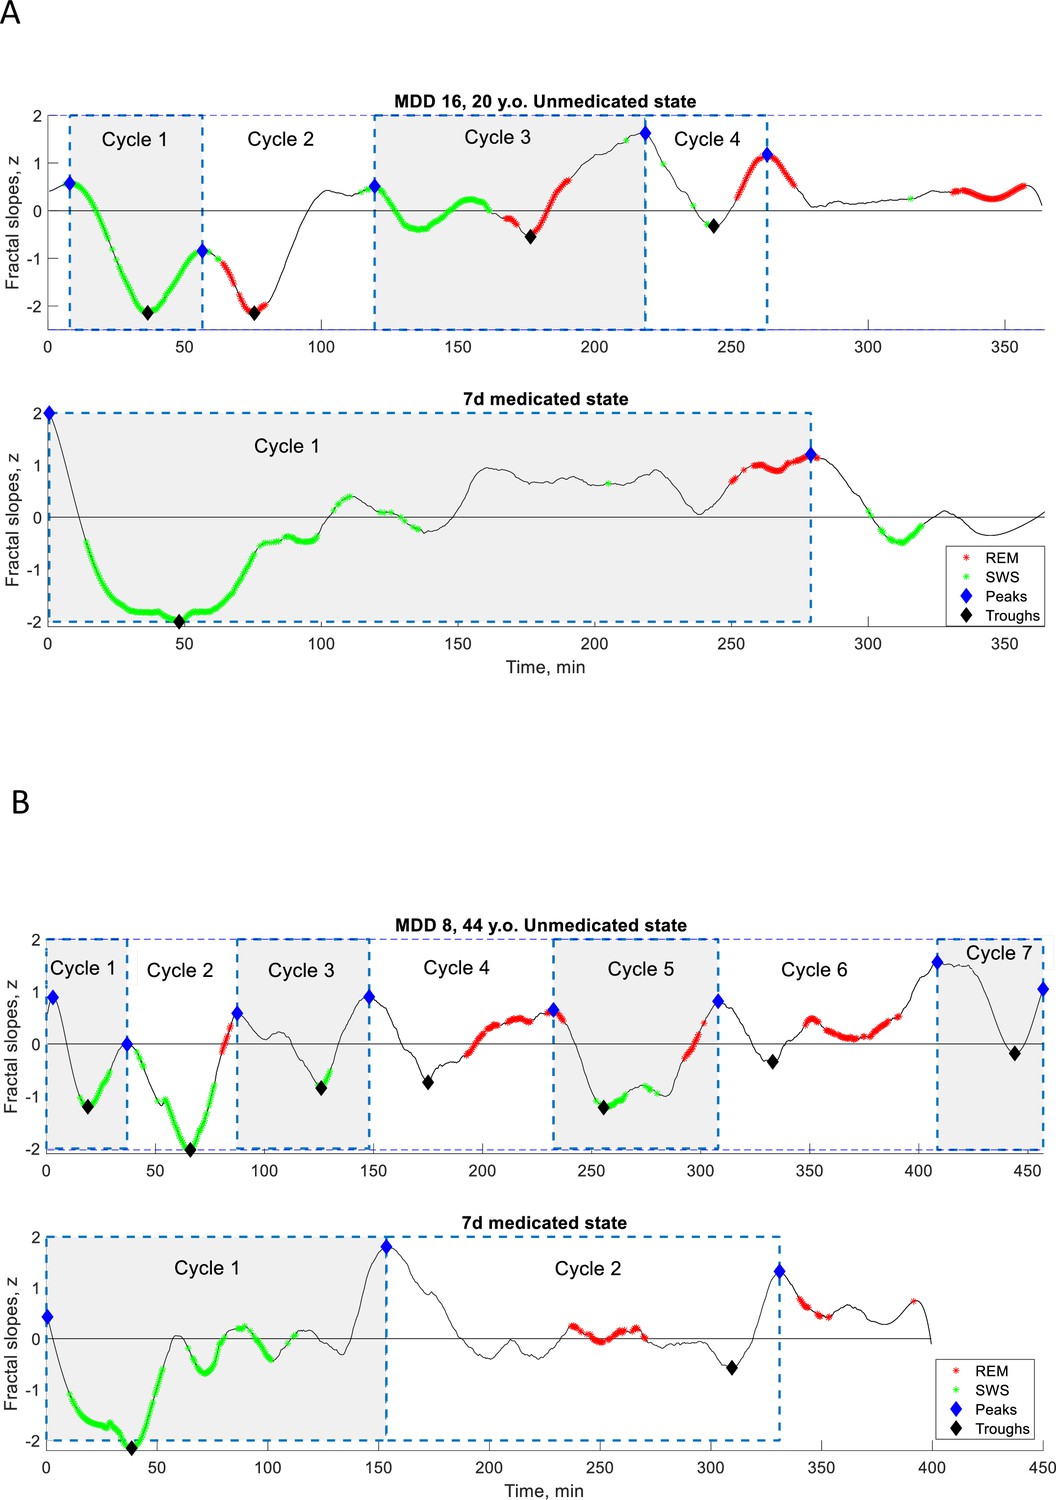
Individual fractal cycles in MDD patients.
Time series of smoothed z-normalized fractal slopes observed in two additional MDD patients (Dataset B) in their unmedicated (top) and 7-day medicated (bottom) states. Fractal cycles duration (defined as an interval of time between two successive peaks, blue diamonds) is longer in the medicated compared to unmedicated states, reflecting shallower fluctuations of fractal (aperiodic) activity. MDD – major depressive disorder, SWS – slow-wave sleep, REM – rapid eye movement sleep.
Figure 3—figure supplement 2
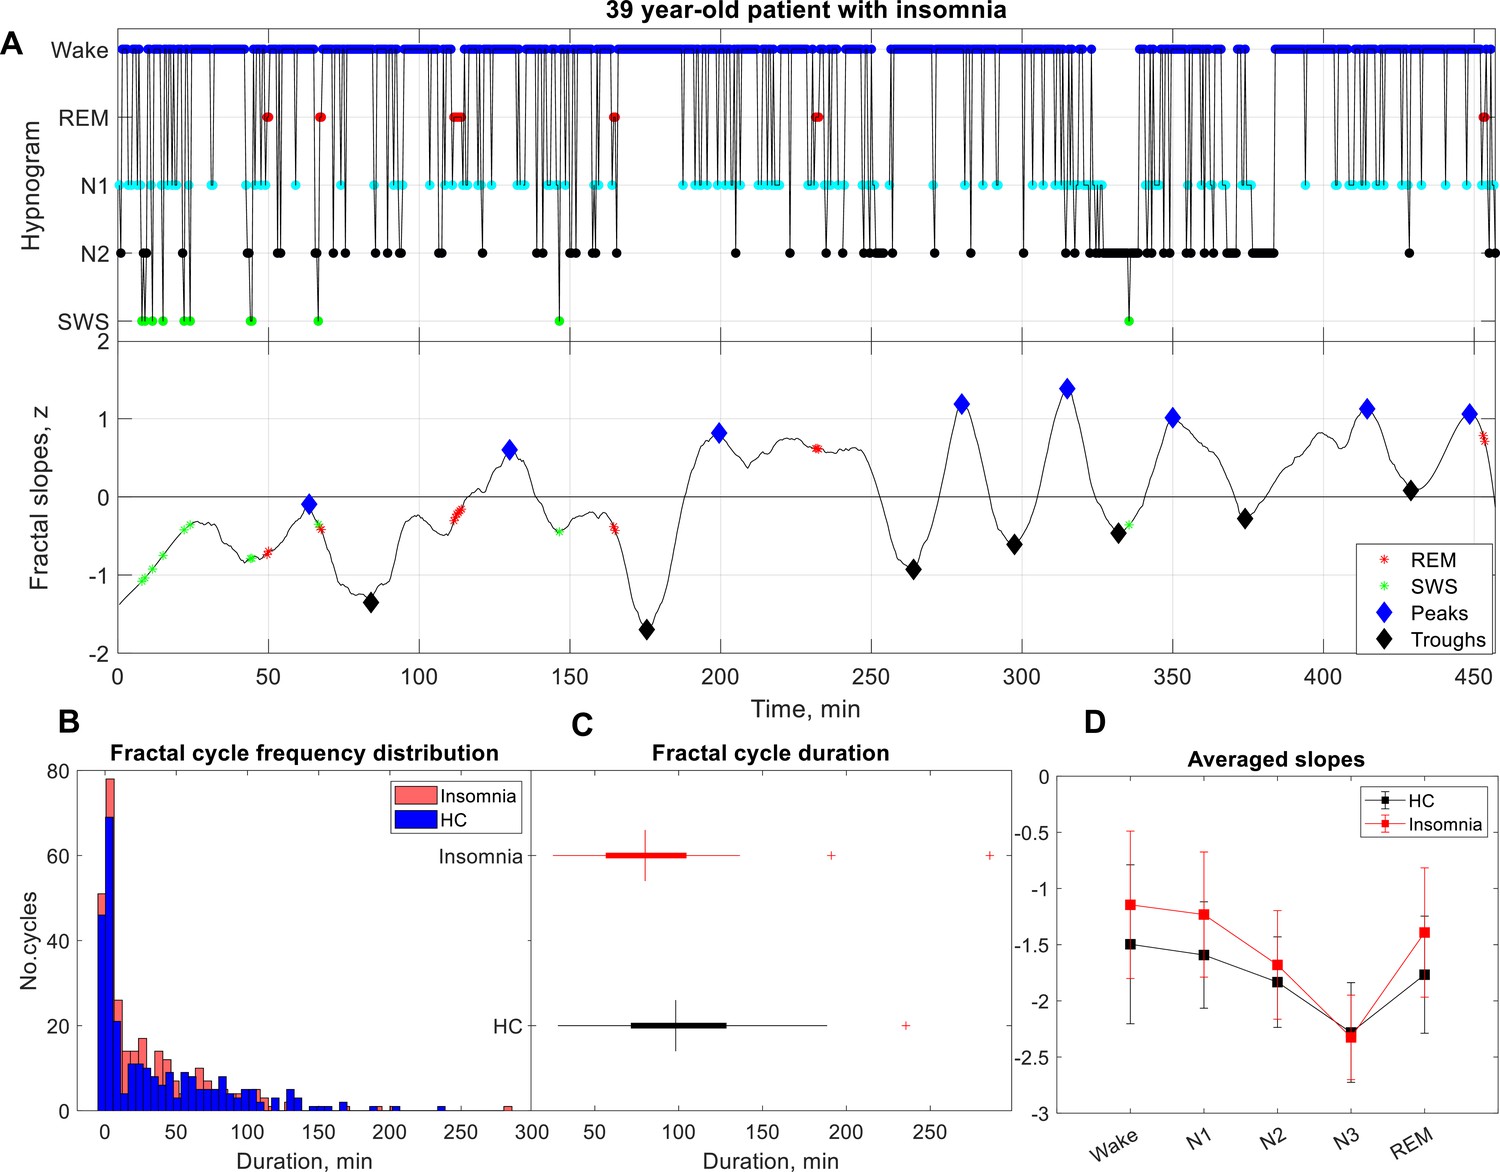
Fractal cycles in patients with insomnia.
(A) Individual example: time series of smoothed z-normalized fractal slopes (bottom) and corresponding hypnograms (top). The duration of the fractal cycle is a time interval between two successive peaks (blue diamonds) defined with Matlab’s function findpeaks with a minimum peak distance of 20 min and minimum peak prominence of 0.9 z. SWS – slow-wave sleep, REM – rapid eye movement sleep. (B) Histograms: The frequency distribution of fractal cycle durations in patients with insomnia compared to controls. Kolmogorov-Smirnov’s test rejected the assumption that cycle duration comes from a standard normal distribution. (C) Box plots: in each box, a vertical central line represents the median, the left and right edges of the box indicate the 25th and 75th percentiles, respectively, the whiskers extend to the most extreme data points not considered outliers, and a plus sign represents outliers. Patients with insomnia show shorter fractal cycle duration compared to controls. (D) Averaged slopes: The slopes of the frontal fractal spectral power components in the 1–18 Hz range are averaged over each sleep stage as defined by the hypnogram. N3 is characterized by the steepest (most negative slopes) spectral decay compared to all other sleep stages in line with the existing literature. Patients present with flatter slopes compared to controls in all sleep stages confirming previous findings (Andrillon et al., 2020).
Figure 4 with 9 supplements
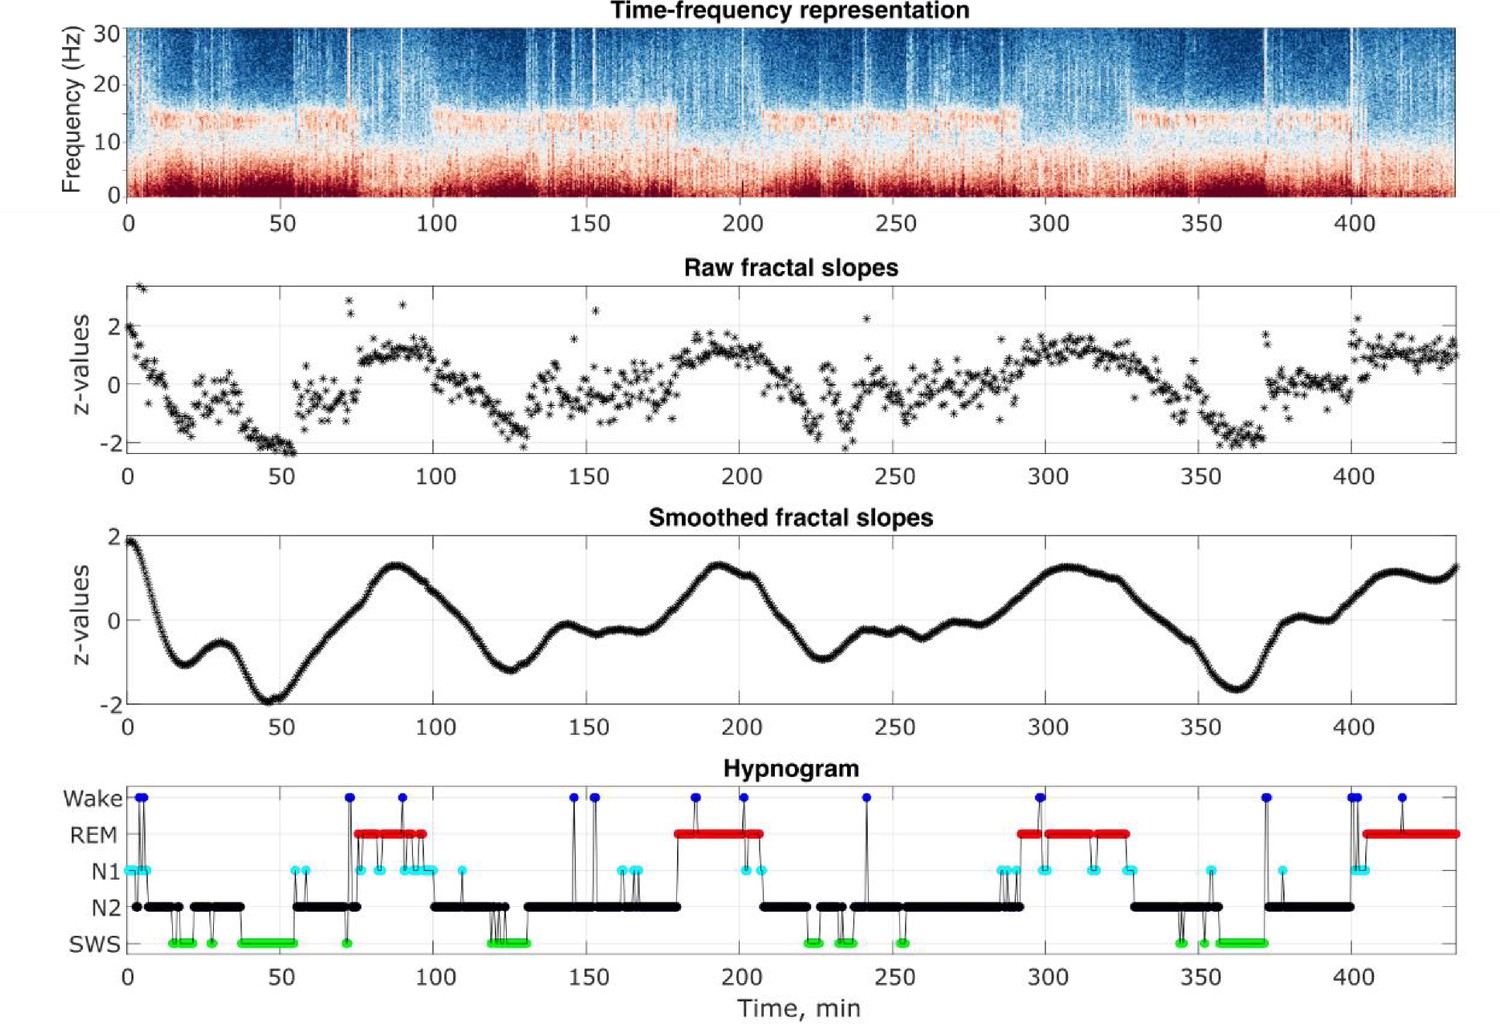
Analysis output examples.
Outputs of some of the analysis steps in an example healthy 26-year-old individual. From top to bottom: time-frequency representation of the total spectral power, raw and smoothed time series of the fractal slopes and hypnogram. Frontal spectral power and its slopes were calculated in the 0.3–30 Hz range for each 30 s of sleep.
Figure 4—figure supplement 1
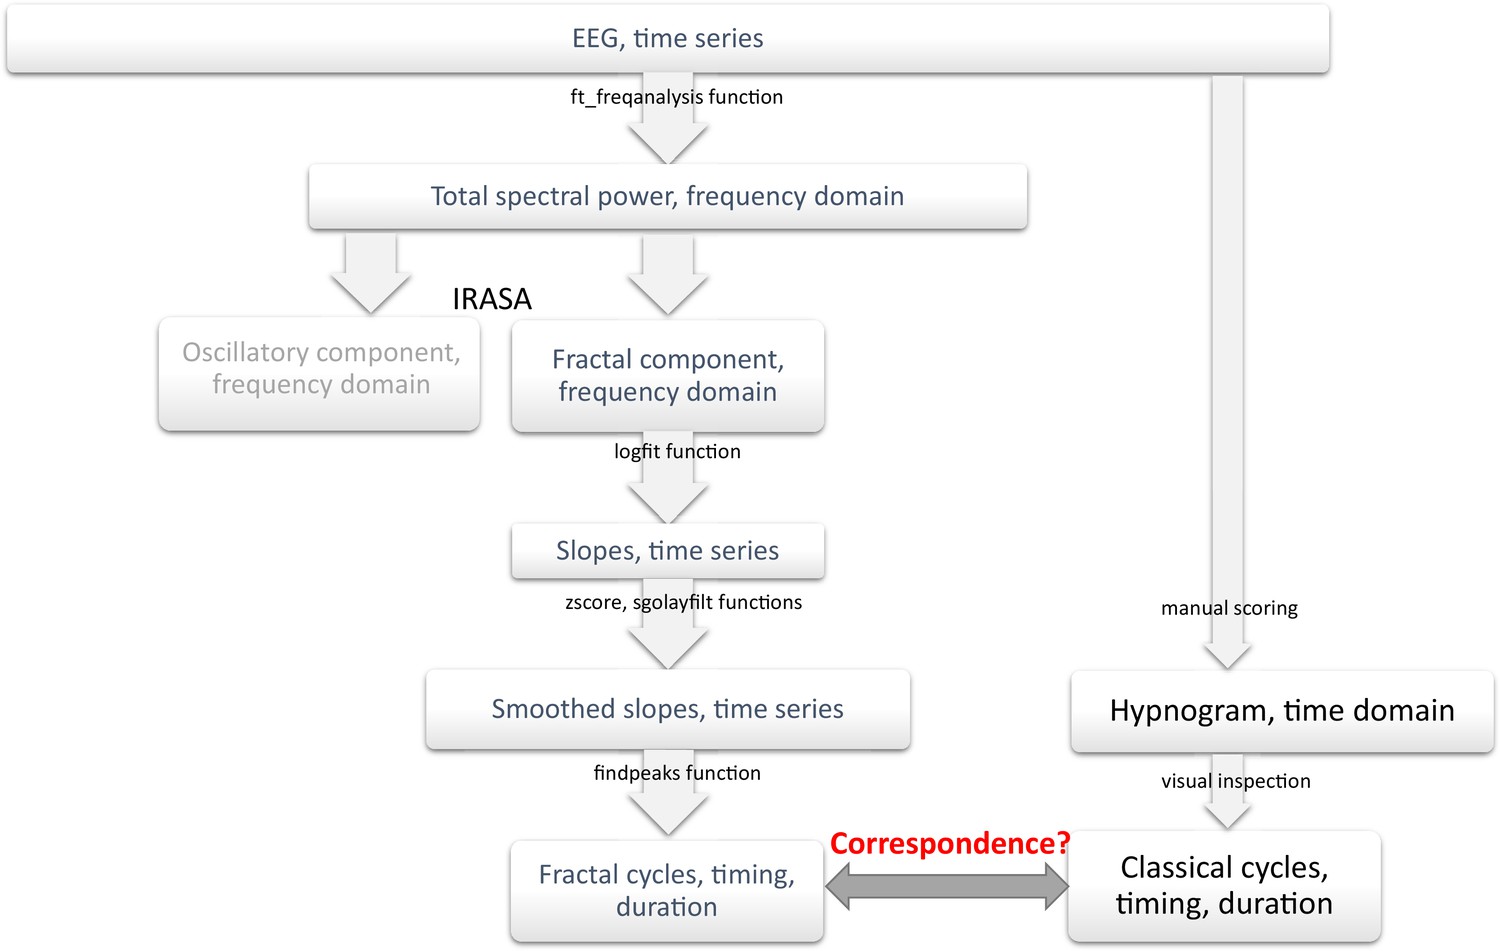
Analysis flowchart.
IRASA – Irregularly Resampled Auto-Spectral Analysis, sgolayfilt – Savitzky-Golay filter.
Figure 4—figure supplement 2
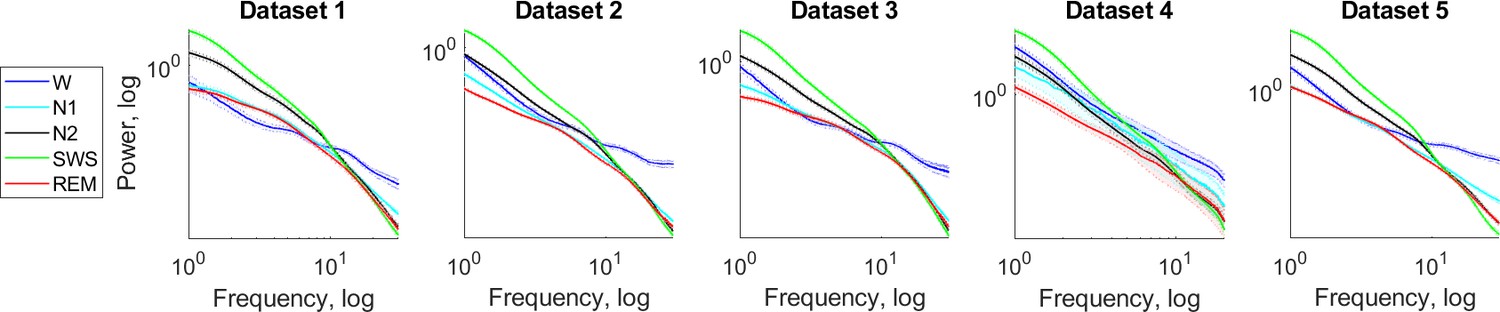
Fractal power component.
Fractal (aperiodic) power components averaged over each sleep stage separately over all participants of a given dataset are plotted as a function of frequency in the log-log space. Shading indicates standard errors. Slow-wave (green) and REM (red) sleep stages show the steepest and the flattest spectral decay, respectively in all datasets. For comparison, wake after sleep onset (blue) with the flattest decay in the higher frequency band is also shown.
Figure 4—figure supplement 3
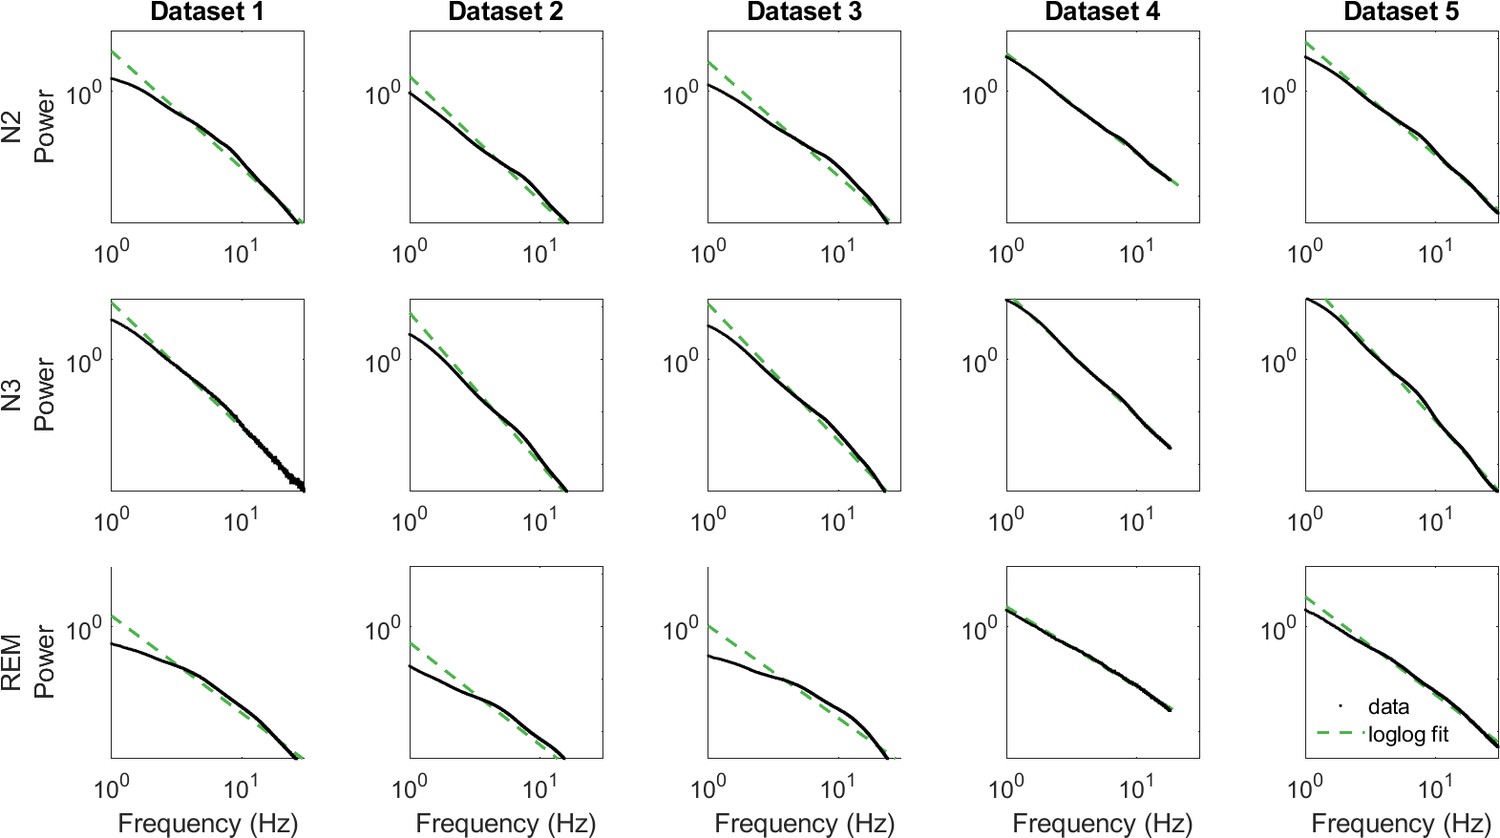
Log-log fit of data.
N – non-REM sleep, N3 – slow-wave sleep, REM – rapid eye movement sleep. Of note, in this study, we did not average spectral power/its slope over sleep stages; these graphs are shown to put our study in a broader context of the studies that looked at spectral power averaged over sleep stages for visualization only.
Figure 4—figure supplement 4
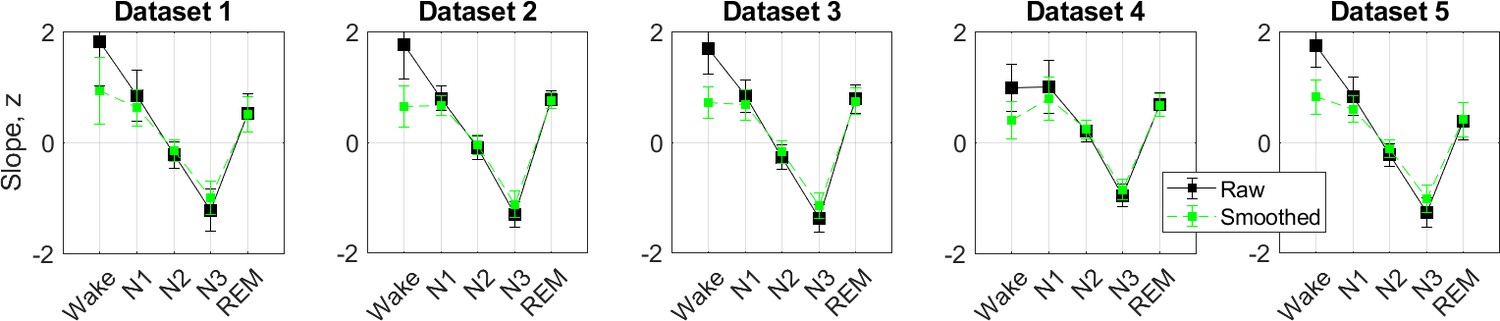
0.3–30 Hz z-normalized slopes.
The slopes of the frontal fractal spectral power components in the 0.3–30 Hz range are averaged over each sleep stage as defined by the hypnogram and z-normalized (black squares). For the analysis of the fractal cycles reported in the main text, fractal slopes were smoothened using the Savitzky-Golay filter (green squares). N3 is characterized by the steepest (most negative slopes) spectral decay compared to all other sleep stages in line with the existing literature.
Figure 4—figure supplement 5
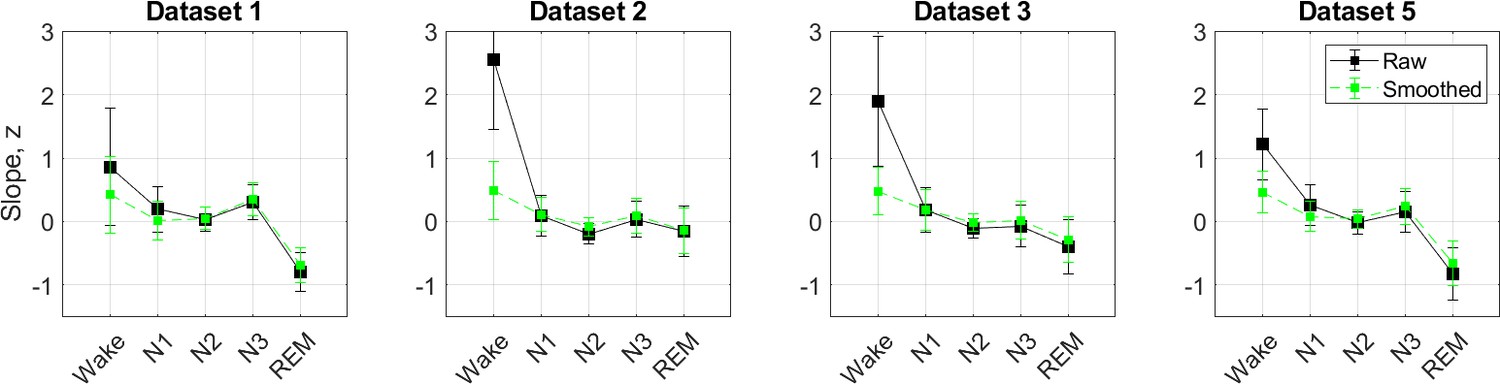
30–48 Hz z-normalized slopes.
The slopes of the aperiodic (fractal) spectral power component in the 30–48 Hz range are averaged over each sleep stage as defined by the hypnogram and z-normalized (black squares). Green squares show fractal slopes smoothened with the Savitzky-Golay filter. According to literature, REM sleep is expected to show the steepest (most negative) high-band slopes compared to all other sleep stages. However, we were able to replicate this finding in Datasets 1 and 5 only. Given poor differentiation between the stages in 2/4 datasets, this variable was not used in any analyses. Note: During recording, Dataset 4 was filtered in the 0.2–35 Hz range and therefore, it was excluded from this subanalysis.
Figure 4—figure supplement 6
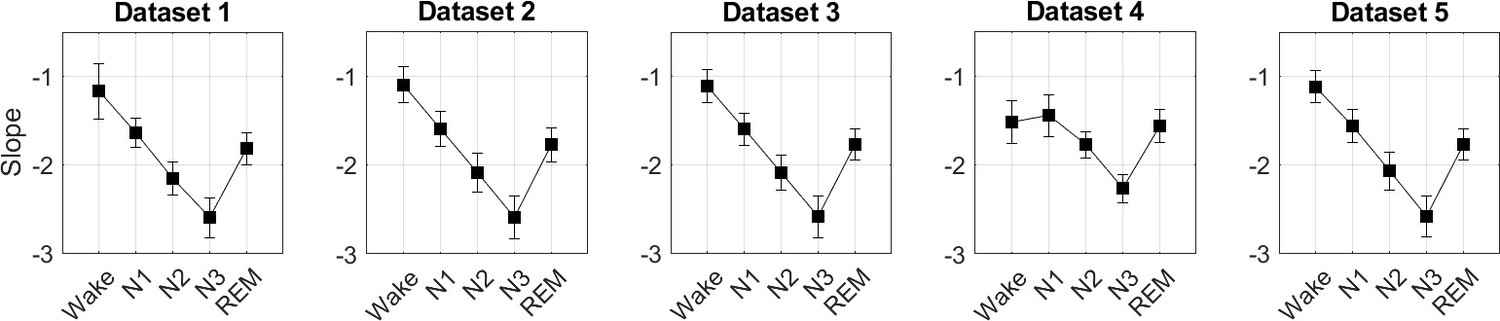
0.3–30 Hz raw slopes.
Given that raw slope values contain valuable information per se (Bódizs et al., 2024), we also report raw slope values (before z-scoring). Note: Dataset 4 was filtered in the 0.3–18 Hz range due to low-pass filtering during the recording.
Figure 4—figure supplement 7
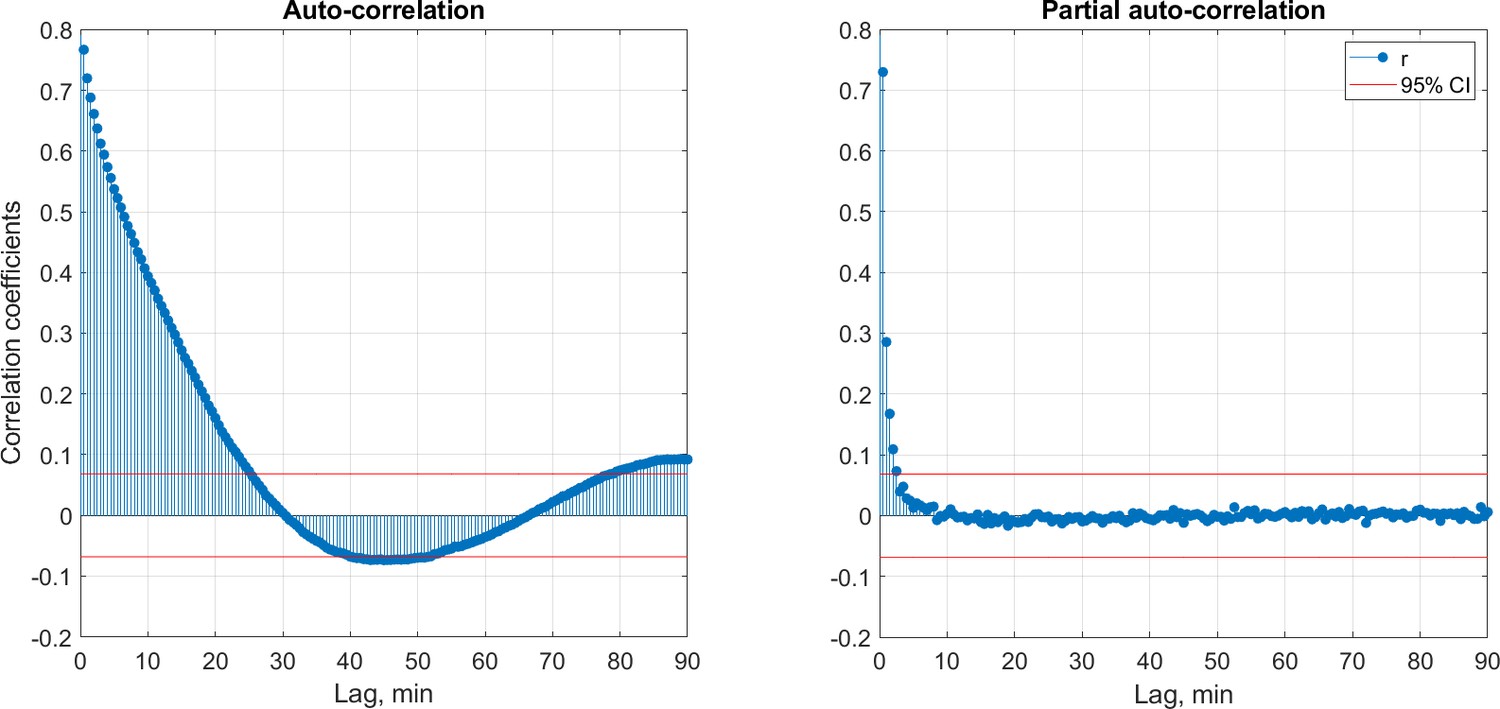
Autocorrelation (left) and partial autocorrelation (right) of the time series of the fractal slopes averaged over each 30 s of sleep show the correlation of this time series with a delayed version of itself as a function of time lag.
Red horizontal lines indicate approximate 95% probability limits for a purely random process. Correlation coefficients were calculated separately for each participant and then averaged over the pooled dataset (n=205).
Figure 4—figure supplement 8
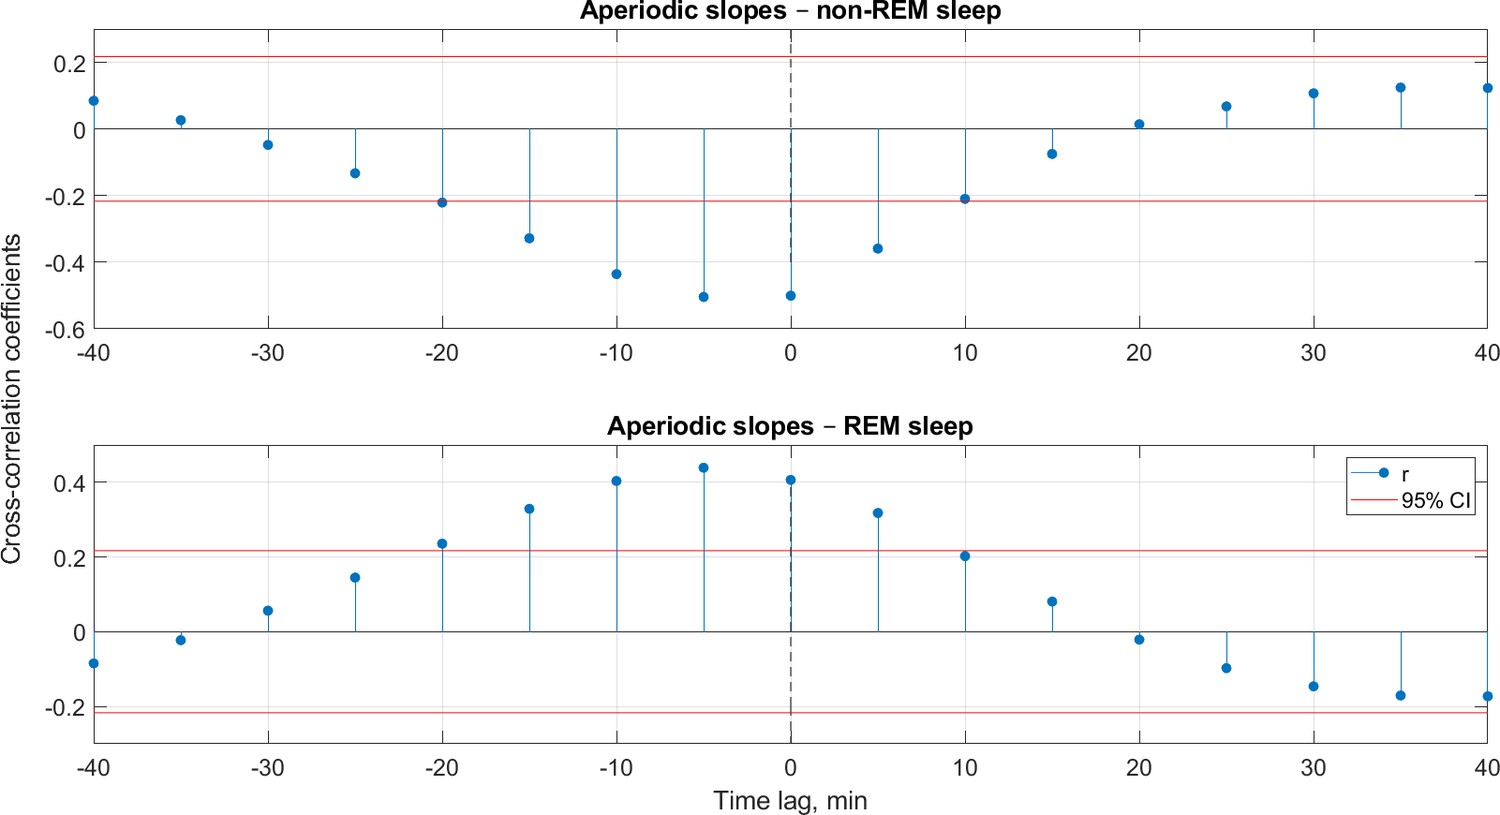
Cross-correlations.
Cross-correlations between the time series of fractal slopes on the one side and the proportion of non-REM (top) or REM sleep (bottom) per 5 min on the other side. Cross-correlations were calculated for each participant individually, then correlation coefficients were averaged over all healthy adults (n=205). Negative and positive lags mean that fractal slope time series are leading and lagging, respectively. Here, the shape of the cross-correlation function does not allow one to decide which time series is leading and which one is lagging here. The horizontal red lines mark the CI of 95%, the absolute values above these lines indicate statistical significance (r > |0.22|). REM – rapid eye movement sleep, CI – confidence interval.
Figure 4—figure supplement 9
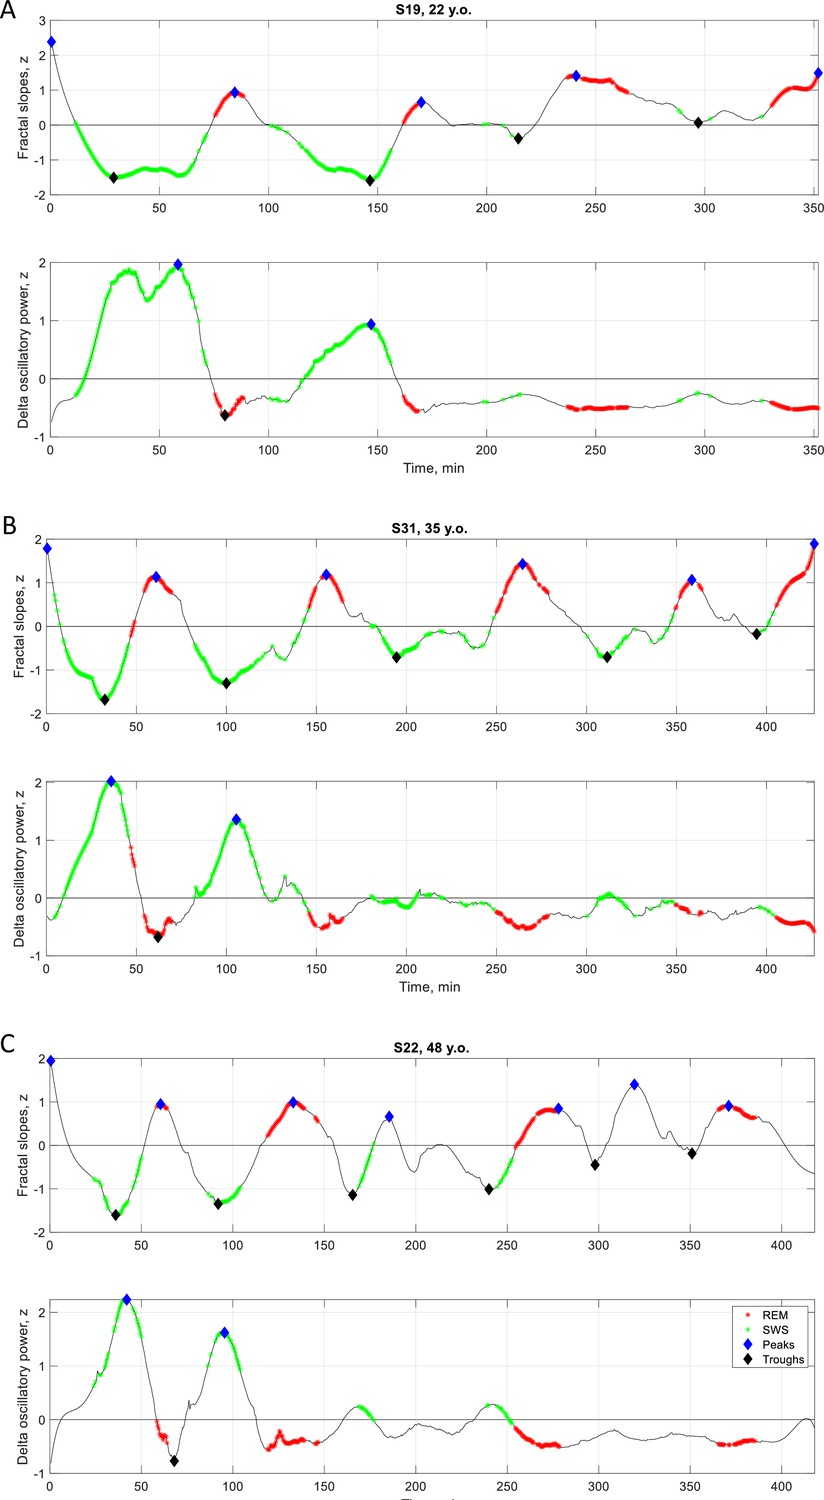
Individual fractal vs. SWA time series.
Time series of smoothed z-normalized fractal slopes (top) and SWA/delta (1–4 Hz) oscillatory power (bottom) observed in three healthy adults (from Dataset 3). SWS – slow-wave sleep, SWA – slow-wave activity, REM – rapid eye movement sleep.
Tables
Table 1
Demographic, sleep and fractal characteristics of healthy adults.
| Characteristic | Dataset 1 | Dataset 2 | Dataset 3 | Dataset 4 | Dataset 5 | Pooled dataset |
|---|---|---|---|---|---|---|
| No. participants analyzed | 38 | 39 | 32 | 34 | 62 | 205 |
| Age, years | 46.8±10.7 | 31.0±9.9 | 45.3±15.9 | 21.5±3.8 | 37.4±15.3 | 36.7±15.0 |
| Age range, years | 29–65 | 19–54 | 22–75 | 18–35 | 20–66 | 18–75 |
| Sex, female, % | 53 | 54 | 61 | 68 | 55 | 58 |
| Wake, % | 6.0 | 4.9 | 7.5 | 7.1 | 9.1 | 7.0 |
| Non-REM stage 1, % | 7.7 | 11.9 | 9.0 | 3.6 | 7.5 | 7.9 |
| Non-REM stage 2, % | 48.1 | 45.9 | 49.3 | 34.7 | 46.1 | 45.1 |
| Slow-wave sleep, % | 19.2 | 20.3 | 16.2 | 34.2 | 17.2 | 20.9 |
| REM sleep, % | 19.0 | 16.9 | 17.9 | 19.3 | 19.3 | 18.6 |
| Total sleep time, min | 394±55 | 430±26 | 434±37 | 445±62 | 467±38 | 438±51 |
| Classical sleep cycle duration, min | 86.2±23.3 | 90.0±21.3 | 89.0±22.7 | 92.2±23.7 | 91.9±29.0 | 90.1±24.9 |
| Fractal sleep cycle duration, min | 86.4±35.2 | 90.0±25.5 | 86.4±31.2 | 94.7±37.1 | 89.9±37.1 | 89.1±34.0 |
| Classical-fractal cycles duration correlation, r | 0.407 | 0.485 | 0.498 | 0.548 | 0.481 | 0.488 |
| Classical-fractal cycles duration correlation, p | 0.011 | 0.002 | 0.004 | 0.001 | 10–5 | 10–13 |
| One-to-one match between classical and fractal cycles timing and duration, % cycles | 78 | 88 | 82 | 87 | 77 | 81 |
| Participants having all fractal and classical cycles in a one-to-one match, % participants | 53 | 62 | 66 | 53 | 45 | 54 |
| Descent amplitude, z | –2.2±0.9 | –2.3±0.9 | –2.2±0.8 | –2.2±0.8 | –2.1±0.8 | –2.2±0.8 |
| Ascent amplitude, z | 2.1±0.6 | 2.2±0.6 | 2.1±0.6 | 2.1±0.6 | 2.0±0.6 | 2.2±0.6 |
| No. fractal cycles | 167 | 171 | 152 | 152 | 298 | 940 |
| No. classical cycles | 171 | 180 | 146 | 161 | 303 | 961 |
| No. ‘skipped’ first cycles (%) | 5 (13%) | 7 (18%) | 1 (3%) | 19 (56%) | 15 (24%) | 47 (23%) |
-
±shows mean and SD, r – Spearman’s correlation coefficient, ‘skipped’ cycle – a cycle where REM sleep does not appear, REM – rapid eye movement.
Table 2
Sources of fractal and classical cycle mismatches.
| Characteristic | Dataset 1 (A) | Dataset 2 (B) | Dataset 3(C) | Dataset 4 | Dataset 5 | Pooled dataset |
|---|---|---|---|---|---|---|
| Classical – fractal cycle duration difference, min | 13.2±15.9 | 9.6±9.1 | 8.0±11.3 | 13.0±17.0 | 11.9±10.2 | 11.3±12.7 |
| WASO, % | 6.0±5.6 | 4.9±3.6 | 7.5±5.0 | 7.1±4.2 | 9.1±5.7 | 7.0±5.2 |
| WASO %, r | –0.011 | 0.488 | 0.377 | 0.141 | 0.361 | 0.226 |
| WASO %, p | 0.950 | 0.002 | 0.034 | 0.425 | 0.004 | 0.001 |
| Descent amplitude, z | –2.3±0.9 | –2.5±0.9 | –2.3±0.8 | –2.0±0.7 | –2.1±0.8 | –2.2±0.8 |
| Fractal descent, r | 0.189 | 0.327 | 0.143 | 0.144 | 0.149 | 0.152 |
| Fractal descent, p | 0.171 | 0.002 | 0.182 | 0.271 | 0.135 | 0.002 |
| Ascent amplitude, z | 2.3±0.6 | 2.1±0.5 | 2.2±0.6 | 2.0±0.6 | 2.0±0.6 | 2.1±0.6 |
| Fractal ascent, r | 0.109 | –0.105 | –0.103 | 0.028 | –0.010 | –0.062 |
| Fractal ascent, p | 0.432 | 0.318 | 0.339 | 0.835 | 0.918 | 0.217 |
| Skipped cycle lengths/TST, proportion | 0.144 | 0.223 | 0.139 | 0.249 | 0.201 | 0.206 |
| Skipped cycle lengths/TST, r | 0.098 | –0.363 | 0.384 | –0.216 | 0.374 | –0.019 |
| Skipped cycles length/TST, p | 0.788 | 0.303 | 0.523 | 0.334 | 0.066 | 0.873 |
| REM episode length, min | 23.5±15.2 (72 cycles) | 22.8±13.2 (93 cycles) | 21.8±11.6 (90 cycles) | 26.0±13.9 (60 cycles) | 24.3±15.0 (102 cycles) | 0.251±0.08 (417 cycles) |
| REM episode length, r | 0.222 | 0.411 | 0.400 | 0.231 | 0.394 | 0.358 |
| REM episode length, p | 0.061 | <0.001 | 0.001 | 0.076 | <0.001 | <0.001 |
-
All parameters listed in the first column were correlated with the absolute value of the difference in classical vs fractal sleep cycle durations. For WASO and skipped cycles, all cycles of a given participant were averaged and the correlations were performed at the subject level. For the rest of the parameters, fractal and classical cycles were matched one-to-one when possible (~50% of all participants) and correlations were performed at the cycle level, r’s higher than 0.7 are considered as strong correlation scores, values lower than 0.3 are considered as weak, r’s values in the range of 0.3–0.7 are considered as moderate scores.
-
REM – rapid eye movement sleep, WASO – wake after sleep onset, TST – total sleep time, r – Spearman correlation coefficients.
Table 3
Fractal cycles in MDD.
| Dataset | Group | No. participants | Age | Classical cycles | Fractal cycles | Fractal-classical cycles correlation | |||||||
|---|---|---|---|---|---|---|---|---|---|---|---|---|---|
| No. cycles | Duration, min | p | d | No. cycles | Duration, min | p | d | r | p | ||||
| A | HC (Dataset 1) | 38 | 46.8±10.7 | 171 | 86±23 | --- | --- | 167 | 84±35 | --- | --- | 0.33 | 0.042 |
| long-termed med. MDD | 40 | 50.1±8.6 | 141 | 109±55 | 10−6 | 0.6 | 143 | 97±43 | 0.001 | 0.3 | 0.51 | 0.001 | |
| B | HC (Dataset 2) | 39 | 31.0±9.9 | 180 | 90±21 | --- | --- | 171 | 90±26 | --- | --- | 0.51 | 0.001 |
| unmed. MDD | 38 | 31.3±10.2 | 169 | 92±31 | n.s. | --- | 155 | 92±38 | n.s. | --- | 0.19 | n.s. | |
| 7d med. MDD | --- | --- | 149 | 102±43 | 0.003 | 0.4 | 133 | 107±51 | 10−4 | 0.5 | 0.68 | 10−6 | |
| REM-non-suppressive | 17 | 31.6±10.4 | 77 | 91±26 | --- | --- | 63 | 95±44 | --- | --- | 0.49 | 0.046 | |
| REM-suppressive | 21 | 33.6±11.3 | 72 | 103±54 | 0.002* | 0.5* | 70 | 121±55 | 0.003* | 0.5* | 0.66 | 0.001 | |
| C | HC (Dataset 3) | 32 | 45.3±15.9 | 146 | 89±23 | --- | --- | 154 | 88±32 | --- | --- | 0.57 | 0.001 |
| 7d med. MDD | 33 | 46.2±16.2 | 121 | 114±45 | 10−7 | 0.7 | 122 | 107±48 | 10−4 | 0.5 | 0.47 | 0.006 | |
| 28d med. MDD | --- | --- | 117 | 111±51 | 10−5 | 0.6 | 100 | 106±51 | 0.001 | 0.4 | 0.42 | 0.018 | |
Table 4
Hypothetical functional significance of fractal cycles.
| Theory/model | Reference | Hypothetical integration of the fractal cycle concept to the existing model |
|---|---|---|
Two antagonistic roles of sleep:
| Simor et al., 2022 |
|
Reactive and predictive homeostatic functions of sleep:
| Simor et al., 2023 |
|
| Reciprocal-interaction model of sleep cycles: - alternations between non-REM and REM sleep stages are explained by the interaction between aminergic and cholinergic neurons of the mesopontine junction. | Pace-Schott and Hobson, 2002 |
|
| Noradrenergic neurons create a non‐reducible timeframe for the NREM‐REM sleep cycle where low noradrenaline levels allow entries into REM sleep. | Osorio-Forero et al., 2023. | Ascents and peaks of fractal cycles reflect a cease of noradrenaline release. |
The Neuronal Transition Probability Model:
| Merica and Fortune, 2011 |
|
-
*
this hypothesis is also based on the report that in rats, cholinergic nucleus basalis stimulation caused flattering of spectral decay (Goard and Dan, 2009).
Table 5
Fractal and classical cycle comparison.
| Fractal cycles by our algorithm | Classical cycles by hypnograms | ||
|---|---|---|---|
| Definition/detection | |||
| Based on a real-valued metric with known neurophysiological functional significance | Based on categorical values of the cycle constituents (e.g. wake = 0, REM = –1, N1 = –2, N2 = –3 and SWS = –4) | ||
| Gradual changes | Abrupt changes | ||
| Automatic computation, objective | Usually based on the visual inspection, time-consuming, subjective, error-prone | ||
| Findings | |||
| Cycles with skipped REM sleep detected in 91–98% of cases | Inter-rater agreement of 91% on the presence of cycles with skipped REM sleep | ||
| Fractal cycle durations negatively correlated with the age of adult participants | Classical cycle durations did not correlate with the age of adult participants | ||
| Shorter fractal cycle durations in children vs adults: higher F-values, R², effect sizes than for classical cycles | Shorter classical cycle durations in children vs adults: lower F-values, R², effect sizes than for fractal cycles | ||
| Shorter first and second fractal cycles in the pediatric group | No difference in durations of the first and second classical cycles in pediatric vs adult groups | ||
| No difference in duration of the fourth fractal cycles in the pediatric group | Shorter duration of the fourth classical cycle in the pediatric group | ||
| Longer fractal cycle duration in medicated patients with depression: comparable differences with those on classical cycles | Longer classical cycle duration in medicated patients with depression: comparable differences with those on fractal cycles | ||
| Sources of mismatches between fractal and classical cycles | |||
| Source | Finding | Reason | |
| Across night variation in REM sleep episode duration: longer REM episodes towards morning | Longer REM episodes are associated with a higher mismatch between fractal vs classical cycles | The end of a fractal cycle is defined as the local maximum of time series of fractal slopes, whereas the end of a classical cycle is defined as the end of the REM episodes | |
| Across subject variation in WASO: a higher WASO proportion in older participants | A higher WASO proportion is associated with a higher mismatch between fractal vs classical cycles | REM- and wake-related smoothed fractal slopes show close values, therefore, both could be defined as local peaks. More fractal peaks imply more fractal cycles | |
-
REM – rapid eye movement, SWS – slow-wave sleep, WASO – wake after sleep onset.
Table 6
Datasets description.
| Characteristic | Dataset 1(A) | Dataset 2(B) | Dataset 3(C) | Dataset 4 | Dataset 5 | Dataset 6(pediatric) |
|---|---|---|---|---|---|---|
| Reference to original study | Rosenblum et al., 2023a | Jafarzadeh Esfahani et al., 2023 | Rosenblum et al., 2024a | Furrer et al., 2019; Volk et al., 2019; Jaramillo et al., 2020 | ||
| No. healthy participants (-excluded) | 40 (-2) | 40 (-1) | 33 (-1) | 36 (-2) | 68 (-6) | 21 (0) |
| Exclusion reasons | >25% WASO <150 min recording | <150 min recording | >25% WASO | >25% WASO No REM | >25% WASO No REM | — |
| No. MDD patients (none excluded) | 40 | 38 | 33 | 0 | 0 | 0 |
| Study environment | Sleep lab +a memory task before* | Sleep lab +memory tasks before*,† | Sleep lab | Sleep at home with EEG and headband | Sleep lab +simultaneous blood measurement ‡ | Sleep lab +MRI before and after sleep § |
| Device | Comlab 32 Digital Sleep Lab, Brainlab V 3.3 Software, Schwarzer, GmbH, Munich, Germany | JE-209A amplifier (Nihon Kohden, Tokyo, Japan), with 128ch BrainCap (EasyCap GmbH, Herrsching, Germany) | Comlab 32 Digital Sleep Lab, Brainlab V 3.3 Software, Schwarzer GmbH, Munich, Germany | Somnomedics GmbH, Randersacker, Germany | Comlab 32 Digital Sleep Lab, Brainlab V 3.3 Software, Schwarzer GmbH, Munich, Germany | Sensor Net for long-term monitoring (Electrical Geodesic Inc, EGI, Eugene, OR, USA) |
| No. channels | 4 | 128 | 32 | 24 | 16 | 128 |
| (Offline re)-referenced to | Contralateral mastoid | Average of all leads | Average of all leads | Contralateral mastoid | Contralateral mastoid | Contralateral mastoid |
| Sample rate, Hz | 250 | 200 | 250 | 256 | 250 | 500 |
| Filtering during recording, Hz | 0.3–70 | >0.016 | 0.53–70 | 0.2–35 | 0.3–70 | 0.01–200 |
| Available frontal electrodes | none | Fz, F1, F2, F3, F4, F5, F6, F7, F8, F9, F10 | Fz, F3, F4, F7, F8 | F3, F4 | F3, F4 | F3, F4 |
| Analyzed electrodes | C3, C4 | F3, F4 | F3, F4 | F3, F4 | F3, F4 | F3, F4 |
-
WASO – wake after sleep onset, REM – rapid eye movement sleep, MDD – major depressive disorder.
-
*
a procedural memory paradigm (finger tapping task) before sleep.
-
†
a declarative memory paradigm (word-pair learning task) before sleep.
-
‡
in this study, 4 ml blood were drawn every 20 min from the adjacent room, using an intravenous cannula and a tube extension.
-
§
an MRI scan was taken in the evening before and in the morning after the sleep measurement.
Appendix 1—table 1
Fractal cycle topography in healthy adults.
| Area | Dataset 1 | Dataset 2 | Dataset 3 | Dataset 4 | Dataset 5 |
|---|---|---|---|---|---|
| Classical sleep cycle duration, min | |||||
| --- | 86.2±23.3 | 90.0±21.3 | 89.0±22.7 | 92.2±23.7 | 91.9±29.0 |
| Fractal sleep cycle duration, min | |||||
| F | NA | 90.0±25.5 | 86.4±31.2 | 94.7±37.1 | 89.9±37.1 |
| C | 86.4±35.2 | 91.1±29.4 | 85.2±34.2 | 95.4±37.3 | 90.8±39.9 |
| P | NA | 95.0±32.3 | 89.8±37.2 | NA | 90.7±41.9 |
| O | NA | 89.7±28.6 | 85.0±31.3 | 100.0±47.0 | 92.2±42.5 |
| Classical-fractal cycles correlation, r coefficient | |||||
| F | NA | 0.508 | 0.565 | 0.474 | 0.513 |
| C | 0.331 | 0.364 | 0.213 | 0.478 | 0.277 |
| P | NA | 0.273 | 0.120 | NA | 0.411 |
| O | NA | 0.306 | 0.239 | 0.516 | 0.279 |
| Classical-fractal cycles correlation, p-value | |||||
| F | NA | 0.001 | 0.001 | 0.005 | <0.001 |
| C | 0.042 | 0.023 | 0.242 | 0.004 | 0.029 |
| P | NA | 0.093 | 0.512 | NA | <0.001 |
| O | NA | 0.058 | 0.189 | 0.002 | 0.028 |
-
F – frontal (averaged over F3 and F4), C – central (averaged over C3 and C4), P – parietal (averaged over P3 and P4), O – occipital (averaged over O1 and O2) electrodes.
Appendix 1—table 2
Fractal cycle characteristics: frequency bands comparison.
| Parameter | 0.3–30 Hz | 1–30 Hz |
|---|---|---|
| Fractal cycles, No./night | 4.6±1.0 | 4.6±1.1 |
| Fractal sleep cycle duration, min | 89.1±34.0 | 90.7±36.9 |
| Descent amplitude, z | –2.2±0.8 | –2.1±0.8 |
| Ascent amplitude, z | 2.2±0.6 | 2.1±0.6 |
| Classical – fractal cycles duration correlation, r | 0.488 | 0.397 |
| Classical – fractal cycles duration correlation, p | 10e-13 | 10e-9 |
-
Mean values ± SD (min) are presented for the pooled dataset (n=205). The 1–30 Hz band is added to control for a possible distortion (the so called ‘knees’' of the spectrum) of the linear fit by excluding low frequencies with strong oscillatory activity. Both bands, however, show similar results probably because of the smoothening procedure used in this study.
Appendix 1—table 3
Pediatric demographic and sleep characteristics.
| Characteristic | Children and adolescents (Dataset 6) | Controls: Young adults (from Datasets 2, 4, 5) |
|---|---|---|
| Sample size | 21 | 24 |
| Age, years | 12.4+3.1 | 24.8+0.9 |
| Age range, years | 8–17 | 23–25 |
| Wake, % | 4.94 | 6.09 |
| Non-REM stage 1, % | 3.29* | 7.27 |
| Non-REM stage 2, % | 41.89 | 42.23 |
| Slow-wave sleep, % | 31.06 | 24.92 |
| REM sleep, % | 18.82 | 18.58 |
| Total sleep time, min | 444+37 | 441+44 |
| Classical sleep cycle duration, min | 80.4+23.0* | 89.8+22.2 |
| Fractal sleep cycle duration, min | 75.5+33.7* | 94.1+32.1 |
| Ascent amplitude, z | 2.2+0.7 | 2.1+0.6 |
| No. fractal cycles | 112 | 121 |
| No. classical cycles | 112 | 114 |
Appendix 1—table 4
Cross-correlations.
| Time lag | non-REM<-Slopes | Slopes<-non-REM | REM<-Slopes | Slopes<-REM |
|---|---|---|---|---|
| Correlation coefficients, r | ||||
| 0 min | –0.50 | 0.40 | ||
| 5 min | –0.50 | –0.36 | 0.44 | 0.32 |
| 10 min | –0.44 | n.s. | 0.40 | n.s. |
| 15 min | –0.33 | n.s. | 0.33 | n.s. |
| 20 min | n.s. | n.s. | n.s. | n.s. |
| Participants showing significant effect, % | ||||
| 0 min | 85 | 80 | ||
| 5 min | 85 | 70 | 87 | 72 |
| 10 min | 84 | 54 | 86 | 53 |
| 15 min | 76 | 21 | 79 | 18 |
| 20 min | 52 | 9 | 5 | 61 |
-
REM – rapid eye movement sleep, n.s. – non-significant. Only lags associated with statistically significant correlation coefficients are reported, r’s higher than 0.7 are considered as strong correlation scores, values lower than 0.3 are considered as weak, r’s values in the range of 0.3–0.7 are considered as moderate scores. Correlation coefficients were calculated for each healthy adult individually and then averaged over all participants.
Appendix 1—table 5
Demographic and clinical characteristics of the subgroups of patients by medication class (mean ± SD).
| Medication class | n | Age | No. females | No. of previous depressive episodes | HAM-D baseline | HAM-D7 day |
|---|---|---|---|---|---|---|
| SSRI (citalopram, escitalopram, paroxetine, sertraline) | 13 | 29.9±10.0 | 8 | 0.6±0.8 | 19.7±4.2 | 13.9±4.6 |
| TCA (trimipramine, amitriptyline, amitriptylinoxide) | 8 | 36.6±11.9 | 4 | 2.1±1.1 | 22.1±3.4 | 16.6±5.5 |
| NDRI (bupropion) | 6 | 30.7±10.5 | 3 | 0.7±0.5 | 18.5±3. 5 | 17.8±3.2 |
| SNRI (venlafaxine, duloxetine) | 6 | 31.7±10.9 | 2 | 1.7±0.83 | 18.3±2.5 | 14.7±5.5 |
| NaSSA (mirtazapine) | 5 | 26.8±6.1 | 3 | 2.6±3.2 | 20.2±4.8 | 13.8±4.7 |
| REM suppressive (SSRI, SNRI, amitriptyline, amitriptylinoxide) | 21 | 31.1±10.3 | 11 | 1.1±1.0 | 19.2±3.6 | 14.1±4.5 |
| REM non-suppressive (trimipramine, bupropion, mirtazapine) | 17 | 31.6±10.4 | 7 | 1.7±2.0 | 20.7±4.1 | 16.6±4.9 |
-
HAM-D – Hamilton Depression Rating Scale, REM – rapid eye movement sleep, SD – standard deviation, NaSSA – noradrenergic and specific serotonergic antidepressants, NDRI – norepinephrine-dopamine reuptake inhibitor, SNRI – serotonin-norepinephrine reuptake inhibitors, SSRI – selective serotonin reuptake inhibitors, TCA – tricyclic antidepressants.
Appendix 1—table 6
Fractal cycle topography in MDD.
| Dataset | Group | F | C | P | O |
|---|---|---|---|---|---|
| A | Healthy controls | NA | 84±35 | NA | NA |
| long-termed med. MDD | NA | 97±43* | NA | NA | |
| B | Healthy controls | 90±26 | 91±29 | 95±32 | 90±29 |
| unmed. MDD | 92±38 | 92±39 | 95±44 | 92±35 | |
| 7-d med. MDD | 105±45*,† | 100±49* | 107±49*,† | 105±51*,† | |
| C | Healthy controls | 88±32 | 86±34 | 90±37 | 85±31 |
| 7-d med. MDD | 107±48* | 108±49* | 105±46* | 107±44* | |
| 28-d med. MDD | 106±51* | 95±41* | 104±51* | 105±51* |
-
Mean durations ± SD (min) are presented, MDD – major depressive disorder, unmed. – unmedicated, med. – medicated. F – frontal (averaged over F3 and F4), C – central (averaged over C3 and C4), P – parietal (averaged over P3 and P4), O – occipital (averaged over O1 and O2) electrodes.
-
*
statistically significant p-values of the t-test that compares a given group to age-matched controls.
-
†
statistically significant p-values of the t-test comparing medicated and unmedicated states of MDD patients (dataset B)
Appendix 1—table 7
Intra-fractal method reliability.
| Peak prominence variation | 0.86 z | 0.90 z | 0.94 z | 0.98 z | 1.20 z | |
|---|---|---|---|---|---|---|
| Correlations, r | 0.86 z | - | 0.93 | 0.86 | 0.82 | 0.55 |
| 0.90 z | - | - | 0.92 | 0.88 | 0.60 | |
| 0.94 z | - | - | - | 0.95 | 0.67 | |
| 0.98 z | - | - | - | - | 0.74 | |
| 1.20 z | - | - | - | - | - | |
| Classical cycles | 0.45 | 0.45 | 0.46 | 0.46 | 0.31 | |
| Duration, min | Fractal cycles | 88.6 | 90.5 | 92.7 | 93.8 | 106.1 |
| Classical cycles | 91.0 | |||||
| Smoothing window, 30 s epochs | 81 | 91 | 101 | 111 | 121 | |
| Correlations, r | 81 | - | 0.85 | 0.69 | 0.59 | 0.49 |
| 91 | - | - | 0.84 | 0.72 | 0.63 | |
| 101 | - | - | - | 0.87 | 0.78 | |
| 111 | - | - | - | - | 0.85 | |
| 121 | - | - | - | - | - | |
| Classical cycles | 0.32 | 0.37 | 0.45 | 0.45 | 0.39 | |
| Duration, min | Fractal cycles | 84.5 | 88.6 | 92.4 | 94.5 | 98.6 |
-
Fractal cycle durations were calculated using the minimum peak prominence from 0.86 to 1.20 z with the step of 0.04 z and smoothing window from 81 to 121 epochs with the step of 10 thirty-second epochs, r’s higher than 0.7 are considered as strong correlation scores, values lower than 0.3 are considered as weak, r’s values in the range of 0.3–0.7 are considered as moderate scores, all correlations were statistically significant, therefore p-values are not reported, r – Spearman correlation coefficients.
Appendix 1—table 8
Intra-classical method reliability.
| Characteristic | Scorer | Dataset 1 | Dataset 2 | Dataset 3 | Dataset 4 | Dataset 5 | Pooled dataset | |
|---|---|---|---|---|---|---|---|---|
| Classical sleep cycle duration, min | Mean ± SD | Scorer 1 | 87.8±12.6 | 91.5±11.7 | 90.0±13.3 | 93.3±11.0 | 93.8±15.1 | 91.6±13.2 |
| Scorer 2 | 88.2±11.6 | 89.4±9.7 | 91.6±11.9 | 90.0±11.9 | 90.4±14.6 | 89.8±12.3 | ||
| Automatic | 94.2±17.7 | 93.0±13.0 | 94.7±10.6 | 101.9±17.9 | 101.2±18.7 | 97.4±16.6 | ||
| Correlation, r | Scorer 1–2 | 0.777 | 0.913 | 0.715 | 0.687 | 0.859 | 0.810 | |
| Scorer 1–automatic | 0.669 | 0.621 | 0.530 | 0.447 | 0.584 | 0.593 | ||
| Scorer 2–automatic | 0.604 | 0.686 | 0.641 | 0.297 | 0.547 | 0.549 | ||
| No. classical cycles | Mean ± SD | Scorer 1 | 4.4±0.8 | 4.6±0.7 | 4.6±0.6 | 4.7±0.8 | 4.9±0.8 | 4.7±0.8 |
| Scorer 2 | 4.2±0.7 | 4.6±0.7 | 4.4±0.6 | 4.7±0.8 | 4.9±0.8 | 4.6±0.8 | ||
| Automatic | 4.1±0.9 | 4.3±0.9 | 4.4±0.6 | 4.2±1.1 | 4.2±1.0 | 4.2±0.9 | ||
| Correlation, r | Scorer 1–2 | 0.828 | 0.928 | 0.755 | 1.000 | 0.986 | 0.922 | |
| Scorer 1–automatic | 0.816 | 0.793 | 0.755 | 0.781 | 0.629 | 0.713 | ||
| Scorer 2–automatic | 0.840 | 0.761 | 0.885 | 0.781 | 0.669 | 0.720 | ||
-
± shows mean and SD, r – Spearman’s correlation coefficient, ‘skipped’ cycle – a cycle where a rapid eye movement sleep episode is expected to appear except that it does not.
Appendix 1—table 9
Skipped cycle human inter-scorer agreement.
| Scorer | Dataset 1 | Dataset 2 | Dataset 3 | Dataset 4 | Dataset 5 | Dataset 6 | Pooled dataset |
|---|---|---|---|---|---|---|---|
| Scorer 1, Number of Skipped Cycles (%) | 5/38 (13%) | 7/39 (18%) | 1/32 (3%) | 19/34 (56%) | 16/62 (26%) | 10/21 (48%) | 58/226 (26%) |
| Scorer 2, Number of Skipped Cycles (%) | 6/38 (15%) | 7/39 (18%) | 3/32 (9%) | 19/34 (59%) | 19/62 (31%) | 10/21 (48%) | 64/226 (28%) |
| Scorer 1 – Scorer 2 Agreement, % | 83 | 100 | 33 | 100 | 84 | 100 | 91 |
Additional files
Download links
A two-part list of links to download the article, or parts of the article, in various formats.
Downloads (link to download the article as PDF)
Open citations (links to open the citations from this article in various online reference manager services)
Cite this article (links to download the citations from this article in formats compatible with various reference manager tools)
Fractal cycles of sleep, a new aperiodic activity-based definition of sleep cycles
eLife 13:RP96784.
https://doi.org/10.7554/eLife.96784.4


