Cerebellar Purkinje cells control posture in larval zebrafish (Danio rerio)
- Depts. of Otolaryngology, Neuroscience & Physiology, and the Neuroscience Institute, NYU Grossman School of Medicine, United States
- Division of Biological Science, Graduate School of Science, Nagoya University, Japan
Figures
Figure 1 with 1 supplement
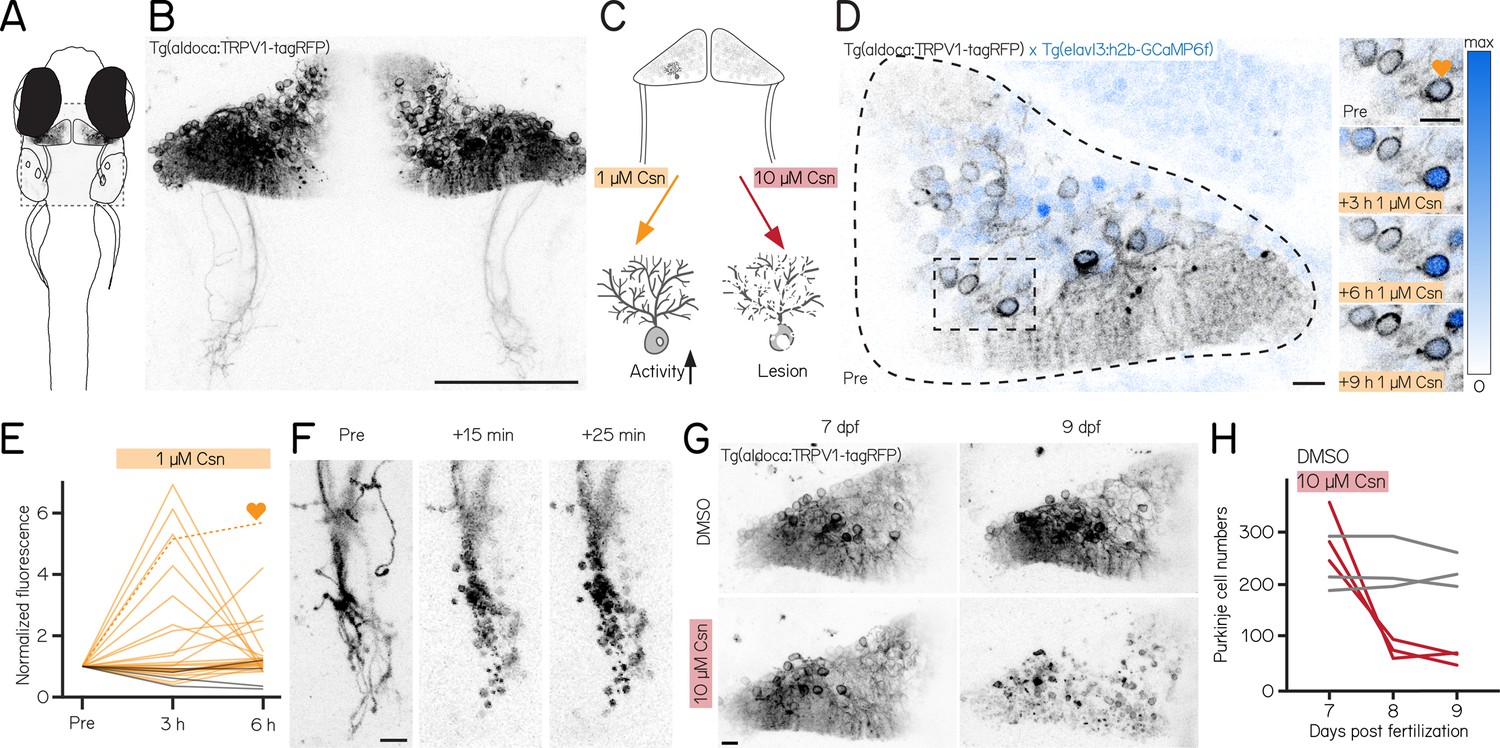
A chemogenetic approach allows dose-dependent activation and lesion of Purkinje cells in the cerebellum.
(A) Schematic of a larval zebrafish overlaid with a confocal image of labeled Purkinje cells in the cerebellum. Gray rectangle corresponds to field of view in (B). (B) Confocal image of Purkinje cells in the cerebellum of a 7 days post-fertilization (dpf) Tg(aldoca:TRPV1-tagRFP) larvae. Scale bar 100 µm. (C) Schematic of strategy for dose-dependent activation (yellow, left) or lesion (red, right) of Purkinje cells by addition of the TRP channel agonist capsaicin (Csn). (D) Confocal image (inverted look-up table) of one cerebellar hemisphere of Tg(aldoca:TRPV1-tagRFP); Tg(elavl3:h2b-GCaMP6f) larvae before, 3, 6, and 9 hr after addition of capsaicin. Heart corresponds to the labelled trace in (E). (E) Normalized change in fluorescence following treatment with 1 µM capsaicin in individual Purkinje cells as a function of time. Purkinje cells from Tg(aldoca:TRPV1-tagRFP);Tg(elavl3:h2b-GCaMP6f) larvae (orange) and Tg(elavl3:h2b-GCaMP6f) control larvae (grey). (F) Timelapse images of Purkinje cell axons in Tg(aldoca:TRPV1-tagRFP) larvae immediately after addition of 10 µM capsaicin. Scale bar 10 µm. (G) Confocal images of cerebellar hemispheres of Tg(aldoca:TRPV1-tagRFP) larvae before (7 dpf, left) and after (9 dpf, right) treatment with 10 µM capsaicin. Control larvae (DMSO, top) and lesion larvae (10 µM capsaicin, bottom). Scale bar 10 µm. (H) Quantification of Purkinje cell numbers of fish (n=3) from (G).
Figure 1—figure supplement 1
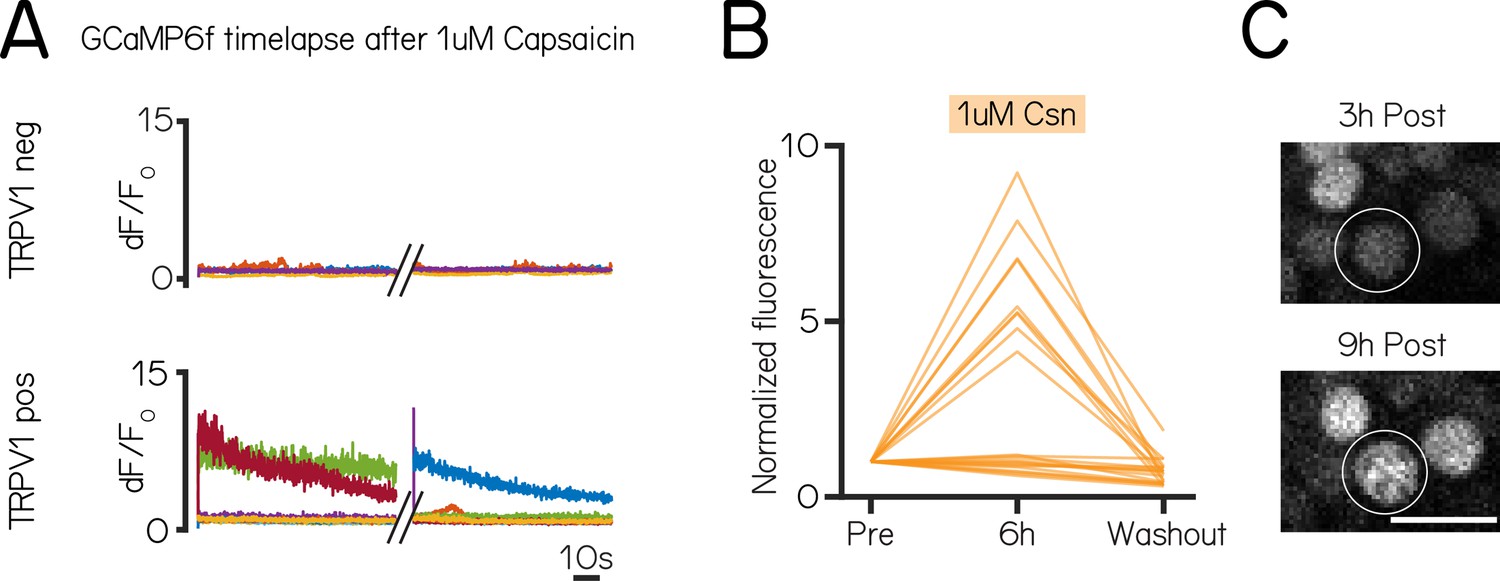
Chemogenetic activation of Purkinje cells is reversible.
(A) Calcium imaging time series after 1 µM Capsaicin of TRPV1-(top) and TRPV1+ cells (bottom) in Tg(aldoca:TRPV1-tagRFP);Tg(elavl3:h2b-GCaMP6f) larvae. Two 1.5 min time series were recorded showing different cells being active (dF/F0 > 2) at different timepoints timelapse 1: TRPV1-: 0/16 (0%) cells and TRPV1+: 5/27 (19%) cells activated; timelapse 2: TRPV1-: 0/16 (0%) cells and TRPV1+: 4/27 (15%) cells activated. (B) Normalized change in fluorescence following treatment with 1 µM capsaicin at 6 hr post treatment and after washout in individual Purkinje cells from Tg(aldoca:TRPV1-tagRFP);Tg(elavl3:h2b-GCaMP6f) larvae. (C) Example confocal image of Purkinje cell nuclei after 3 and 9 hr of 1 µM capsaicin treatment. Speckled fluorescence could be observed after 9 hr of 1 µM capsaicin treatment indicative of cell death (white circle). Scale bar 10 µm.
Figure 2 with 1 supplement
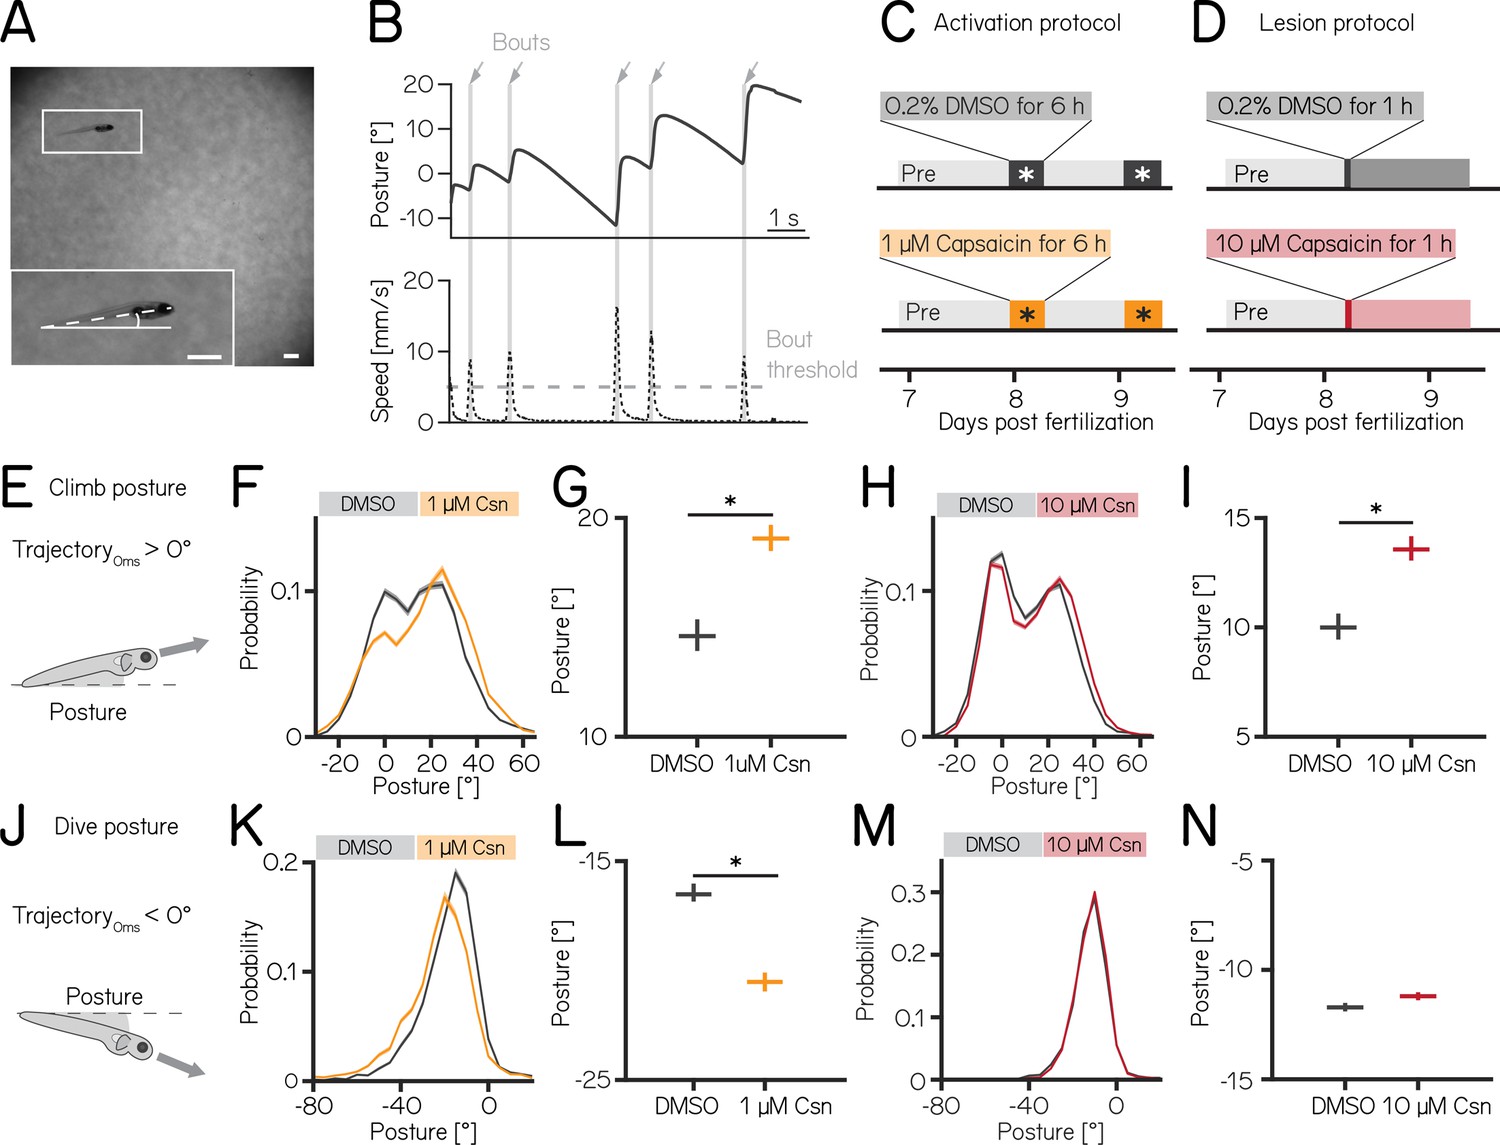
Both chemogenetic activation and ablation of Purkinje cells modify median postural pitch angle.
(A) Sample image of a freely swimming zebrafish larva imaged from the side. Inset shows the larva at higher magnification view and its pitch, defined as the angle between the horizon (straight line) and the long axis of the body (dashed line). Scale bars 1 mm. (B) Pitch angle (posture, top) and speed (bottom) as a function of time for one recorded epoch. Individual swim bouts (speed > 5 mm/s threshold) are highlighted in grey (arrows). (C) Timecourse for activation experiments between 7 and 9 dpf. Larvae received 1 µM of capsaicin in 0.2% DMSO twice on days 8&9 for 6 hr each. (D) Timecourse for lesion experiments; larvae received a single dose of 10 µmM capsaicin in 0.2% DMSO for 1 hr on day 8. (E) Climbs are defined as a bout where the trajectory at peak speed took the fish nose-up (>0°). (F) Probability distribution of climb postures for control (black) and 1 µM capsaicin-treated larvae (yellow). Data is shown as median and inter-quartile range. (G) Average climb posture of control and activated larvae (8 repeats/149 control fish; 8 repeats/155 1 µM capsaicin-treated fish; climb postures: 14.7° [14.0–15.4°] vs. 19.0° [18.5–19.7°], p-value < 0.001, effect size: 29%, Wilcoxon rank sum test). (H) Probability distribution of climb postures for control (black) and 10 µM capsaicin-treated larvae (red). Data is shown as median and inter-quartile range. (I) Average climb posture of control and lesioned larvae (14 repeats/110 control fish; 14 repeats/120 10 µM capsaicin-treated fish; climb postures: 10.0° [9.5–10.7°] vs. 13.6° [13.1–14.3°], p-value < 0.001, effect size: 36%, Wilcoxon rank sum test). (J–N) Same as E-I, but for dive bouts (trajectory that took the fish in the nose-down direction). (L) Average dive posture of control and activated larvae (8 repeats/149 control fish; 8 repeats/155 1 µM capsaicin-treated fish; dive postures: –16.6° [-16.9 to –16.1°] vs. –20.5° [-20.9 to –20.1°], p-value < 0.001, effect size = 24%, Wilcoxon rank sum test). (N) Average dive posture of control and lesioned larvae (14 repeats/110 control fish; 14 repeats/120 10 µmM capsaicin-treated fish; dive postures: –11.7° [-11.9 to –11.5°] vs. –11.2° [-11.4 to –11.0°], p-value = 0.002, effect size = –4%, Wilcoxon rank sum test). Unless otherwise indicated data are shown as median with 95% confidence interval, * indicates p-value < 0.05 and effect size ≥15%.
Figure 2—figure supplement 1
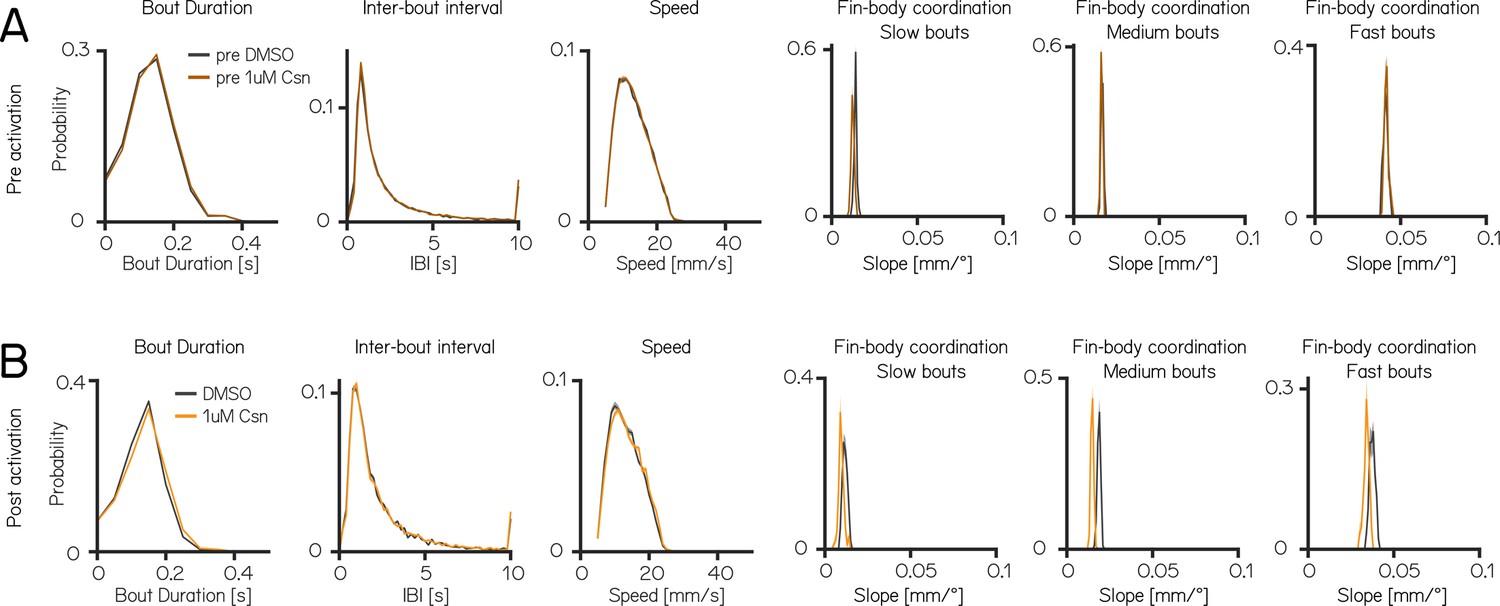
Swim kinematics are not affected by 1 µM capsaicin treatment.
(A) Distributions of swim kinematics and fin body coordination prior to 1 µM capsaicin treatment for control group (pre DMSO - grey) and 1 µM capsaicin group (pre 1 µM capsaicin - brown) reported in Appendix 1—table 1. (B) Distributions of swim kinematics and fin body coordination during activation for control (DMSO - grey) and 1 µM capsaicin-treated (orange) groups reported in Appendix 1—table 1.
Figure 3 with 1 supplement
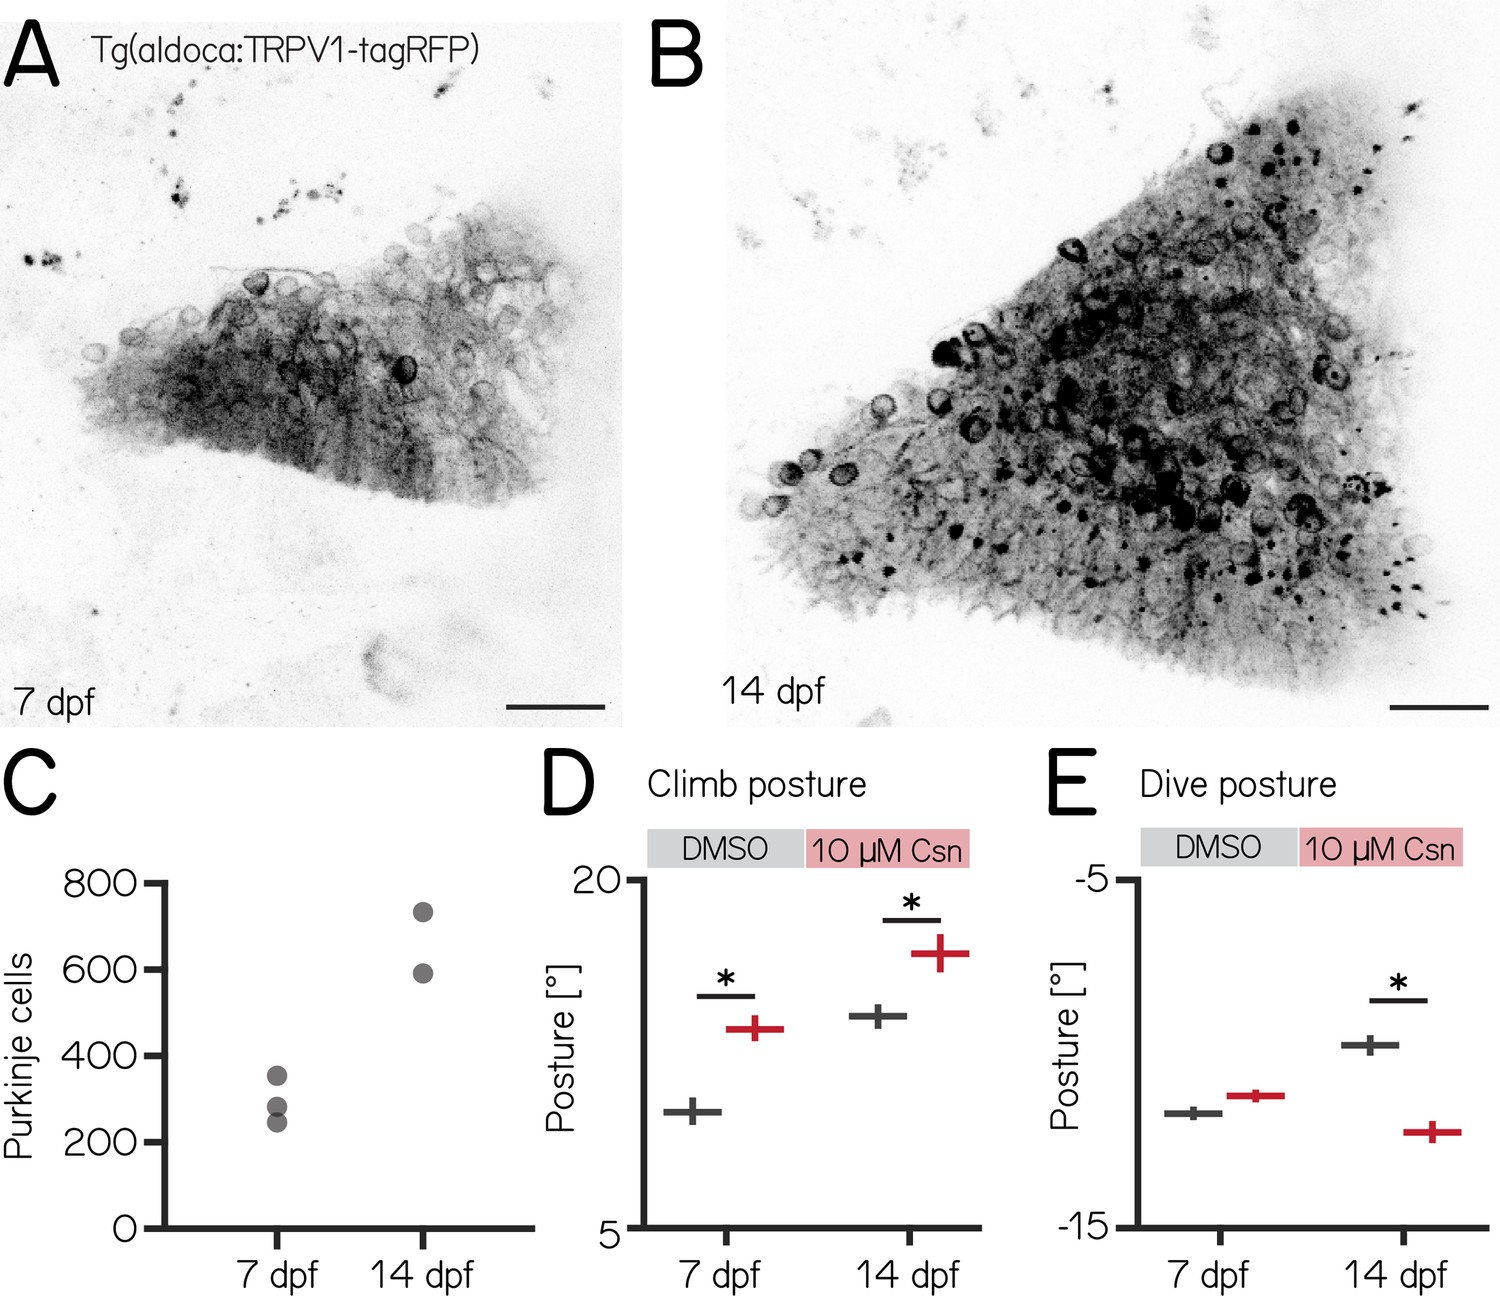
Changes to median postural pitch angle after chemogenetic ablation of Purkinje cells are more pronounced in older fish.
(A) Confocal image of Purkinje cells in the cerebellum of a 7 dpf Tg(aldoca:TRPV1-tagRFP) larvae. Scale bar: 25 µm. (B) Confocal image of Purkinje cells in the cerebellum of a 14 dpf Tg(aldoca:TRPV1-tagRFP) larvae. Scale bar: 25 µm. (C) Increase in Purkinje cell numbers between 7 and 14 dpf. (D) Average climb bouts postures for 7 dpf control and lesion larvae (left) and 14 dpf control and lesion larvae (right). (14 dpf lesion: 7 repeats/48 control fish; 7 repeats/44 10 µM capsaicin-treated fish; climb postures: 14.3° [13.8–14.8°] vs. 17.1° [16.2–17.8°]; p-value < 0.001; effect size: 20%, Wilcoxon rank sum test). (E) Average dive bouts postures for 7 dpf control and lesion larvae (left) and 14 dpf control and lesion larvae (right). (14 dpf lesion: 7 repeats/48 control fish; 7 repeats/44 10 µM capsaicin-treated fish; dive postures: –9.8° [-10.1 to –9.5°] vs. –12.3° [-12.6 to –11.9°]; p-value < 0.001; effect size: 26%, Wilcoxon rank sum test). all data are shown as median with 95% confidence interval, * indicates p-value < 0.05 and effect size ≥15%.
Figure 3—figure supplement 1
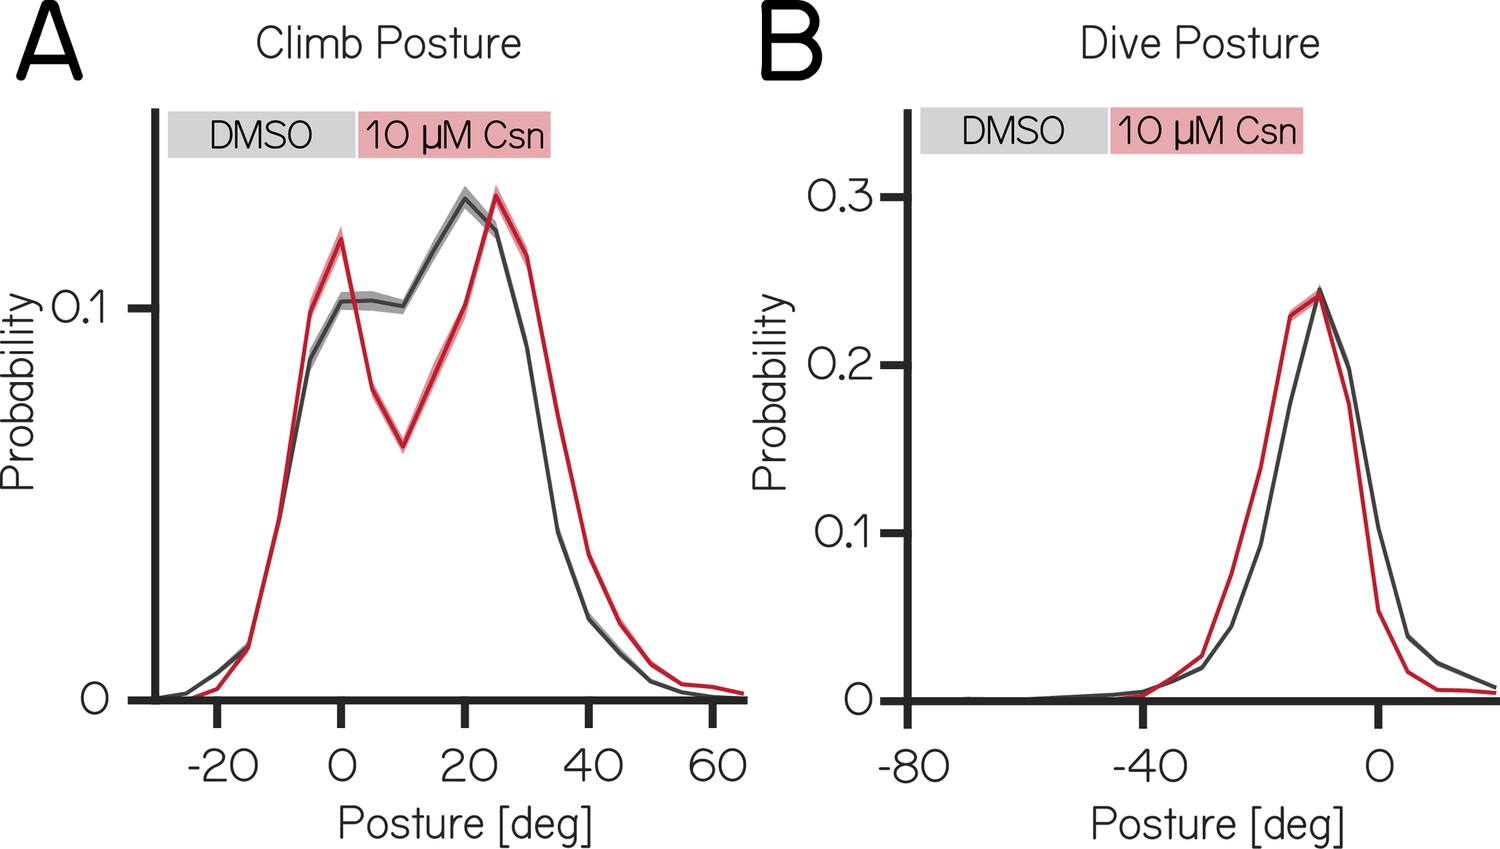
Purkinje cell lesion at 14dpf affects the distribution of postural angles for climb and dive bouts.
(A) Probability distribution of climb postures for control (black) and 10 µM capsaicin-treated 14dpf larvae (red). Data is shown as median and inter-quartile range. (B) Probability distribution of dive postures for control (black) and 10 µM capsaicin-treated 14dpf larvae (red). Data is shown as median and inter-quartile range.
Figure 4 with 1 supplement
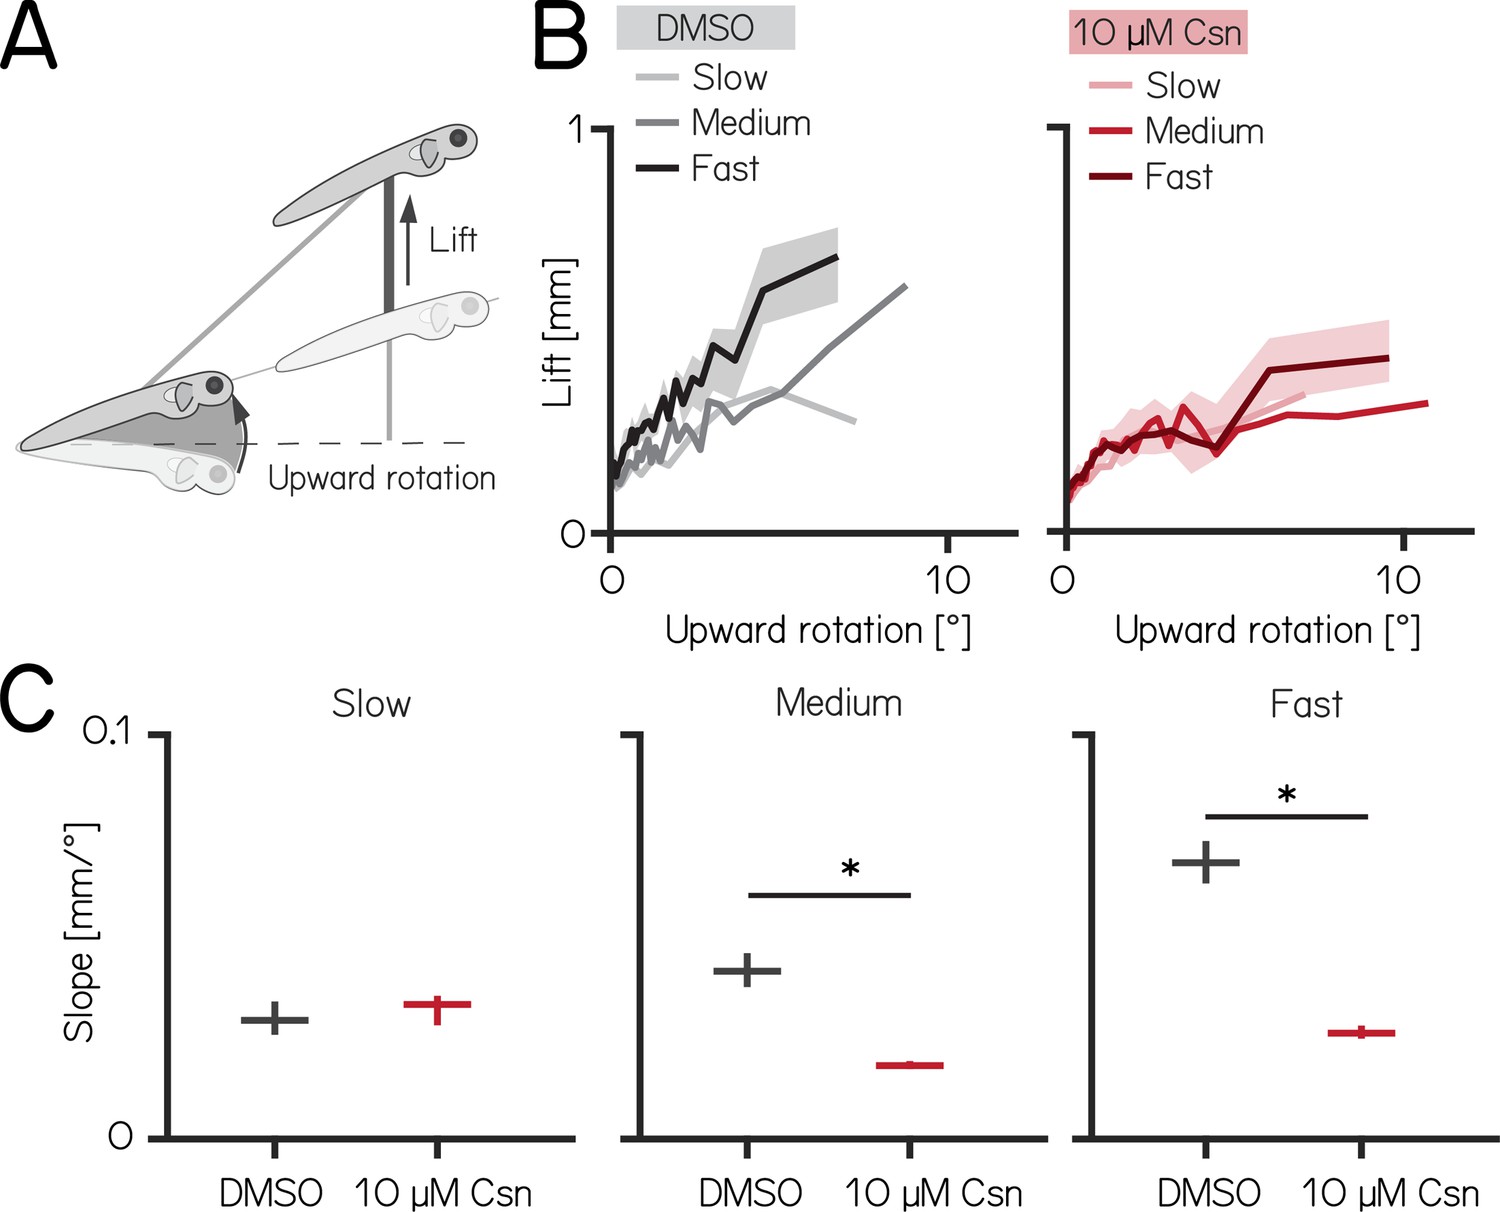
Chemogenetic ablation of Purkinje cells disrupts fin-body coordination in a speed-dependent manner.
(A) Larval zebrafish use two independent effectors (trunk and body) to climb. The contribution of each effector can be dissociated by the observed kinematics: changes to the angle of the trunk predict a trajectory for a particular bout (upward rotation). The actual position of the fish in depth at the end of the bout reveals the lift generated by the fins. A detailed kinematic examination of climbing, including fin ablations, is detailed in Ehrlich and Schoppik, 2019. (B) Coordination of fin and trunk engagement plotted as upward rotation against lift. Positive slopes reveal that larger rotations are coupled to greater fin engagement and greater changes in depth. The slope of this relationship becomes steeper for bouts with greater translational speed. Bouts from control (grey,left) and 10 µM capsaicin-treated larvae (red,right) are plotted at different swim speeds, shaded areas indicate 95% confidence interval of the median of the fast swim speeds. (C) Average slopes of lift/rotation curves for control and 10 µM capsaicin-treated larvae at different swim speeds. (8 repeats/15 control fish; 8 repeats/18 10 µM capsaicin-treated fish); slow: p=0.341; medium: p<0.001; fast: p<0.001. Data are plotted as median with inter-quartile range. * indicates p < 0.05 and effect size ≥15%.
Figure 4—figure supplement 1
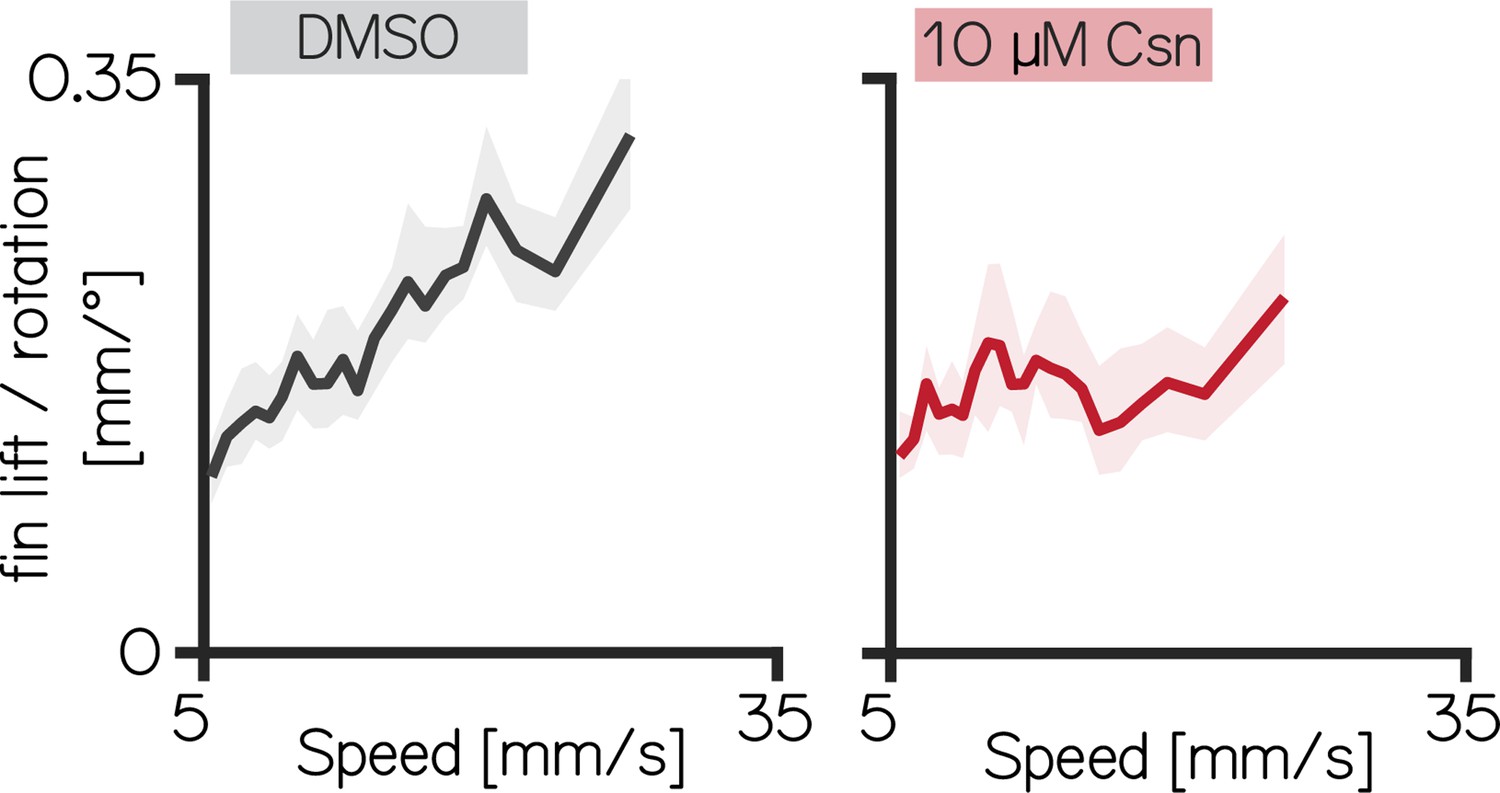
Fin engagement is speed dependent.
Left: Fin Lift / rotation ratio versus speed for 14dpf DMSO-treated fish (Spearman correlation coefficient: 0.2193). Data is shown as median with 95% confidence interval of the median. Right: Fin Lift / rotation ratio versus speed for 14dpf fish 10 µM capsaicin-treated fish. Data is shown as median with 95% confidence interval of the median (Spearman correlation coefficient: 0.0397).
Figure 5 with 1 supplement
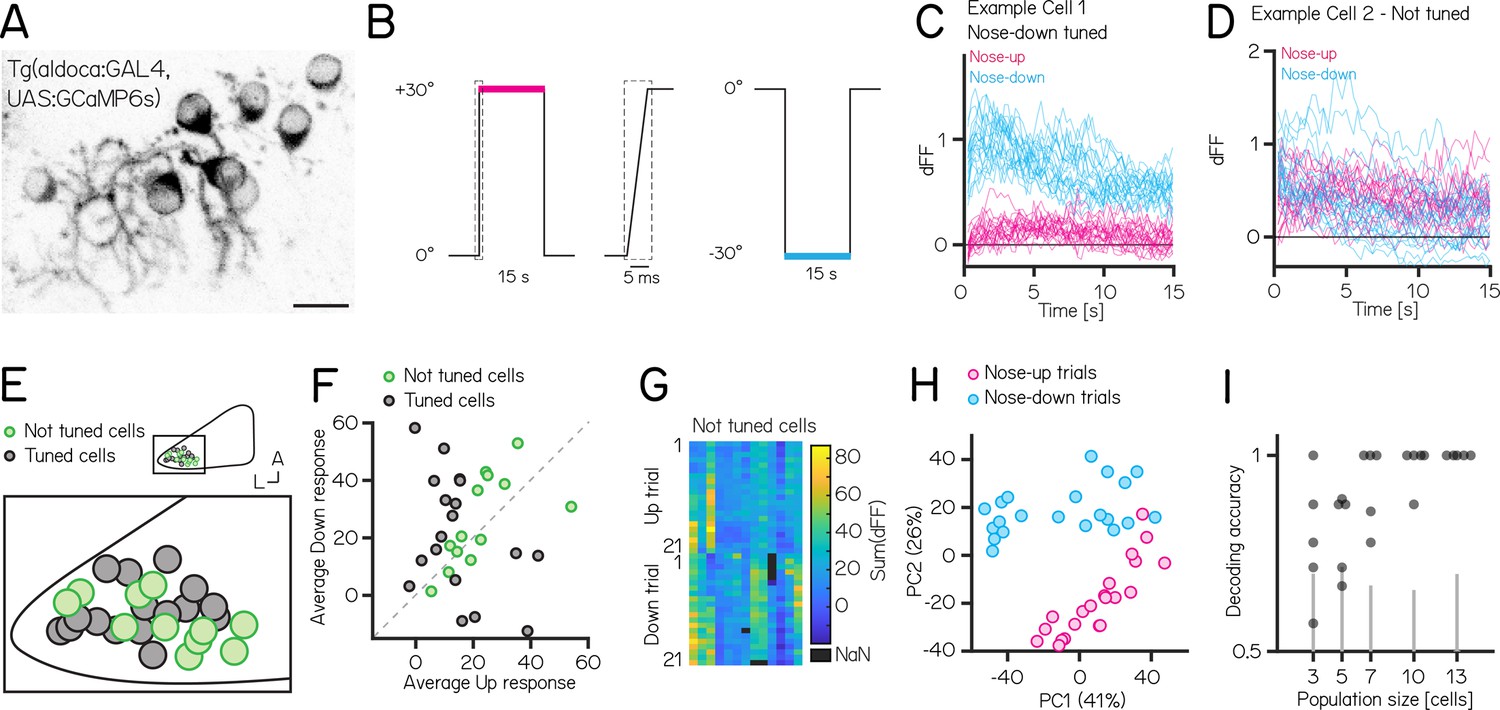
Activity in larval zebrafish Purkinje cells can differentiate nose-up from nose-down pitch both individually and collectively.
(A) Two-photon image of Purkinje cell somata expressing a calcium indicator in the Tg(aldoca:GAL4);Tg(UAS:GCaMP6s) line. Scale bar 10 µm. (B) Pitch tilt stimuli consisted of rapid galvanometer steps for 15 s in the nose up (+30°, pink) and nose-down (–30°, blue) direction. Inset in dotted rectangle shows the near-instantaneous timecourse of the step. (C) Example responses (n=42) from a single Purkinje cell sensitive to nose-down pitch (blue) but not nose-up (pink). (D) Example responses (n=42) from a single Purkinje cell without directional selectivity. (E) Superimposed positions of Purkinje cell somata within a single cerebellar hemisphere; no obvious topography separates tuned (black, n=16) and untuned (green, n=11 —directionality index— < 0.35) cells. (F) Averaged integrated response (dFF) for individual cells over the 15 s stimulus plotted for nose-up vs. nose-down stimuli, colored by tuned (black) and untuned (green). (G) Heatmap of integrated response (dFF) for 13 untuned neurons on 21 up/down tilts. (H) Principal component analysis of integrated responses for untuned neurons for each of 21 up (pink) and 21 down (blue) trials. (Percentage of variance explained) (I) Performance of a support vector machine for binary classification of up/down tilt using integrated responses from increasing numbers of untuned neurons. Dots are different sets of neurons, gray lines shows the spread of performance from shuffled up/down identity (median [interquartile range] accuracy: 3/5/7/10/13 cells: 0.78 [0.68–0.91] / 0.88 [0.70–0.88] / 1 [0.84–1] / 1 [0.97–1] / 1 [1 – 1]).
Figure 5—figure supplement 1
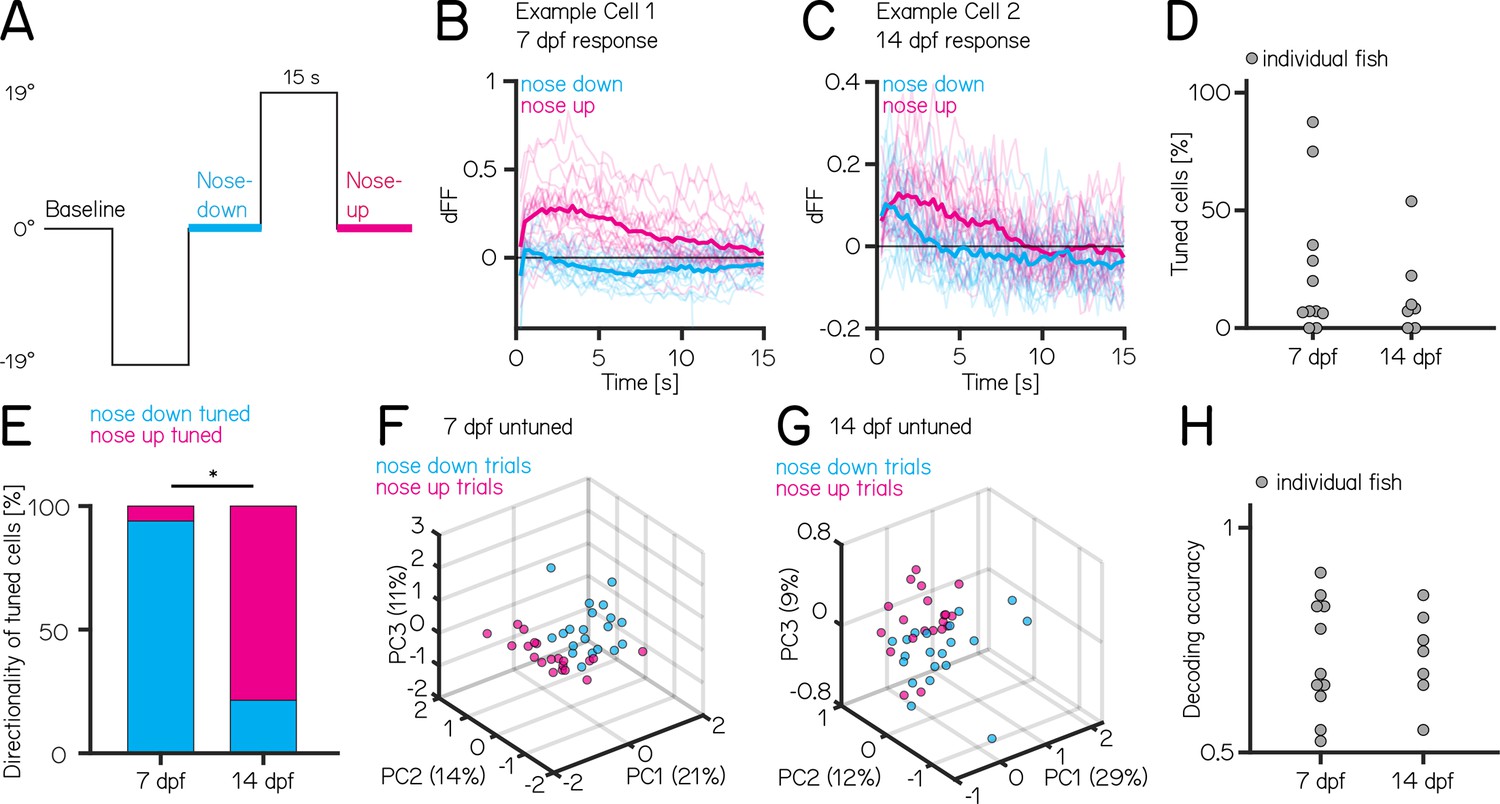
Purkinje cell tuning direction shifts across development, population coding strength remains stable.
(A) One trial consisted of rapid galvanometer steps for 15 s in the nose down (–19°, blue) and nose-up (+19°, pink) direction. (B) Example responses (n=40) from a single Purkinje cell at 7 dpf to nose-down (blue) and nose-up (pink) pitch tilts. The thicker lines indicate the median response to all nose-down or nose-up trials. (C) Example responses (n=40) from a single Purkinje cell at 14 dpf to nose-down (blue) and nose-up (pink) pitch tilts. The thicker lines indicate the median response to all nose-down or nose-up trials. (D) Percentage of tuned cells from individual fish based on a directionality index larger than ±0.35 (median [inter-quartile range]:7 dpf: 7 [6 – 34]%; 14 dpf: 8 [2 – 19]%; p-value = 0.7763, Wilcoxon rank sum test). (E) Direction of tuned cells at 7 and 14 dpf (7 dpf: 2/31 cells up/down-tuned; 14 dpf 11/3 cells up/down-tuned, p-value < 0.001, Fisher’s exact test). (F) Principal component analysis of all untuned cells at 7 dpf for each of 20 up (pink) and 20 down (blue) trials. (Percentage of variance explained) (G) Principal component analysis of all untuned cells at 14 dpf for each of 20 up (pink) and 20 down (blue) trials. (Percentage of variance explained) (H) Performance of a support vector machine for binary classification of up/down tilt using the responses from untuned neurons. Dots are individual fish at 7 dpf and 14 dpf (median [inter-quartile range]: 7 dpf: 0.68 [0.63–0.83]; 14 dpf: 0.73 [0.65–0.79]; P-value = 0.9468, Wilcoxon rank sum test).
Author response image 1
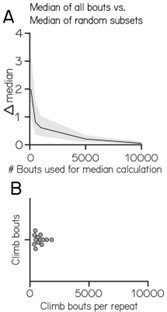
Median estimation based on increasing sample size.
Author response image 2
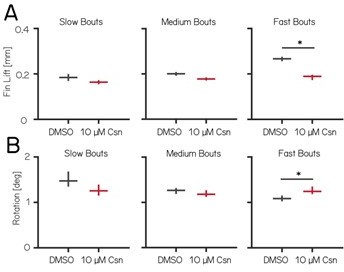
Fin lift and rotation for slow, medium and fast bouts.
Author response image 3

Trial-by-trial variability.
Author response image 4
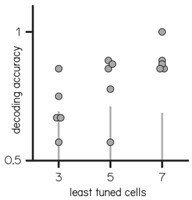
Decoding accuracy of the 3/5/7 least tuned cells.
Tables
Appendix 1—table 1
Behavior measurements 7 dpf Purkinje cell activation.
| control median [95% CI] | activation median [95% CI] | effect [%] | p-value | significance | |
|---|---|---|---|---|---|
| pre activation | |||||
| critical p-value: 0.006 | |||||
| climb posture [°] | 15.4 [15.1–15.8] | 16.1 [15.6–16.4] | 4 | 0.006 | no |
| dive posture [°] | –12.9 [-13.2–-12.6] | –13.5 [-13.8–-13.3] | 5 | <0.001 | no |
| bout duration [s] | 0.2 [0.2–0.2] | 0.2 [0.2–0.2] | 0 | <0.001 | no |
| Inter-bout interval [s] | 1.4 [1.4–1.4] | 1.4 [1.4–1.4] | 2 | <0.001 | no |
| speed [mm/s] | 12.5 [12.4–12.6] | 12.6 [12.5–12.6] | 0 | 0.831 | no |
| slope slow [mm/°] | 0.014 [0.014–0.014] | 0.012 [0.012–0.012] | -4 | 0.078 | no |
| slope medium [mm/°] | 0.017 [0.016–0.017] | 0.016 [0.016–0.016] | -1 | 0.352 | no |
| slope fast [mm/°] | 0.041 [0.041–0.041] | 0.042 [0.041–0.042] | 1 | 0.385 | no |
| post activation | |||||
| critical p-value: 0.006 | |||||
| climb posture [°] | 14.7 [14.0–15.4] | 19.0 [18.5–19.7] | 29 | <0.001 | yes |
| dive posture [°] | –16.6 [-16.9–-16.1] | –20.5 [-20.9–-20.1] | 24 | <0.001 | yes |
| bout duration [s] | 0.2 [0.2–0.2] | 0.2 [0.2–0.2] | 0 | <0.001 | no |
| Inter-bout interval [s] | 1.6 [1.5–1.6] | 1.6 [1.5–1.6] | 2 | 0.043 | no |
| speed [mm/s] | 12.7 [12.5–12.8] | 13.0 [12.9–13.1] | 3 | <0.001 | no |
| slope slow [mm/°] | 0.012 [0.011–0.012] | 0.009 [0.009–0.010] | -6 | 0.149 | no |
| slope medium [mm/°] | 0.019 [0.018–0.019] | 0.015 [0.015–0.015] | –11 | <0.001 | no |
| slope fast [mm/°] | 0.037 [0.037–0.038] | 0.034 [0.034–0.035] | -8 | 0.069 | no |
Appendix 1—table 2
Behavior measurements 7 dpf Purkinje cell lesion.
| control median [95% CI] | lesion median [95% CI] | effect [%] | p-value | significance | |
|---|---|---|---|---|---|
| pre lesion | |||||
| critical p-value: 0.006 | |||||
| climb posture [°] | 18.0 [17.6–18.4] | 19.0 [18.6–19.4] | 6 | 0.001 | no |
| dive posture [°] | –11.9 [-12.1 to -11.6] | –11.5 [-11.7–-11.3] | -3 | 0.25 | no |
| bout duration [s] | 0.2 [0.2–0.2] | 0.2 [0.2–0.2] | 4 | 0.001 | no |
| Inter-bout interval [s] | 1.8 [1.8–1.9] | 1.7 [1.7–1.8] | -4 | <0.001 | no |
| speed [mm/s] | 11.3 [11.2, 11.4] | 12.0 [11.9, 12.1] | 6 | <0.001 | no |
| slope slow [mm/°] | 0.003 [0.003–0.003] | 0.004 [0.004–0.004] | 2 | 0.261 | no |
| slope medium [mm/°] | 0.008 [0.008–0.008] | 0.001 [0.001–0.002] | –14 | <0.001 | no |
| slope fast [mm/°] | 0.050 [0.049–0.050] | 0.052 [0.051–0.053] | 5 | 0.284 | no |
| post lesion | |||||
| critical p-value: 0.006 | |||||
| climb posture [°] | 10.0 [9.5–10.7] | 13.6 [13.1–14.3] | 36 | <0.001 | yes |
| dive posture [°] | –11.7 [-11.9–-11.5] | –11.2 [-11.4–-11.0] | -4 | 0.002 | no |
| bout duration [s] | 0.2 [0.2–0.2] | 0.1 [0.1–0.1] | -4 | <0.001 | no |
| Inter-bout interval [s] | 1.7 [1.7–1.8] | 1.7 [1.7–1.7] | -2 | 0.203 | no |
| speed [mm/s] | 10.3 [10.2–10.4] | 10.6 [10.5–10.7] | 2 | <0.001 | no |
| slope slow [mm/°] | 0.008 [0.007–0.008] | 0.005 [0.005–0.005] | -6 | 0.002 | no |
| slope medium [mm/°] | 0.012 [0.012–0.012] | 0.008 [0.007–0.008] | –10 | <0.001 | no |
| slope fast [mm/°] | 0.047 [0.047–0.048] | 0.025 [0.025–0.026] | –46 | <0.001 | yes |
Appendix 1—table 3
Behavior measurements 14 dpf Purkinje cell lesion.
| control median [95% CI] | lesion median [95% CI] | effect [%] | p-value | significance | |
|---|---|---|---|---|---|
| pre lesion | |||||
| critical p-value: 0.01 | |||||
| climb posture [°] | 16.0 [15.6–16.5] | 15.2 [14.7–15.9] | -5 | <0.001 | no |
| dive posture [°] | –9.0 [-9.4–-8.7] | –9.5 [-9.7–-9.1] | 5 | 0.006 | no |
| bout duration [s] | 0.2 [0.2–0.2] | 0.2 [0.2–0.2] | 3 | 0.59 | no |
| Inter-bout interval [s] | 2.3 [2.3–2.4] | 2.4 [2.4–2.4] | 4 | 0.29 | no |
| speed [mm/s] | 10.2 [10.0–10.3] | 10.5 [10.4–10.7] | 4 | <0.001 | no |
| post lesion | |||||
| critical p-value: 0.01 | |||||
| climb posture [°] | 14.3 [13.8–14.8] | 17.1 [16.2–17.8] | 20 | <0.001 | yes |
| dive posture [°] | –9.8 [-10.1–-9.5] | –12.3 [-12.6–-11.9] | 26 | <0.001 | yes |
| bout duration [s] | 0.2 [0.2–0.2] | 0.2 [0.2–0.2] | -8 | <0.001 | no |
| Inter-bout interval [s] | 2.9 [2.8–3.0] | 2.8 [2.7–2.8] | -4 | 0.01 | no |
| speed [mm/s] | 9.7 [9.6–9.8] | 9.3 [9.2–9.4] | -3 | <0.001 | no |
Appendix 1—table 4
Behavior measurements 14 dpf Purkinje cell lesion.
| control median [95% CI] | lesion median [95% CI] | effect [%] | p-value | significance | |
|---|---|---|---|---|---|
| lesion | |||||
| critical p-value: 0.004 | |||||
| slope slow [mm/°] | 0.029 [0.028–0.031] | 0.033 [0.032–0.034] | 6 | 0.341 | no |
| slope medium [mm/°] | 0.041 [0.040–0.044] | 0.018 [0.018–0.019] | –34 | <0.001 | yes |
| slope fast [mm/°] | 0.068 [0.067–0.071] | 0.026 [0.026–0.027] | –62 | <0.001 | yes |
| R2slow | 0.212 [0.201–0.227] | 0.371 [0.361–0.392] | 35 | 0.005 | no |
| R2 medium | 0.382 [0.373–0.388] | 0.603 [0.594–0.611] | 48 | <0.001 | yes |
| R2 fast | 0.460 [0.452–0.471] | 0.641 [0.634–0.648] | 39 | 0.001 | yes |
| Fin lift slow [mm] | 0.184 [0.168–0.199] | 0.164 [0.155–0.172] | –11 | 0.004 | no |
| Fin lift medium [mm] | 0.201 [0.192–0.208] | 0.178 [0.171–0.185] | –11 | 0.002 | no |
| Fin lift fast [mm] | 0.267 [0.258–0.277] | 0.189 [0.174–0.197] | –29 | <0.001 | yes |
| Rotation slow [°] | 1.471 [1.348–1.686] | 1.254 [1.140–1.383] | –15 | 0.005 | no |
| Rotation medium [°] | 1.265 [1.176–1.324] | 1.178 [1.120–1.275] | -7 | 0.515 | no |
| Rotation fast [°] | 1.083 [1.018–1.150] | 1.241 [1.180–1.336] | 15 | <0.001 | no |
Appendix 1—table 5
Behavior measurements 14 dpf pectoral fin amputation.
| control median [95% CI] | fin amputation median [95% CI] | effect [%] | p-value | significance | |
|---|---|---|---|---|---|
| fin amputation | |||||
| critical p-value: 0.004 | |||||
| slope slow [mm/°] | 0.036 [0.035–0.037] | –0.005 [-0.005–-0.004] | –60 | <0.001 | yes |
| slope medium [mm/°] | 0.055 [0.054–0.056] | –0.005 [-0.005–-0.005] | –88 | <0.001 | yes |
| slope fast [mm/°] | 0.068 [0.067–0.069] | 0.013 [0.013–0.013] | –81 | <0.001 | yes |
| R2 slow | 0.173 [0.162–0.187] | 0.017 [0.003–0.037] | –14 | 0.141 | no |
| R2 medium | 0.370 [0.365–0.379] | 0.011 [0.003–0.019] | –61 | <0.001 | yes |
| R2 fast | 0.450 [0.441–0.458] | 0.090 [0.053–0.144] | –26 | <0.0388 | no |
| Fin lift slow [mm] | 0.206 [0.196–0.222] | 0.066 [0.058–0.075] | –68 | <0.001 | yes |
| Fin lift medium [mm] | 0.219 [0.209–0.226] | 0.082 [0.078–0.087] | –62 | <0.001 | yes |
| Fin lift fast [mm] | 0.275 [0.263–0.284] | 0.123 [0.117–0.129] | –55 | <0.001 | yes |
| Rotation slow [°] | 1.544 [1.402–1.689] | 0.546 [0.455–0.652] | –65 | <0.001 | yes |
| Rotation medium [°] | 1.339 [1.278–1.419] | 0.642 [0.609–0.689] | –52 | <0.001 | yes |
| Rotation fast [°] | 1.046 [0.975–1.119] | 0.950 [0.887–1.033] | -9 | 0.014 | no |
Appendix 1—table 6
Results of ANOVA on interquartile ranges (IQRs) of single experimental repeats for 7 Days Post-Fertilization (dpf) activation experiments.
| Source | Sum Sq. | d.f. | Mean Sq. | F | Prob >F |
|---|---|---|---|---|---|
| Group | 65.0 | 3.0 | 21.7 | 0.225 | 0.879 |
| Measurement Type | 34.6 | 4.0 | 8.7 | 0.090 | 0.986 |
| Group*Measurement Type | 80.3 | 12.0 | 6.7 | 0.069 | 1.000 |
| Error | 32818.0 | 340.0 | 96.5 | ||
| Total | 32998.0 | 359.0 |
Appendix 1—table 7
Results of ANOVA on interquartile ranges (IQRs) of single experimental repeats for 7 Days Post-Fertilization (dpf) lesion experiments.
| Source | Sum Sq. | d.f. | Mean Sq. | F | Prob >F |
|---|---|---|---|---|---|
| Group | 15.0 | 3 | 5.0 | 0.064 | 0.979 |
| Measurement Type | 70.0 | 4 | 17.5 | 0.223 | 0.925 |
| Group*Measurement Type | 34.2 | 12 | 2.9 | 0.036 | 1.000 |
| Error | 25069.4 | 320 | 78.3 | ||
| Total | 25188.6 | 339 |
Appendix 1—table 8
Results of ANOVA on interquartile ranges (IQRs) of single experimental repeats for 14 Days Post-Fertilization (dpf) lesion experiments.
| Source | Sum Sq. | d.f. | Mean Sq. | F | Prob >F |
|---|---|---|---|---|---|
| Group | 8.3 | 3.0 | 2.8 | 0.028 | 0.994 |
| Measurement Type | 382.8 | 4.0 | 95.7 | 0.973 | 0.423 |
| Group*Measurement Type | 47.3 | 12.0 | 3.9 | 0.040 | 1.000 |
| Error | 17700.5 | 180.0 | 98.3 | ||
| Total | 18138.9 | 199.0 |
Appendix 1—table 9
IQR for all experimental repeats prior to excluding any repeats for 7dpf Purkinje cell activation data set.
| climb bout posture [°] | dive bout posture [°] | Duration [s] | IBI [s] | Speed [mm/s] | |
|---|---|---|---|---|---|
| pre control | 20.74 | 23.65 | 0.075 | 1.33 | 7.36 |
| 28.21 | 16.96 | 0.125 | 1.00 | 7.28 | |
| 29.90 | 24.49 | 0.125 | 1.40 | 9.43 | |
| 24.84 | 17.06 | 0.075 | 1.55 | 7.96 | |
| 22.60 | 18.18 | 0.075 | 1.60 | 7.64 | |
| 23.63 | 15.56 | 0.075 | 2.04 | 4.99 | |
| 18.86 | 17.54 | 0.100 | 2.48 | 6.69 | |
| 22.52 | 15.44 | 0.075 | 2.03 | 6.93 | |
| 23.00 | 11.93 | 0.081 | 2.38 | 6.92 | |
| 20.05 | 14.85 | 0.075 | 1.61 | 7.30 | |
| 19.29 | 18.75 | 0.100 | 2.30 | 6.00 | |
| 22.25 | 14.81 | 0.075 | 2.23 | 6.25 | |
| 21.61 | 17.06 | 0.075 | 1.95 | 6.36 | |
| 24.16 | 18.94 | 0.100 | 1.68 | 6.66 | |
| 19.63 | 10.03 | 0.050 | 1.75 | 6.68 | |
| 22.35 | 16.96 | 0.100 | 1.90 | 6.44 | |
| 21.22 | 13.89 | 0.100 | 2.50 | 7.08 | |
| 21.61 | 14.43 | 0.075 | 1.68 | 7.10 | |
| pre activation | 24.68 | 16.86 | 0.081 | 1.87 | 7.44 |
| 25.48 | 13.85 | 0.100 | 1.30 | 7.71 | |
| 25.88 | 13.53 | 0.100 | 1.08 | 6.48 | |
| 24.92 | 16.52 | 0.075 | 1.68 | 7.13 | |
| 20.30 | 18.64 | 0.075 | 1.38 | 4.41 | |
| 23.32 | 21.46 | 0.100 | 2.99 | 6.39 | |
| 25.03 | 15.73 | 0.100 | 1.83 | 6.68 | |
| 21.49 | 14.53 | 0.100 | 2.12 | 6.38 | |
| 25.84 | 16.73 | 0.100 | 1.58 | 6.66 | |
| 22.33 | 12.52 | 0.075 | 2.10 | 6.67 | |
| 20.44 | 16.83 | 0.075 | 3.10 | 6.05 | |
| 23.67 | 16.49 | 0.100 | 2.78 | 6.38 | |
| 27.07 | 19.06 | 0.100 | 2.70 | 6.32 | |
| 23.81 | 17.40 | 0.075 | 1.66 | 7.31 | |
| 21.82 | 19.38 | 0.050 | 2.33 | 7.68 | |
| 24.27 | 16.03 | 0.100 | 2.33 | 6.73 | |
| 23.44 | 16.06 | 0.100 | 1.98 | 7.12 | |
| 22.89 | 15.45 | 0.100 | 1.58 | 6.93 | |
| control | 21.10 | 16.75 | 0.050 | 0.43 | 5.69 |
| 24.43 | 43.20 | 0.100 | 1.40 | 7.61 | |
| 36.40 | 18.92 | 0.100 | 1.56 | 8.08 | |
| 21.95 | 18.46 | 0.075 | 1.96 | 7.08 | |
| 21.82 | 20.37 | 0.075 | 1.25 | 8.00 | |
| 20.74 | 19.04 | 0.075 | 1.98 | 6.57 | |
| 22.37 | 20.55 | 0.075 | 1.53 | 6.95 | |
| 21.79 | 13.07 | 0.075 | 2.05 | 7.40 | |
| 23.97 | 16.79 | 0.075 | 2.43 | 6.41 | |
| 22.48 | 16.57 | 0.075 | 2.09 | 6.38 | |
| 21.13 | 21.03 | 0.075 | 2.33 | 6.43 | |
| 23.19 | 17.84 | 0.075 | 1.98 | 6.47 | |
| 22.40 | 18.91 | 0.075 | 1.73 | 6.46 | |
| 25.41 | 20.43 | 0.075 | 2.08 | 6.83 | |
| 29.93 | 18.46 | 0.075 | 1.90 | 5.79 | |
| 24.37 | 25.53 | 0.100 | 1.80 | 6.58 | |
| 26.21 | 19.68 | 0.100 | 1.53 | 6.10 | |
| 20.50 | 18.00 | 0.075 | 1.50 | 6.32 | |
| activation | 23.40 | 28.68 | 0.075 | 0.65 | 6.53 |
| 26.09 | 11.16 | 0.075 | 1.65 | 7.51 | |
| 21.35 | 19.42 | 0.050 | 0.75 | 6.68 | |
| 23.69 | 13.84 | 0.075 | 2.31 | 6.34 | |
| 19.90 | 15.18 | 0.050 | 1.25 | 5.33 | |
| 24.64 | 20.85 | 0.050 | 1.96 | 6.96 | |
| 23.64 | 22.08 | 0.075 | 1.78 | 7.22 | |
| 21.78 | 18.14 | 0.100 | 2.19 | 6.98 | |
| 24.24 | 17.35 | 0.100 | 2.57 | 8.79 | |
| 27.93 | 13.88 | 0.100 | 2.63 | 7.56 | |
| 23.48 | 21.20 | 0.075 | 2.51 | 6.25 | |
| 26.16 | 20.58 | 0.100 | 2.33 | 6.95 | |
| 27.49 | 26.34 | 0.081 | 1.73 | 6.60 | |
| 26.88 | 23.40 | 0.075 | 1.85 | 7.78 | |
| 25.26 | 19.62 | 0.075 | 2.10 | 7.60 | |
| 24.41 | 20.94 | 0.100 | 2.33 | 6.47 | |
| 26.64 | 19.76 | 0.100 | 1.90 | 6.69 | |
| 23.86 | 19.33 | 0.075 | 1.53 | 6.45 |
Appendix 1—table 10
IQR for all experimental repeats prior to excluding any repeats for 7dpf Purkinje cell lesion data set.
| climb bout posture [°] | dive bout posture [°] | Duration [s] | IBI [s] | Speed [mm/s] | |
|---|---|---|---|---|---|
| pre control | 24.53 | 14.18 | 0.113 | 3.67 | 9.85 |
| 29.07 | 16.59 | 0.088 | 5.22 | 6.61 | |
| 23.45 | 16.59 | 0.094 | 6.22 | 7.99 | |
| 25.97 | 15.89 | 0.125 | 3.73 | 9.84 | |
| 20.95 | 15.60 | 0.094 | 3.48 | 6.82 | |
| 19.82 | 19.78 | 0.100 | 3.29 | 9.77 | |
| 23.70 | 13.59 | 0.119 | 5.99 | 7.03 | |
| 24.08 | 18.19 | 0.095 | 3.87 | 8.89 | |
| 26.89 | 12.68 | 0.088 | 2.70 | 6.42 | |
| 22.21 | 14.27 | 0.113 | 5.84 | 7.13 | |
| 21.91 | 17.16 | 0.113 | 2.49 | 9.02 | |
| 24.20 | 14.05 | 0.131 | 7.95 | 6.71 | |
| 20.42 | 16.63 | 0.088 | 2.80 | 5.97 | |
| 18.70 | 11.07 | 0.094 | 3.17 | 6.10 | |
| 26.29 | 10.92 | 0.094 | 2.18 | 6.52 | |
| 23.38 | 11.81 | 0.063 | 1.03 | 7.63 | |
| 18.46 | 13.09 | 0.106 | 1.73 | 7.54 | |
| pre lesion | 16.27 | 19.05 | 0.098 | 1.64 | 7.82 |
| 22.59 | 14.01 | 0.113 | 6.83 | 7.65 | |
| 27.26 | 17.13 | 0.088 | 3.37 | 8.68 | |
| 26.93 | 20.38 | 0.119 | 2.15 | 8.99 | |
| 26.21 | 12.07 | 0.088 | 4.38 | 4.64 | |
| 28.53 | 14.25 | 0.094 | 3.81 | 7.55 | |
| 22.40 | 14.02 | 0.106 | 5.10 | 7.70 | |
| 21.12 | 15.35 | 0.106 | 3.70 | 9.32 | |
| 24.34 | 13.21 | 0.100 | 2.75 | 7.15 | |
| 21.10 | 15.76 | 0.094 | 4.42 | 7.88 | |
| 25.81 | 15.31 | 0.100 | 4.41 | 8.61 | |
| 30.09 | 13.90 | 0.119 | 5.43 | 7.73 | |
| 21.85 | 12.45 | 0.106 | 4.18 | 7.82 | |
| 19.56 | 18.35 | 0.072 | 2.10 | 5.06 | |
| 20.57 | 10.43 | 0.091 | 2.39 | 6.44 | |
| 21.79 | 15.38 | 0.075 | 2.69 | 6.59 | |
| 22.69 | 16.77 | 0.109 | 2.09 | 9.98 | |
| post control | 22.43 | 24.44 | 0.100 | 2.29 | 9.60 |
| 21.46 | 16.25 | 0.106 | 6.89 | 4.19 | |
| 29.27 | 14.18 | 0.094 | 3.72 | 7.25 | |
| 22.57 | 14.49 | 0.069 | 3.55 | 7.13 | |
| 20.13 | 16.04 | 0.100 | 4.93 | 6.48 | |
| 23.73 | 17.81 | 0.088 | 3.65 | 6.99 | |
| 25.54 | 12.29 | 0.119 | 4.97 | 5.39 | |
| 16.56 | 14.54 | 0.088 | 3.40 | 10.50 | |
| 25.93 | 13.75 | 0.094 | 4.08 | 5.71 | |
| 24.72 | 15.81 | 0.119 | 6.18 | 5.81 | |
| 23.33 | 10.90 | 0.094 | 2.99 | 4.77 | |
| 23.03 | 11.87 | 0.106 | 7.14 | 5.50 | |
| 20.11 | 13.99 | 0.088 | 3.59 | 6.06 | |
| 18.18 | 18.27 | 0.091 | 2.46 | 5.63 | |
| 21.23 | 13.98 | 0.063 | 0.85 | 4.65 | |
| 20.15 | 13.44 | 0.094 | 1.09 | 5.63 | |
| 20.30 | 13.38 | 0.063 | 0.84 | 5.27 | |
| post lesion | 18.49 | 13.28 | 0.063 | 5.34 | 5.32 |
| 24.95 | 12.55 | 0.113 | 7.19 | 4.72 | |
| 28.40 | 15.31 | 0.078 | 4.29 | 7.82 | |
| 27.02 | 11.85 | 0.106 | 6.30 | 6.02 | |
| 23.87 | 11.08 | 0.063 | 5.39 | 5.24 | |
| 23.90 | 12.96 | 0.069 | 1.96 | 6.24 | |
| 26.79 | 11.18 | 0.069 | 0.91 | 5.87 | |
| 26.27 | 15.42 | 0.094 | 4.43 | 8.02 | |
| 25.66 | 14.43 | 0.100 | 6.43 | 5.88 | |
| 24.62 | 13.05 | 0.125 | 6.24 | 5.66 | |
| 25.76 | 12.31 | 0.100 | 4.98 | 7.33 | |
| 28.85 | 12.47 | 0.094 | 6.11 | 5.98 | |
| 22.35 | 13.41 | 0.075 | 1.85 | 6.94 | |
| 22.36 | 17.24 | 0.088 | 3.17 | 5.22 | |
| 22.52 | 14.74 | 0.069 | 0.88 | 5.07 | |
| 27.76 | 12.45 | 0.094 | 2.01 | 4.49 | |
| 24.21 | 12.28 | 0.056 | 1.16 | 4.98 |
Appendix 1—table 11
IQR for all experimental repeats prior to excluding any repeats for 14dpf Purkinje cell lesion data set.
| climb bout posture [°] | dive bout posture [°] | Duration [s] | IBI [s] | Speed [mm/s] | |
|---|---|---|---|---|---|
| pre control | 28.70 | 14.05 | 0.136 | 5.04 | 7.83 |
| 26.16 | 14.40 | 0.113 | 4.06 | 7.27 | |
| 35.74 | 18.05 | 0.119 | 2.53 | 4.47 | |
| 30.01 | 23.57 | 0.125 | 1.26 | 3.32 | |
| 30.92 | 18.92 | 0.175 | 3.28 | 6.19 | |
| 29.46 | 15.84 | 0.194 | 3.83 | 7.89 | |
| 6.29 | 9.94 | 0.169 | 1.38 | 4.81 | |
| 15.57 | 7.98 | 0.131 | 3.11 | 5.13 | |
| 20.51 | 13.12 | 0.138 | 4.17 | 7.72 | |
| 20.14 | 15.36 | 0.169 | 3.26 | 6.63 | |
| pre lesion | 24.18 | 13.16 | 0.131 | 6.20 | 5.15 |
| 19.37 | 18.62 | 0.138 | 2.32 | 7.81 | |
| 33.27 | 18.72 | 0.122 | 3.30 | 5.90 | |
| 21.64 | 14.69 | 0.128 | 2.60 | 5.18 | |
| 32.50 | 16.35 | 0.169 | 3.91 | 6.48 | |
| 28.20 | 17.16 | 0.169 | 1.68 | 6.59 | |
| 10.11 | 6.42 | 0.150 | 3.91 | 4.40 | |
| 23.29 | 17.03 | 0.100 | 2.95 | 5.89 | |
| 30.73 | 10.10 | 0.150 | 3.95 | 8.29 | |
| 22.80 | 14.67 | 0.156 | 4.61 | 8.10 | |
| post control | 26.02 | 13.49 | 0.119 | 4.14 | 7.82 |
| 24.71 | 14.18 | 0.100 | 5.50 | 7.34 | |
| 32.91 | 16.37 | 0.125 | 5.63 | 5.88 | |
| 26.24 | 21.08 | 0.100 | 1.75 | 3.42 | |
| 26.15 | 18.88 | 0.119 | 3.98 | 5.59 | |
| 34.05 | 17.22 | 0.131 | 5.06 | 5.75 | |
| 4.98 | 9.41 | 0.100 | 1.74 | 4.02 | |
| 10.19 | 15.13 | 0.088 | 5.12 | 4.07 | |
| 24.15 | 12.57 | 0.144 | 4.92 | 7.42 | |
| 27.81 | 18.68 | 0.144 | 3.74 | 6.66 | |
| post lesion | 21.22 | 13.02 | 0.106 | 6.42 | 4.59 |
| 18.43 | 11.33 | 0.106 | 3.13 | 7.07 | |
| 26.90 | 16.54 | 0.119 | 3.90 | 5.56 | |
| 25.77 | 20.22 | 0.094 | 3.41 | 4.43 | |
| 28.24 | 16.45 | 0.113 | 5.15 | 5.89 | |
| 38.16 | 16.41 | 0.106 | 3.38 | 4.17 | |
| 11.72 | 7.70 | 0.091 | 3.29 | 3.68 | |
| 14.28 | 8.12 | 0.119 | 2.83 | 4.83 | |
| 27.58 | 11.96 | 0.125 | 4.27 | 5.83 | |
| 24.03 | 16.41 | 0.113 | 5.10 | 7.13 |
Appendix 1—key resources table
| Reagent type (species) or resource | Designation | Source or reference | Identifiers | Additional information |
|---|---|---|---|---|
| Strain, strain background (Danio rerio) | Tg(aldoca:TRPV1- TagRFP) | This study | N/A | |
| Strain, strain background (D. rerio) | Tg(UAS:GCaMP6s) | Thiele et al., 2014 | ZFIN: ZDB- TGCONSTRCT- 140811–3 | |
| Strain, strain background (D. rerio) | Tg(aldoca:GAL4) | Takeuchi et al., 2015 | ZFIN: ZDB- TGCONSTRCT- 150414–2 | |
| Strain, strain background (D. rerio) | Tg(elavl3:h2B- GCaMP6f) | Dunn et al., 2016 | ZFIN: ZDB- TGCONSTRCT- 150916–4 | |
| Chemical compound, drug | Low melting point agarose | Thermo Fisher Scientific | 16520 | |
| Chemical compound, drug | Methylene blue | Sigma Aldrich | M9140 | |
| Chemical compound, drug | Capsaicin | Sigma Aldrich | M2028 | |
| Software, algorithm | Fiji/ImageJ | Schindelin et al., 2012 | RRID:SCR_002285 | |
| Software, algorithm | Adobe Illustrator (2020) | Adobe | RRID:SCR_010279 | |
| Software, algorithm | Matlab 2020b | Mathworks | RRID:SCR_001622 |
Additional files
Download links
A two-part list of links to download the article, or parts of the article, in various formats.
Downloads (link to download the article as PDF)
Open citations (links to open the citations from this article in various online reference manager services)
Cite this article (links to download the citations from this article in formats compatible with various reference manager tools)
Cerebellar Purkinje cells control posture in larval zebrafish (Danio rerio)
eLife 13:RP97614.
https://doi.org/10.7554/eLife.97614.3


