Synaptic enrichment and dynamic regulation of the two opposing dopamine receptors within the same neurons
- Graduate School of Life Sciences, Tohoku University, Japan
- Department of Biological Science and Technology, Faculty of Advanced Engineering, Tokyo University of Science, Japan
- Department of Cell Biology, New York University, United States
- Faculty and Graduate School of Engineering Science, Akita University, Japan
- Department of Biology, University of Iowa, United States
Figures
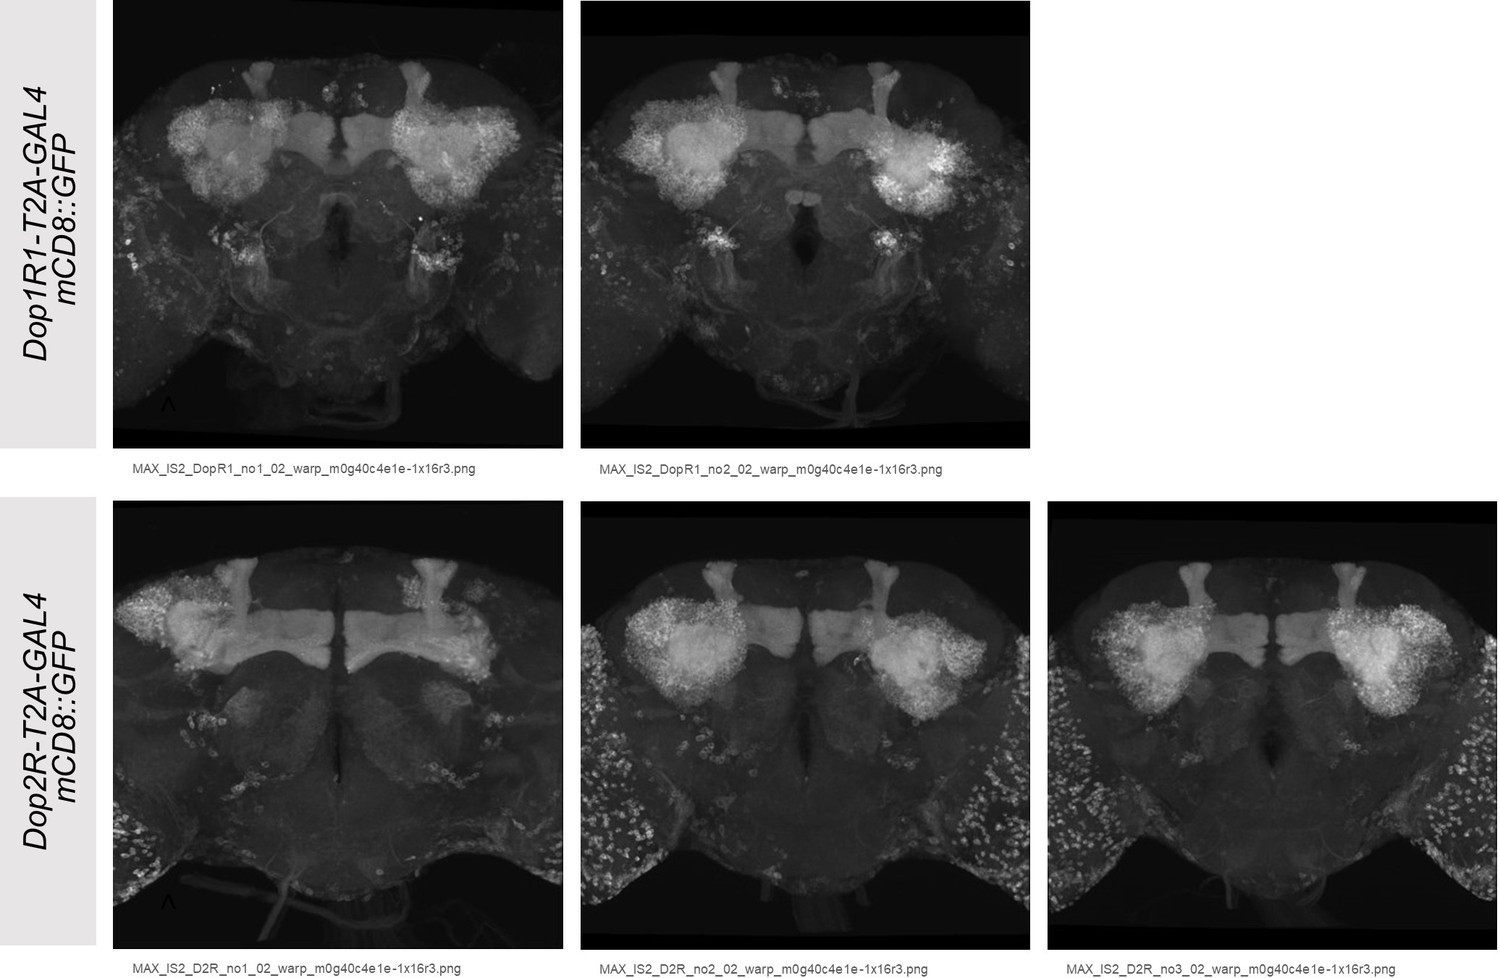
Figure 1 with 1 supplement
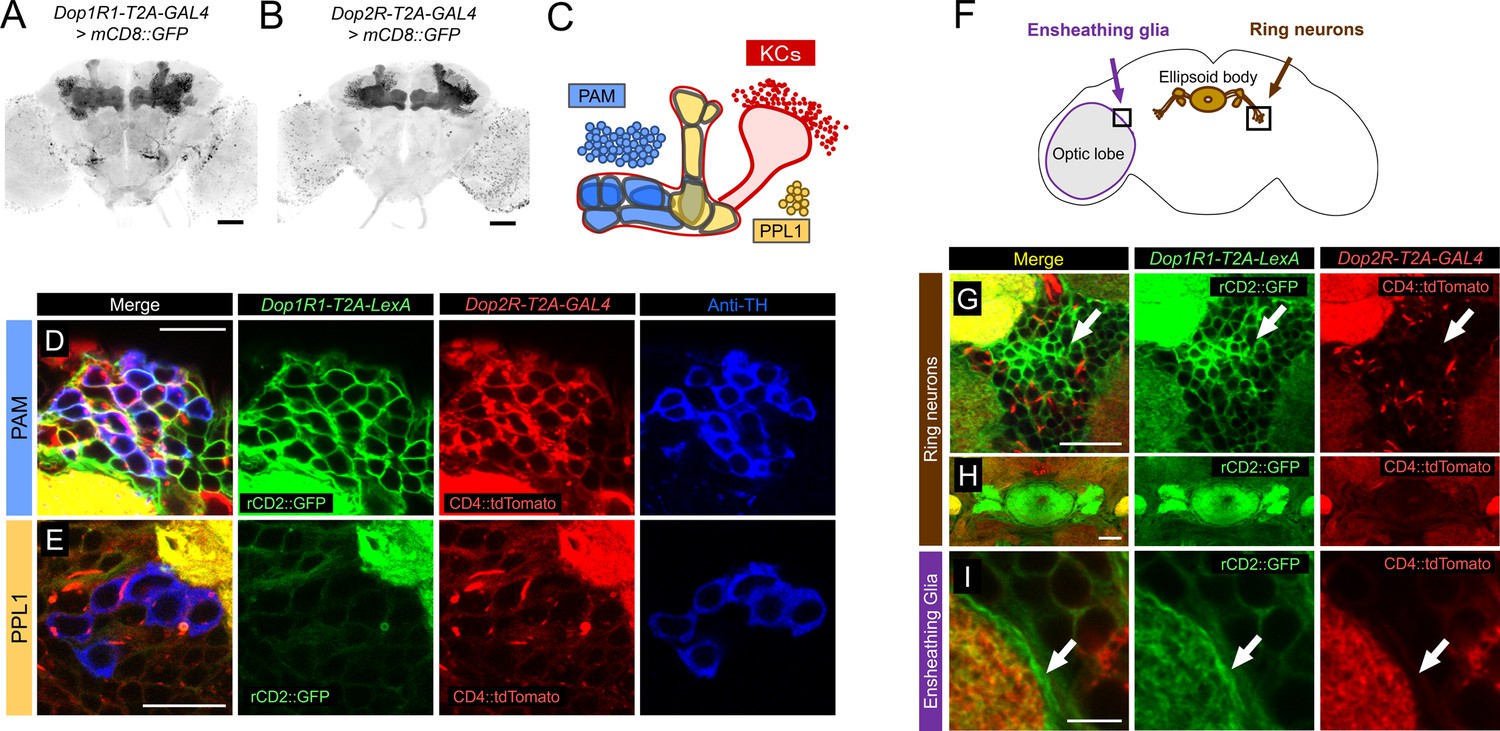
Co-expression of Dop1R1 and Dop2R genes in adult Drosophila brain.
(A and B) The expression of Dop1R1-T2A-GAL4 and Dop2R-T2A-GAL4 visualized by UAS-mCD8::GFP. Maximum-intensity projections of the whole brain. (C) Schematic of the Kenyon cells (KCs) and the mushroom bodies (MB)-innervating dopamine neurons from the protocerebral anterior medial (PAM) and posterior lateral 1 (PPL1) clusters. (D–E, G–I) Double labeling of Dop1R1-T2A-LexA and Dop2R-T2A-GAL4 expressions by lexAop-rCD2::GFP (green) and UAS-CD4::tdTomato (red), respectively. Dopamine neurons were immunostained with anti-TH antibody (blue). Single optical sections are shown. Cell bodies of the PAM cluster (D), the PPL1 cluster (E), ring neurons projecting to the ellipsoid body (G and H), and ensheathing glia (I) are shown. (F) Schematic of the regions shown in (G–I). Scale bars, 50 µm (A and B), 5 µm (D, E, and I), 20 µm (G and H).
Figure 1—figure supplement 1
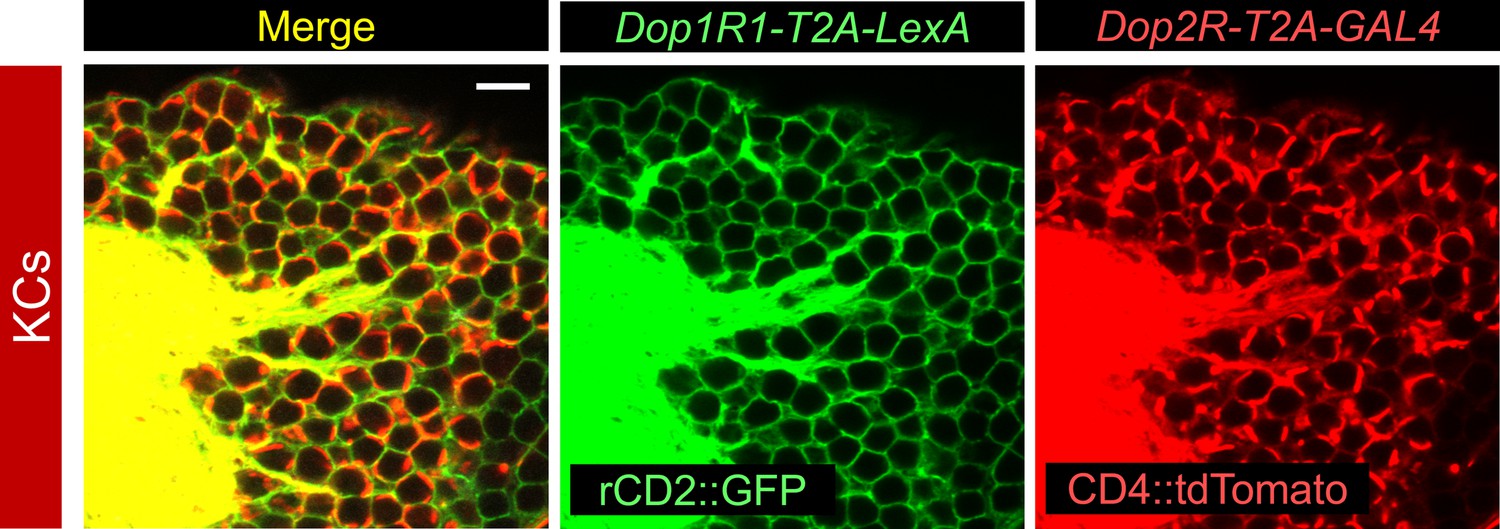
Co-expression of Dop1R1 and Dop2R genes in Kenyon cells.
Double labeling of Dop1R1-T2A-LexA and Dop2R-T2A-GAL4 expressions by lexAop-rCD2::GFP (green) and UAS-CD4::tdTomato (red), respectively. Cell bodies of Kenyon cells are shown. A single optical section is shown. Scale bars, 5 µm.
Figure 2 with 1 supplement
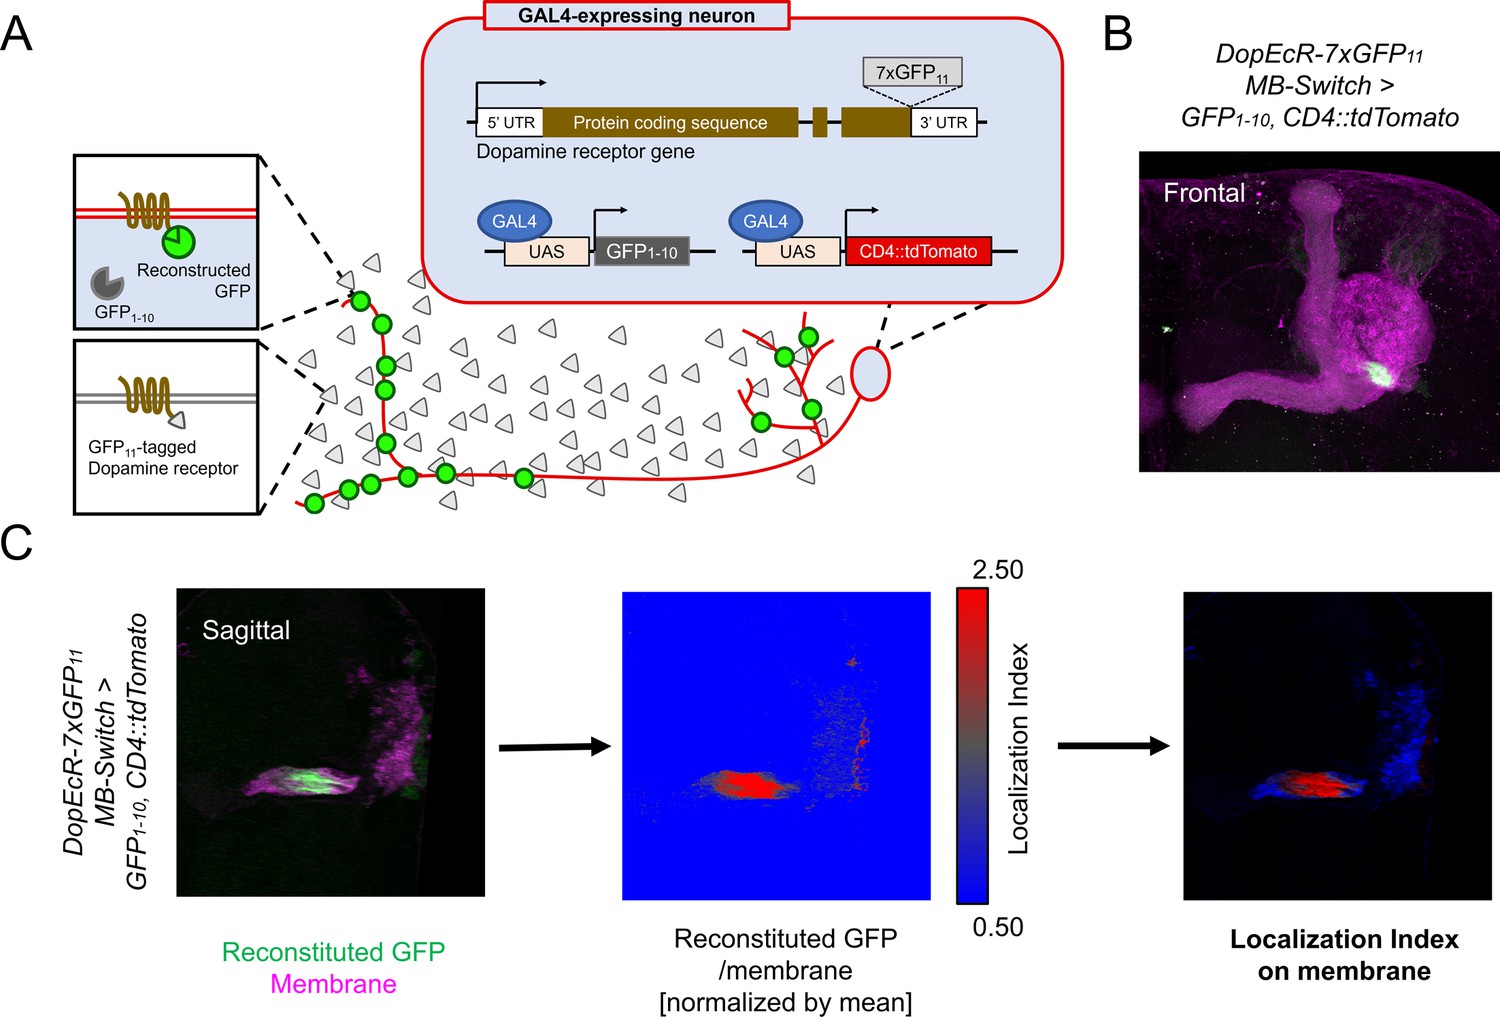
Cell-type-specific visualization of endogenous proteins with GFP11 tag.
(A) Principle of cell-type-specific fluorescent labeling of target proteins by GFP11 tag. Seven copies of GFP11 are fused to the C-terminal of endogenous receptors. GFP1-10 and membrane marker CD4::tdTomato are expressed in the target cells by GAL4/UAS system. In the target cells, reconstitution of GFP occurs on the endogenous proteins tagged with GFP11. (B) As an example, DopEcR::GFP11 is visualized in Kenyon cells (KCs) using MB-Switch, a ligand-inducible GAL4 driver. To activate Gene-Switch, flies were fed with food containing 200 µM RU486 for 12 hr before dissection. A merged image of reconstituted GFP (green) and cellular membrane visualized by CD4::tdTomato (magenta). Maximum-intensity projection of the whole left mushroom bodies (MB). (C) The workflow for visualizing subcellular protein enrichment by localization index (LI). A single sagittal section of the MB calyx and peduncle is shown. The ratio of reconstituted GFP to membrane signal is calculated and normalized by the mean of all voxels to provide LI. In the middle image, LI is color-coded so that red represents local receptor enrichment. In the right image, the intensity of LI color is adjusted based on the membrane signal.
Figure 2—figure supplement 1

GFP11 tagging on Dop1R1 and Dop2R do not affect aversive olfactory memory.
To test the functionality of the knock-in alleles, memory of flies carrying homozygous 7xGFP11-tagged Dop1R1 and Dop2R were compared with those without GFP11 tags. To induce reconstitution of GFP in Kenyon cells, GFP1-10 was expressed under the control of MB-Switch. To activate Gene-Switch, flies were fed with RU486 for 3 days before training. Box plots represent the median as the center line, the upper and lower quartiles as the box boundaries, the minimum and maximum values as the whiskers. Dunn’s test was performed (N = 9–12). ns: not significant p>0.05.
Figure 3 with 1 supplement
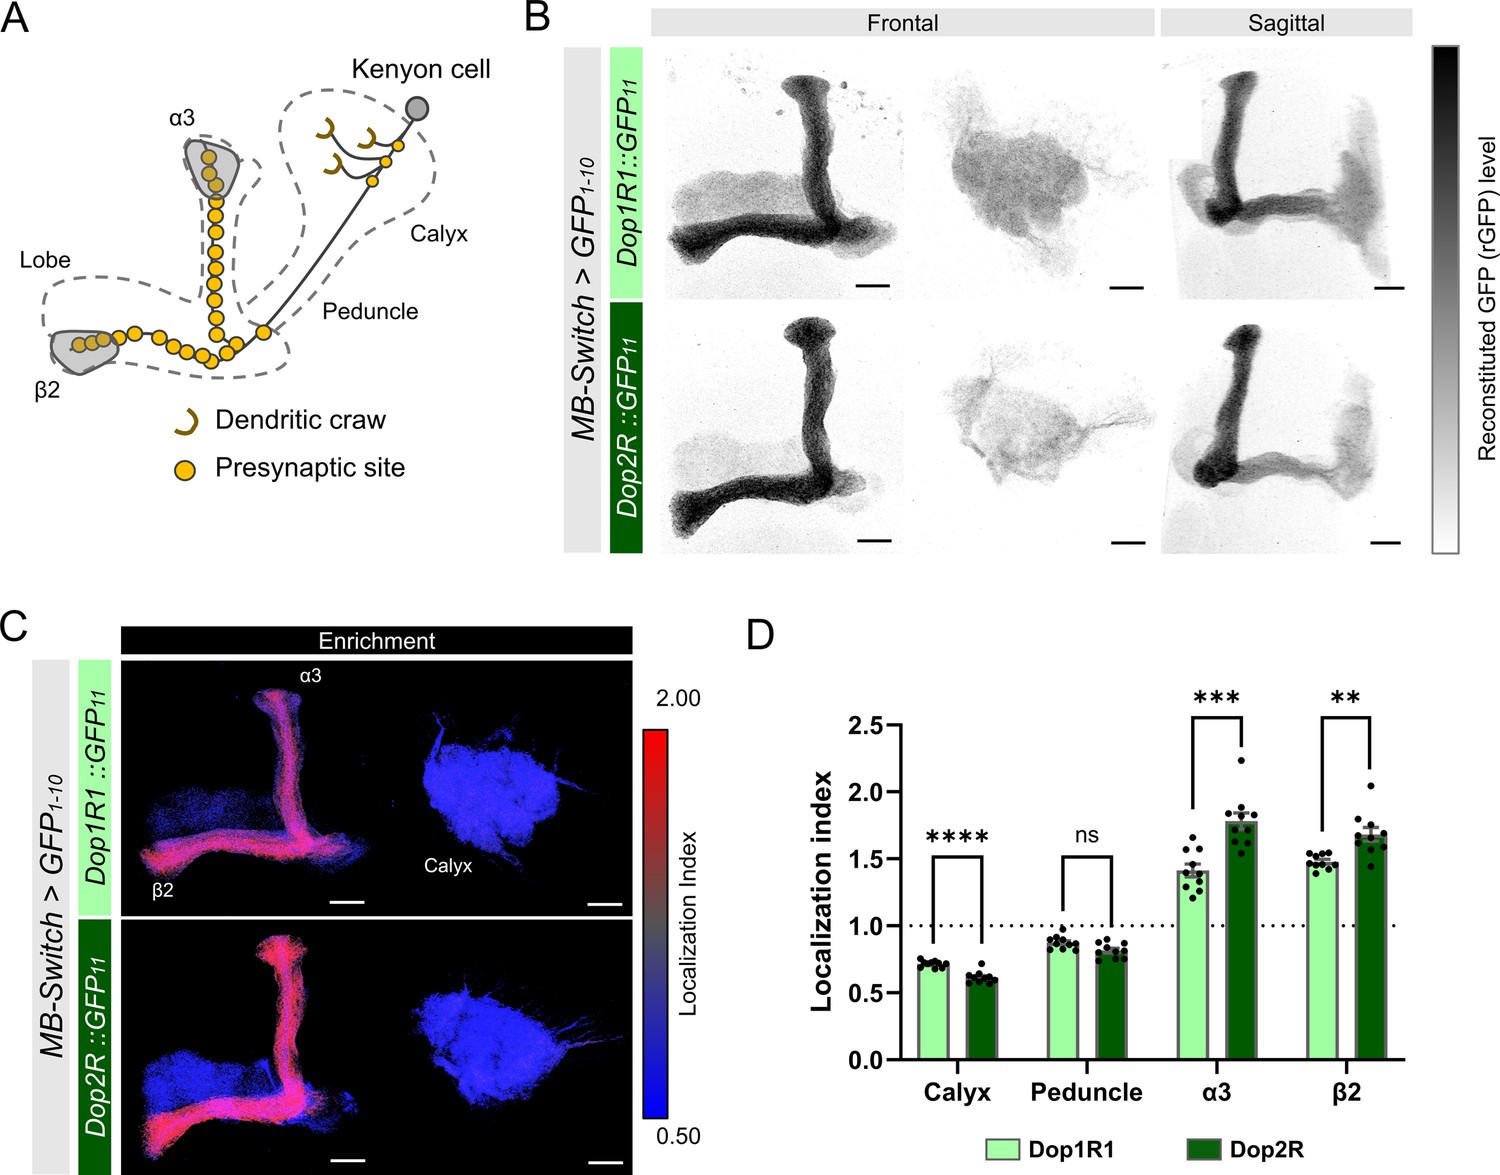
Subcellular localization of Dop1R1 and Dop2R in the Kenyon cells (KCs).
Subcellular localization of Dop1R1 and Dop2R in the KCs is visualized by GFP11 tag. MB-Switch was used to express GFP1-10 and CD4::tdTomato in the KCs. To activate Gene-Switch, flies were fed with food containing 200 µM RU486 for 72 hr before dissection. (A) Schematic showing the projection pattern of an α/β KC. (B) Enrichment of Dop1R1 and Dop2R in the mushroom bodies (MB) lobe. Maximum-intensity projections of the lobe (left) and the calyx (middle) are shown in frontal view. The whole left MB are shown in sagittal view (right). Reconstituted GFP signals for both Dop1R1:: and Dop2R::GFP11 distributed throughout the MB lobe and the calyx. (C) Visualization by localization index (LI) showed more pronounced enrichment of Dop2R than Dop1R1 in the lobe. (D) Mean LI of Dop1R1 and Dop2R in the calyx, the peduncle, the α3 and β2 compartment in the lobe. Student’s t-test was performed to compare LI of Dop1R1 and Dop2R in each region (N = 10). Error bars; SEM. p>0.05, **p<0.01, ***p<0.001, ****p<0.0001, ns: not significant p>0.05. Scale bars, 20 µm (B and C).
Figure 3—figure supplement 1
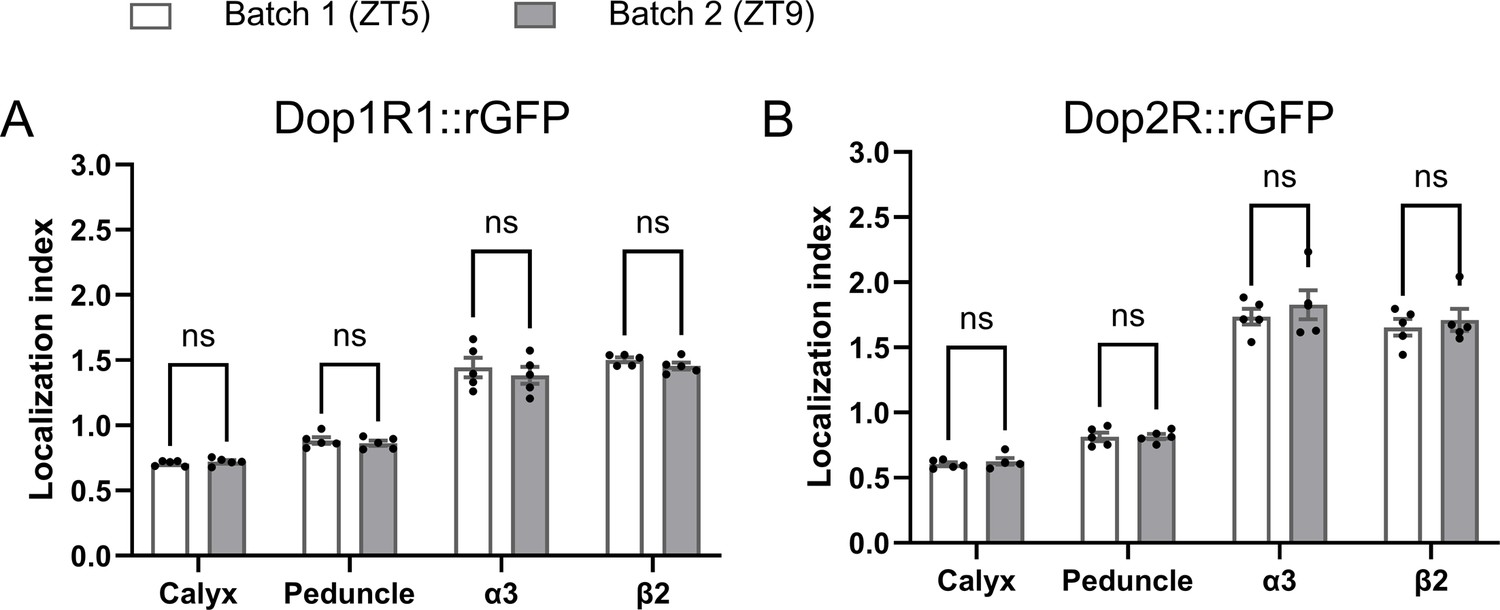
Localization index (LI) remains stable across different experimental batches.
Two experimental batches showed consistent LI for both Dop1R1::GFP11 and Dop2R::GFP11 measured in any region in the mushroom bodies (MB). These two batches were conducted on different days and at different times (zeitgeber time 5 and 9). The same dataset was used in Figure 3D. Student’s t-test was performed to compare the two batches (N = 5). Bars and error bars represent mean and SEM, respectively. ns: not significant p>0.05.
Figure 4
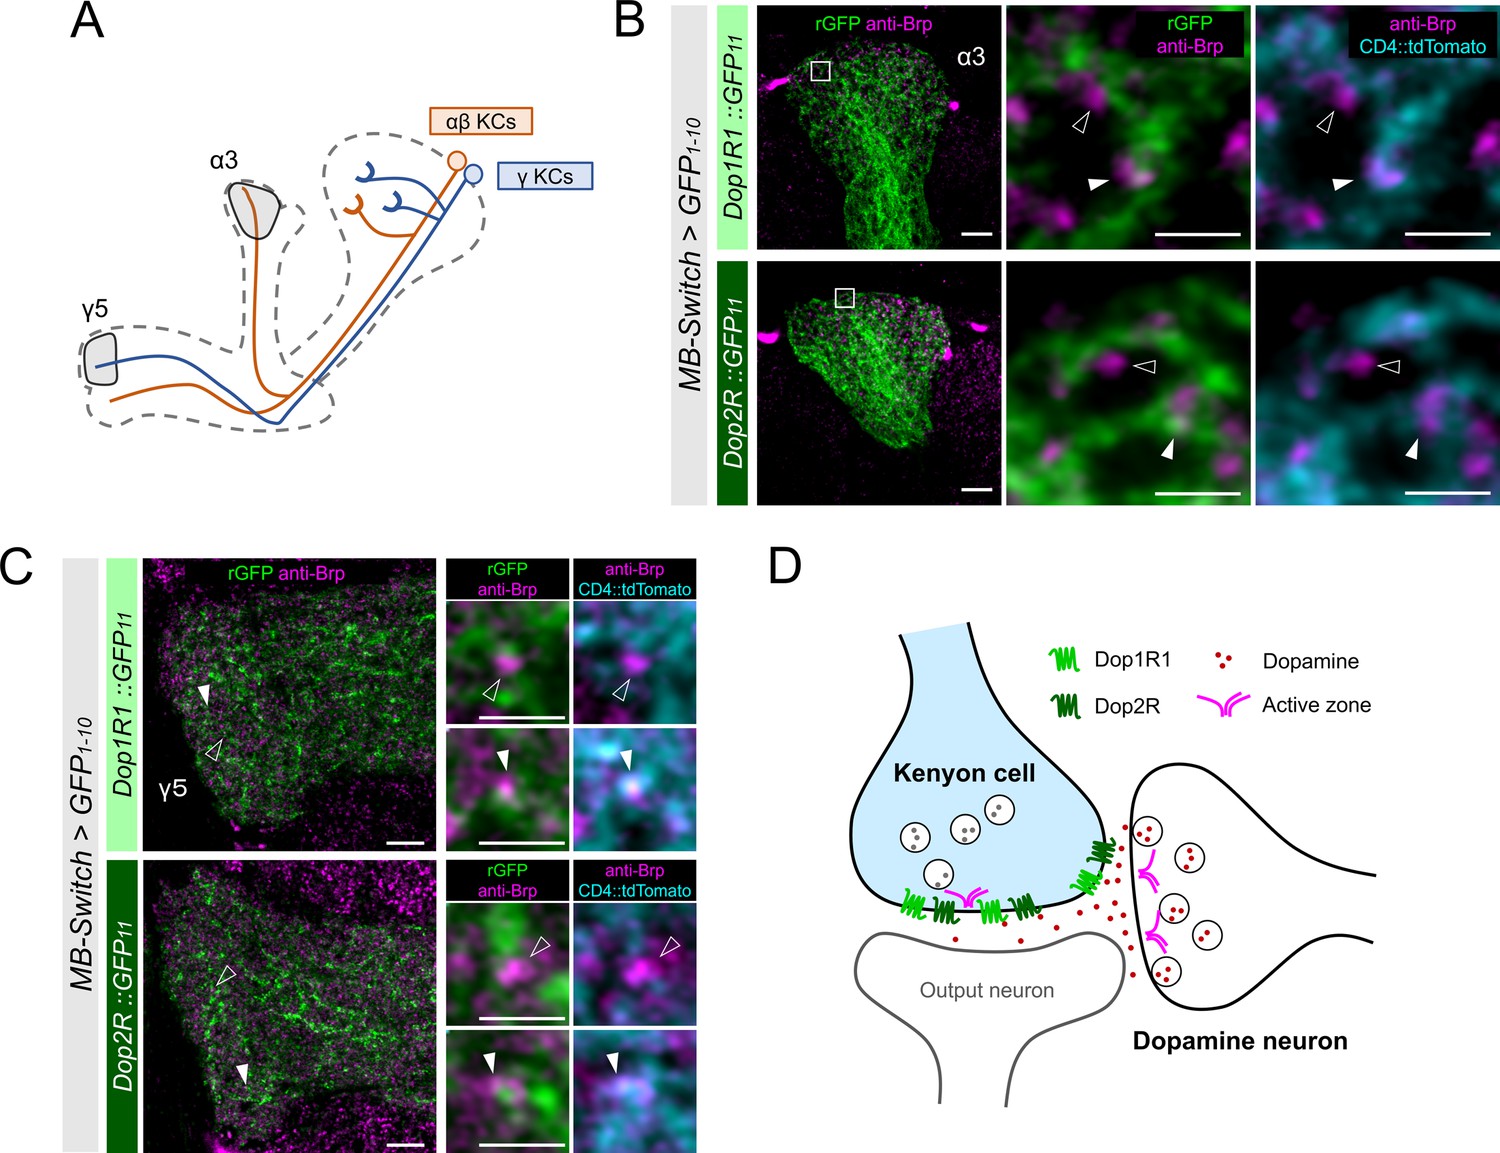
High-resolution imaging revealed the two opposing dopamine receptors existing on the presynaptic and postsynaptic sites of Kenyon cells (KCs).
(A) Schematic showing the projection pattern of α/β and γ KCs. (B and C) Airyscan images of Dop1R1::rGFP and Dop2R::rGFP in KCs (green) co-labeled with the active zones (AZ) stained with anti-Brp (magenta). MB-Switch was used with 72 hr of RU486 feeding to express GFP1-10 and CD4::tdTomato in the KCs. Brp puncta that overlap with CD4::tdTomato signals (cyan) are identified to be presynaptic sites of in KCs (white arrowheads), and those do not overlap are determined to be presynaptic sites of non-KCs (outlined arrows). The synaptic localization of these receptors is similar in the α3 (B) and γ5 (C) compartments. In the right panels, white squared regions in the left panels are magnified. Scale bars, 5 µm (left), 1 µm (right). (D) Illustration of localization of Dop1R1 and Dop2R to presynaptic and postsynaptic sites in the axon terminal of KCs.
Figure 5 with 1 supplement
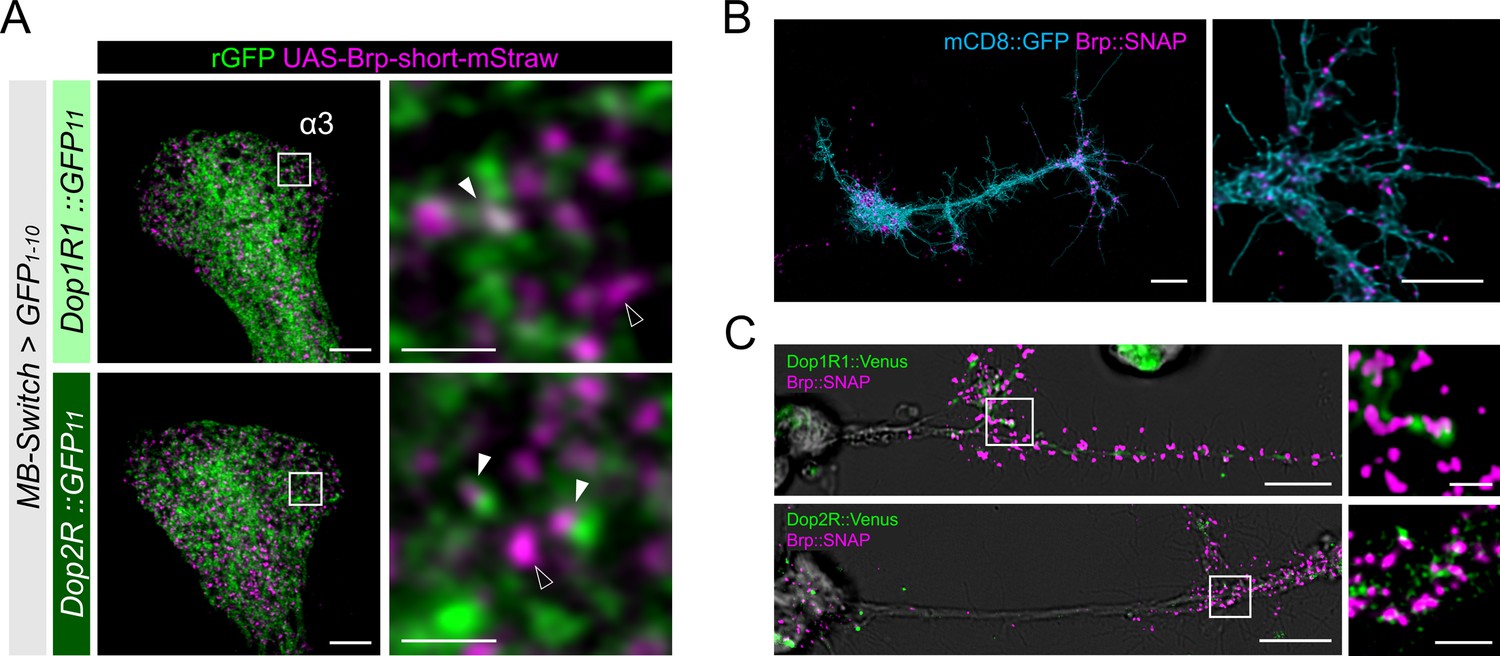
Presynaptic localization of Dop1R1 and Dop2R in Kenyon cells (KCs) and giant neurons.
(A) Double labeling of dopamine receptors (green) and the active zones (AZ) of the KCs (magenta). MB-Switch was used with 72 hr of RU486 feeding to express GFP1-10 and Brpshort::mStraw in the KCs. Single focal slices at the α3 compartment are shown. White squares in the left panels are magnified in the right panels. The Brp puncta in KCs were either abutted by the dopamine receptor signals (white arrowheads) or had barely detectable signals nearby (outlined arrowheads). Scale bars, 5 μm (left), 1 μm (right). (B) Punctate Brp expression in a giant neuron culture differentiated from cytokinesis-arrested neuroblasts of OK371-GAL4/UAS-mCD8::GFP embryos. Aggregated Brp condensates (magenta) were observed in the neurite terminals of the cells marked with mCD8::GFP (cyan) in the right panel. Scale bars, 20 µm (left), 10 μm (right). (C) Double labeling of dopamine receptors (green) and the AZs (magenta). Dop1R1::Venus or Dop2R::Venus was crossed with Brp::SNAP. In the left panels, giant neurons extending their neurites from the cell body on the left to the right. In the right panels, white squared regions in the left panels are magnified. Scale bars, 10 μm (left), 2 μm (right).
Figure 5—figure supplement 1
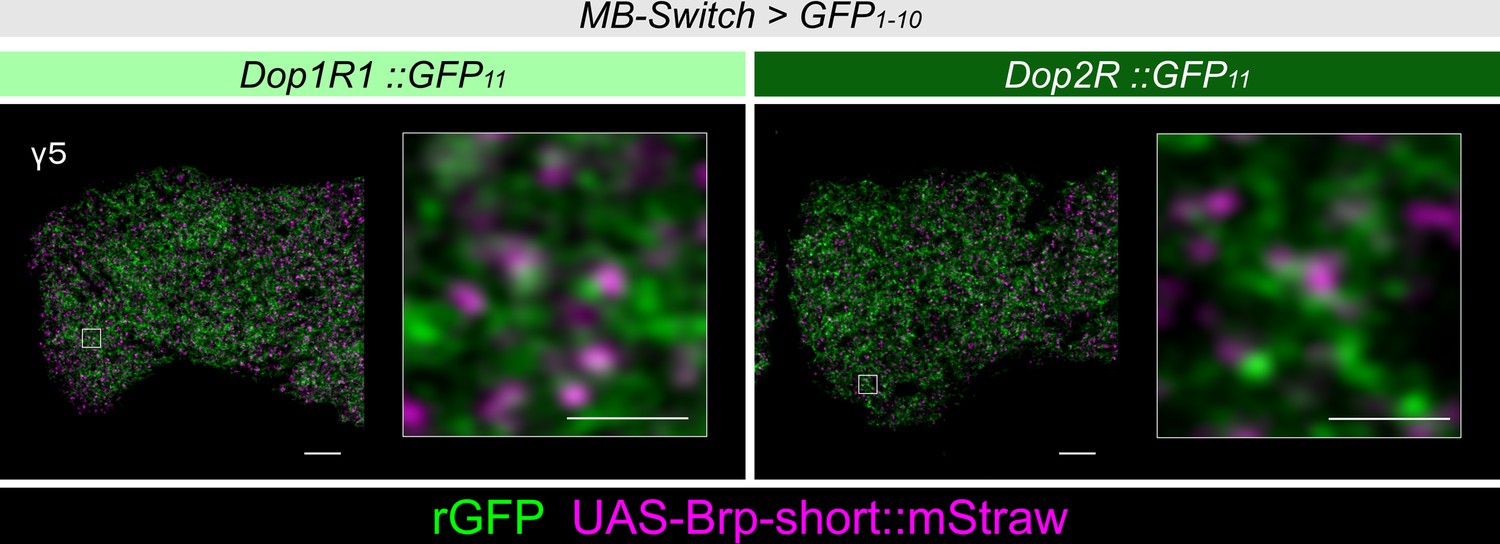
Presynaptic localization of Dop1R1 and Dop2R in γ Kenyon cells (KCs).
Double labeling of dopamine receptors (green) and the active zones (AZ) of the KCs (magenta). As in the α3 compartment (Figure 5A), both Dop1R1 and Dop2R were found near the AZ of KCs in the γ5 compartment. Scale bars, 5 μm (left), 1 μm (right).
Figure 6
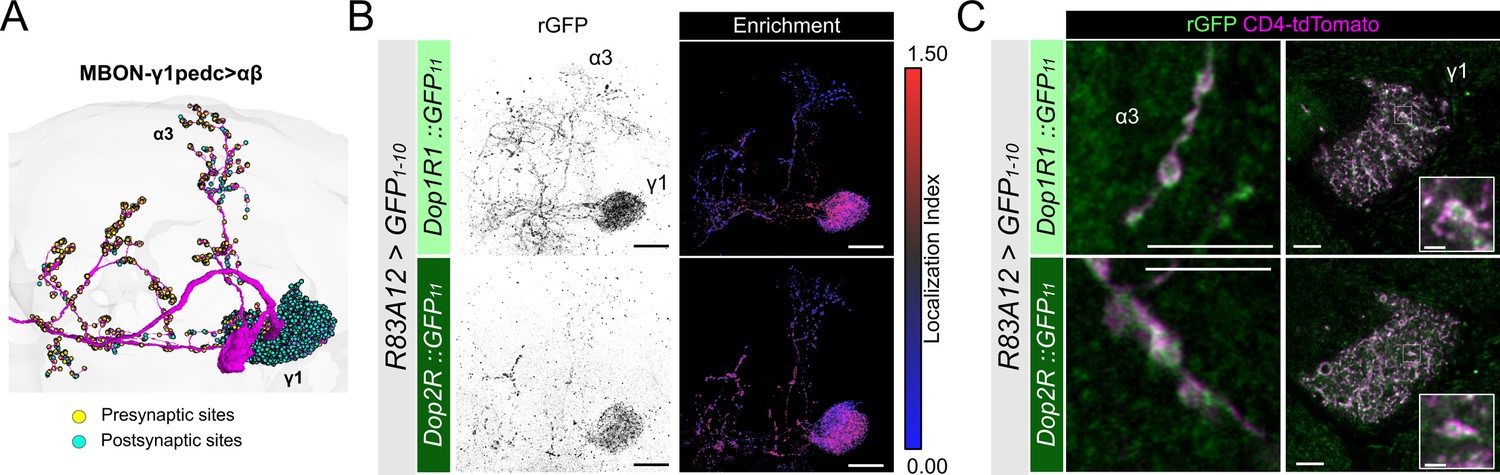
Subcellular localization of Dop1R1 and Dop2R in MBON-γ1pedc>αβ.
(A) The projection pattern of MBON-γ1pedc>αβ from the tracing data in FlyWire (Dorkenwald et al., 2023; Schlegel et al., 2024). (B and C) R83A12-GAL4 was used to express UAS-GFP1-10 and UAS-CD4::tdTomato in the protocerebral anterior medial (PAM) neurons. (B) Reconstituted GFP signals (left) of Dop1R1::GFP11 and Dop2R::GFP11 in MBON-γ1pedc>αβ. Maximum-intensity projections of the left mushroom bodies (MB) lobe. Visualization of localization index (LI) (right) revealing that both Dop1R1 and Dop2R are enriched in the dendritic projection of MBON-γ1pedc>αβ in the γ1 compartment as well as in the presynaptic boutons. (C) Airyscan images of the presynaptic boutons around α3 (left) and dendritic projections in the γ1 compartment (right). White squares in the right panels are magnified in the insertion to show the swelling membrane structures with punctate localization of dopamine receptors. Scale bars, 20 µm (B), 5 µm (C), 1 µm (C, insertion).
Figure 7
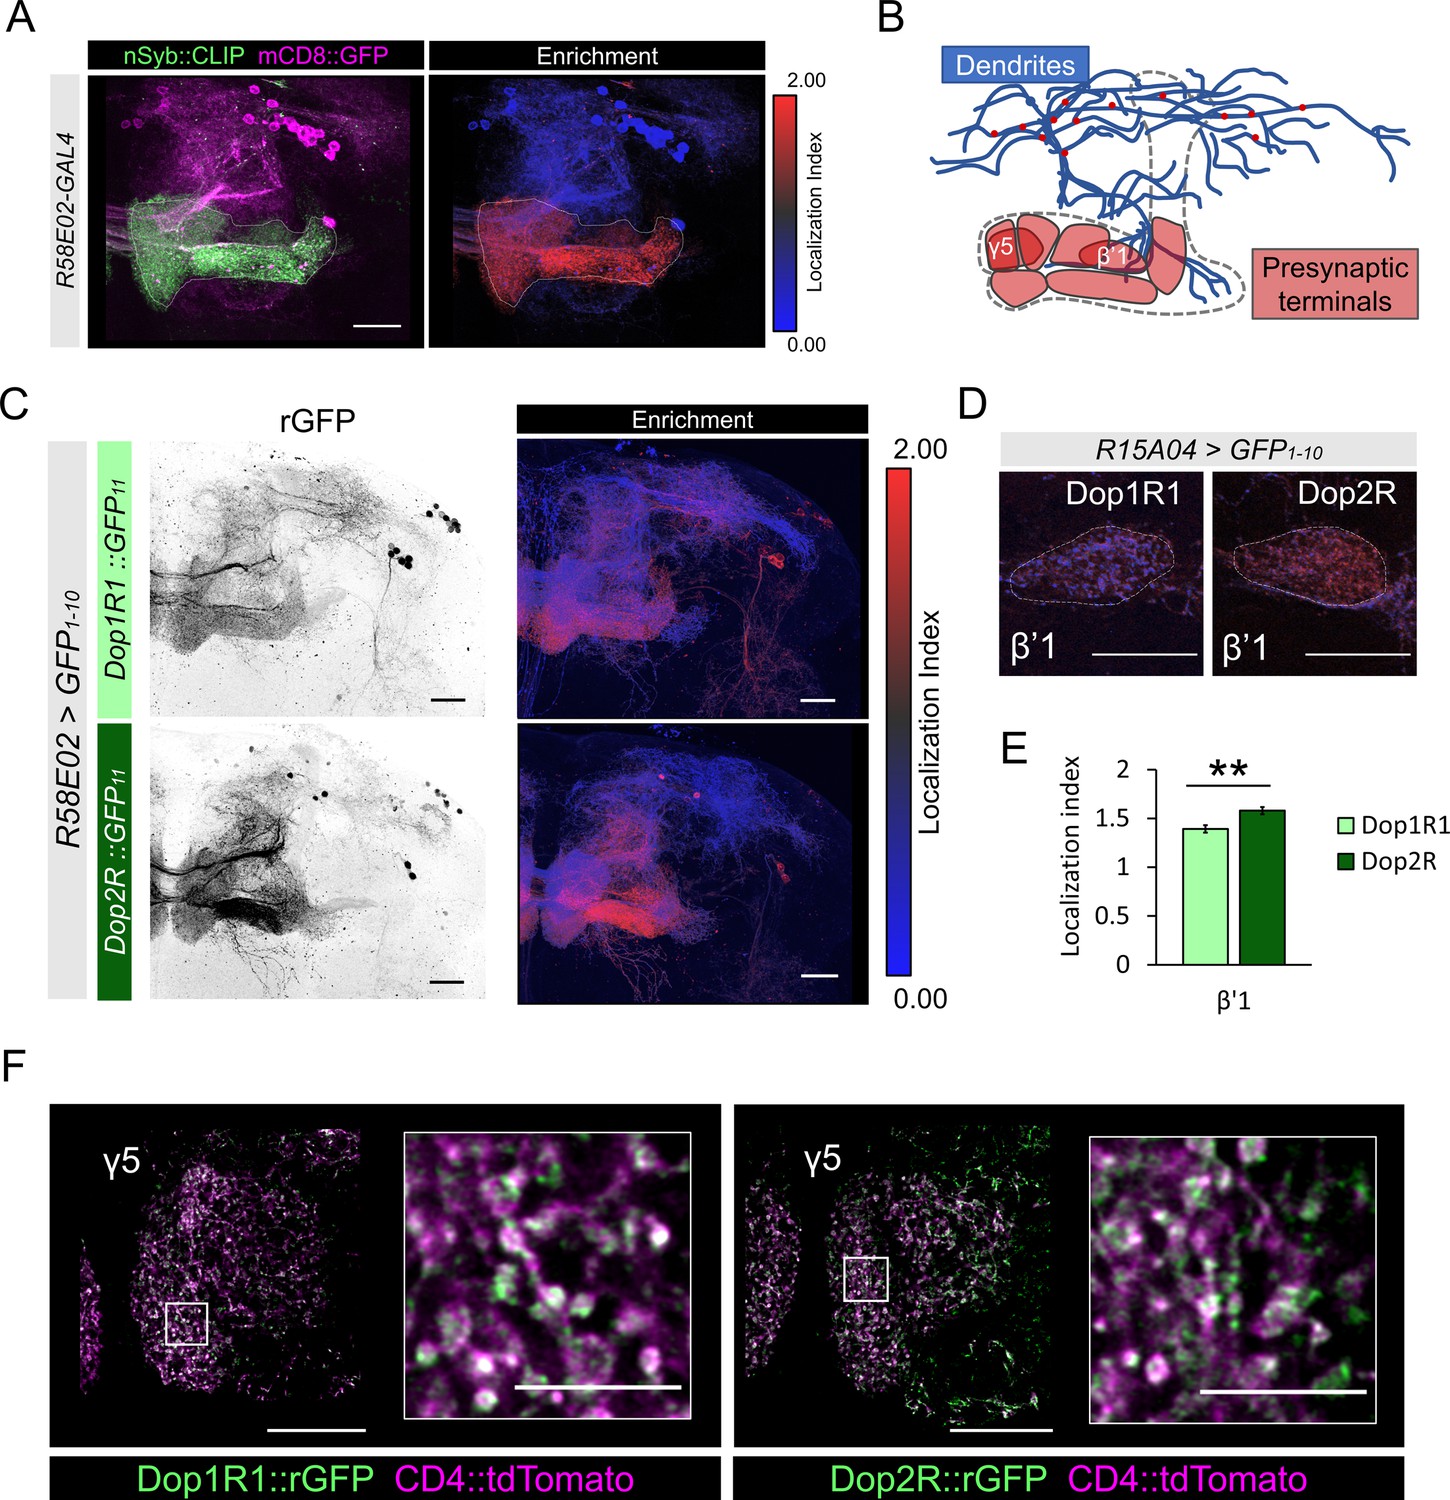
Subcellular localization of Dop1R1 and Dop2R in dopamine neurons.
(A) Maximum-intensity projection image showing the distribution of presynaptic sites in the protocerebral anterior medial (PAM) neurons. Left panel: R58E02-GAL4 was used to express mCD8::GFP (magenta) and nSyb::CLIP (magenta). Right panel: Visualization by localization index (LI) showing enrichment of nSyb signals in the lobe projection of the PAM neurons. (B) Illustrated projection pattern of the PAM neurons. Red puncta on the dendrites indicate the sparse distribution of presynaptic sites in dendrites. (C–F) Subcellular localization of GFP11-tagged Dop1R1 and Dop2R in the PAM neurons. R58E02-GAL4 (C and F) or R15A04-GAL4 (D and E) was used to express UAS-GFP1-10 and UAS-CD4::tdTomato in the PAM neurons. (C) Reconstituted GFP signals of Dop1R1::GFP11 and Dop2R::GFP11 in PAM neurons (left). LI visualization revealed the stronger presynaptic enrichment of Dop2R than that of Dop1R1 (right). Maximum-intensity projections of the left hemisphere including the whole mushroom bodies (MB) lobe and dendritic projections of the PAM neurons around the MB. (D and E) LI in PAM-β’1 neuron. (D) The presynaptic terminals of PAM-β’1 neurons are shown (dashed line). (E) Mean LI for Dop1R1 and Dop2R in the β’1 (Mann-Whitney U test, N = 9). Error bars; SEM. (F) A single optical slice of the γ5 compartment in the MB lobe obtained using Airyscan. Merged image of reconstituted GFP (green) and CD4::tdTomato (magenta). Insertions are the magnified images of the presynaptic boutons of PAM-γ5 (white squares). Scale bars, 20 µm (A, C, D, and F), 5 µm (F, insertion).
Figure 8 with 1 supplement
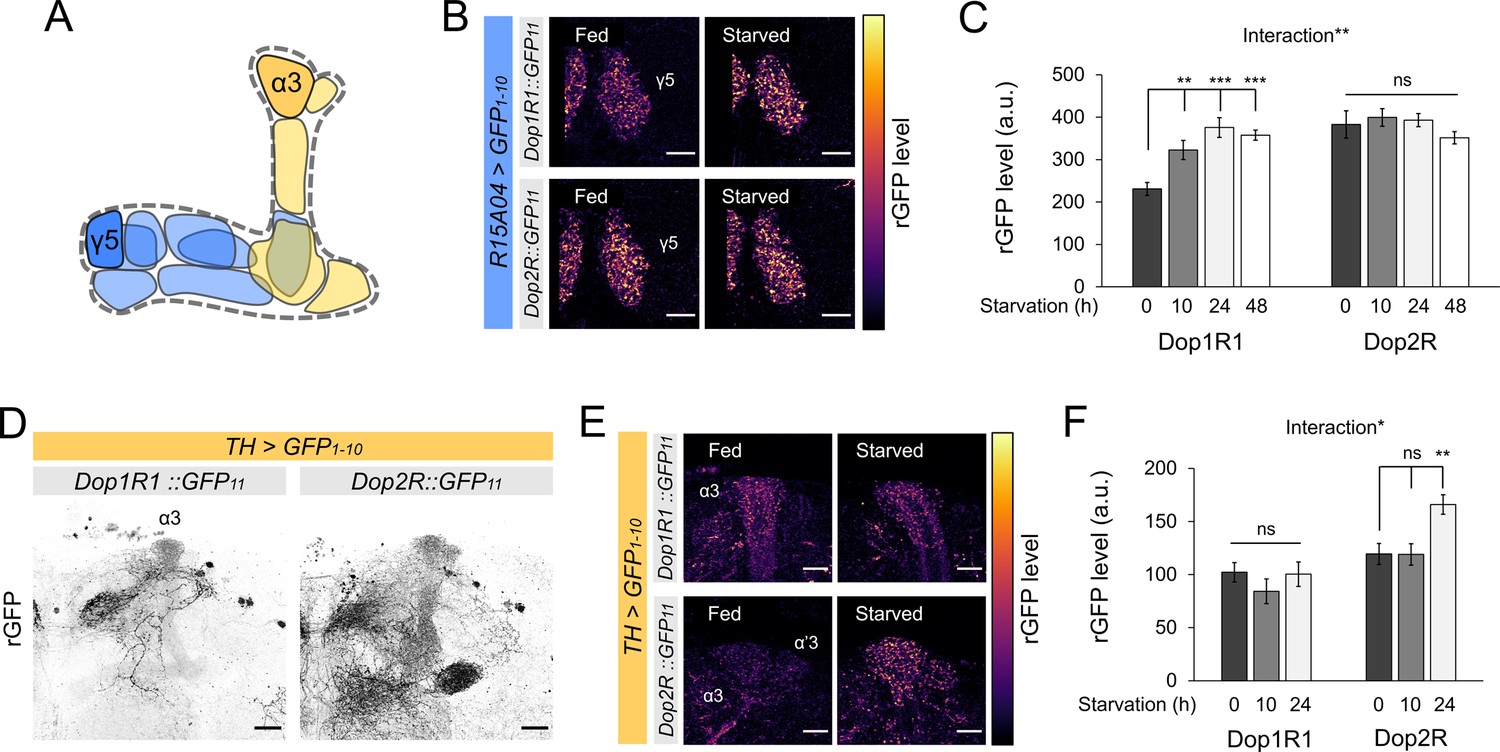
Bidirectional modification of dopamine receptor expression in dopamine neurons.
(A) Schematic illustration of the mushroom bodies (MB) projection of the protocerebral anterior medial (PAM) and posterior lateral 1 (PPL1) dopamine neurons. (B) Dop1R and Dop2R in the presynaptic terminals of PAM-γ5 after 48 hr of starvation compared with fed state. (C) Quantification of reconstituted GFP (rGFP) signal levels in the presynaptic terminals of PAM-γ5 after 0, 10, 24, and 48 hr of starvation (n = 6–13). (D) Reconstituted GFP signals of Dop1R1::GFP11 and Dop2R::GFP11 in the PPL1 neurons. In the MB projections of the PPL1 neurons, Dop1R1 was detected in only the α3 compartment. Dop2R was found in all MB projections. Maximum-intensity projections of the MB lobe. (E) Dop1R and Dop2R in the presynaptic terminals of PPL1-α3 after 24 hr of starvation compared with fed state. (F) Quantification of rGFP signal levels in the presynaptic terminals of PPL1-α3 after 0, 10, and 24 hr of starvation (n = 7–10). Scale bar, 10 µm (B and E), 20 µm (D). Interaction effects between genotypes and starvation time on protein levels were tested by two-way ANOVA (C and F). Bars and error bars represent mean and SEM, respectively (C and F). **p<0.01, ***p<0.001, ns: not significant p>0.05.
Figure 8—figure supplement 1
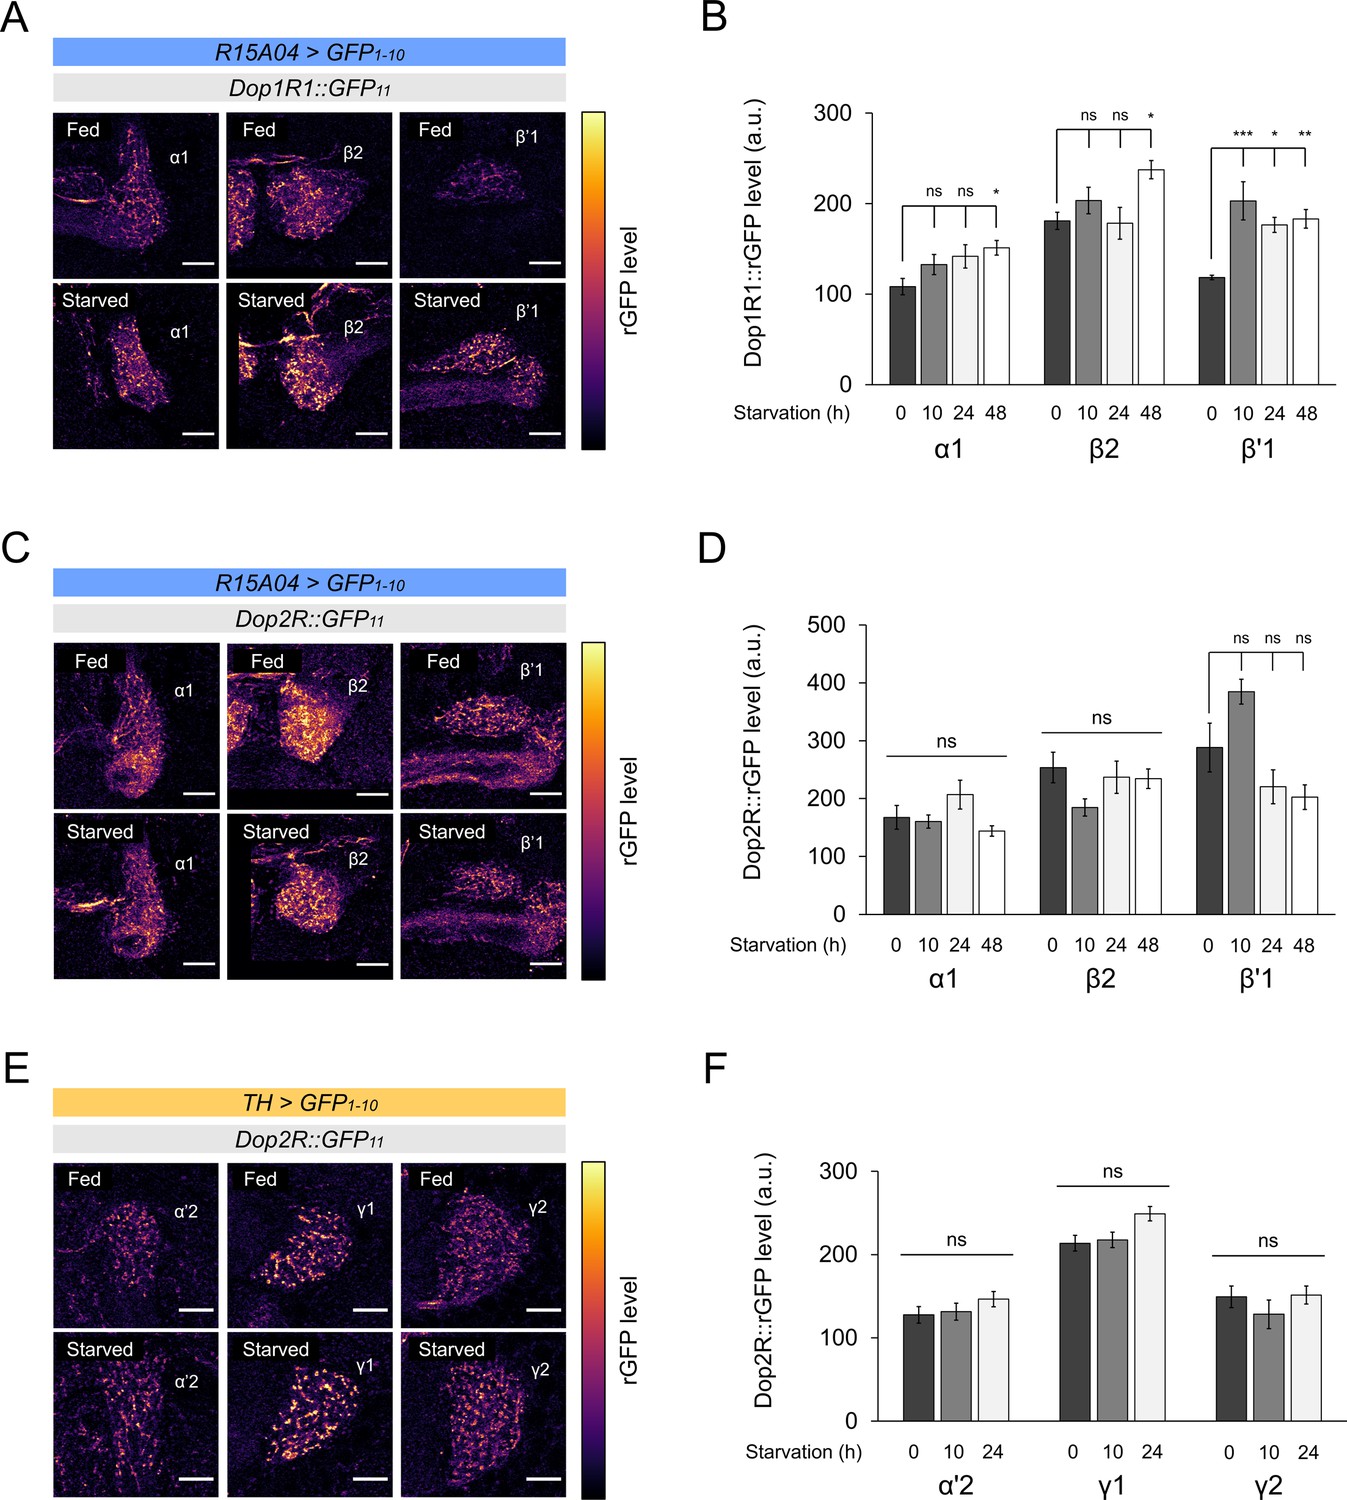
Starvation-dependent change of dopamine receptors in protocerebral anterior medial (PAM) and posterior lateral 1 (PPL1).
(A and C) Dop1R (A) and Dop2R (C) in the presynaptic terminals of PAM-α1, PAM-β2, and PAM-β’1 after 48 hr of starvation compared with fed state. (B and D) Quantification of dopamine receptor levels in the presynaptic terminals of the PAM neurons after 0 (fed), 10, 24, and 48 hr of starvation (n = 6–13). (E) Dop2R in the presynaptic terminals of PPL1-α’2, PPL1-γ1pedc, and PPL1-γ2 and after 24 hr of starvation compared with fed state. (F) Quantification of Dop2R levels in the presynaptic terminals of the PPL1 neurons after 0 (fed), 10, and 24 hr of starvation (n = 7–10). Scale bar, 10 µm (A, C, E). Bars and error bars represent mean and SEM, respectively (B, D, F). *p<0.05, **p<0.01, ***p<0.001, ns: not significant p>0.05.
Figure 9
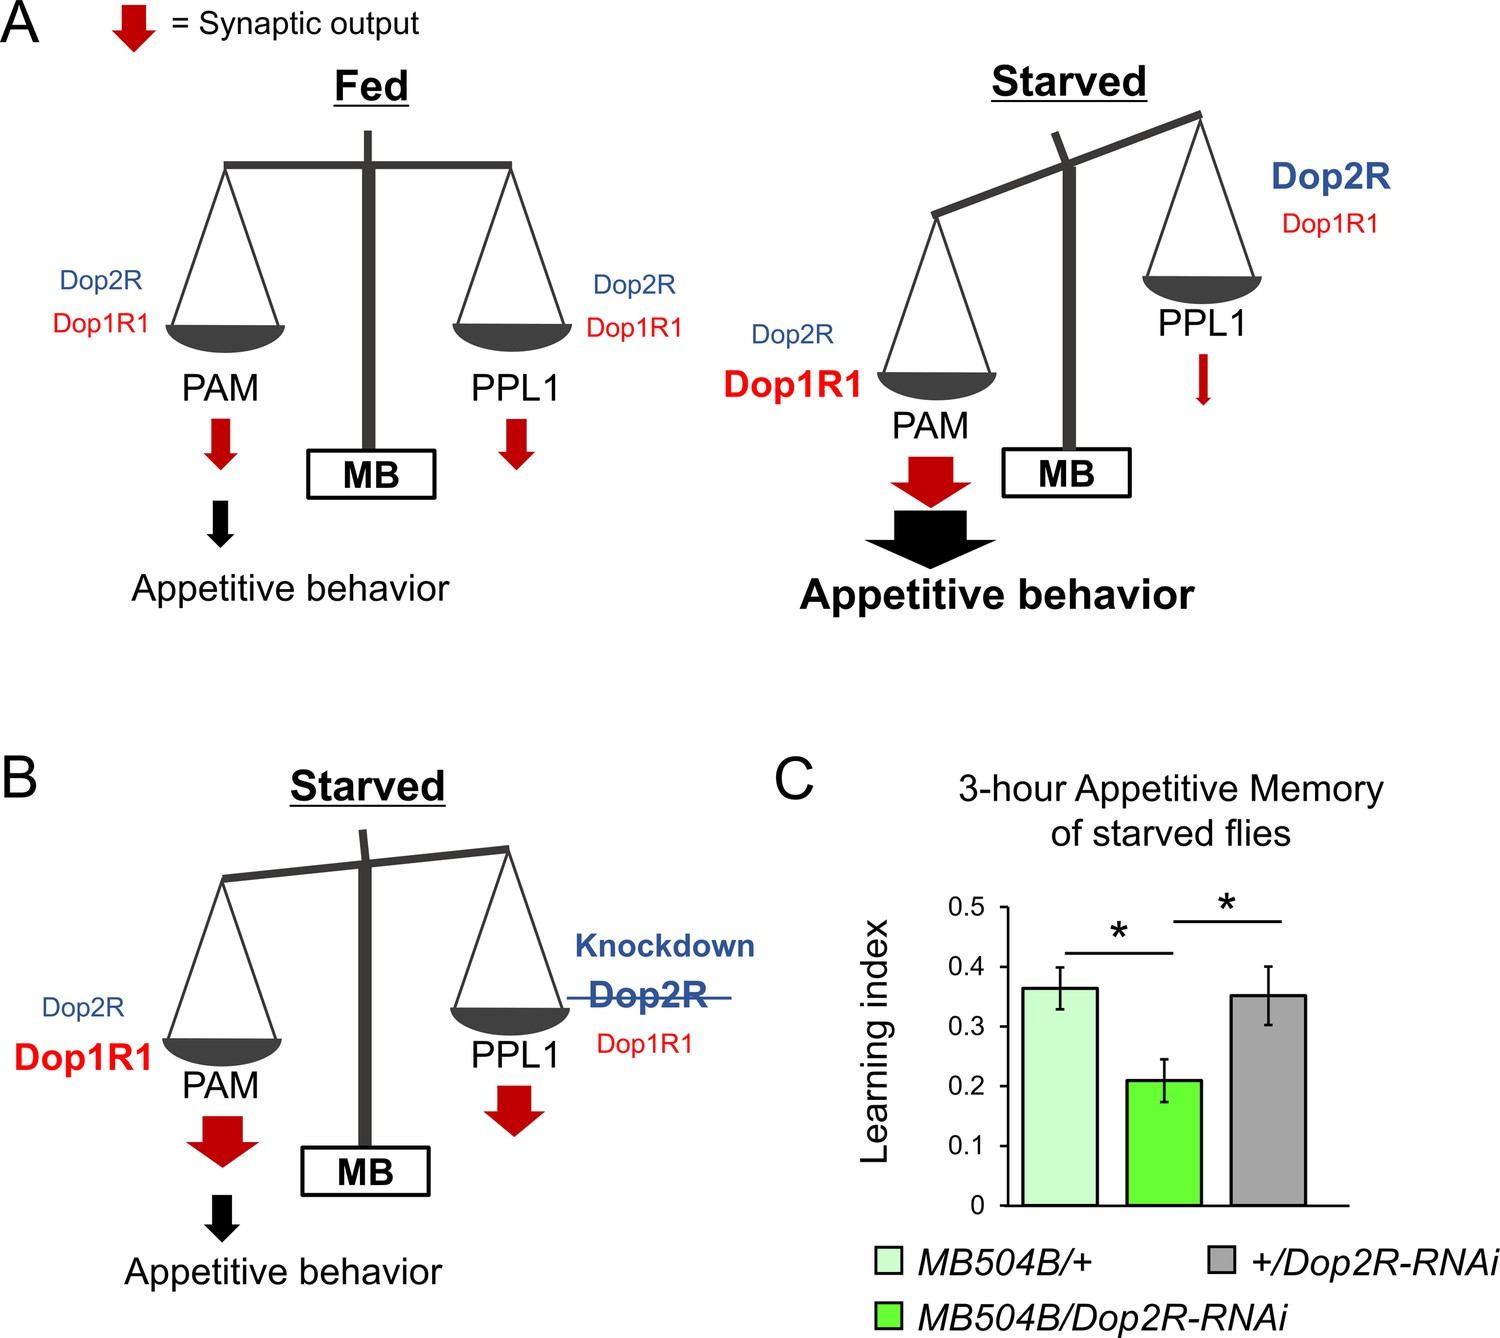
The dual dopaminergic feedback regulating starved state-dependent expression of appetitive behavior.
(A) A working model showing the role of the dual dopaminergic feedback regulation. In the starved state, increased Dop1R1 in protocerebral anterior medial (PAM) neurons and increased Dop2R in posterior lateral 1 (PPL1) neurons changes the balance between the synaptic outputs from these dopamine neurons (DANs) to favor appetitive behavior. (B) According to the model, loss of Dop2R in PPL1 upregulates output from PPL1 to attenuate appetitive behavior in starved flies. (C) Knockdown of Dop2R in the PPL1 neurons by MB504B-GAL4 reduced 3 hr appetitive memory performance (t-test with Bonferroni correction, n = 14–15). Bars and error bars represent mean and SEM, respectively. *p<0.05.
Author response image 1
Tables
Key resources table
| Reagent type (species) or resource | Designation | Source or reference | Identifiers | Additional information |
|---|---|---|---|---|
| Antibody | Mouse monoclonal anti-TH | ImmunoStar Inc, Hudson, WI, USA | #22941; RRID:AB_1267100 | IF(1:100) |
| Antibody | Mouse monoclonal anti-Brp | Developmental Studies Hybridoma Bank, Iowa city, IA, USA | nc82 | IF(1:40) |
| Antibody | Rabbit polyclonal anti-DsRed | Takara Bio USA, Inc, San Jose, CA, USA | #632496 | IF(1:2000) |
| Antibody | Goat polyclonal anti-mouse Alexa Fluor 405 | Invitrogen, Waltham, MA, USA | #A31553; RRID:AB_221604 | IF(1:1000) |
| Antibody | Goat polyclonal anti-mouse Alexa Fluor 633 | Invitrogen, Waltham, MA, USA | #A21052; RRID:AB_2535719 | IF(1:400 for anti-TH, 1:200 for anti-Brp) |
| Antibody | Goat polyclonal anti-rabbit Alexa Fluor 568 | Invitrogen, Waltham, MA, USA | #A11036; RRID:AB_10563566 | IF(1:1000) |
| Chemical compound, drug | SNAP-Cell 647-SiR | Ipswich, MA, USA | S9102S | |
| Chemical compound, drug | CLIP-Surface 547 substrate | New England Biolabs Inc, Ispwich, MA, USA | #S9233S | |
| Chemical compound, drug | RU486 (Mifepristone) | Tokyo Chemical Industry Co., Tokyo, Japan | #M1732 | |
| Genetic reagent (D. melanogaster) | Dop1R1-T2A-GAL4 | Kondo et al., 2020 | N/A | |
| Genetic reagent (D. melanogaster) | Dop2R-T2A-GAL4 | Kondo et al., 2020 | N/A | |
| Genetic reagent (D. melanogaster) | Dop1R1-T2A-LexA | Kondo et al., 2020 | N/A | |
| Genetic reagent (D. melanogaster) | Dop1R1::7xGFP11 | Kondo et al., 2020 | N/A | |
| Genetic reagent (D. melanogaster) | Dop2R::7xGFP11 | Kondo et al., 2020 | N/A | |
| Genetic reagent (D. melanogaster) | DopEcR::7xGFP11 | Kondo et al., 2020 | N/A | |
| Genetic reagent (D. melanogaster) | Dop1R1::Venus | Kondo et al., 2020 | N/A | |
| Genetic reagent (D. melanogaster) | Dop2R::Venus | Kondo et al., 2020 | N/A | |
| Genetic reagent (D. melanogaster) | UAS-GFP1-10 | Kondo et al., 2020 | N/A | |
| Genetic reagent (D. melanogaster) | UAS-mCD8::GFP | Pfeiffer et al., 2010 | BDSC #32194 | |
| Genetic reagent (D. melanogaster) | lexAop-rCD2::GFP | Miyamoto et al., 2012 | N/A | |
| Genetic reagent (D. melanogaster) | UAS-CD4::tdTomato | Han et al., 2011 | BDSC #35841 | |
| Genetic reagent (D. melanogaster) | UAS-nSyb::CLIP | Kohl et al., 2014 | BDSC #58398 | |
| Genetic reagent (D. melanogaster) | UAS-Brp-short::mStrawberry | Fouquet et al., 2009 | N/A | |
| Genetic reagent (D. melanogaster) | Brp::SNAP | Kohl et al., 2014 | BDSC #58397 | |
| Genetic reagent (D. melanogaster) | MB-Switch | Mao et al., 2004 | BDSC #81013 | |
| Genetic reagent (D. melanogaster) | OK371-GAL4 | Mahr and Aberle, 2006 | BDSC #26160 | |
| Genetic reagent (D. melanogaster) | R83A12-GAL4 | Jenett et al., 2012 | BDSC #40348 | |
| Genetic reagent (D. melanogaster) | R15A04-GA4 | Jenett et al., 2012 | BDSC #48671 | |
| Genetic reagent (D. melanogaster) | R58E02-GAL4 | Jenett et al., 2012 | BDSC #41347 | |
| Genetic reagent (D. melanogaster) | TH-GAL4 | Friggi-Grelin et al., 2003 | N/A | |
| Genetic reagent (D. melanogaster) | MB504B | Pfeiffer et al., 2010 | BDSC #68329 | |
| Genetic reagent (D. melanogaster) | UAS-Dop2R-RNAi | Perkins et al., 2015 | BDSC #50621 | |
| Software, algorithm | Fiji | Schindelin et al., 2012, http://fiji.sc | RRID:SCR_002285 | |
| Software, algorithm | GraphPad Prism 5 | GraphPad Software | RRID:SCR_002798 |
Additional files
Download links
A two-part list of links to download the article, or parts of the article, in various formats.
Downloads (link to download the article as PDF)
Open citations (links to open the citations from this article in various online reference manager services)
Cite this article (links to download the citations from this article in formats compatible with various reference manager tools)
Synaptic enrichment and dynamic regulation of the two opposing dopamine receptors within the same neurons
eLife 13:RP98358.
https://doi.org/10.7554/eLife.98358.3


