Cortical tracking of hierarchical rhythms orchestrates the multisensory processing of biological motion
- State Key Laboratory of Cognitive Science and Mental Health, Institute of Psychology, Chinese Academy of Sciences, China
- Department of Psychology, University of Chinese Academy of Sciences, China
Figures
Figure 1
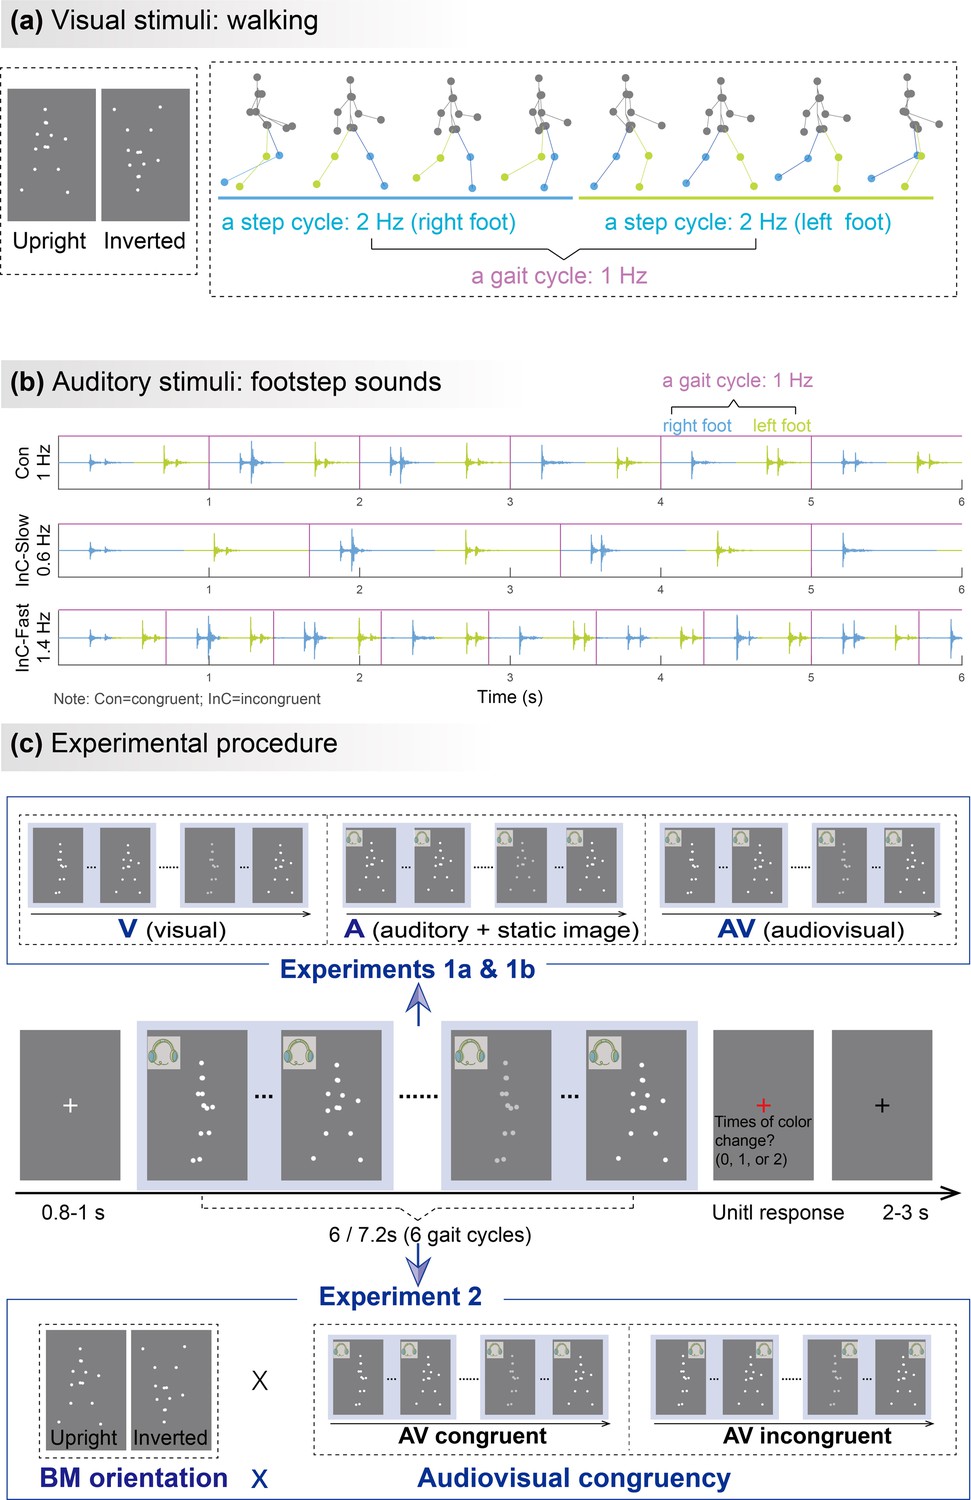
Illustrations of audiovisual stimuli and experimental procedures.
The illustration was based on stimuli with a gait-cycle frequency of 1Hz. (a) Visual stimuli. The left panel depicts the static schematic of upright and inverted point-light walkers. The right panel shows the keyframes from a gait cycle of the biological motion (BM) sequence. The colors of dots and lines between dots are for illustration only and are not shown in the experiments. (b) Auditory stimuli. The auditory sequences contain periodic impulses of footstep sounds whose peak amplitudes occur around the points when the foot strikes the ground. The duration of two successive impulses defines the gait cycle of footstep sounds, which is temporally congruent (Con) or incongruent (InC) with the visual stimuli. (c) Experimental procedure and design. The color of the visual stimuli changed one or two times within 6s in the catch trials but did not change in the experimental trials. Participants were required to report the number of changes when the point-light stimulus was replaced by a red fixation. In Experiment 1, participants viewed rhythmic point-light walkers or/and listened to the corresponding footstep sounds under visual (V),auditory (A),and audiovisual (AV) conditions. The visual stimulus was the BM sequence in the V and AV conditions but a static frame from the sequence in the A condition. Experiment 2 included only the AV condition with different stimulus orientations (upright vs. inverted) and audiovisual congruency (congruent vs. incongruent).
Figure 2 with 1 supplement
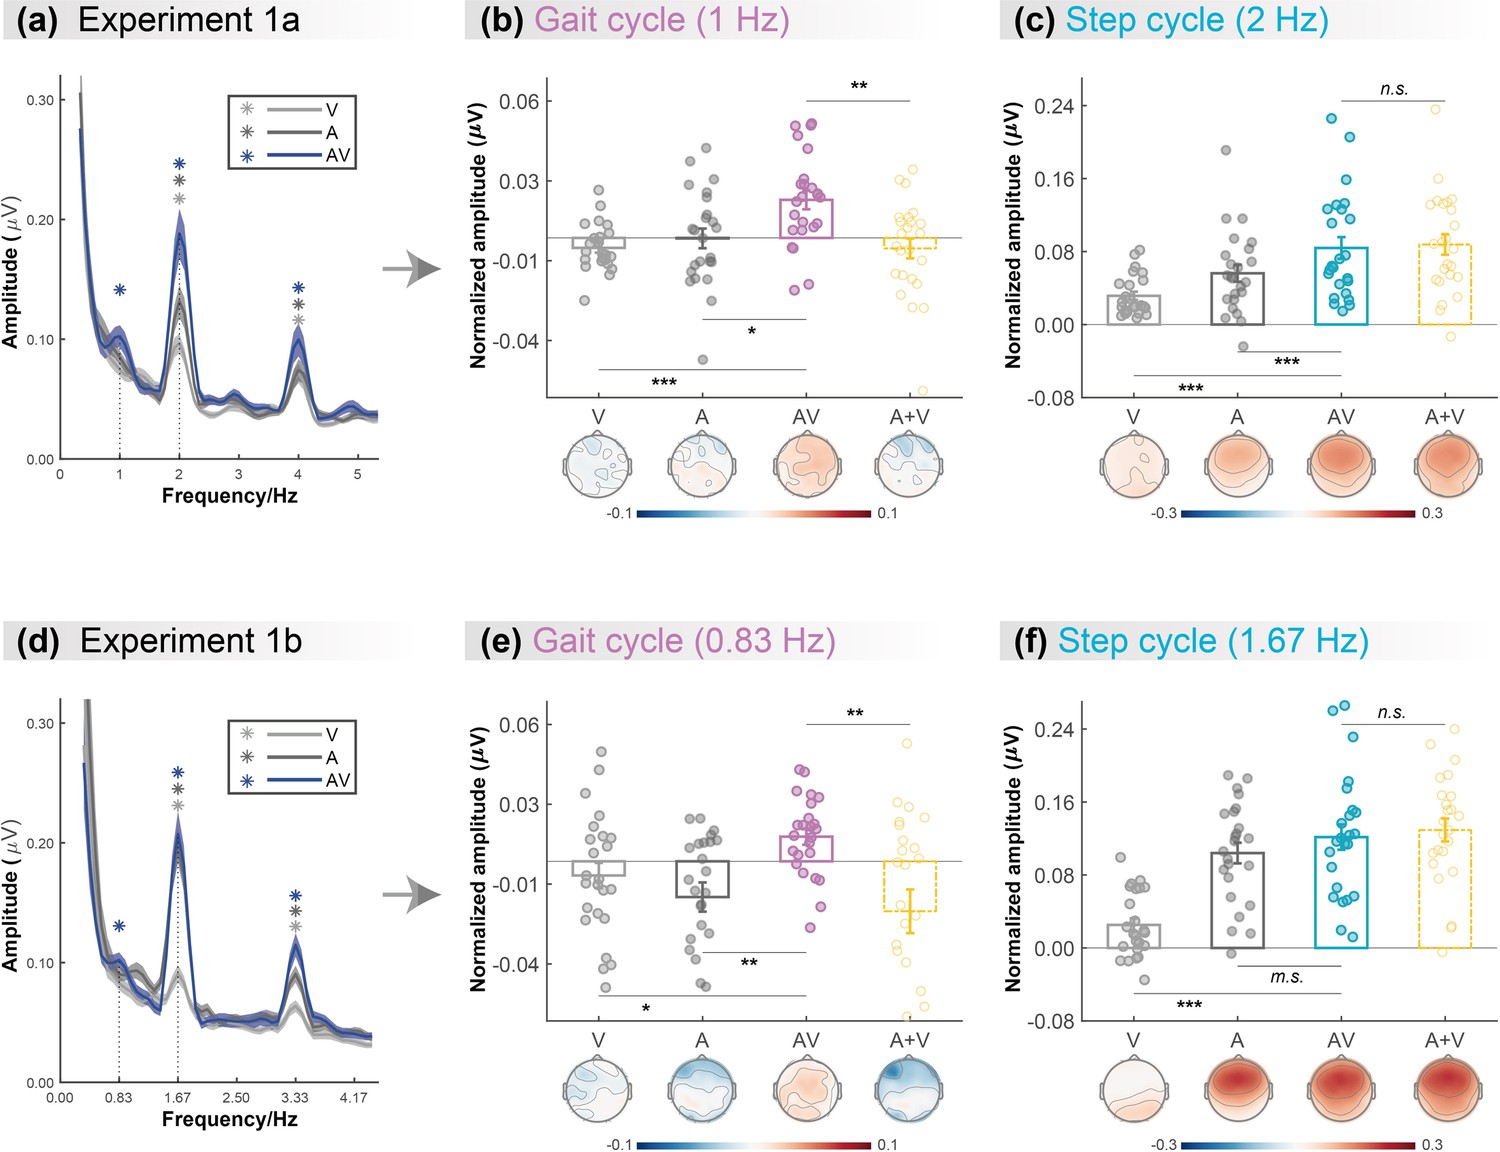
Cortical tracking of visual (V),auditory (A),and audiovisual (AV) biological motion (BM) signals at gait-cycle and step-cycle frequencies.
(a) and (d) The amplitude spectra of electroencephalogram (EEG) responses in three conditions in Experiment 1a and Experiment 1b, respectively. The solid lines show the grand average amplitude over all electrodes and subjects. The shaded regions depict standard errors of the group mean. Asterisks indicate significant spectra peaks (one-sample t-test against zero; p<0.05, FDR corrected). (b) and (e) The normalized amplitude at gait-cycle frequency in the AV condition exceeded the arithmetical sum of those in V and A conditions (AV>A +V, paired t-test), (c) and (f) but the normalized amplitude at step-cycle frequency in the AV condition was comparable to the sum of V and A (AV = A +V, paired t-test). Colored dots represent individual data in each condition. Error bars represent±1 standard error of means (N = 24). *: p<0.05; **: p<0.01; ***: p<0.001; m.s.: 0.05<p<0.10; n.s.: p>0.05.
Figure 2—figure supplement 1
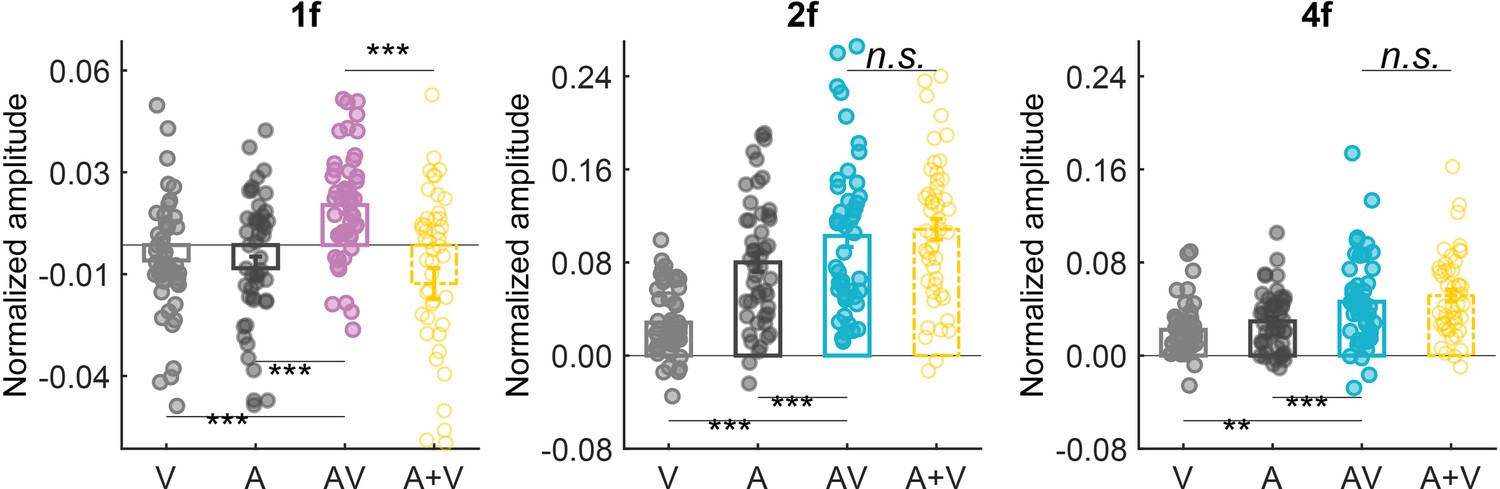
Cortical tracking of audiovisual biological motion (BM) information at different frequencies.
Colored dots represent individual data in each condition. Error bars represent±1 standard error of means. N=48 (24 in Experiment 1a and 24 in Experiment 1b). Paired t-test. *: p<0.05; **: p<0.01; ***: p<0.001; n.s.: p>0.05.
Figure 3 with 2 supplements
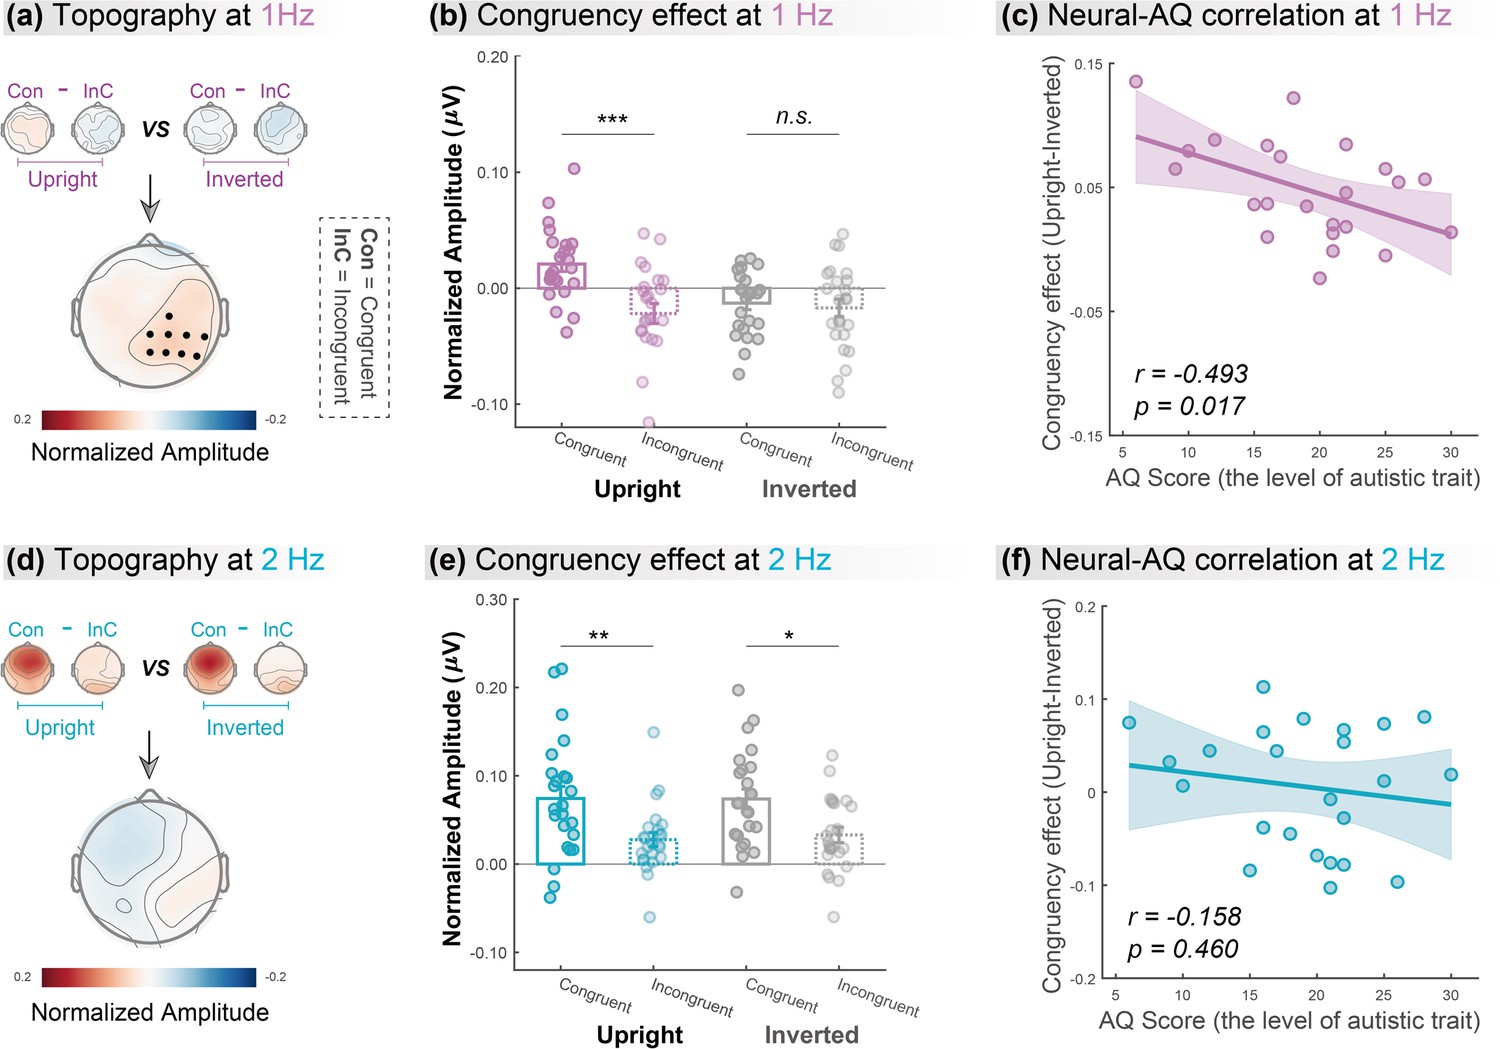
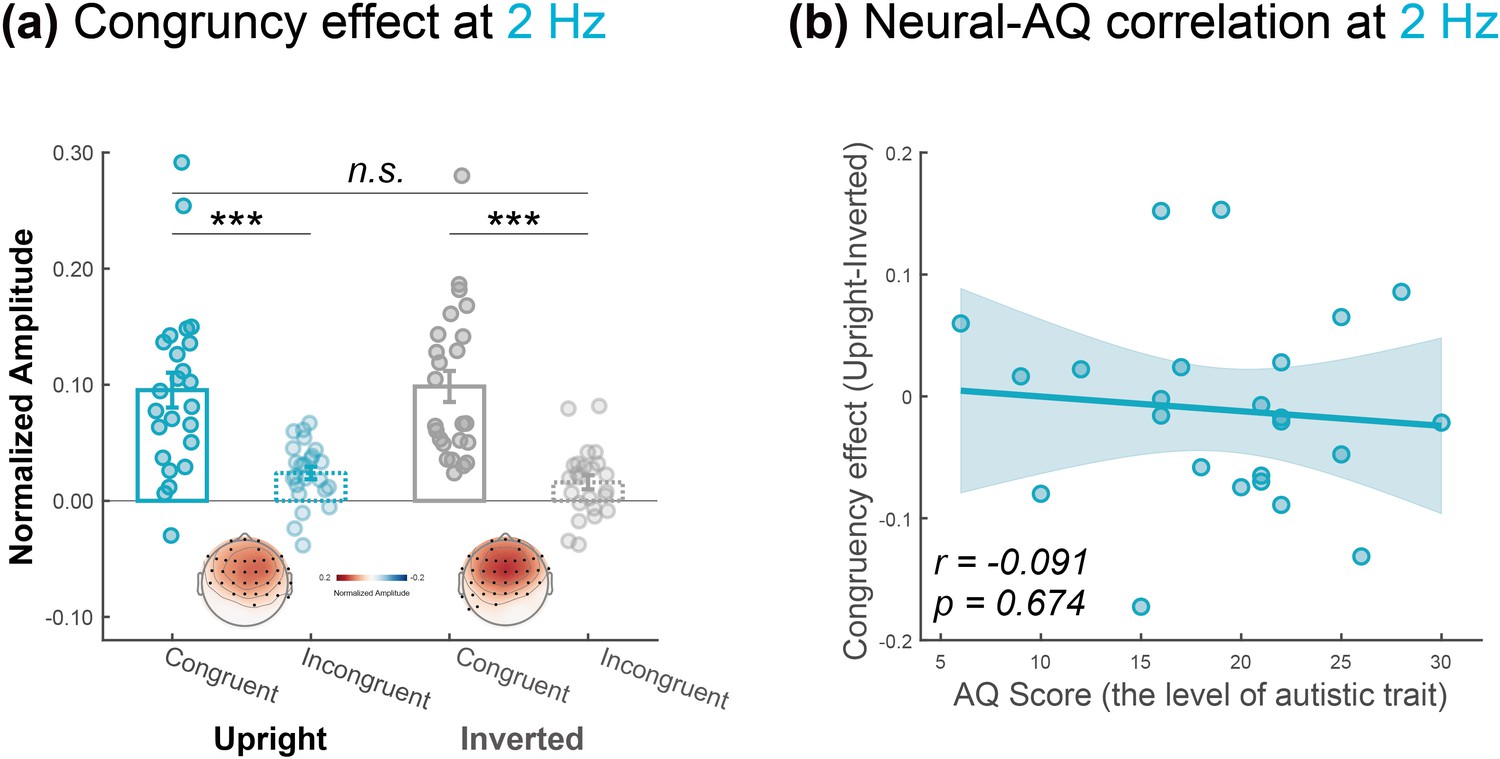
Cortical tracking at gait-cycle rather than step-cycle frequency contributes to the biological motion (BM)-specific audiovisual integration (AVI) effect.
The lower panels in (a) and (d) depict the topographic maps of the BM-specific AVI effect, measured by the difference of congruency effects between the upright and inverted conditions at 1Hz and 2Hz, respectively. A significantly enhanced congruency effect in the upright condition relative to the inverted condition was observed at 1Hz (marked by black dots) but not at 2Hz (cluster-based permutation test; n = 1000, alpha = 0.05). The amplitude at these significant electrodes was averaged to quantify the congruency effect for the upright and inverted conditions at 1Hz (b) and 2Hz (e). Error bars represent±1 standard error of means. N = 24. Paired t-test. *: p<0.05; **: p<0.01; ***: p<0.001; n.s.: p>0.05. Individuals’ autistic traits correlated with the BM-specific AVI effect at 1Hz (c) but not at 2Hz (f). Shaded regions indicate the 95% confidence intervals.
Figure 3—figure supplement 1
Control analysis at step-cycle frequency.
(a) The amplitude at the electrodes marked by solid black dots was averaged to quantify the cortical tracking effect at 2 Hz under the upright and inverted conditions, respectively. The congruency effect was not significantly different between these conditions at the group level. (b) The individual congruency effect (upright versus inverted) was not significantly correlated with the Autism-Spectrum Quotient (AQ) score. N = 24. Paired t-test. *: p < .05; **: p < .01; ***: p < .001; n.s.: p > .05.
Figure 3—figure supplement 2
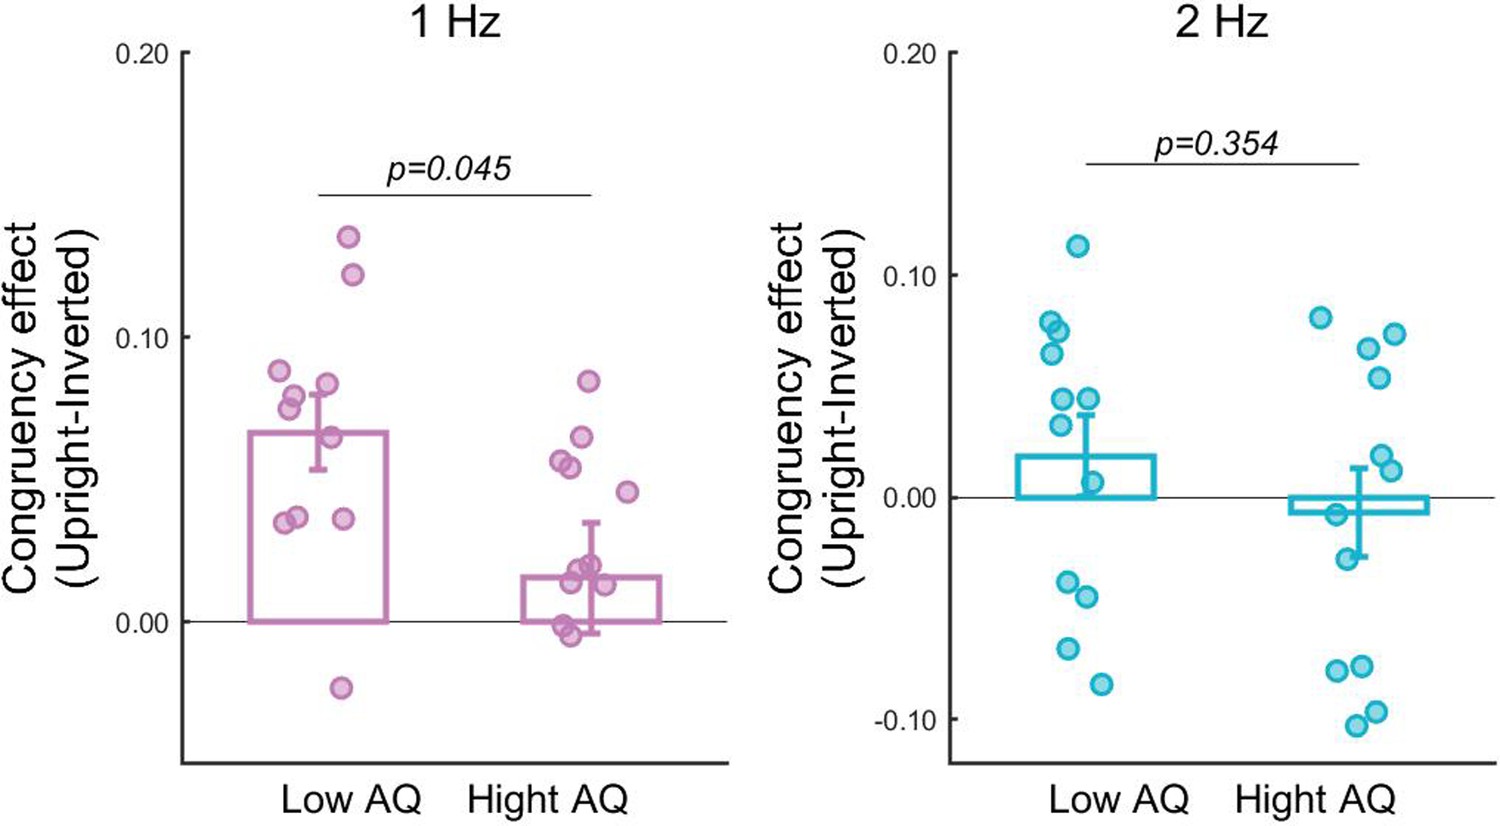
The biological motion (BM)-specific cortical tracking effect for high and low Autism-Spectrum Quotient (AQ) groups at 1Hz (N = 23) and 2Hz (N = 24).
Independent sample t-test.
Additional files
Download links
A two-part list of links to download the article, or parts of the article, in various formats.
Downloads (link to download the article as PDF)
Open citations (links to open the citations from this article in various online reference manager services)
Cite this article (links to download the citations from this article in formats compatible with various reference manager tools)
Cortical tracking of hierarchical rhythms orchestrates the multisensory processing of biological motion
eLife 13:RP98701.
https://doi.org/10.7554/eLife.98701.5


