Predictive models for secondary epilepsy in patients with acute ischemic stroke within one year
- Department of Neurosurgery, Chongqing Emergency Medical Center, Chongqing University Central Hospital, School of Medicine, Chongqing University, China
- Bioengineering College of Chongqing University, China
- Department of Neurosurgery, Chongqing University Qianjiang Hospital, China
- Department of Neurosurgery, Yubei District Hospital of Traditional Chinese Medicine, China
- Department of Neurosurgery, Bishan hospital of Chongqing Medical University, China
- Department of Prehospital Emergency, Chongqing University Central Hospital, Chongqing Emergency Medical Center, China
- Chongqing Key Laboratory of Emergency Medicine, China
- Jinfeng Laboratory, China
Figures
Figure 1

LASSO regression coefficient paths.
The image shows the LASSO regression coefficient paths for various features related to a medical or research study. The x-axis shows the log of the regularization parameter alpha, and the y-axis shows the regression coefficient values. The lines in the plot represent the coefficient paths for different features as the regularization parameter changes. The features are labeled on the right side of the plot, and the most important features selected by the LASSO model are shown at the bottom of the image.
Figure 2 with 3 supplements

Model evaluation metrics and curves.
The figure shows model performance curves across six sections (A1, A2, A3 on the left; B1, B2, B3 on the right) for training and test sets. ROC Curve: Illustrates the trade-off between sensitivity and specificity, with the AUC indicating overall model performance. Calibration Curve: Compares predicted probabilities to actual outcomes, assessing the model’s confidence accuracy. Precision-Recall Curve: Analyzes the balance between precision and recall at various thresholds, particularly useful for imbalanced datasets.
Figure 2—figure supplement 1
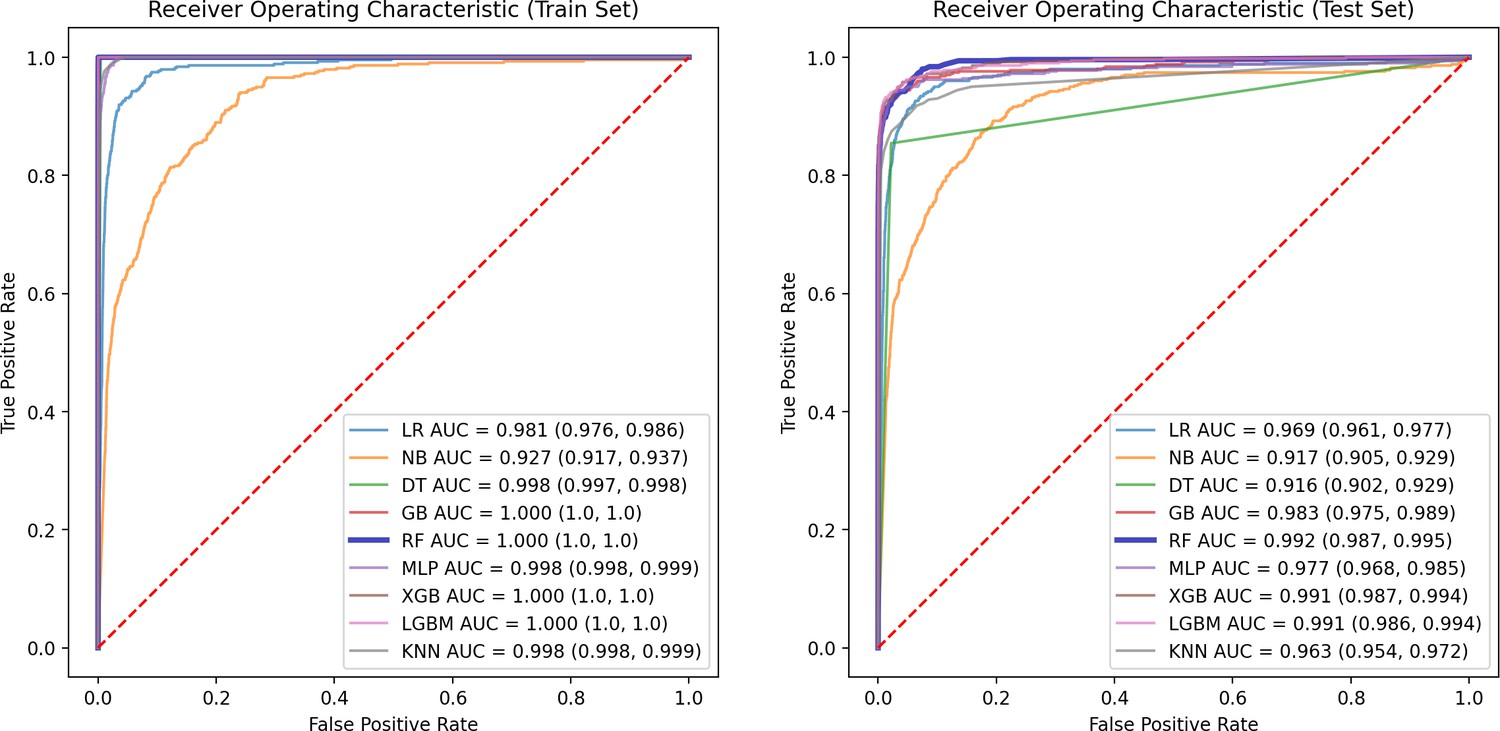
ROC curve of train and test groups.
This figure presents the ROC Curve, illustrating the performance of the model in terms of true positive rate versus false positive rate, providing insights into the model’s discriminative ability.
Figure 2—figure supplement 2
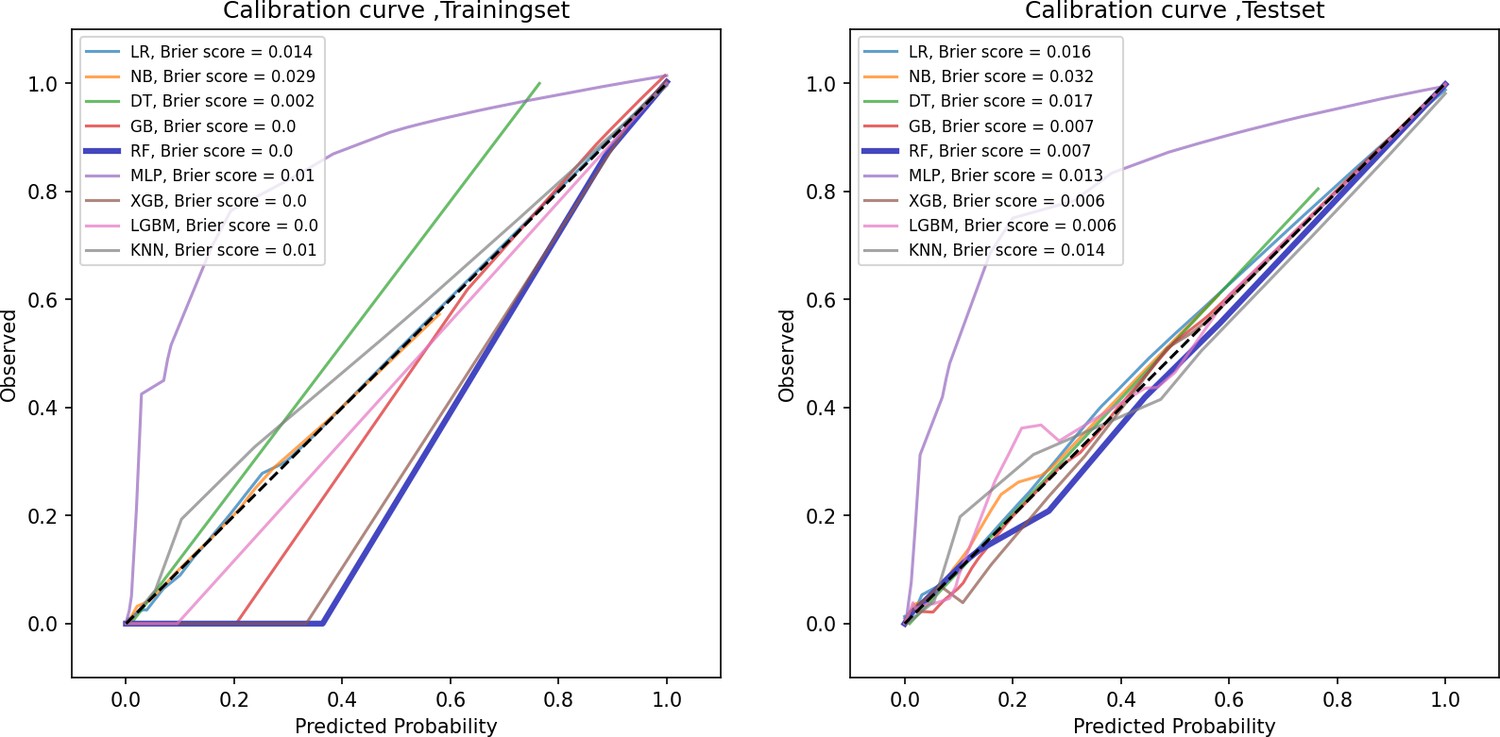
Calibration curve of train and test groups.
This figure displays the calibration curve, which assesses how well the predicted probabilities align with actual outcomes, helping to evaluate the reliability of the model’s probability estimates.
Figure 2—figure supplement 3
Precision-recall curve of train and test groups.
This figure showcases the precision-recall curve, highlighting the trade-off between precision and recall for the model, particularly useful in evaluating performance on imbalanced datasets.
Figure 3 with 3 supplements
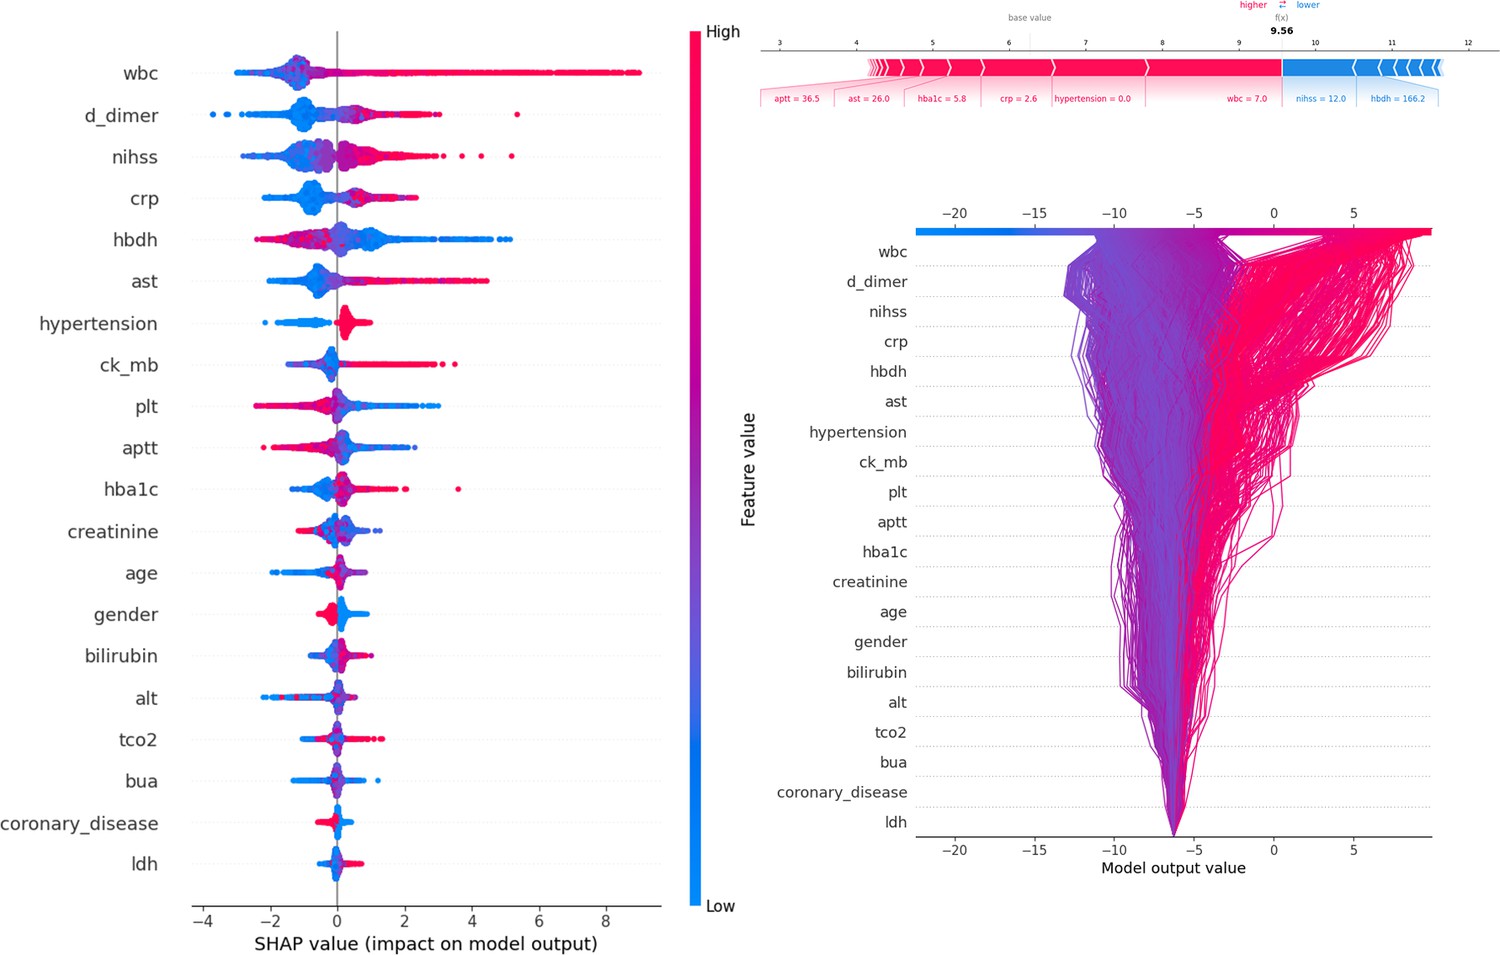
Description of the SHapley Additive exPlanations (SHAP) values and feature importance.
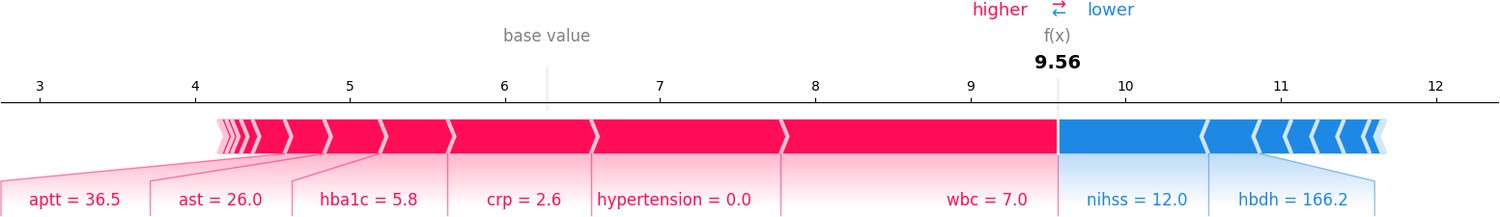
SHAP Value (Left): Displays the impact of each feature on the model’s predictions, with features sorted by importance. The color gradient indicates the range of feature values, from low (blue) to high (red). Force plot (upper right): Illustrates the contribution of individual features of the first sample to the final model output, highlighting how each feature value pushes the prediction away from the baseline value. Decision plot (lower right): Visualizes the cumulative impact of features on the model output for each sample, showing how the feature values combine to produce the final prediction.
Figure 3—figure supplement 1

SHAP value of train and test groups.
This figure presents the summary_plot, and provides a detailed view of SHapley Additive exPlanations (SHAP) values for individual features, illustrating their contributions to the model’s predictions. It highlights the importance of each feature and their respective impacts.
Figure 3—figure supplement 2
Force plot of train and test groups.
This figure presents a force plot for a specific sample, visualizing how individual feature values influence the model’s final output. It depicts the push and pull of features from the baseline prediction.
Figure 3—figure supplement 3

Decision plot of train and test groups.
This figure presents the decision plot that aggregates the effects of multiple features on the model’s predictions across samples, demonstrating how feature interactions shape the cumulative output.
Figure 4

Slection and exclusion procedure of patients.
A total of 42,079 records were retrieved from the stroke database, and 24,733 patients were diagnosed with ischemic or lacunar stroke with new onset. Hemorrhagic strokes (4565), a history of stroke (2154), TIA (3570), unclear cause strokes (561), and records with missing essential data (6496) were excluded. Patients whose seizures might have been caused by other factors (such as brain tumors, intracranial vascular malformations, or traumatic brain injury) (865), those with a seizure history (152), and patients who died in the hospital (1444) were also excluded. Additionally, patients lost to follow-up (those without outpatient records or unreachable by phone) or who died within three months of the stroke incident (813) were excluded. Finally, 21,459 cases were included in the study.
Additional files
-
MDAR checklist
- https://cdn.elifesciences.org/articles/98759/elife-98759-mdarchecklist1-v1.pdf
-
Supplementary file 1
Single factor significant analysis results.
This table presents the results of the Chi-Square and Mann-Whitney U tests used to evaluate the association of various features with positive and negative samples. Sample sizes: Positive samples (n=954) and negative samples (n=20,789). Statistical methods: The Chi-Square test assesses the relationship between categorical variables, while the Mann-Whitney U test compares differences between independent groups for continuous data. p-values: Indicate the significance of the associations, with lower values suggesting stronger evidence against the null hypothesis. Statistical values: Include counts and percentages of samples for each feature in both groups, along with the calculated statistics for each test.
- https://cdn.elifesciences.org/articles/98759/elife-98759-supp1-v1.xls
-
Supplementary file 2
Single factor significant analysis results.
This table presents the results of a single-factor significance analysis for various features across two groups of samples: negative samples (0) and positive samples (1). Sample size: Group 0 (Negative): n=20,789 Group 1 (Positive): n=954 Feature analysis: For each feature, the table includes the mean and standard deviation (±) for both groups, odds ratios (OR) from univariable analysis, coefficients (coef), standard errors (std err), z-scores (z), p-values (p>|z|), and 95% confidence intervals ([0.025, 0.975]). Significance levels: Features with statistically significant differences are indicated by p-values less than 0.05. An odds ratio greater than 1 suggests an increased risk associated with the feature in the positive group, while an odds ratio less than 1 suggests a decreased risk. Labels: The last two columns provide the proportions of the positive and negative samples for selected features.
- https://cdn.elifesciences.org/articles/98759/elife-98759-supp2-v1.xls
-
Supplementary file 3
Multivariable analysis results.
This table presents the results of a multivariable analysis for various features across two groups of samples: negative samples (0) and positive samples (1). Sample size: Group 0 (Negative): n=20,789 Group 1 (Positive): n = 954 Feature analysis: For each feature, the table includes the mean and standard deviation (±) for both groups, odds ratios (OR) from multivariable analysis, coefficients (Coef.), standard errors (Std. Err.), z-scores (z), p-values (p>|z|), and 95% confidence intervals ([0.025, 0.975]). Significance levels: Features with statistically significant differences are indicated by p-values less than 0.05. An odds ratio greater than 1 indicates an increased risk associated with the feature in the positive group, while an odds ratio less than 1 suggests a decreased risk. Labels: The last column presents the proportions of the positive and negative samples for selected features.
- https://cdn.elifesciences.org/articles/98759/elife-98759-supp3-v1.xls
-
Supplementary file 4
Model performance evaluation results.
This table presents the performance evaluation metrics for various machine learning models, including AUC, Accuracy, Sensitivity (Recall), Specificity, F1-score, Positive Predictive Value (PPV/Precision), and Negative Predictive Value (NPV). AUC: Area Under the Curve, indicating the model's ability to distinguish between positive and negative samples; values closer to 1 indicate better performance. Accuracy: The proportion of correctly classified samples among the total samples. Sensitivity/Recall: The proportion of correctly identified positive samples out of all actual positive samples. Specificity: The proportion of correctly identified negative samples out of all actual negative samples. F1-score: The harmonic mean of precision and recall, considering both the accuracy and completeness of the model. PPV/Precision: The proportion of correctly identified positive samples among all samples predicted as positive. NPV: The proportion of correctly identified negative samples among all samples predicted as negative.
- https://cdn.elifesciences.org/articles/98759/elife-98759-supp4-v1.xls
-
Source code 1
Statistical analysis notebook.
This Jupyter notebook conducts statistical analyses of the results obtained from the machine learning models, providing insights and summaries. It includes the original data for Tables 1, 2, and 3, which are related to statistical and regression analysis.
- https://cdn.elifesciences.org/articles/98759/elife-98759-code1-v1.zip
-
Source code 2
Data preprocessing script.
This Python script is dedicated to data preprocessing tasks, specifically designed to fill missing data using Random Forest (RF) imputation techniques, ensuring data integrity for subsequent analyses.
- https://cdn.elifesciences.org/articles/98759/elife-98759-code2-v1.zip
-
Source code 3
Lasso regression, model construction, and SHAP analysis.
This main notebook implements Lasso regression, along with model construction and SHAP (SHapley Additive exPlanations) analysis for interpretability. It contains the original Figures 2, 3, 4, and Table 4, which relate to model performance and interpretation.
- https://cdn.elifesciences.org/articles/98759/elife-98759-code3-v1.zip
-
Source code 4
Cross-validation for Lasso regression.
This notebook is designed to perform fivefold cross-validation for the Lasso regression and model construction, ensuring a robust evaluation of model performance. It includes figures and tables that summarize the results of the cross-validation process.
- https://cdn.elifesciences.org/articles/98759/elife-98759-code4-v1.zip
-
Source code 5
External model testing.
This notebook contains code for external testing of the model, evaluating its performance on new external data. All relevant data related to the evaluation process is included within this code.
- https://cdn.elifesciences.org/articles/98759/elife-98759-code5-v1.zip
Download links
A two-part list of links to download the article, or parts of the article, in various formats.
Downloads (link to download the article as PDF)
Open citations (links to open the citations from this article in various online reference manager services)
Cite this article (links to download the citations from this article in formats compatible with various reference manager tools)
Predictive models for secondary epilepsy in patients with acute ischemic stroke within one year
eLife 13:RP98759.
https://doi.org/10.7554/eLife.98759.3


