Operation regimes of spinal circuits controlling locomotion and the role of supraspinal drives and sensory feedback
- Department of Neurobiology and Anatomy, College of Medicine, Drexel University, United States
- School of Biological Sciences, Georgia Institute of Technology, United States
- Department of Pharmacology-Physiology, Faculty of Medicine and Health Sciences, Centre de Recherche du CHUS, Université de Sherbrooke, Canada
Figures
Figure 1
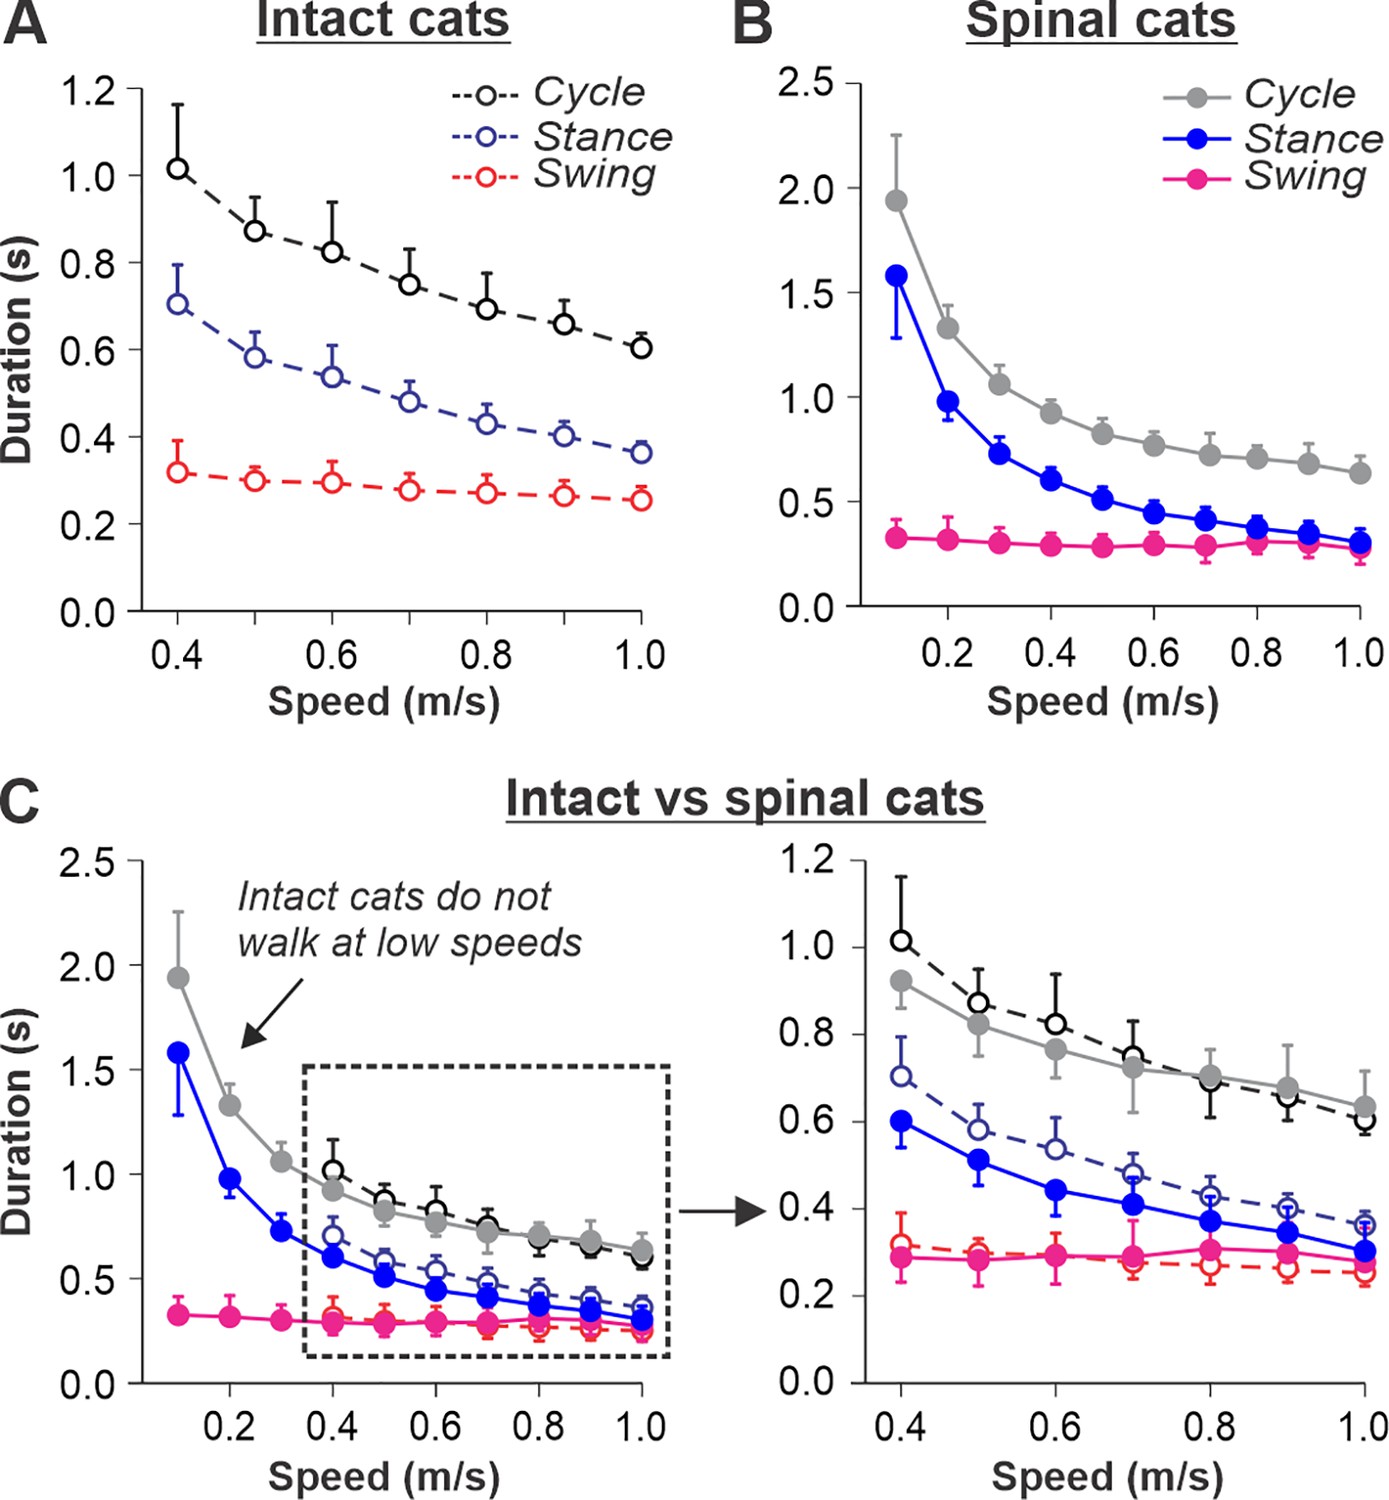
Locomotion of intact and spinal cats on a tied-belt treadmill.
(A, B) Step cycle, stance, and swing phase durations for the right hindlimb during tied-belt treadmill locomotion of intact A, from Frigon et al., 2015; Latash et al., 2020 and spinal B, from Frigon, 2017; Latash et al., 2020 cats with an increasing treadmill speed. Data were obtained from 6 to 15 cycles in seven intact and six spinal cats (one cat was studied in both states). Each data point is the mean ± standard deviation. Modified from Fig. 3C, D of Latash et al., 2020, under the license CC-BY-4. (C) Superimposed curves from (A) and (B) to highlight differences.
Figure 2
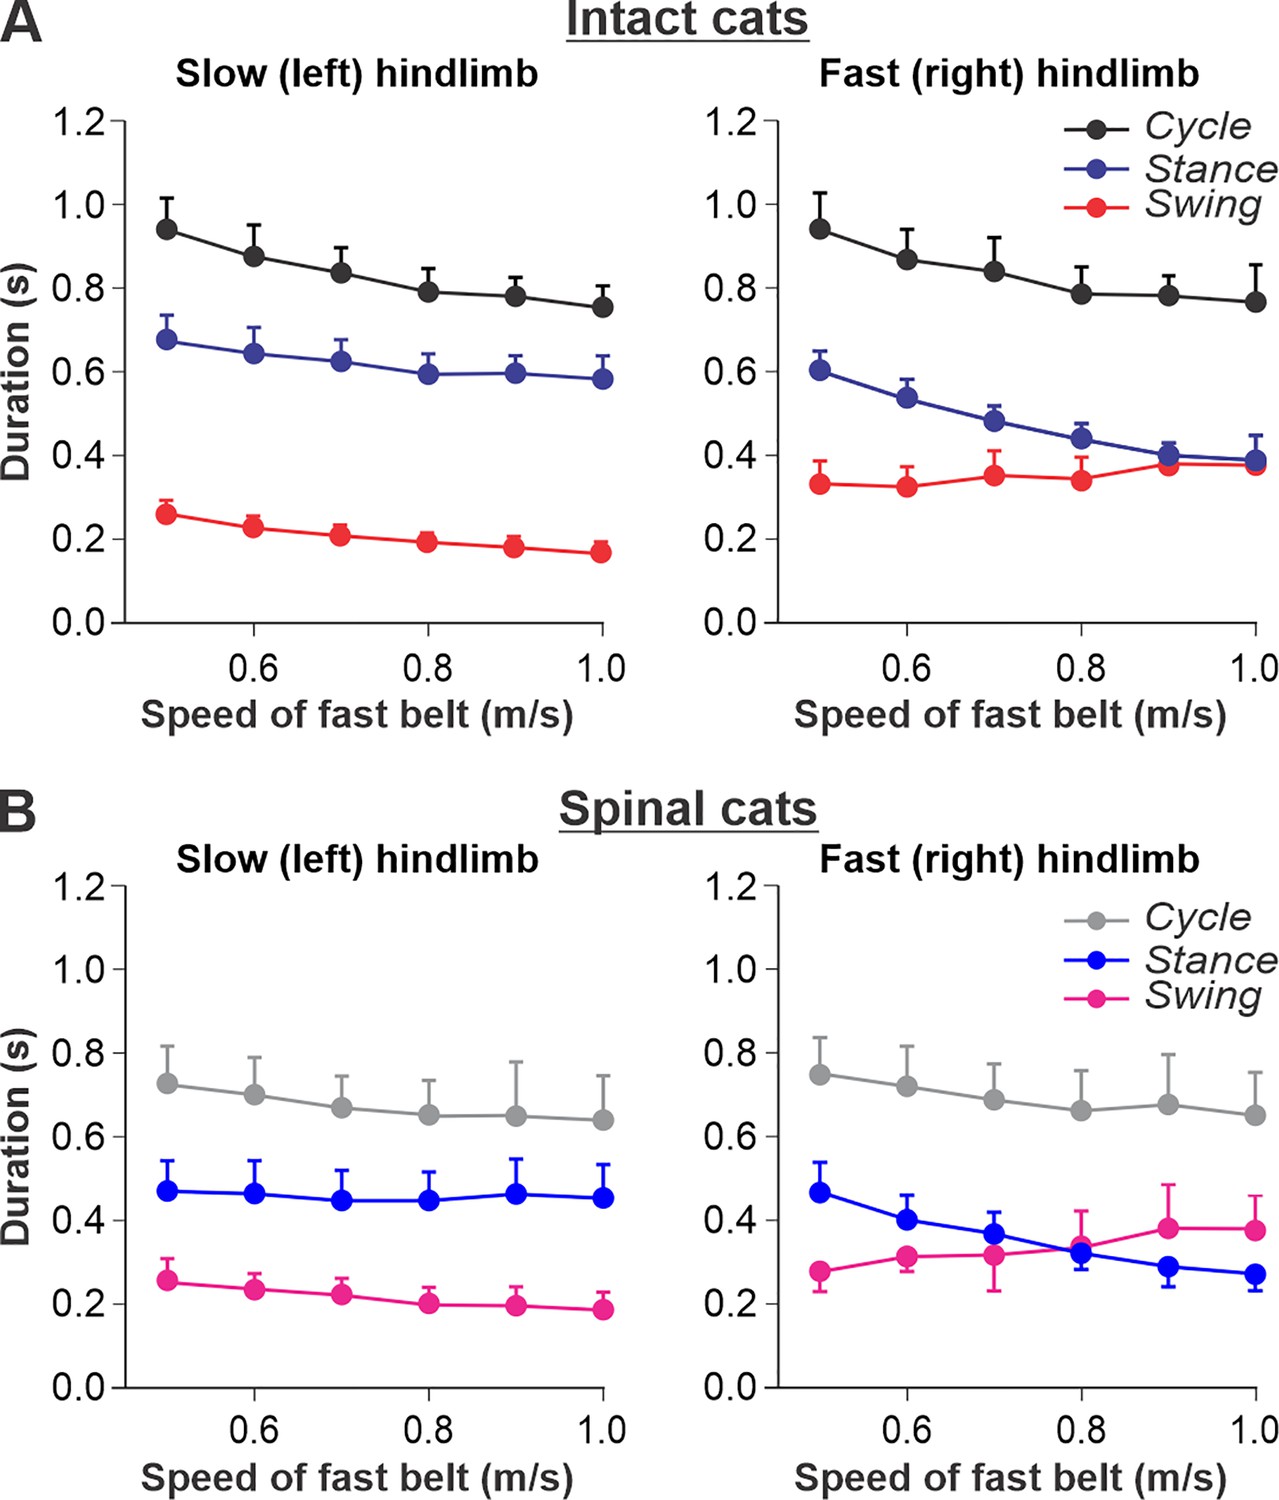
Locomotion of intact and spinal cats on a split-belt treadmill.
(A) Step cycle, stance, and swing phase durations for the left (slow) and right (fast) hindlimbs during split-belt treadmill locomotion of intact cats (from Frigon et al., 2015; Latash et al., 2020). (B) Changes in the same characteristics for the left (slow) and right (fast) hindlimbs during split-belt treadmill locomotion in spinal cats (from Frigon et al., 2017; Latash et al., 2020). In both series of experiments the left (slow) hindlimb was stepping at 0.4 m/s while the right (fast) hindlimb stepped with speeds from 0.5 to 1.0 m/s with 0.1 m/s increments. Data were obtained from 6 to 15 cycles in seven intact and six spinal cats (one cat was studied in both states). Each data point is the mean ± standard deviation. Modified from Figure 6A and B of Latash et al., 2020, under the license CC-BY-4.
Figure 3 with 1 supplement
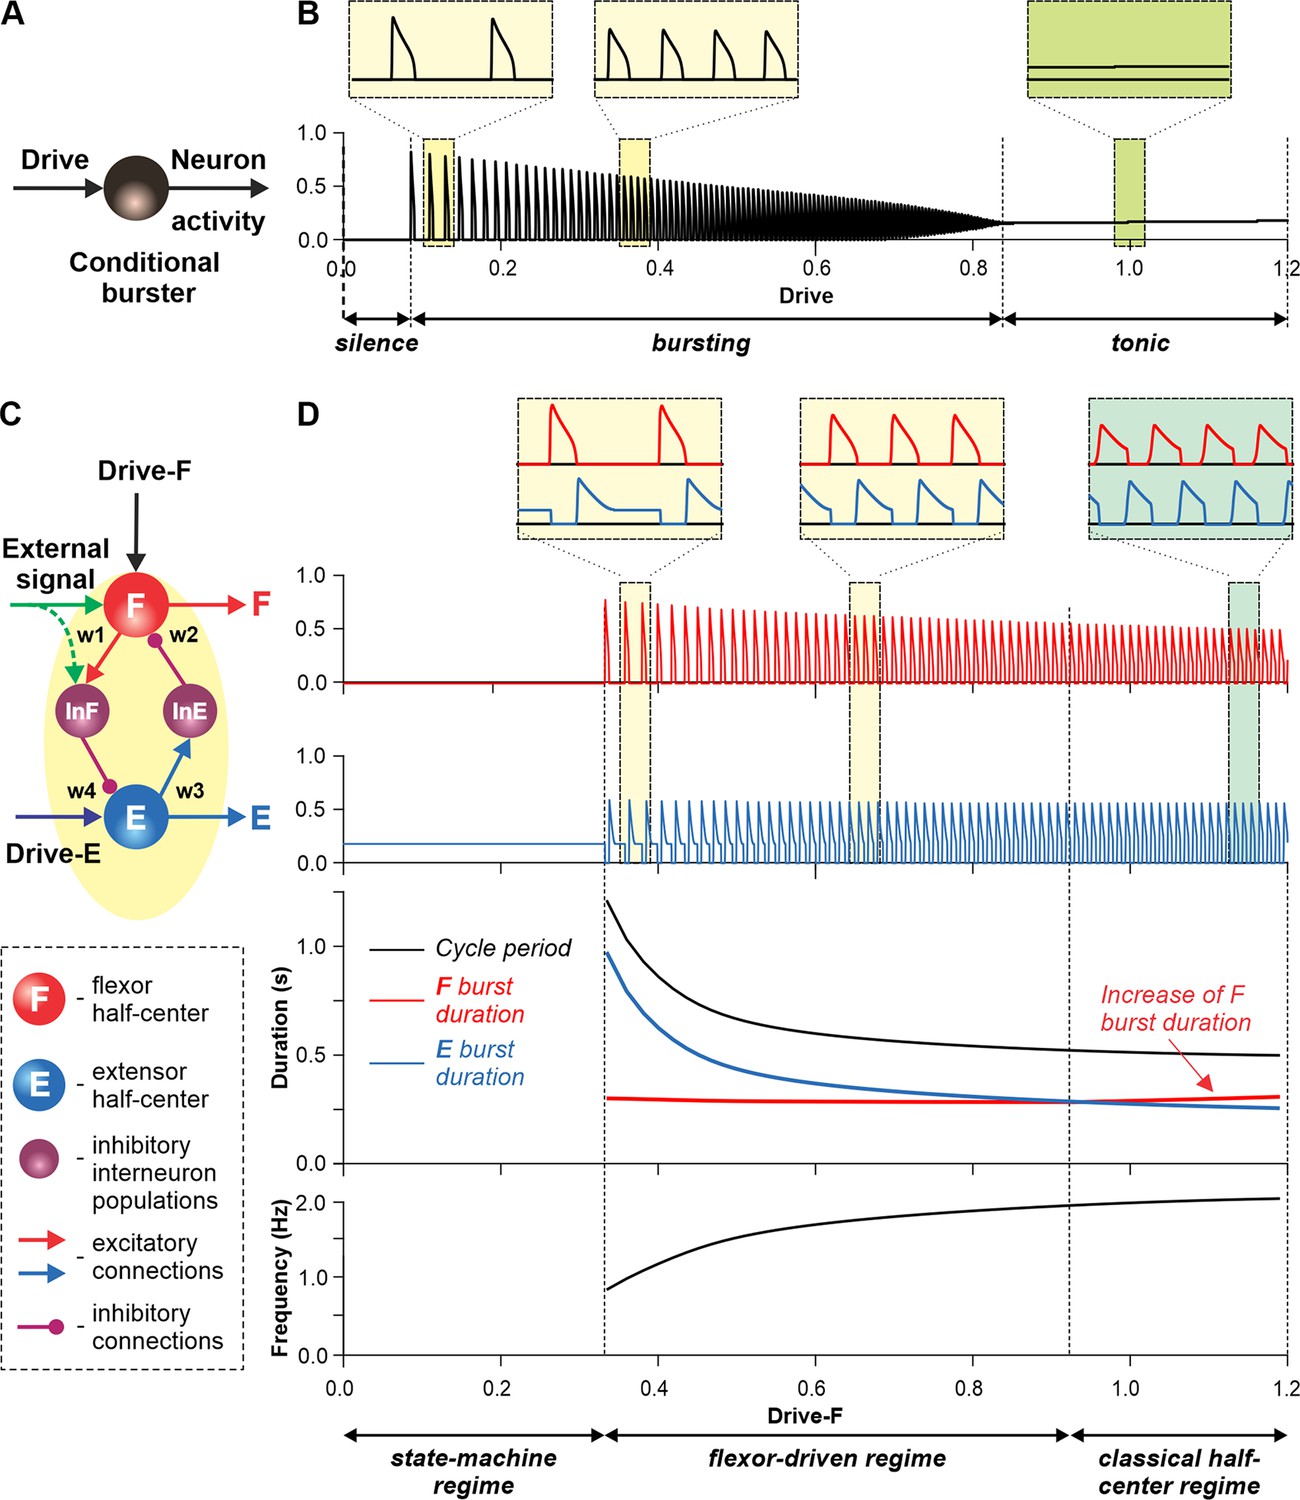
Modeling a single conditional burster and a half-center rhythm-generator.
(A) The behavior of a single INaP-dependent conditional burster. (B) Changes in the burster’s output when the excitatory input (Drive) progressively increases from 0 to 1.2. With increasing Drive, the initial silence state (zero output) at low Drive values changes to an intrinsic bursting regime with burst frequency increasing with the Drive value (seen in two left insets), and then to a tonic activity (seen in right inset). (C) Model of a simple half-center network (rhythm generator, RG) consisting of two conditional bursters/half-centers inhibiting each other through additional inhibitory neurons, InF and InE. The flexor half-center (F) receives progressively increasing Drive-F, whereas the extensor half-center (E) receives a constant Drive-E keeping it in the regime of tonic activity if uncoupled. (D) Model performance. At low Drive-F values, there are no oscillations in the system. This is a state-machine regime in which the RG maintains the state of extension, until an external (strong enough) signal arrives to activate the F half-center or to inhibit the E half-center (see green arrows) to release the F half-center from E inhibition allowing it to generate an intrinsic burst. Further increasing the Drive-F releases the F half-center from E inhibition and switches the RG to the bursting regime (see two insets in the middle). In this regime, the E half-center also exhibits bursting activity (alternating with F bursts) due to rhythmic inhibition from the F half-center. This is a flexor-driven regime. In this regime, with an increase in Drive-F, the bursting frequency of the RG is increasing (and the oscillation period is decreasing) due to shortening of the extensor bursts with much less reduction in the duration of flexor bursts (see bottom curves and two left insets). Further increasing the excitatory Drive-F leads to a transition of RG operation to a classical half-center oscillatory regime, in which none of the half-centers can generate oscillations if uncoupled, and the RG oscillations occur due to mutual inhibition between the half-centers and adaptive properties of their responses. Also in this regime, with an increase of Drive-F, the period of oscillations remains almost unchanged, and the duration of flexor bursts increases partly to compensate for the shortening of extensor bursts, which is opposite to the flexor-driven regime (see bottom curves and right inset).
Figure 3—figure supplement 1
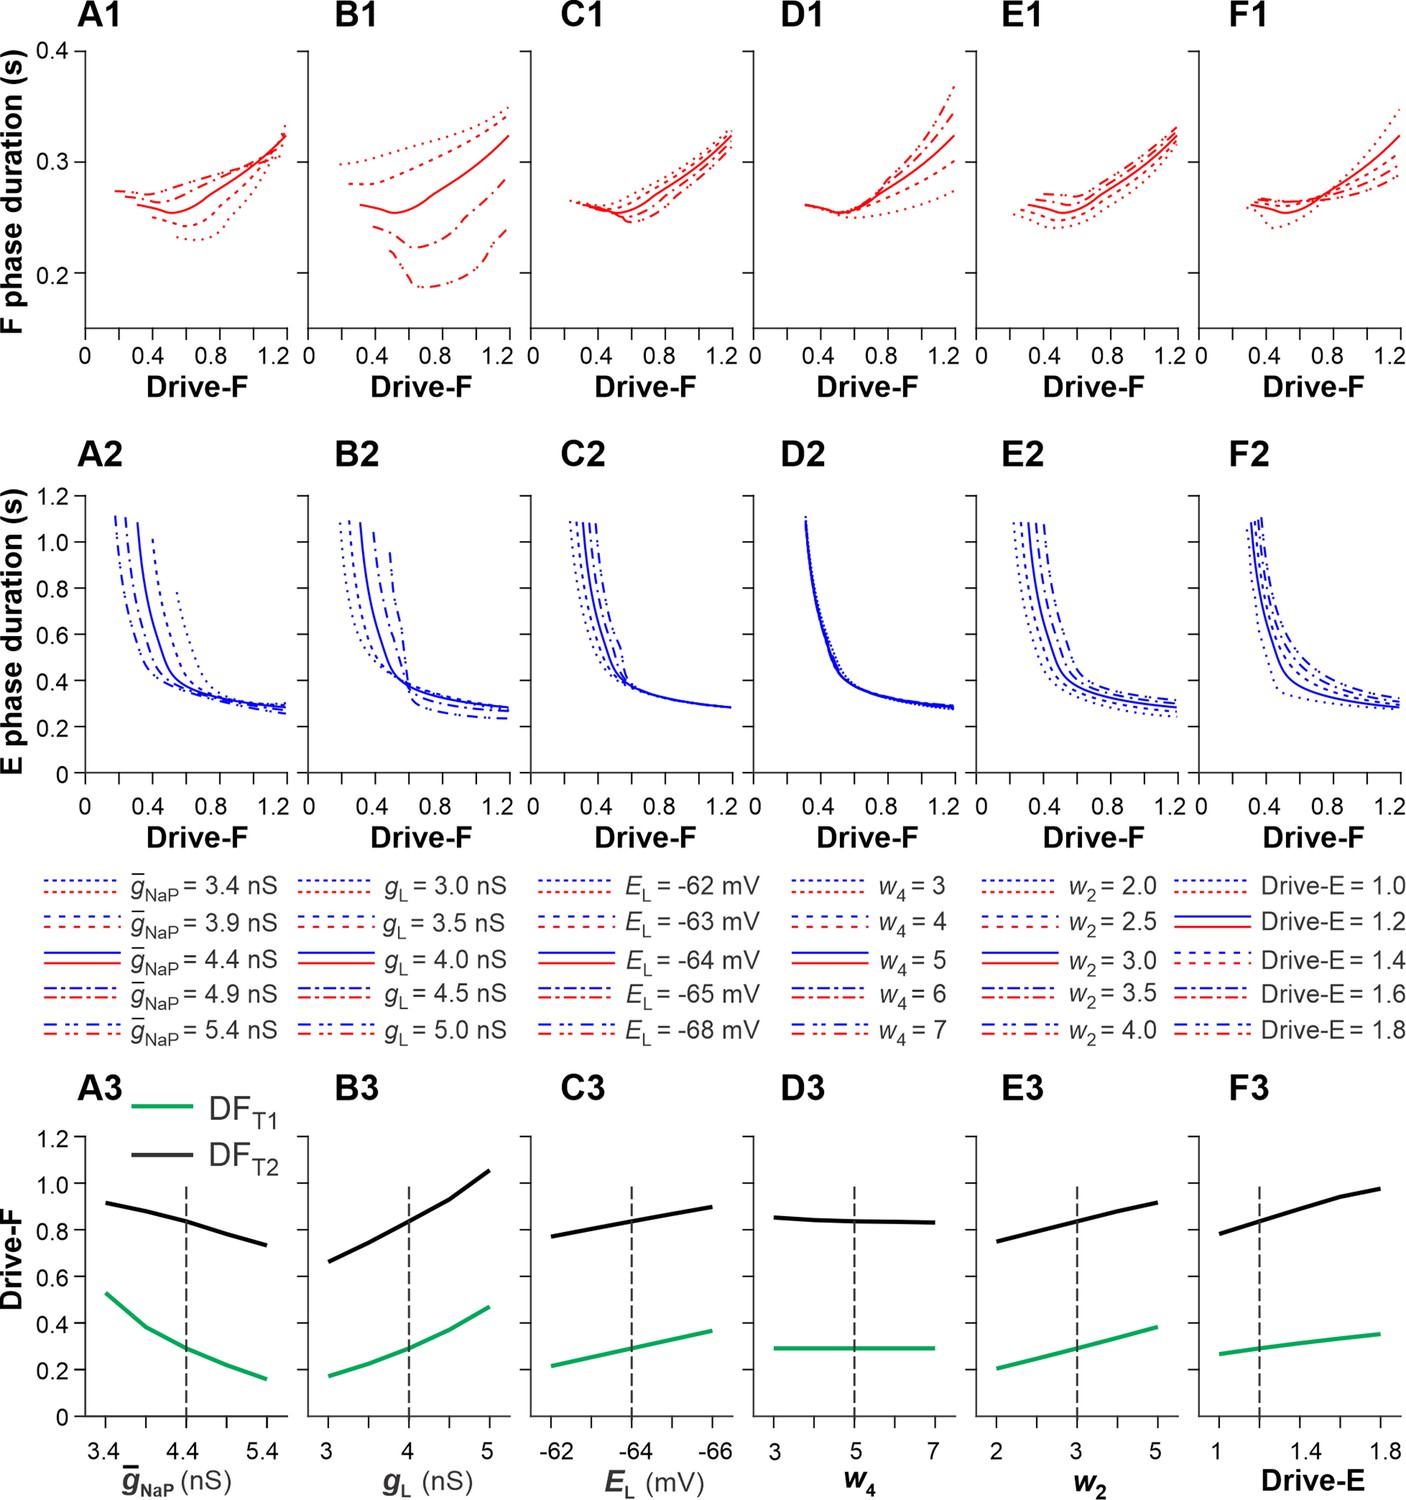
Sensitivity of the single rhythm generator (RG) model to variations of key model parameters.
We investigated the effects of variation of key model parameters on (1) changes in the durations of F and E phases as a function of the external drive to the F half-center (Drive-F) and (2) the values of Drive-F at which the RG model switches from the state-machine regime to the flexor-driven regime (transition 1 at Drive-F = DFT1) and from the flexor-driven regime to the classical half-center regime (transition 2 at Drive-F = DFT2). DFT1 was the time when the flexor half-center started generating intrinsic oscillations. DFT2 was the time when the duty factor (extensor phase/period of oscillations) became equal to 0.5, after which the length of flexor bursts started to increase with the increasing Drive-F. we used OFAT (One-factor-at-a-time) method (Daniel H One-at-a-time plans. J. Am. Stat. Association 68:353–360 (1973)). This supplement figure shows the results of changes in the duration of F and E phases, and DFT1 and DFT2 values based on variation of the following key model parameters: the maximal conductance of the persistent sodium current, (A1-A3); the leakage conductance, (B1-B3) and reversal potential, (C1-C3); the weights of inhibitory connections from InF to E, (D1-D3) and from InE to F, (E1-E3); and constant drive to the E half-center, Drive-E (F1-F3). Bold lines in the two upper rows and vertical dashed lines in the bottom row correspond to the basic values of model parameters. In most cases, the above parameter manipulations produced moderate to small opposite changes in the durations of F and E phases. The strongest effects were produced by the variations of (A1 and A2) and (B1 and B2, especially B1). Elevation of (A3) or reduction of (B3) shifted DFT1 and DFT2 points to lower values of Drive-F. Similar, but weaker effects were produced by increasing the negative value of (C1-C3) or by a reduction of (E1-E3) and Drive-E (F1-F3). Reduction of (E1-E3) affected only the duration of the F phase. We concluded that the duration of F and E phases and the values of DFT1 and DFT2, defining the transition between rhythm generator (RG) regimes, were most sensitive to variations of the intrinsic parameters of the RG half-centers: and .
Figure 4
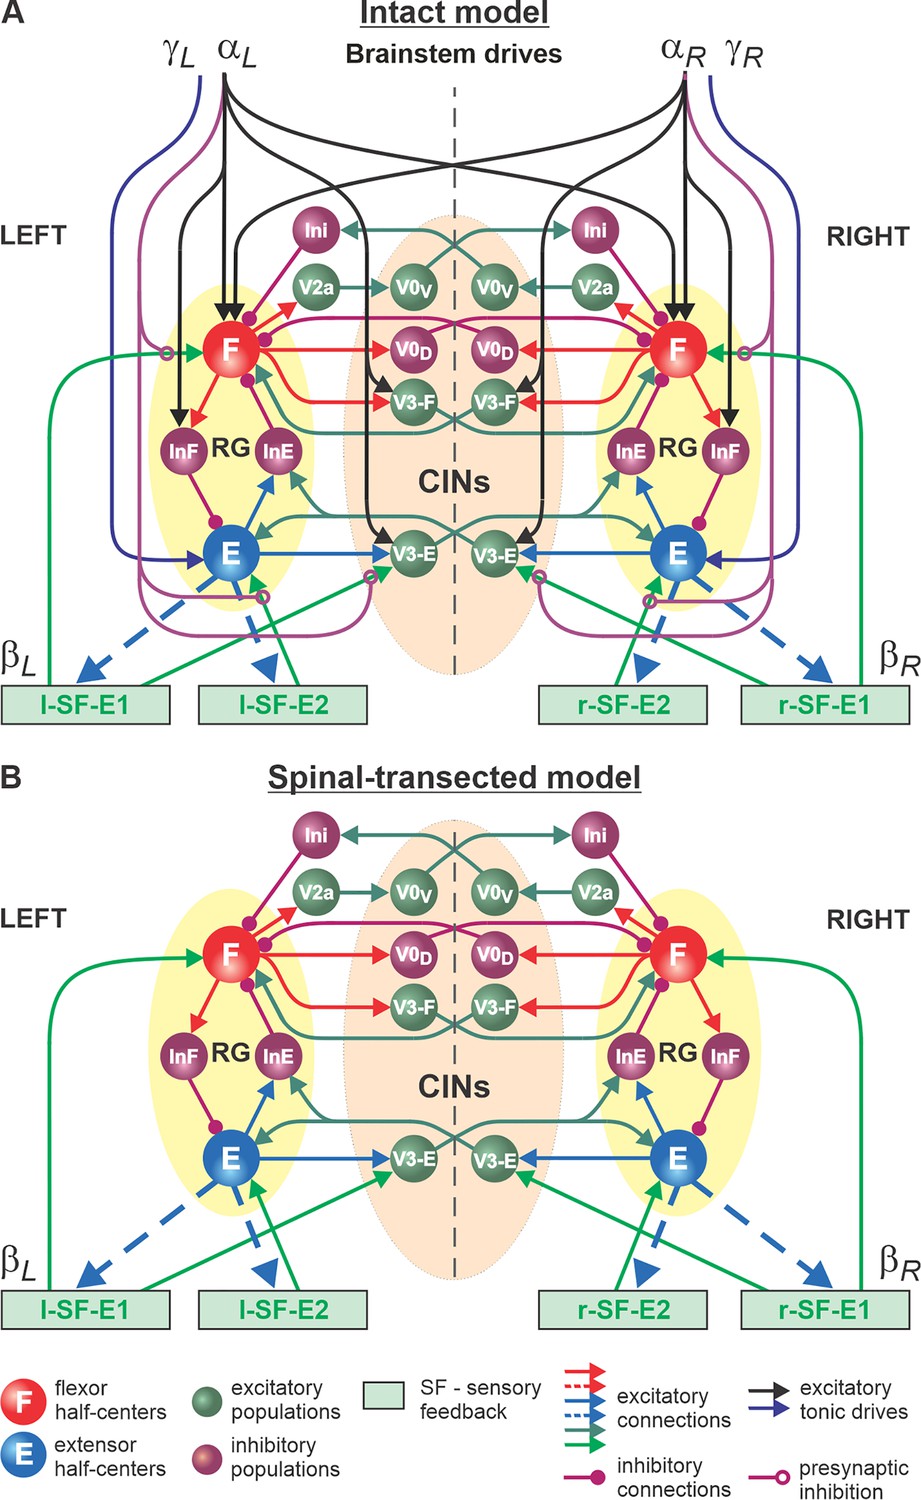
Model of spinal circuits controlling treadmill locomotion.
(A) Model of the intact system (’intact model’). The model includes two bilaterally located (left and right) rhythm generators (RGs) (each is similar to that shown in Figure 3B) coupled by (interacting via) several commissural pathways mediated by genetically identified commissural (V0D, V0V, and V3) and ipsilaterally projecting excitatory (V2a) and inhibitory neurons (see text for details). Left and right excitatory supraspinal drives ( and ) provide activation for the flexor half-centers (F) of the RGs (ipsi- and contralaterally) and some interneuron populations in the model, as well as for the extensor half-centers (E) and ipsilaterally. Two types of feedback (SF-E1 and SF-E2) operating during ipsilateral extension affect (excite), respectively, the ipsilateral F and E half-centers, and through V3-E neurons affect contralateral RGs. The SF-E1 feedback depends on the speed of the ipsilateral ‘belt’ ( or ) and contributes to extension-to-flexion transition on the ipsilateral side. The SF-E2 feedback activates the ipsilateral E half-center and contributes to ’weight support’ on the ipsilateral side. The ipsilateral excitatory drives ( and ) suppress (reduce) the effects of all ipsilateral feedback inputs by presynaptic inhibition. (B) Model of the spinal-transected system. All supraspinal drives (and their suppression of sensory feedback) are eliminated from the schematic shown in A.
Figure 5
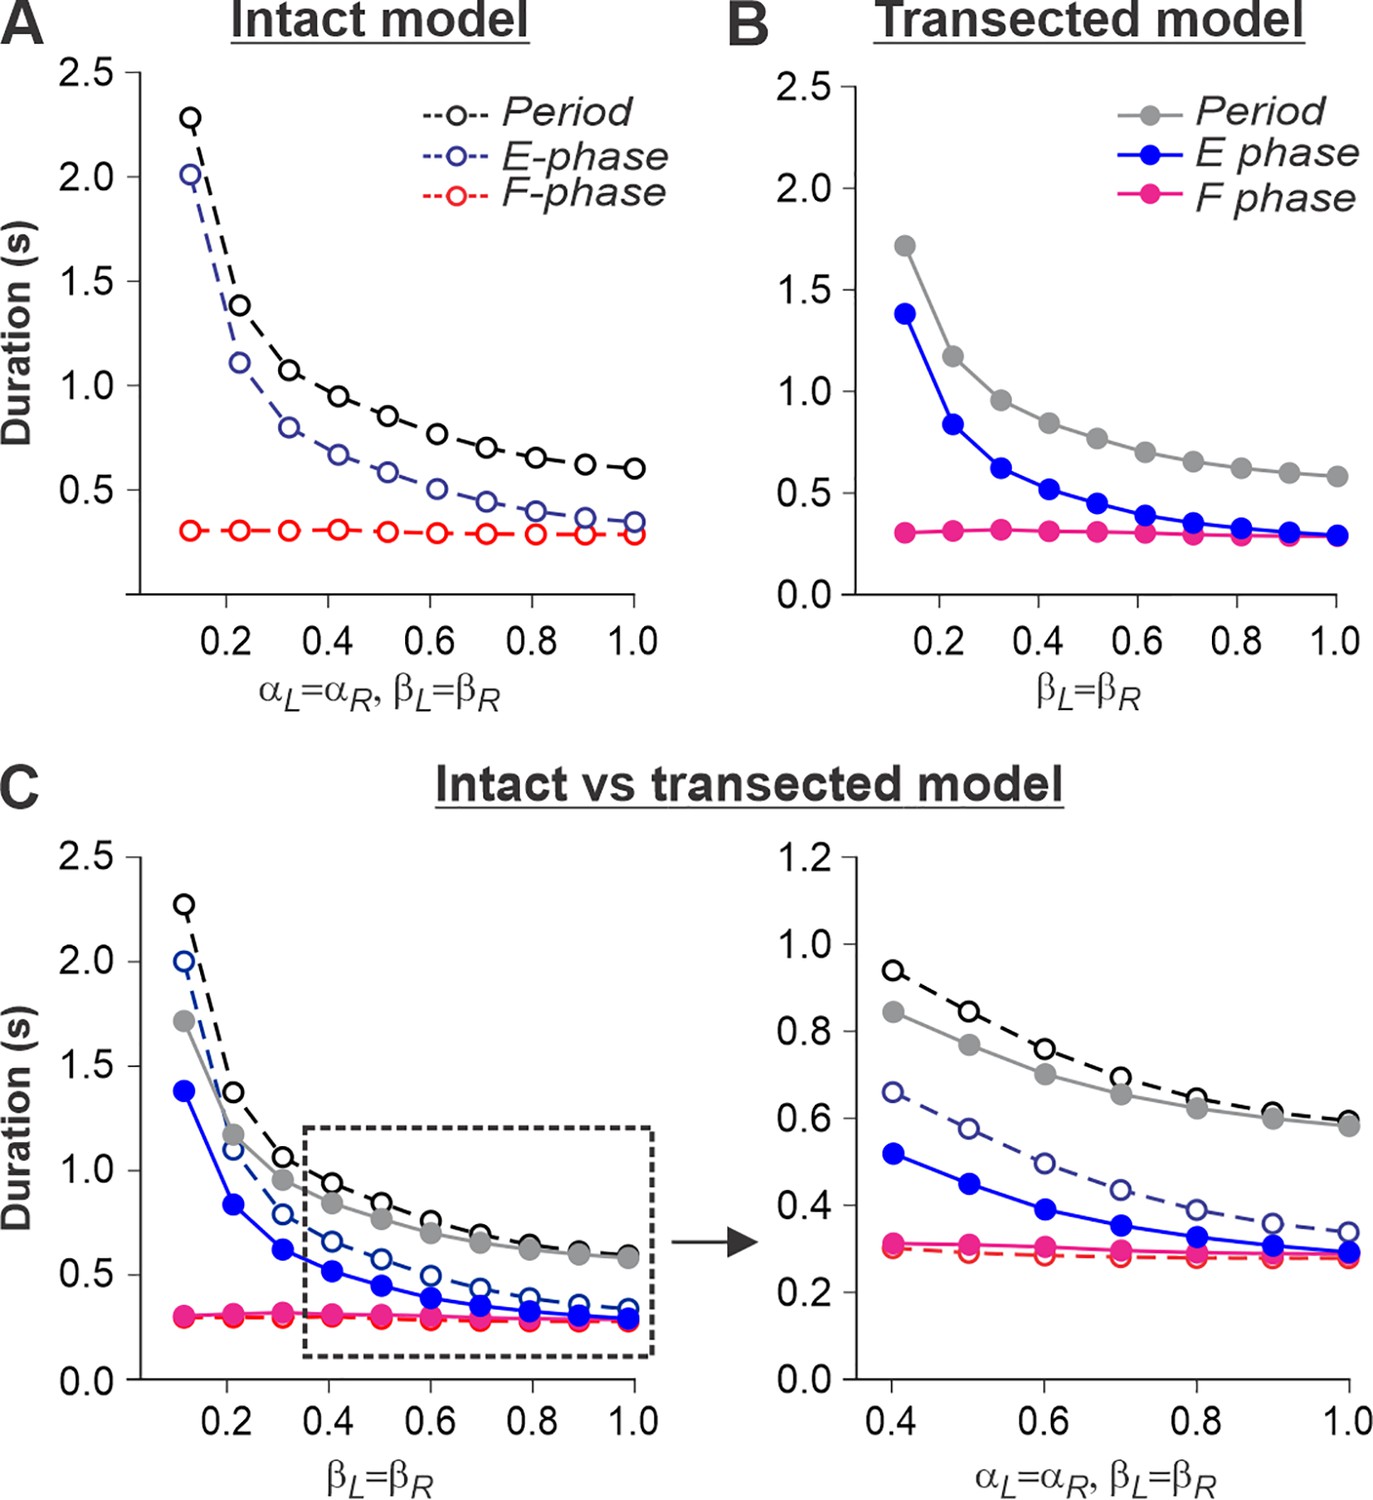
Simulation of locomotion on a tied-belt treadmill using intact and transected models.
(A, B) Changes in the durations of locomotor period and flexor/stance and extensor/swing phases during simulated tied-belt locomotion using the intact (Figure 4A) and transected (Figure 4B) models with an increasing simulated treadmill speed. (C) Superimposed curves from panels (A) and (B) to highlight differences.
Figure 6
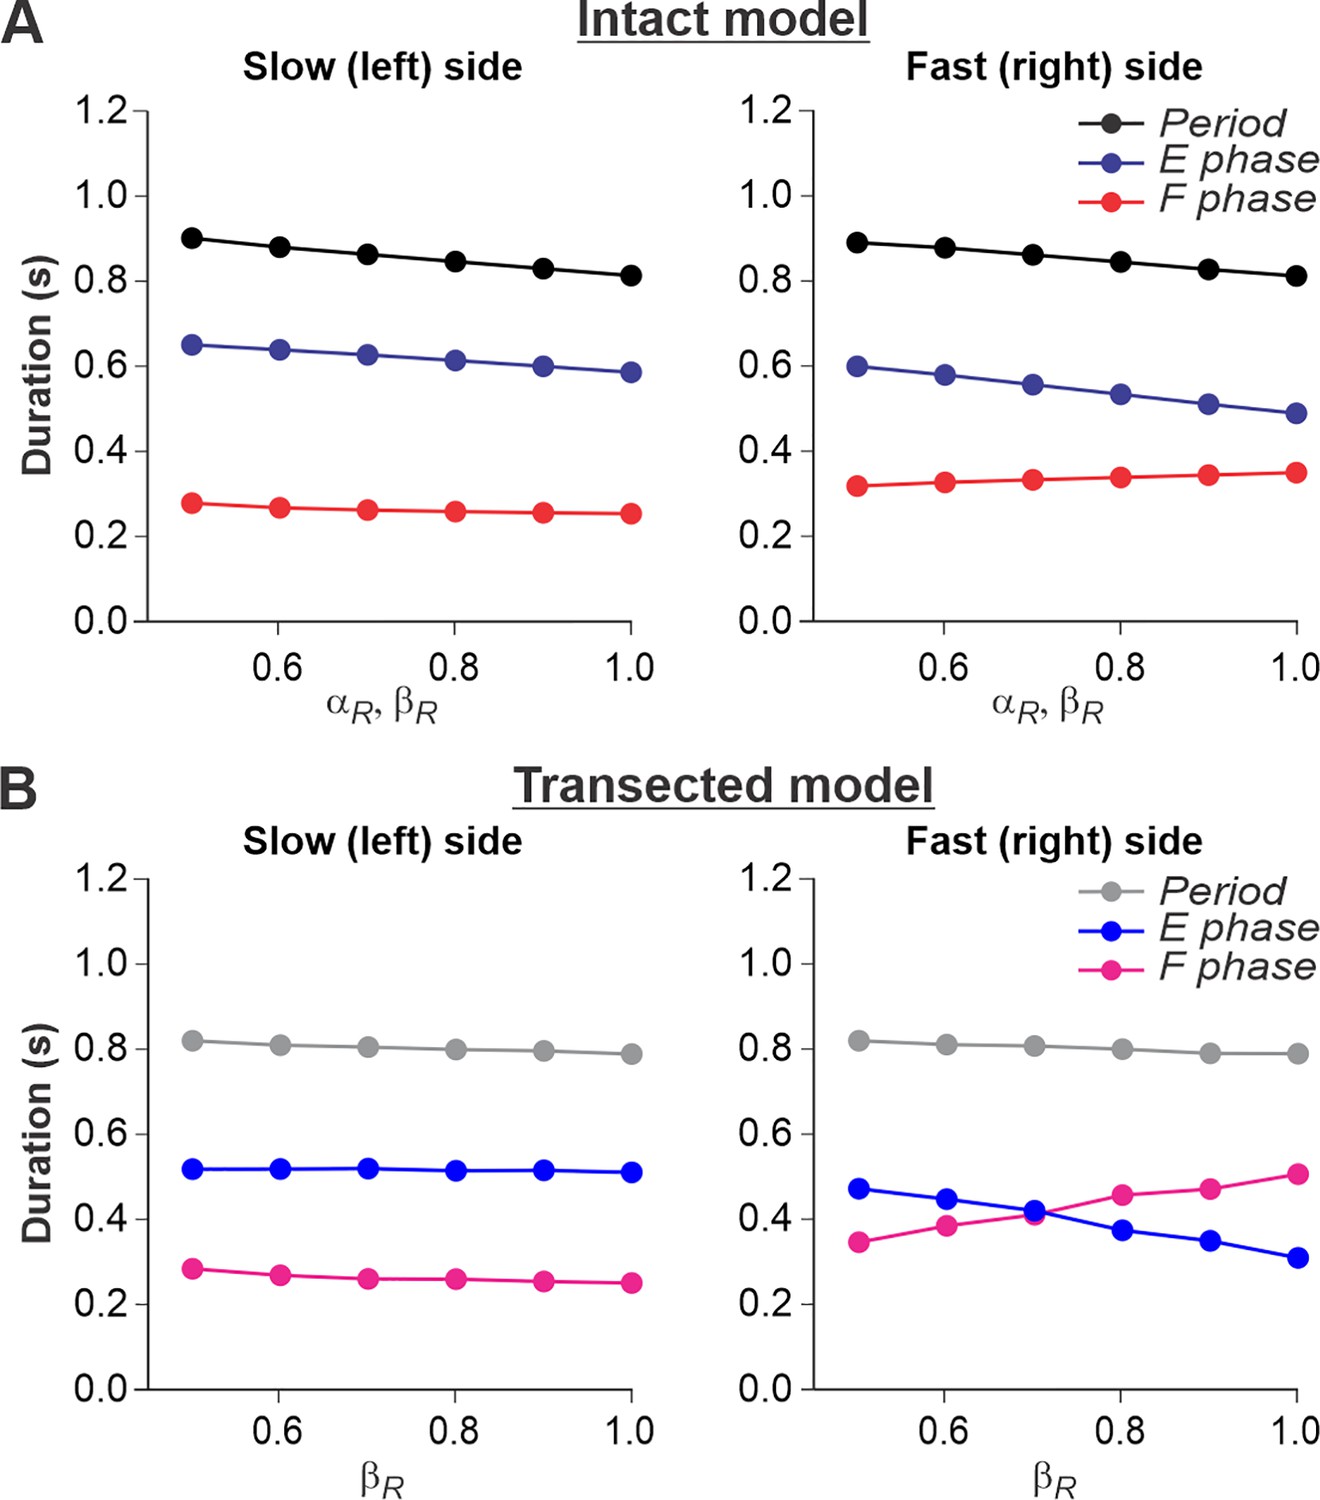
Simulation of locomotion on a split-belt treadmill using intact and transected models.
(A) Changes in the durations of locomotor period and flexor/stance and extensor/swing phases for the left (slow) and right (fast) sides during split-belt treadmill locomotion using the intact model (Figure 4A). (B) Changes in the same characteristics for the left (slow) and right (fast) sides during the simulation of split-belt treadmill locomotion using the transected model (Figure 4B). In both cases, the speed of the simulated left (slow) belt was constant ( = 0.4) while the speed of the simulated right belt () changed from 0.5 to 1.0 with 0.1 increments.
Figure 7

Simulation of the effect of removing SF-E2 feedback in the transected model during simulated tied-belt locomotion.
Changes in the durations of locomotor period and flexor/stance and extensor/swing phases during simulated tied-belt locomotion using the transected model (Figure 4B) after removal of SF-E2 feedback.
Figure 8
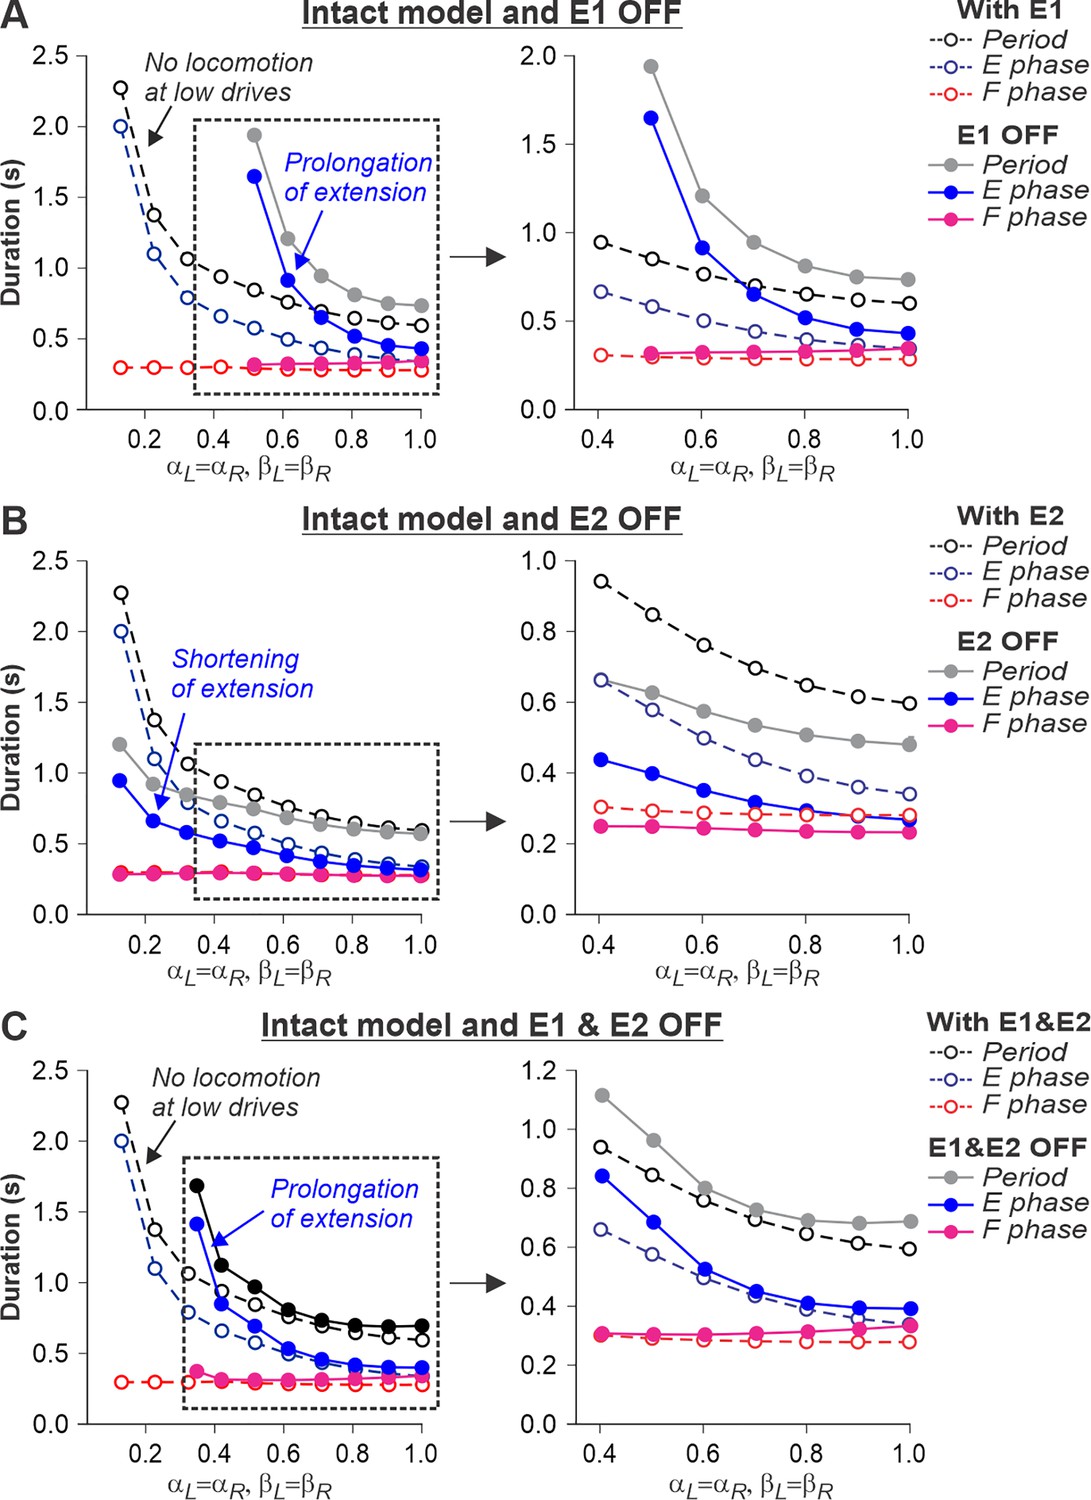
Simulation of the effect of removing SF-E1, or SF-E2, or both feedback types in the intact model during simulated tied-belt locomotion.
Changes in the durations of locomotor period and flexor/stance and extensor/swing phases during simulated tied-belt locomotion using the intact model (Figure 4A) with an increasing simulated treadmill speed after removal of only SF-E1 feedback (A), only SF-E2 feedback (B), and both feedback types (C).
Tables
Table 1
Connection weights.
| Weights of connections between neurons, | |
|---|---|
| Source neuron | Target neuron |
| F | InF (3.6), V0D (2.5), V2a (2.5), V3-F (1.0) |
| E | InE (3.6), V3-E (0.3) |
| InF | E (–8.0) |
| InE | F (–4.0) |
| V2a | V0V (2.5) |
| V0V | c-Ini (2.5) |
| Ini | F (–2.0) |
| V0D | c-F (–6) |
| V3-E | c-E (0.1), c-InE (1.5) |
| V3-F | c-F (0.1) |
| Weights of connections from drives to neurons: | |
| Source drive | Target neuron |
| αipsi[∈ 0; 1.0] | F (0.45), InF(0.5), V3-E(0.1), V3-F(0.1) |
| αcontra[∈ 0; 1.0] | F (0.15) |
| γ=1.0 | E (2.0) |
| Weights of connections from feedback sources to neurons: | |
| Synaptic input from feedback | Target neuron |
| E1 | F (1.4), V3-E (1.2) |
| E2 | E (2.0) |
| Presynaptic inhibition of feedback connections by αipsi: | |
| Synaptic input from feedback | Target feedback connection |
| E1 | F (4.0), V3-E (0.5) |
| E2 | E (2.0) |
-
c-contralateral.
Additional files
Download links
A two-part list of links to download the article, or parts of the article, in various formats.
Downloads (link to download the article as PDF)
Open citations (links to open the citations from this article in various online reference manager services)
Cite this article (links to download the citations from this article in formats compatible with various reference manager tools)
Operation regimes of spinal circuits controlling locomotion and the role of supraspinal drives and sensory feedback
eLife 13:RP98841.
https://doi.org/10.7554/eLife.98841.3


