Ih block reveals separation of timescales in pyloric rhythm response to temperature changes in Cancer borealis
- Biology Department, Brandeis University, United States
- Volen Center and Biology Department, Brandeis University, United States
Figures
Figure 1 with 1 supplement
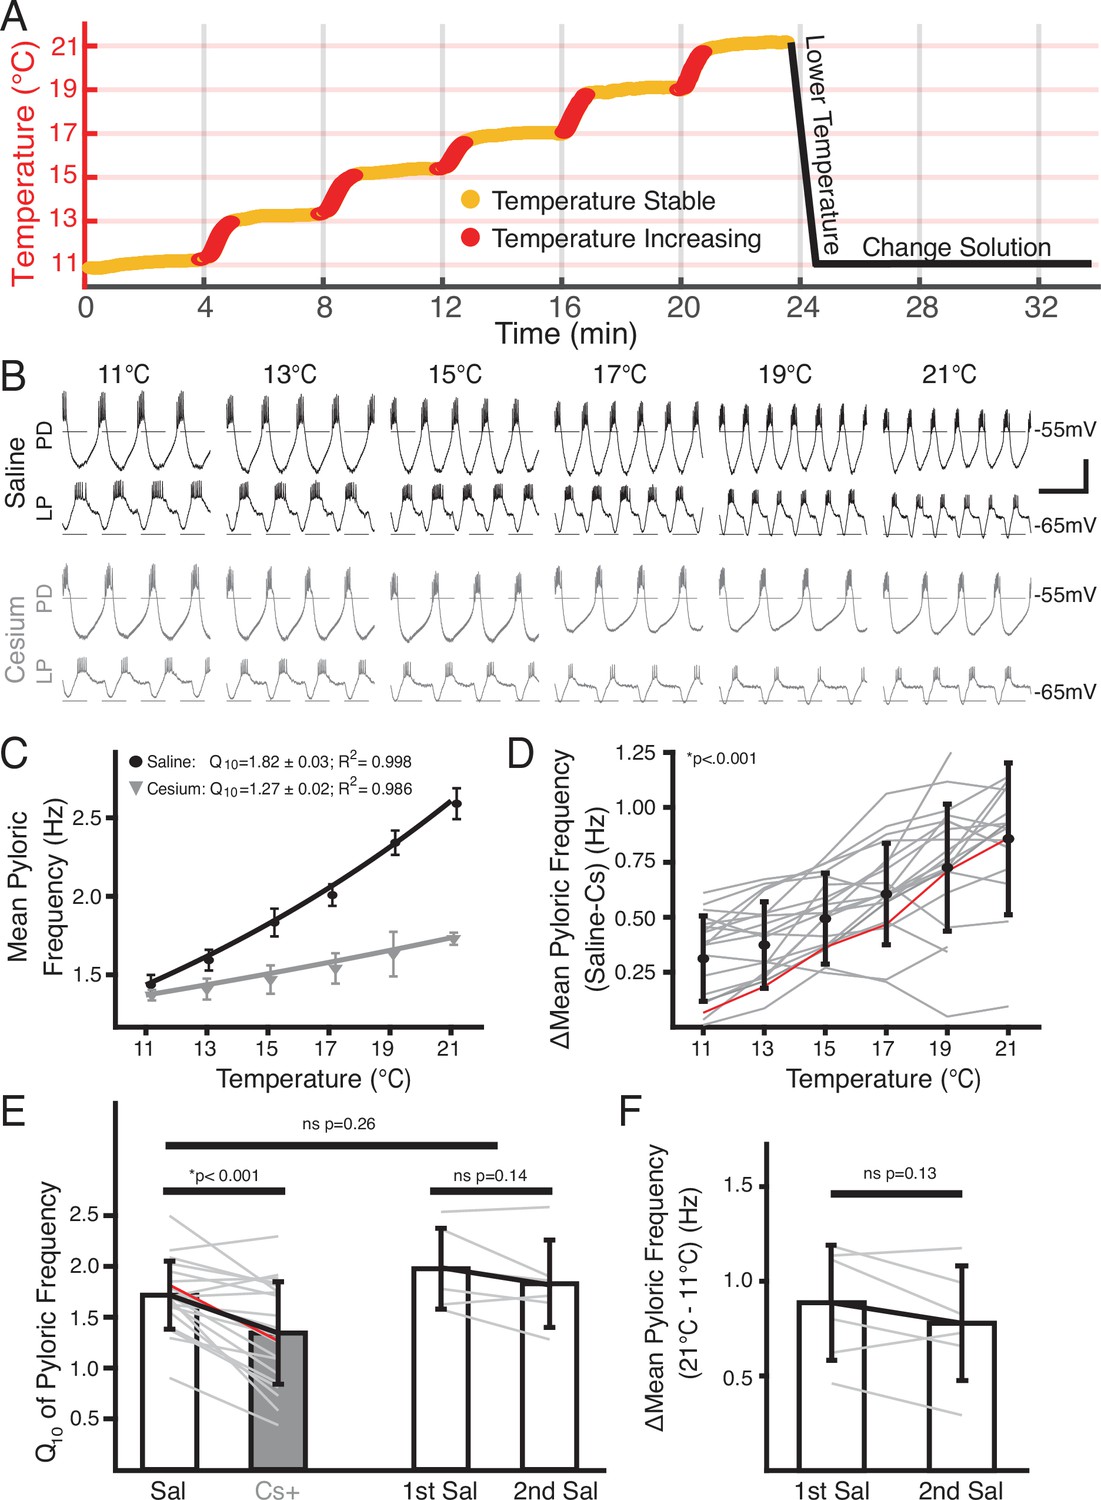
Temperature-induced frequency increase was diminished by Cs+ application.
(A) Basic experimental protocol. Experiment began in saline or Cs+ solution (order randomized) at 11°C. The superfusion solution temperature was changed in steps of 2°C and allowed to stabilize over 4 min. Red represents times when the temperature was increasing, yellow when the temperature was considered stable. After the holding period at 21°C the preparation was returned to 11°C. The solution was then changed to the remaining condition over 10 min and the step protocol was repeated. (B) Intracellular recordings from a single preparation while in saline (top) and Cs+ (bottom) at each holding temperature (yellow in A) from 11°C to 21°C. Within a condition the top trace is pyloric dilator (PD) and the bottom trace is lateral pyloric (LP). Burst frequency increased as temperature increased in saline, but less so in Cs+. Scalebar: horizontal = 1 s, vertical = 20 mV. (C) Mean frequency ± SD at each holding temperature across conditions from a different preparation than in B. Line represents the best fit Q10 equations for each condition; preparation in saline had a larger Q10 than in Cs+ and as such a larger frequency increase with temperature. (D) Mean ± SD difference in frequency between saline and Cs+ across temperatures and preparations. As temperature increased, the difference between a preparation’s frequency in saline and Cs+ significantly increased (one-way repeated measures ANOVA [F(5,85) = 43.259, p<0.001, N=21]). Gray lines represent individual experiments, red line represents experiment depicted in (C). (E) Q10 was significantly lower in Cs+ than in saline (paired Student’s t-test, p<0.001, N=21). Q10 was not significantly different in two consecutive saline temperature changes (paired Student’s t-test, p=0.14, N=6). Q10 was also not significantly different between the mean Q10 of the experiments with two saline temperature changes those that experienced one saline and one Cs+ temperature change (two-sample t-test, p=0.26). Bars are mean ± SD, individual lines represent individual experiments, red line represents experiment depicted in C. (F) Overall change in mean pyloric frequency from 11°C to 21°C was not significantly different between first and second temperature change in saline (paired Student’s t-test, p=0.14, N=6).
Figure 1—figure supplement 1
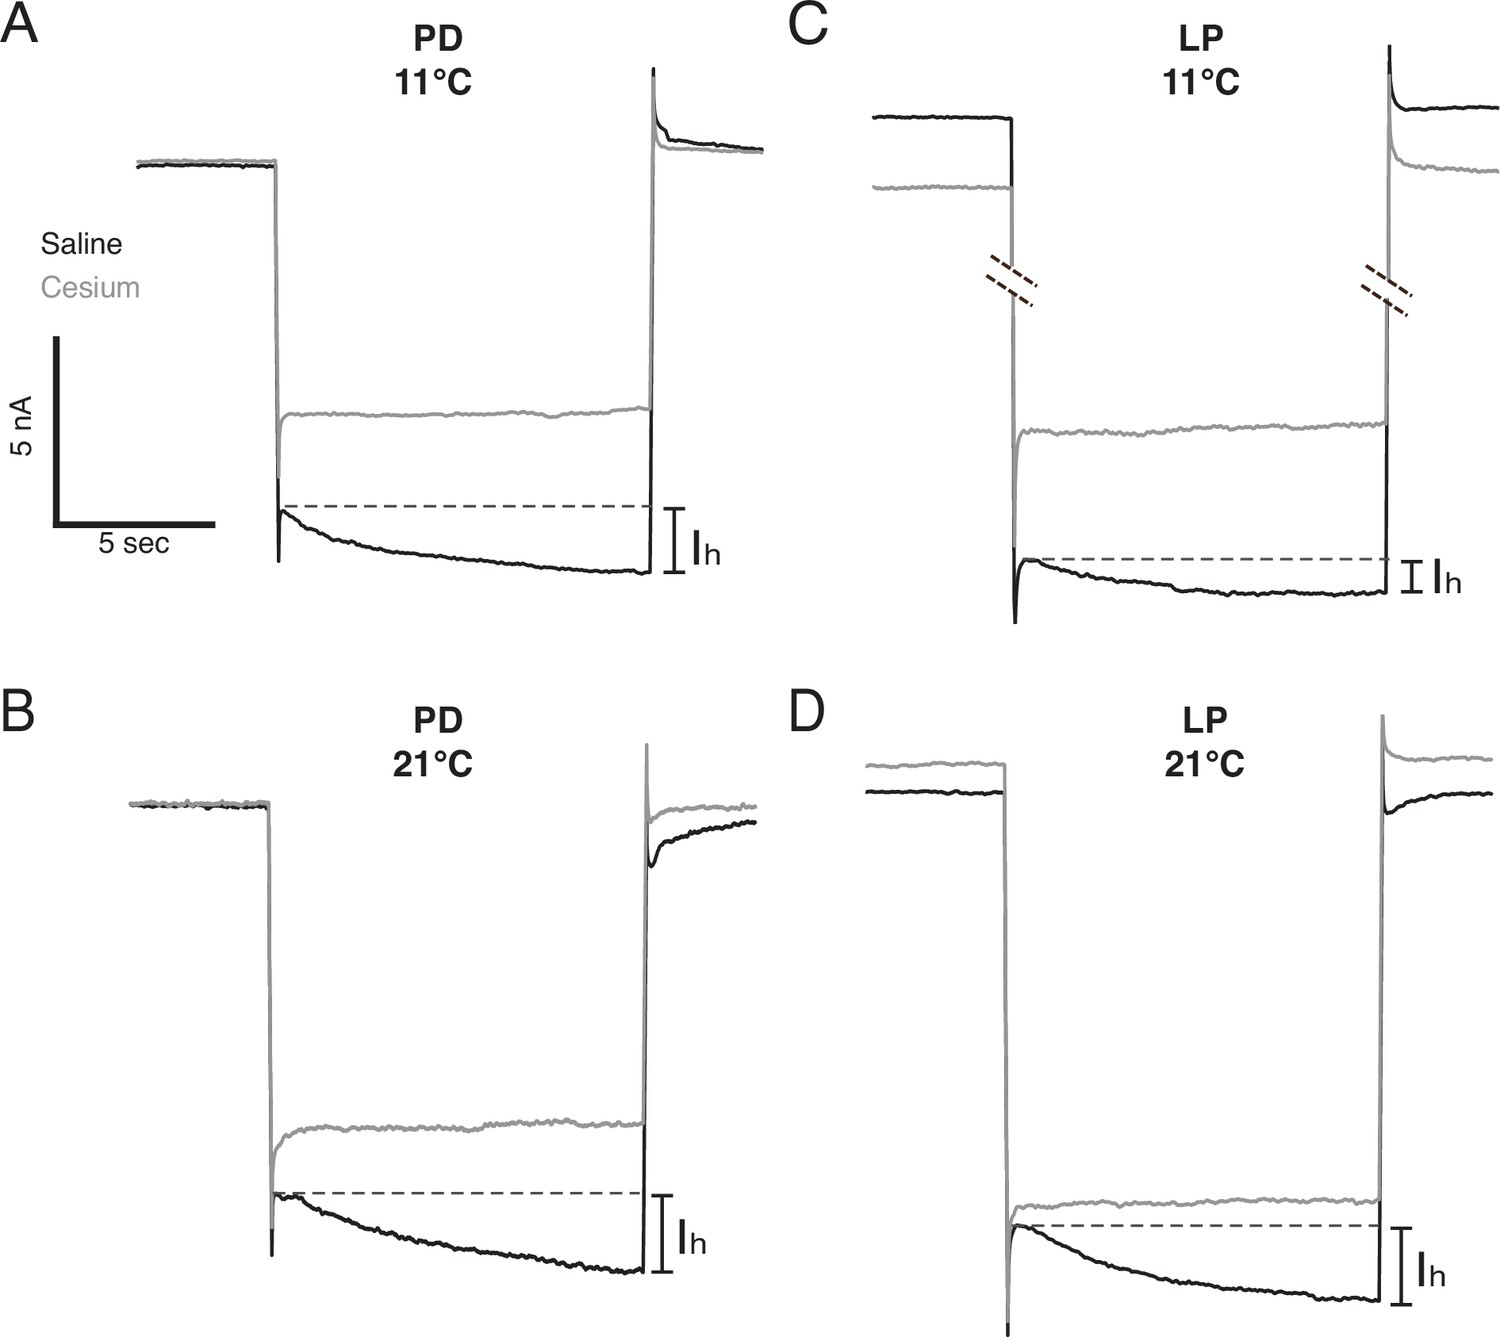
Voltage clamp traces of pyloric dilator (PD) and lateral pyloric (LP) cells at the temperature extrema of these experiments in both saline and Cs+.
Cells were held at –50 mV for 9 s, then –110 mV for 12 s before being returned to –50 mV for 4 s. In saline, there is a notable sag current (Ih) when the cell is held at –110 mV (black traces, difference in initial and steady-state current highlighted by dashed line). This sag current is absent when the cell is in Cs+ (gray traces). (A) PD cell at 11°C. (B) PD cell at 21°C. (C) LP cell at 11°C. (D) LP cell at 21°C. Each cell is from a separate preparation.
Figure 2
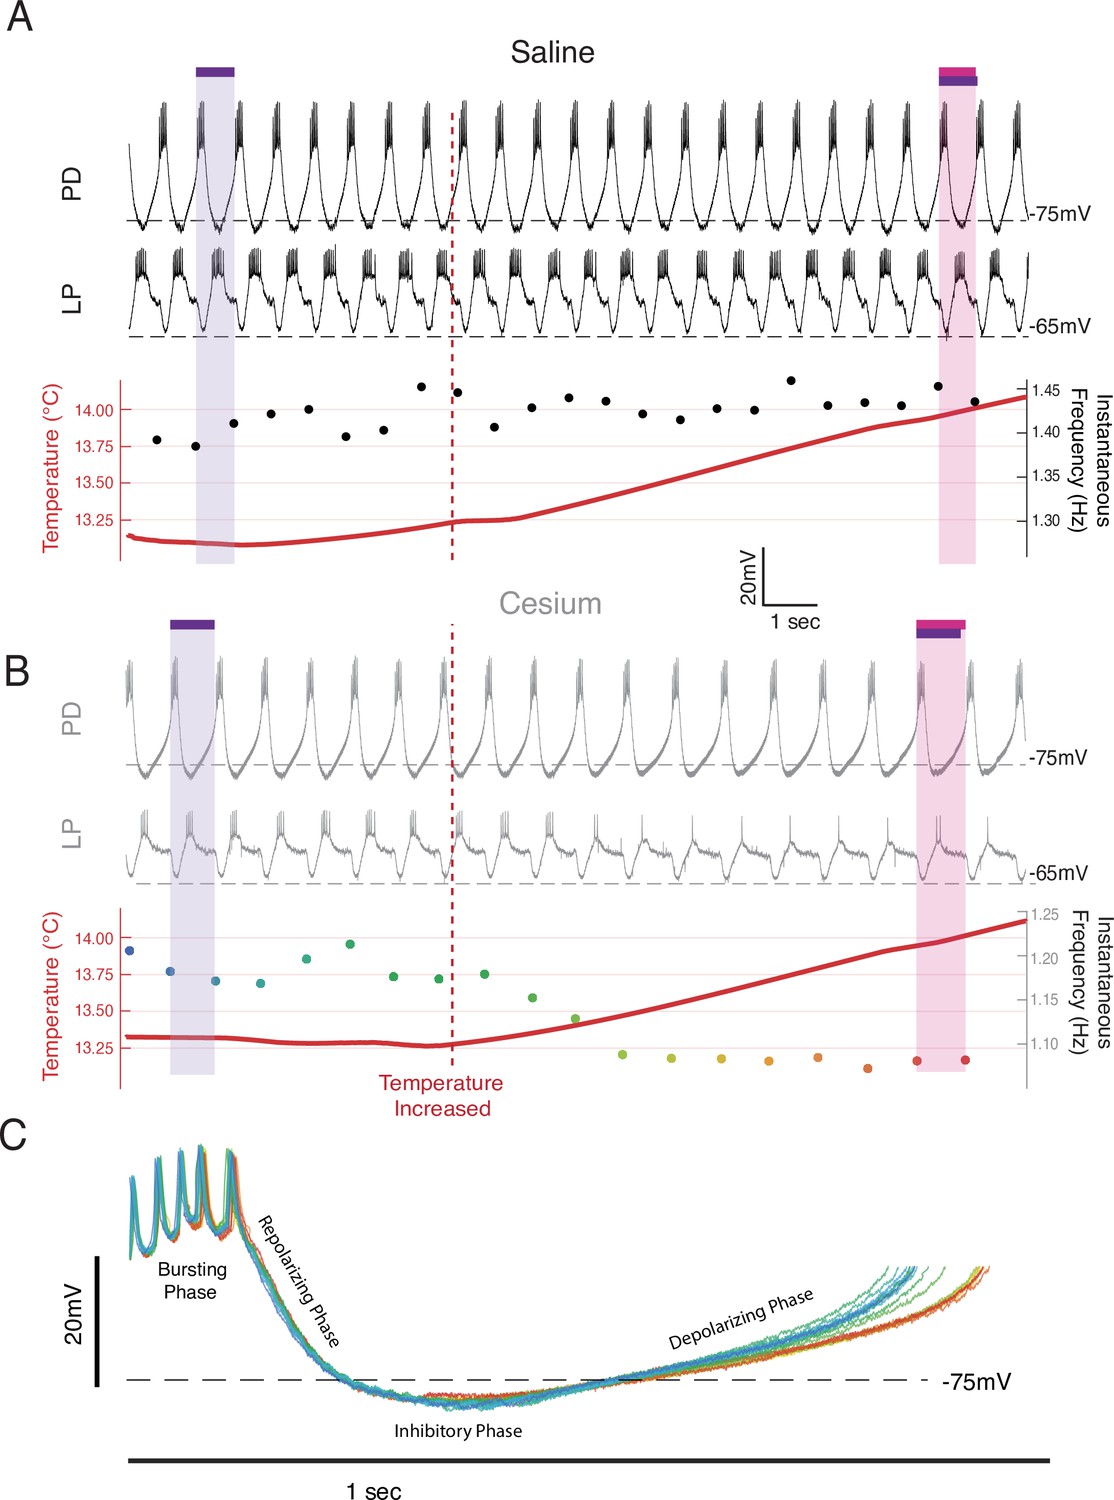
Frequency decreased when temperature was increased in Cs+ through an elongation of the depolarizing phase.
Example from a single preparation as temperature was changed from 13°C toward 15°C in saline (A) and Cs+ (B, C). (A, B) Top: the intracellular recording from pyloric dilator (PD); Middle: simultaneous intracellular recording from lateral pyloric (LP); Bottom: simultaneous temperature (red; left axis) and instantaneous frequency (right axis). Purple bar highlights one pyloric period before the temperature was increased, while the magenta bar highlights one pyloric period after. (A) In saline when the temperature increased (maroon line), the period decreased as highlighted by the magenta bar being shorter than the purple bar. (B) In Cs+, the period increased after the temperature shift, as highlighted by the magenta bar being longer than the purple bar. The same scale is used in both A and B. (C) Individual PD cycles from B aligned to the first spike. Coloration indicates when an individual cycle occurred as keyed by the instantaneous frequency trace in B. Increased period corresponds to an elongation of the depolarizing phase and a maintenance of the bursting and repolarization phases.
Figure 3
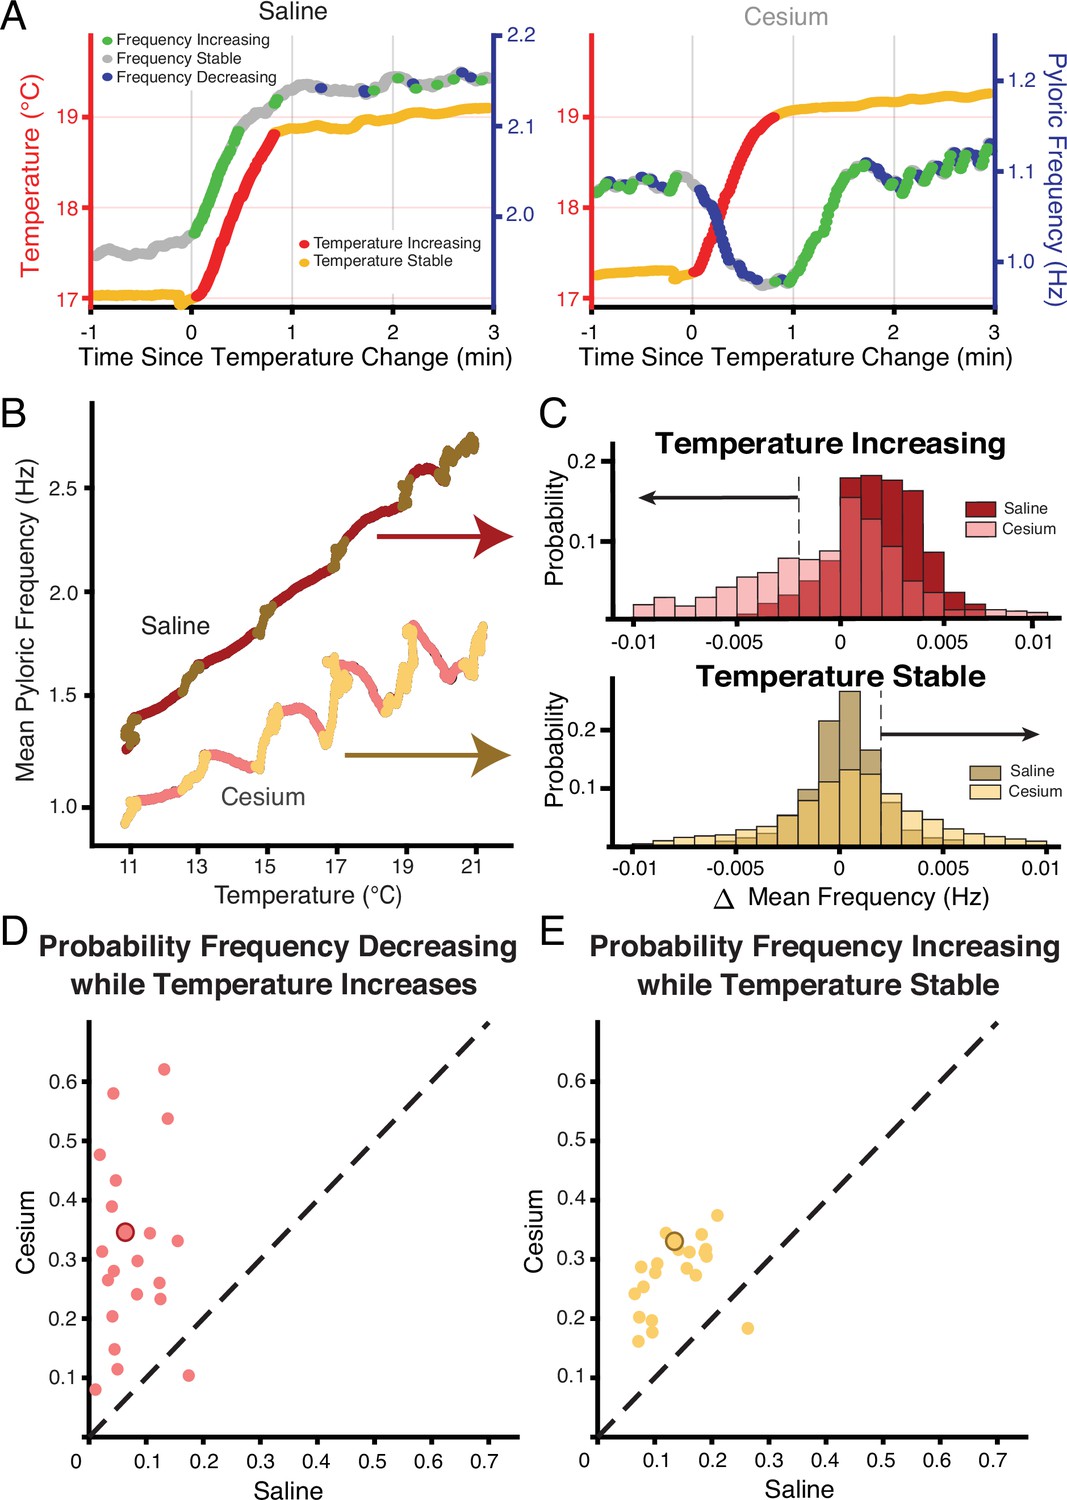
Across preparations frequency was more likely to decrease when temperature increased and increase when temperature was stable in Cs+ compared to saline.
(A) Example of a temperature step from 17°C to 19°C in saline (left) and Cs+ (right). Left axis and warm colors denote temperature, with reds denoting temperature increasing by more than 0.01°C/pyloric cycle, and yellows denoting stable temperature (change less than 0.01°C/pyloric cycle). Right axis and cool colors denote frequency, with green indicating mean frequency increase >0.002 Hz, blue indicating mean frequency decrease >0.002 Hz, and gray stable frequency between these bounds. In saline, frequency change closely mirrored temperature change. In Cs+, frequency decreased (blue) when temperature increased (red) and increased (green) when temperature stabilized (yellow). (B) Mean pyloric frequency as a function of temperature for a single experiment in both saline and Cs+. Note how in saline the frequency increased largely monotonically along the entire temperature range, increasing most when temperature increased (maroon). Conversely in Cs+ the frequency displayed a non-monotonic, sawtooth-like pattern, decreasing when temperature increased (pink) and increasing when temperature was stable (light yellow). (C) For the same experiment as in B, distribution of mean change in frequency for cycles when the mean temperature was increasing (top) or when the temperature was stable (bottom), definition of temperature same as in A, B, Figure 1A. When the temperature increased, the change in mean frequency was more likely to decrease in Cs+ than in saline. When temperature was stable, the change in mean frequency was more likely to increase in Cs+ than in saline. Dashed line and black arrows highlight the criteria for decreasing and increasing in frequency used for quantification in D and E. (D) Across experiments, the probability of decreasing mean frequency while temperature increased in Cs+ or in saline. For 20/21 of experiments, the probability was higher in Cs+ than saline. Experiment from B, C is highlighted by the larger, outlined point. (E) Across experiments, the probability of having an increasing frequency while temperature was stable. For 20/21 of experiments, the probability was higher in Cs+ than saline. Again, experiment from B, C is highlighted by the larger, outlined point.
Figure 4
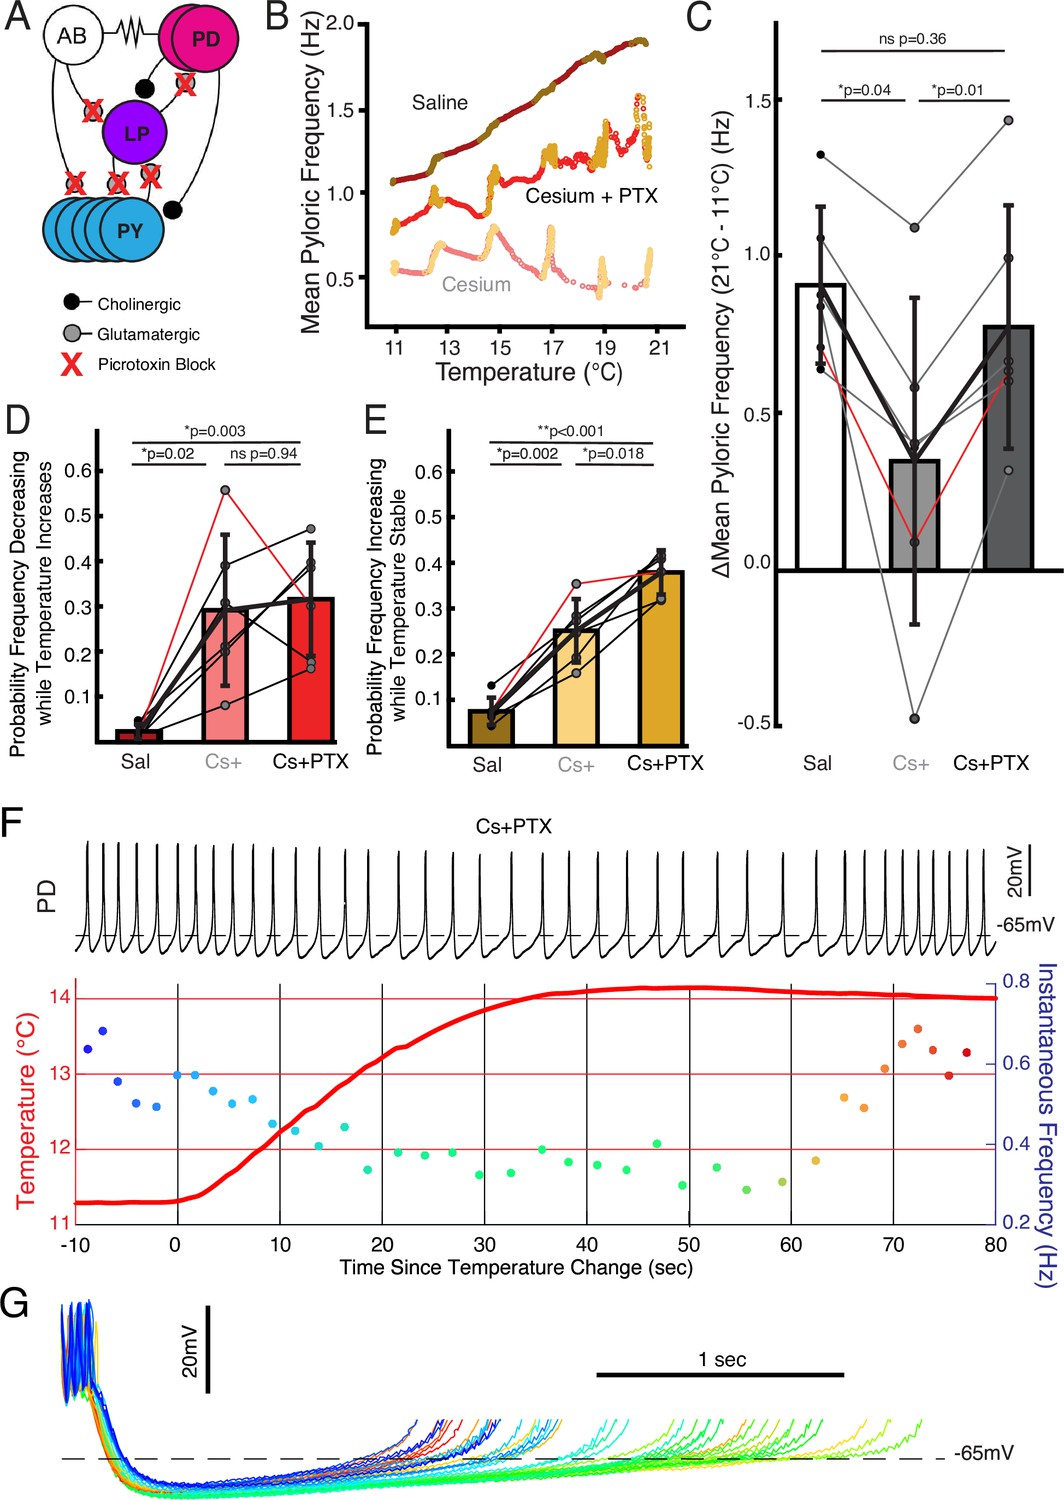
Follower neurons mediated pyloric frequency-temperature sensitivity change by Cs+, while non-monotonic temperature response was mediated by the pacemaker kernel neurons.
(A) Wiring diagram of the pyloric network, illustrating the pacemaker kernel neurons (anterior burster [AB] and pyloric dilator [PD]) and the follower neurons (lateral pyloric [LP] and pyloric [PY]). The only feedback synapse to the pacemaker kernel neurons, LP to PD, is blocked by picrotoxin (PTX). (B) Mean pyloric frequency as a function of temperature for a single experiment in saline, Cs+, and Cs++PTX. Red dots denote temperature increasing by more than 0.01°C/cycle, yellow dots denote stable temperature (change less than 0.01°C/cycle). In Cs++PTX, the steady-state increase in frequency (yellows) as a function of temperature was similar to saline (trajectory roughly parallel). However, in Cs++PTX pyloric frequency displayed non-monotonic responses to periods of transitory temperature increase as in Cs+ alone. (C) There was a significant effect of condition on the change in frequency between 11°C and 21°C for N=6 experiments as a measure of temperature sensitivity (one-way repeated measures ANOVA; F(2,10)=12.272, p=0.002). Post hoc Tukey’s honestly significant difference (HSD) indicated the frequency changed significantly less in Cs+ alone compared to either control or Cs++PTX. Experiment from B is highlighted in red. (D) There was a significant effect of condition on the probability of frequency decrease during periods of temperature increase for N=6 experiments (one-way repeated measures ANOVA; F(2,10)=13.077, p=0.002). HSD indicated the probability was significantly higher in both Cs+ and Cs++PTX compared to control. Experiment from B is highlighted in red. (E) There was a significant effect of condition on the probability of frequency increase during periods of temperature stability for N=6 experiments (one-way repeated measures ANOVA; F(2,10)=69.572, p<0.001). HSD indicated the probability was significantly greater in Cs+ than in control and significantly greater in Cs++PTX than in Cs+. Experiment from B is highlighted in red. This elevated probability of increase may partially account for the lack of overall temperature-sensitivity decrease in Cs++ PTX compared to Cs+ alone in C. (F) Same scheme as Figure 2B and C. In Cs++PTX frequency decreased when temperature rose and eventually increased once temperature stabilized. (G) Individual cycles from F aligned to the first spike, colored as in the instantaneous frequency trace in F. When the temperature increased (greenish traces), the depolarizing phase dramatically elongated and there was some increased hyperpolarization. After approximately 30 s of stable temperature, frequency increased and the depolarization accelerated again (reddish traces).
Figure 5
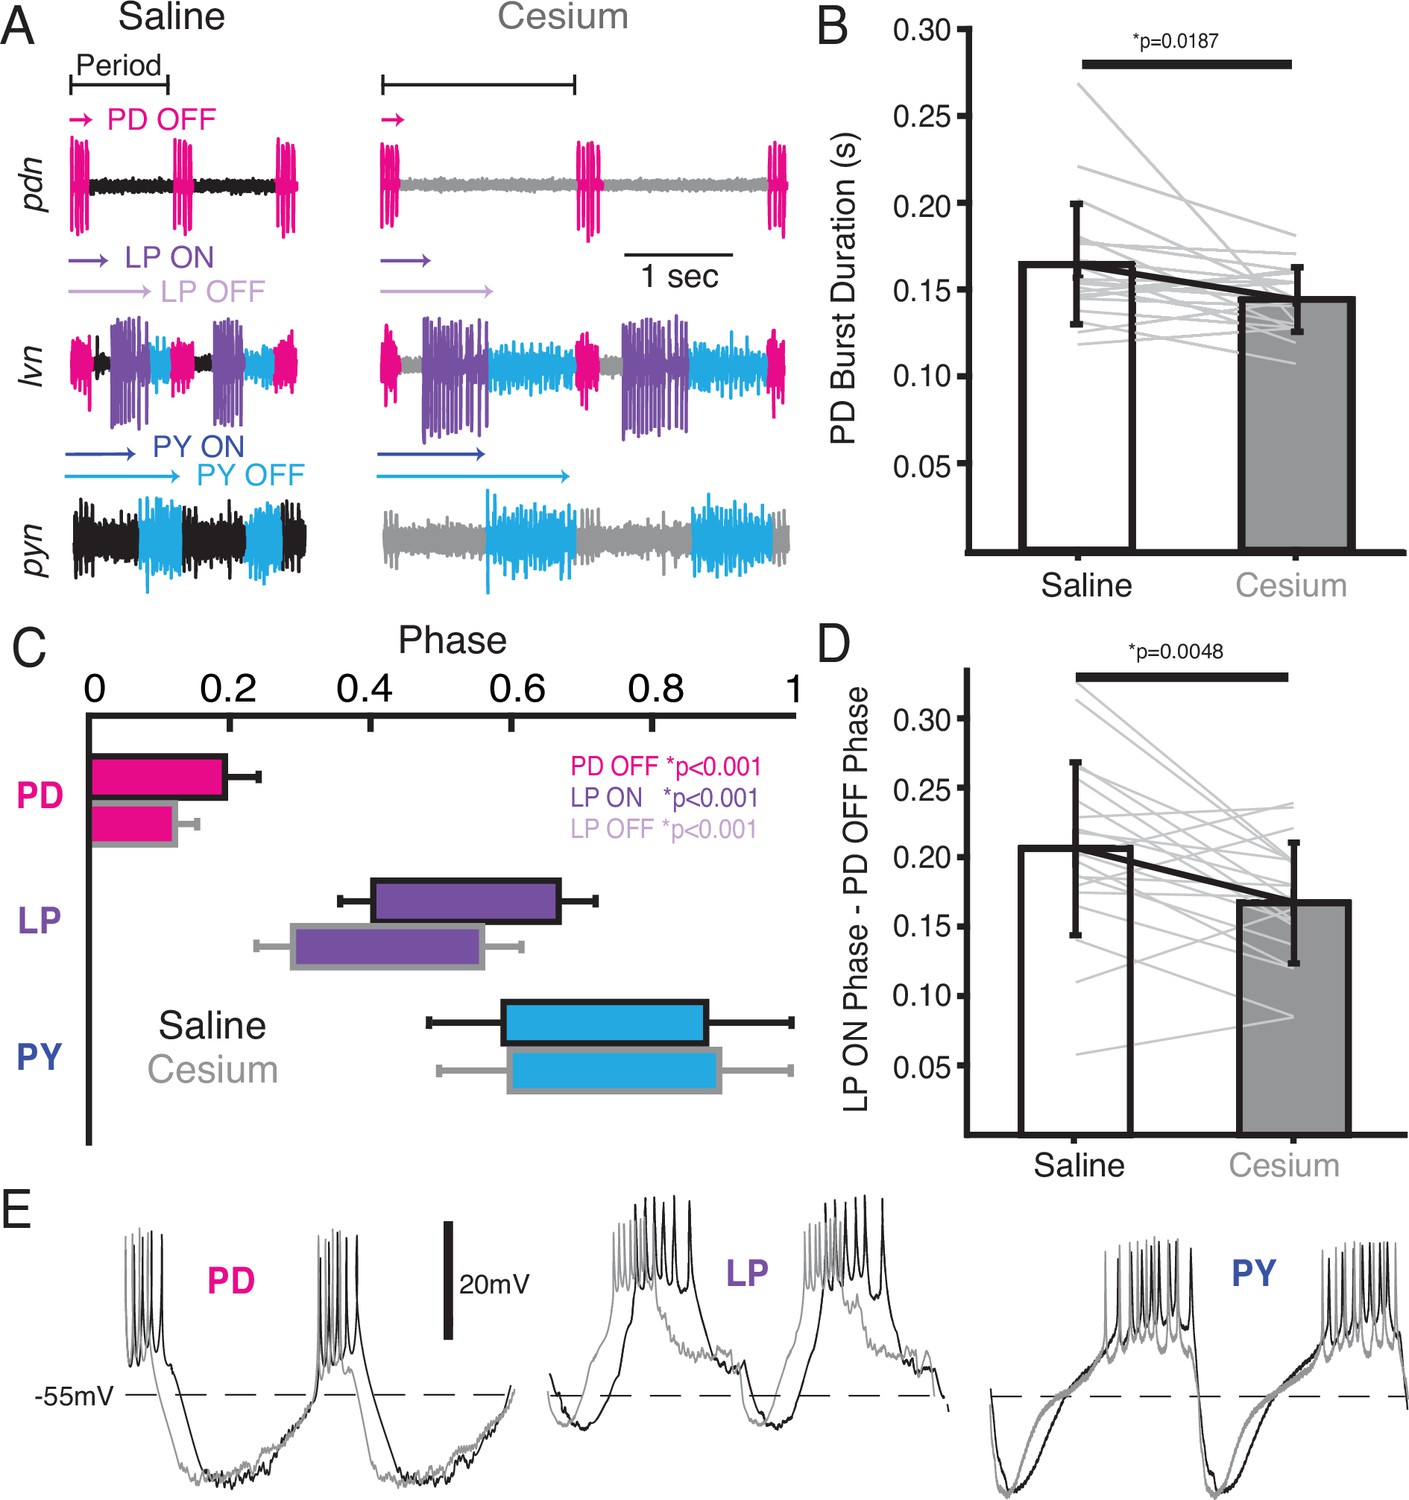
In Cs+, pyloric dilator (PD) OFF, lateral pyloric (LP) ON, and LP OFF were all advanced compared to saline.
(A) Extracellular example traces of two pyloric cycles at 11°C recorded simultaneously on the pyloric dilator nerve (pdn) (top), lateral ventricular nerve (lvn) (middle), and pyloric constrictor nerve (pyn) (bottom) in saline (left) and from the same experiment in Cs+ (right). PD spikes are colored magenta, LP purple, and pyloric (PY) blue. Onset and offset delay of each neuron relative to the beginning of the period (PD burst) are indicated by arrows. (B) Duration of PD burst was marginally but significantly shorter in Cs+ than saline (Wilcoxon signed-rank test, N=21, p=0.019). (C) Phase plot of saline and Cs+ colored as in A. PD OFF, LP ON, and LP OFF are all advanced in Cs+ compared to saline. (D) The phase delay between LP ON and PD OFF is smaller in Cs+ than in saline (paired Student’s t-test, N=21, p=0.0048). As such, LP ON is more advanced than one would expect if the system was maintaining a constant phase delay between PD OFF and LP ON. (E) Two periods of example intracellular recordings from PD (left), LP (middle), and PY (right) in saline (black) and Cs+ (gray) scaled to the same period. Each column is from a different experiment. Note the advance of PD OFF, LP ON, and LP OFF with relatively little other change in the overall trajectory of the voltage trace.
Figure 6
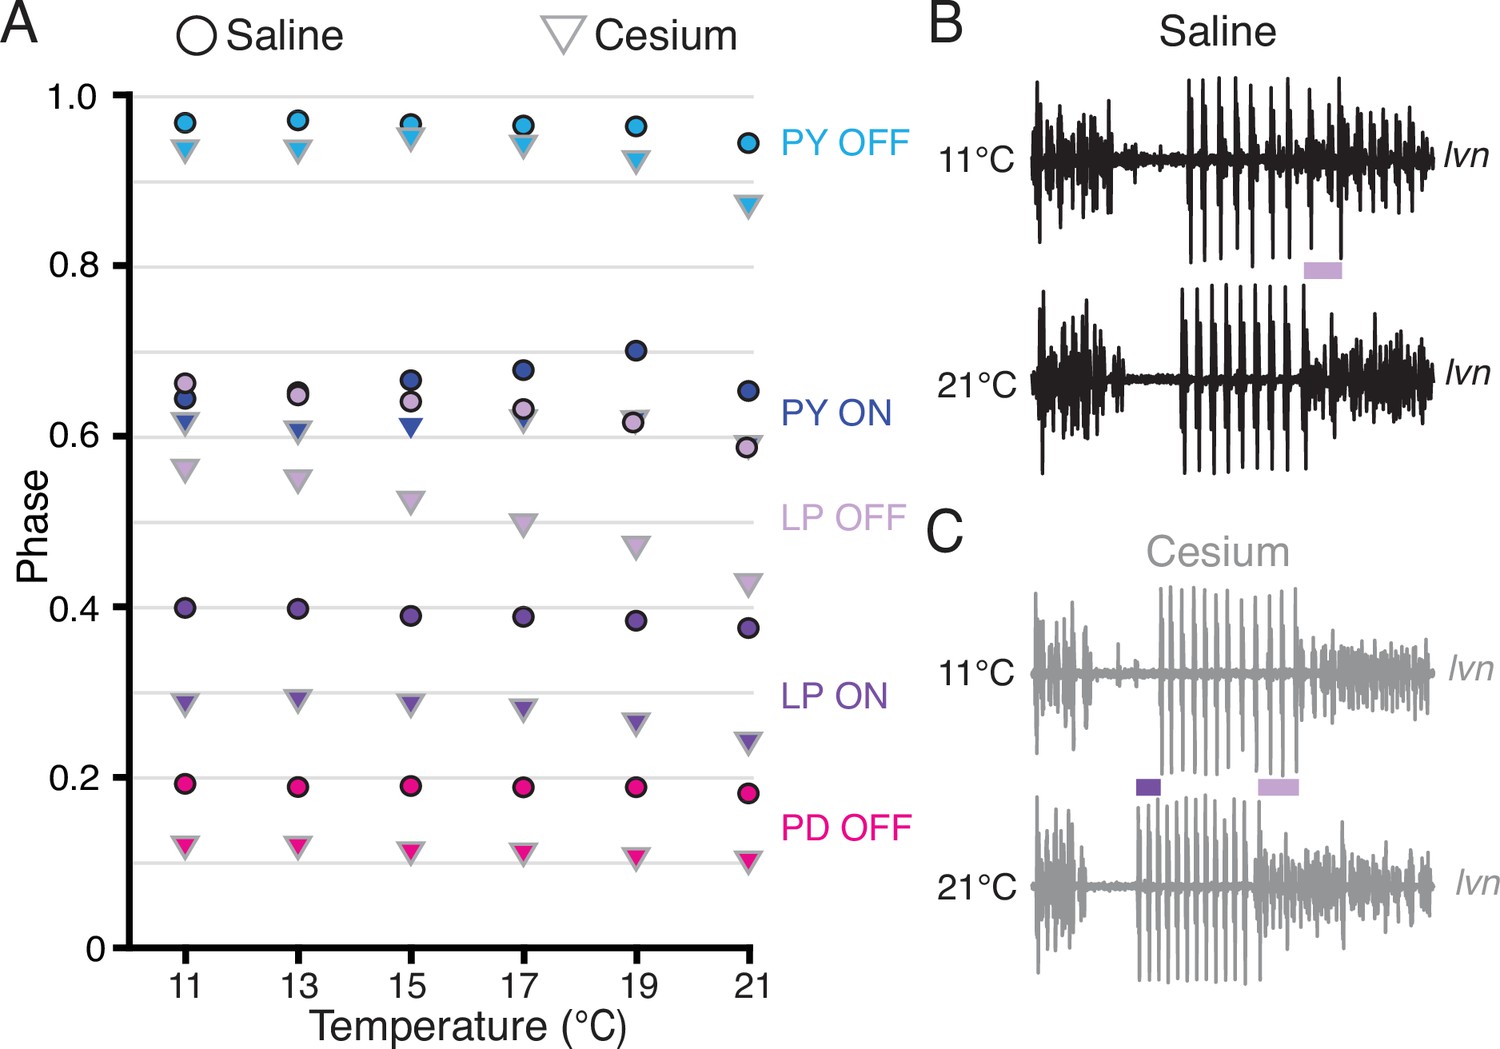
Phase advanced across temperatures for lateral pyloric (LP) OFF in both condition; LP ON phase also advanced with increased temperature in Cs+.
(A) Mean phase as a function of temperature in both saline (circles) and Cs+ (triangles) (N=21 for PD and LP, N=12 for PY). Error bars have been omitted for clarity. LP OFF advanced as temperature increased in both saline and Cs+, though the advance in Cs+ was more dramatic. LP ON also significantly advanced with temperature in Cs+. Criteria for maintaining constancy was a mean slope of phase vs temperature across experiments that was significantly different from zero according to a Wilcoxon signed-rank test (if not-normally distributed) or a paired Student’s t-test (if normally distributed), Bonferoni-adjusted. (B) Single period of pyloric rhythm recorded extracellularly on the lateral ventricular nerve (lvn) at 11°C (top) and 21°C (bottom) scaled to the same period. The advance in LP OFF is highlighted by the lilac bar. (C) Same preparation as in B but while in Cs+. Lilac bar highlights the LP OFF phase advance, purple bar highlights LP ON advance.
Tables
Table 1
Mean phase of pyloric neurons in saline and Cs+ at 11°C.
Phases that were significantly different in the two conditions are bolded. T=paired Student’s t-test, W=Wilcoxon signed-rank test.
| Phase | Saline | Cs+ | Significance test | N | p-Value |
|---|---|---|---|---|---|
| PD OFF | 0.19±0.04 | 0.12±0.03 | T | 21 | <0.001* |
| LP ON | 0.40±0.05 | 0.29±0.05 | T | 21 | <0.001* |
| LP OFF | 0.66±0.05 | 0.56±0.06 | T | 21 | <0.001* |
| PY ON | 0.58±0.11 | 0.60±0.11 | T | 12 | 0.86 |
| PY OFF | 0.87±0.20 | 0.90±0.19 | W | 12 | 0.91 |
Additional files
Download links
A two-part list of links to download the article, or parts of the article, in various formats.
Downloads (link to download the article as PDF)
Open citations (links to open the citations from this article in various online reference manager services)
Cite this article (links to download the citations from this article in formats compatible with various reference manager tools)
Ih block reveals separation of timescales in pyloric rhythm response to temperature changes in Cancer borealis
eLife 13:RP98844.
https://doi.org/10.7554/eLife.98844.3


