Reevaluating the neural noise in dyslexia using biomarkers from electroencephalography and high-resolution magnetic resonance spectroscopy
- Laboratory of Language Neurobiology, Nencki Institute of Experimental Biology, Polish Academy of Sciences, Poland
- Faculty of Physics, University of Warsaw, Poland
- Laboratory of Brain Imaging, Nencki Institute of Experimental Biology, Polish Academy of Sciences, Poland
Figures
Figure 1
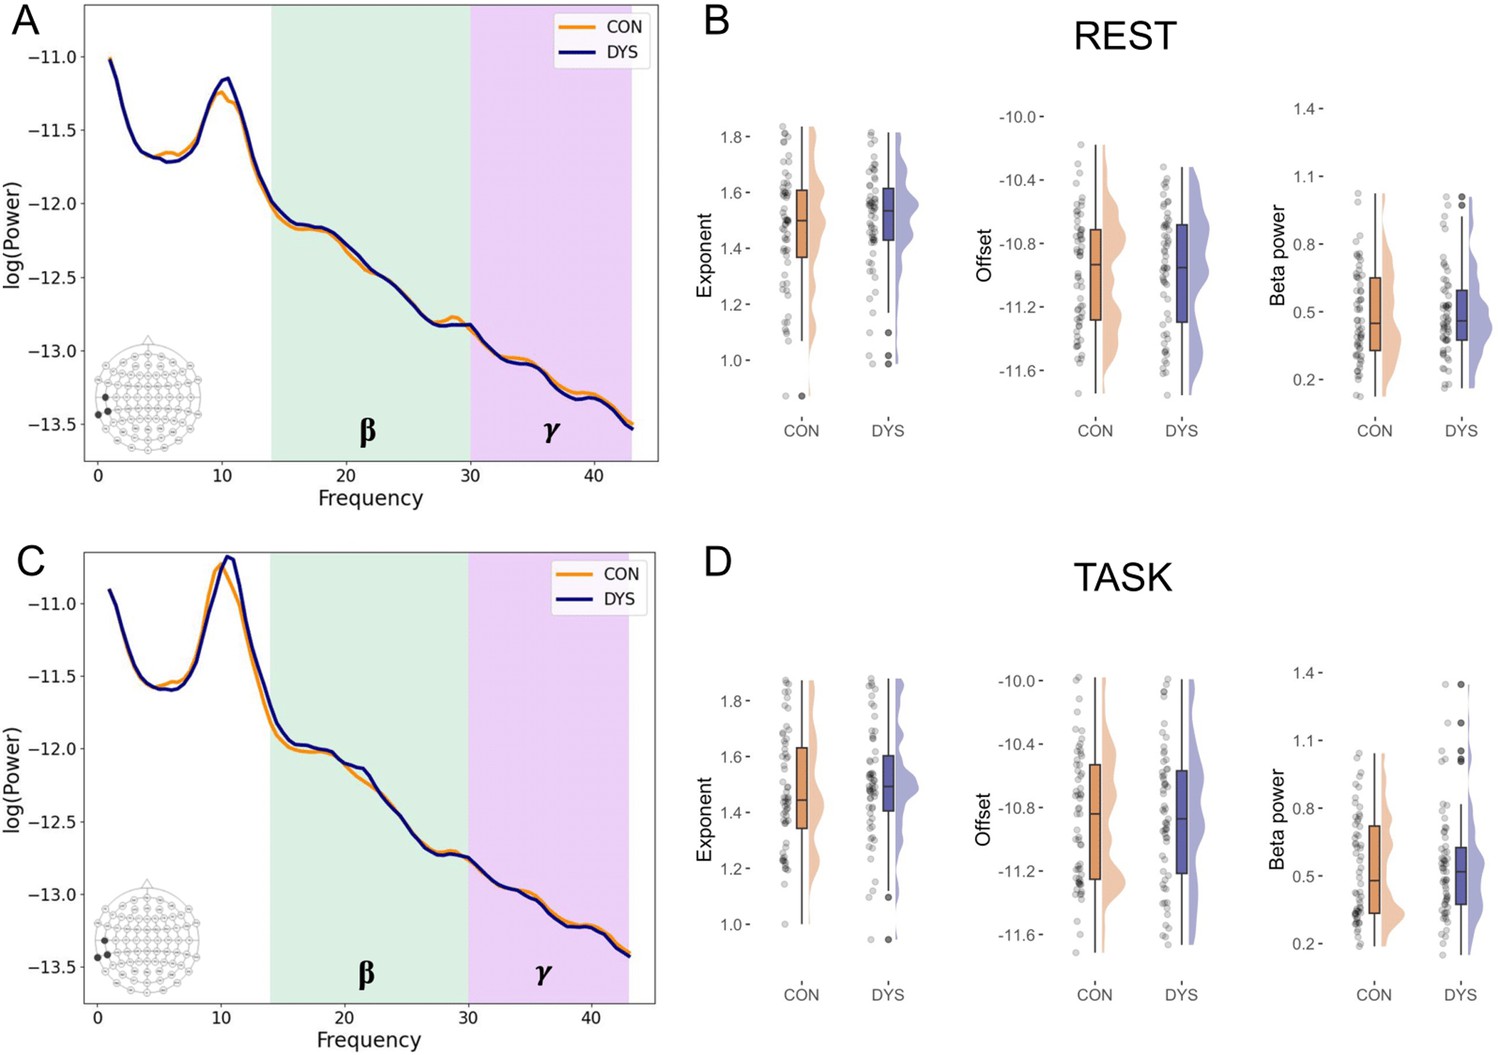
Selected results for the electroencephalography (EEG) excitatory and inhibitory (E/I) balance biomarkers.
n = 119 (DYS n = 59, CON n = 60). (A) Power spectral densities averaged across three electrodes (T7, TP7, TP9)corresponding to the left superior temporal sulcus (STS) separately for dyslexic (DYS) and control (CON) groups at rest and (C) during the language task. (B) Plots illustrating results for the exponent, offset, and the beta power from the left STS electrodes at rest and (D) during the language task.
Figure 2 with 1 supplement
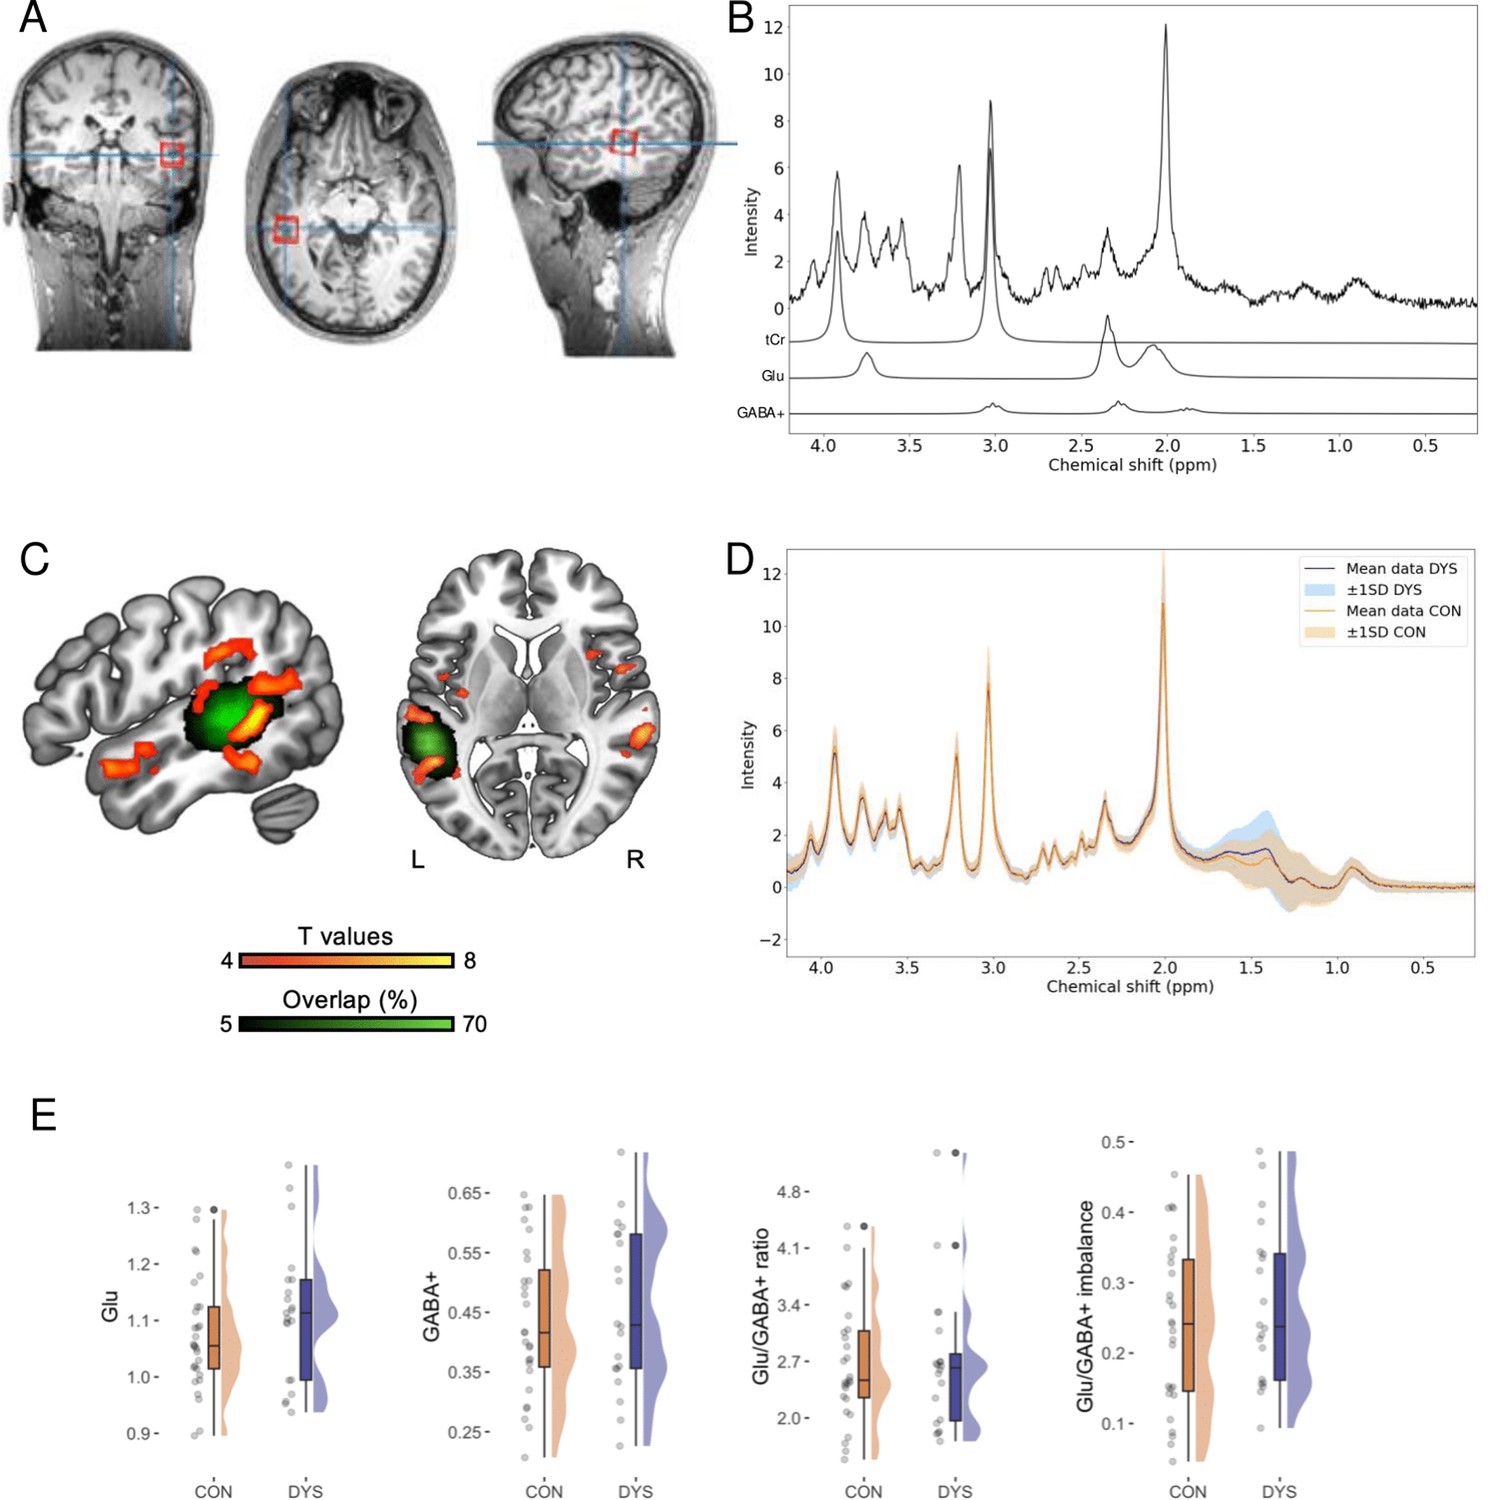
Selected results for the magnetic resonance spectroscopy (MRS) excitatory and inhibitory (E/I) balance biomarkers.
(A) Sample MRS voxel localization. (B) Sample MRS spectrum with individual total creatine (tCr), Glu, and GABA+ contributions plotted below. (C) Group results (CON>DYS) from the fMRI localizer task for words compared to the control stimuli (p<0.05 FWE cluster threshold) and overlap of the MRS voxel placement across participants. n = 50 (DYS n = 21, CON n = 29). (D) MRS spectra separately for the dyslexic (DYS) and control (CON) groups. n = 50 (DYS n = 21, CON n = 29). (E) Plots illustrating results for the Glu, n = 50 (DYS n = 21, CON n = 29), GABA+, n = 47 (DYS n = 20, CON n = 27), Glu/GABA+ ratio, n = 47 (DYS n = 20, CON n = 27), and the Glu/GABA+ imbalance, n = 47 (DYS n = 20, CON n = 27).
Figure 2—figure supplement 1
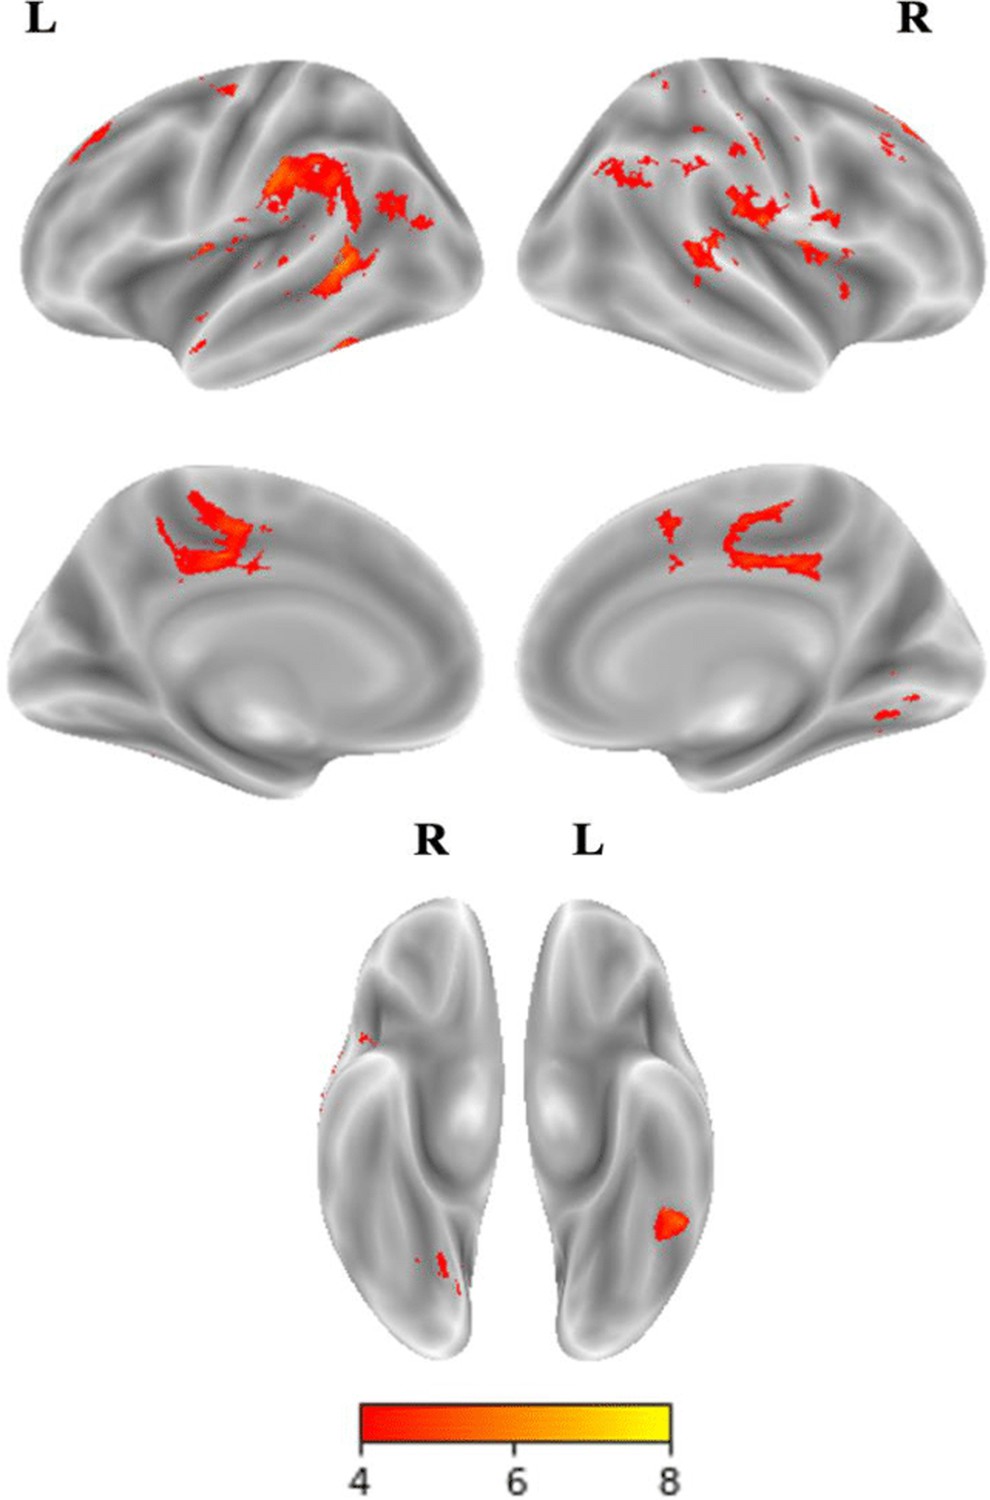
Main effect of group CON>DYS for both visual (words > false fonts) and auditory runs (words > words backward) from the fMRI localizer task.
Note: CON – control group, DYS – dyslexic group, L – left hemisphere, R – right hemisphere. Results reported at p<0.001 height threshold corrected for multiple comparisons using p<0.05 FWE cluster threshold. n = 50 (DYS n = 21, CON n = 29).
Figure 3
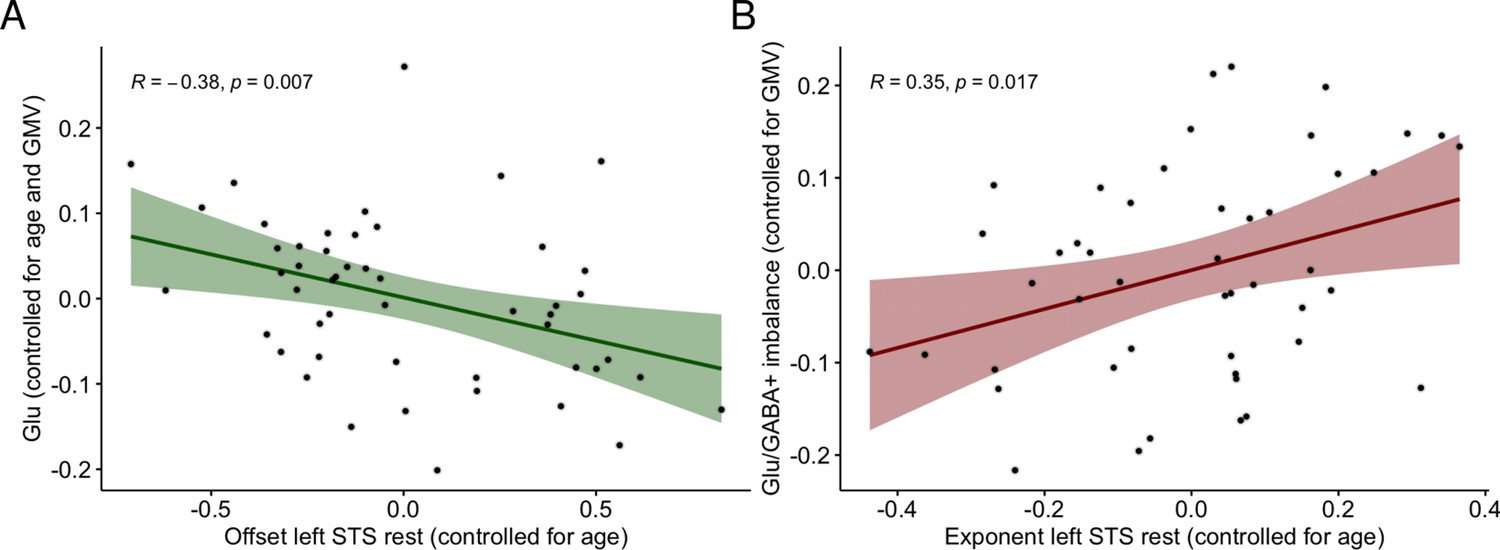
Relationships between electroencephalography (EEG) and magnetic resonance spectroscopy (MRS) excitatory and inhibitory (E/I) balance biomarkers.
(A) Semi-partial correlation between offset at rest in the left superior temporal sulcus (STS) electrodes and Glu controlling for age and gray matter volume (GMV), n = 50 (DYS n = 21, CON n = 29). (B) Semi-partial correlation between exponent at rest in the left STS electrodes (controlled for age) and Glu/GABA+ imbalance (controlled for GMV), n = 47 (DYS n = 20, CON n = 27).
Figure 4
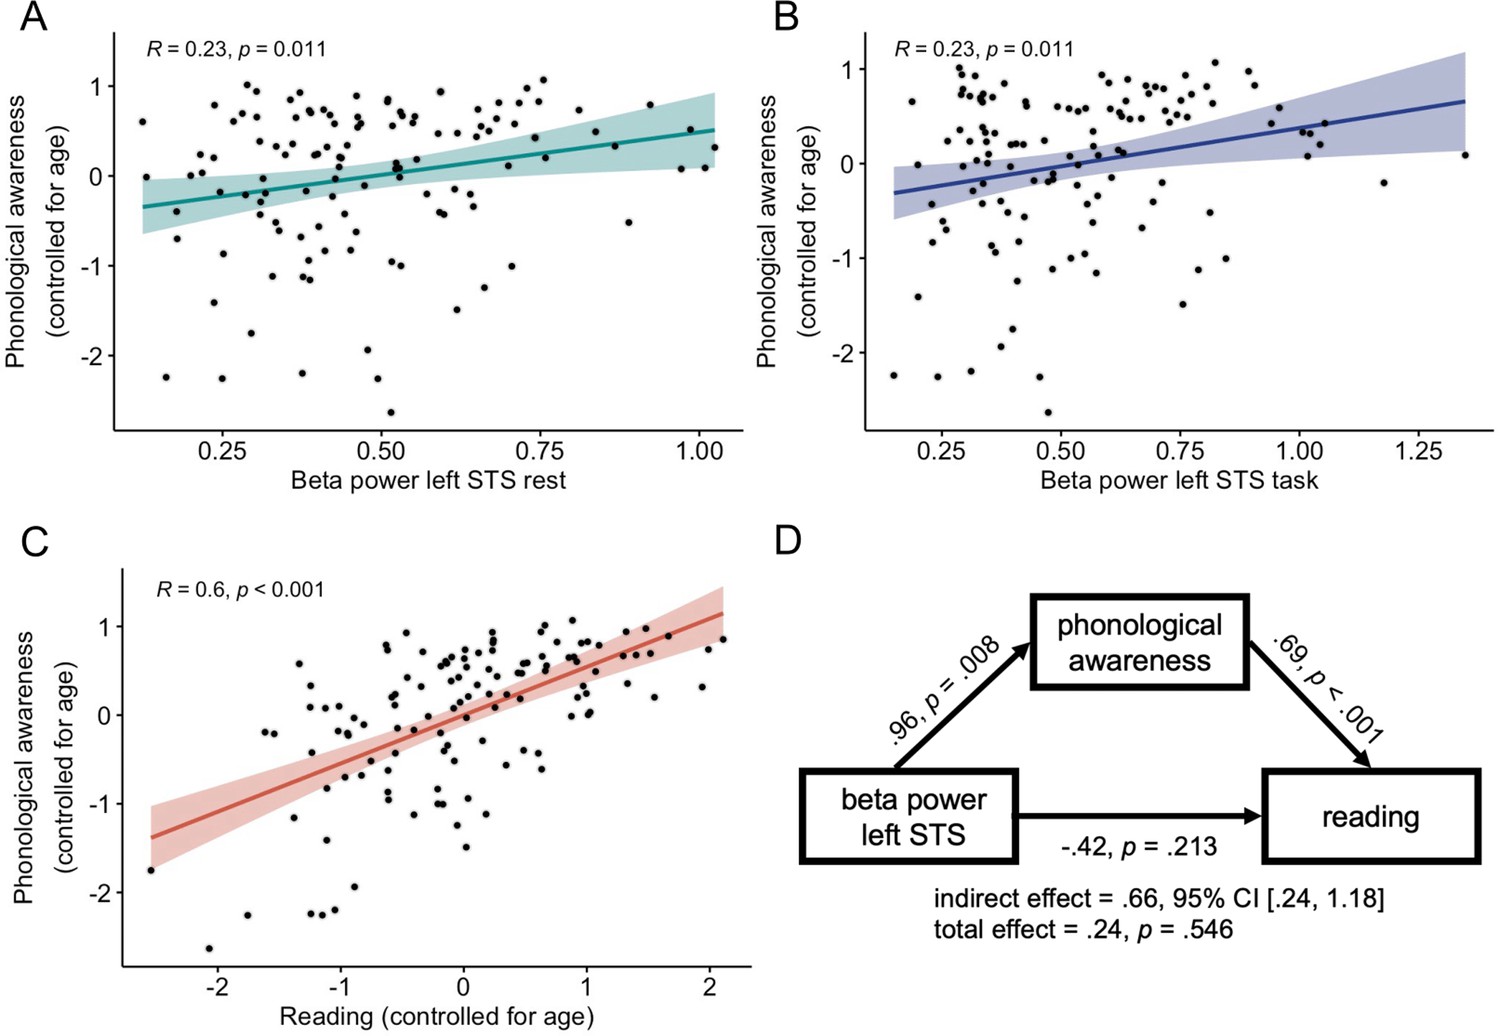
Associations between beta power, phonological awareness, and reading.
n = 119 (DYS n = 59, CON n = 60). (A) Semi-partial correlation between phonological awareness controlling for age and beta power (in the left superior temporal sulcus [STS] electrodes) at rest and (B) during the language task. (C) Partial correlation between phonological awareness and reading controlling for age. (D) Mediation analysis results. Unstandardized b regression coefficients are presented. Age was included in the analysis as a covariate. 95% CI – 95% confidence intervals; left STS – values averaged across three electrodes corresponding to the left superior temporal sulcus (T7, TP7, TP9).
Tables
Table 1
Demographic and behavioral characteristics of the entire sample of 120 participants.
| DYS28 F, 32 M | CON28 F, 32 M | t(df) | p | Cohen’s d | BF10 | |||
|---|---|---|---|---|---|---|---|---|
| M | SD | M | SD | |||||
| Demographics | ||||||||
| Age | 19.41 | 3.18 | 19.54 | 2.96 | 0.25 (118) | 0.806 | 0.05 | 0.20 |
| Mother’s education (years) | 17.20 | 3.36 | 16.58 | 2.28 | –1.19 (103.89) | 0.235 | –0.22 | 0.37 |
| Father’s education (years) | 16.12a | 3.10a | 17.13a | 3.27a | 1.71 (114) | 0.091 | 0.32 | 0.73 |
| IQ | 103.56b | 11.83b | 111.12 | 10.43 | 3.70 (117) | <0.001 | 0.68 | 75.31 |
| Nonverbal IQ (scaled score) | 10.40 | 2.94 | 11.62 | 2.57 | 2.42 (118) | 0.017 | 0.44 | 2.63 |
| ARHQ-PL | 51.50 | 9.70 | 25.47 | 8.00 | –16.04 (113.87) | <0.001 | –2.93 | >10,000 |
| Reading and reading-related tasks | ||||||||
| Words/min | 108.38 | 20.93 | 134.57 | 13.29 | 8.18 (99.90) | <0.001* | 1.49 | >10,000 |
| Pseudowords/min | 56.75 | 14.16 | 83.43 | 17.04 | 9.33 (118) | <0.001* | 1.70 | >10,000 |
| RAN objects (s) | 32.12 | 5.11 | 28.70 | 4.43 | –3.92 (118) | <0.001* | –0.72 | 149.93 |
| RAN colors (s) | 35.83 | 6.82 | 31.18 | 5.73 | –4.04 (118) | <0.001* | –0.74 | 229.96 |
| RAN digits(s) | 19.32 | 4.61 | 16.25 | 2.94 | –4.34 (100.28) | <0.001* | –0.79 | 642.86 |
| RAN letters (s) | 22.70 | 4.53 | 19.68 | 3.16 | –4.23 (105.42) | <0.001* | –0.77 | 433.23 |
| Reading comprehension (s) | 64.47 | 20.13 | 43.72 | 9.63 | –7.20 (84.66) | <0.001* | –1.32 | >10,000 |
| Phoneme deletion (% correct) | 76.41 | 24.68 | 91.47 | 9.07 | 4.44 (74.66) | <0.001* | 0.81 | 898.25 |
| Spoonerisms phonemes (% correct) | 54.29 | 35.42 | 82.74 | 22.06 | 5.28 (98.78) | <0.001* | 0.96 | >10,000 |
| Spoonerisms syllables (% correct) | 46.94 | 30.61 | 73.06 | 23.98 | 5.20 (111.62) | <0.001* | 0.95 | >10,000 |
| Orthographic awareness (accuracy/time) | 0.33 | 0.13 | 0.53 | 0.14 | 8.12 (118) | <0.001* | 1.48 | >10,000 |
| Perception speed (sten score) | 3.32 | 2.04 | 4.50 | 1.67 | 3.48 (118) | <0.001* | 0.64 | 38.71 |
| Digits forward | 5.53 | 1.64 | 6.98 | 1.95 | 4.40 (118) | <0.001* | 0.80 | 792.55 |
| Digits backward | 5.25 | 1.49 | 7.33 | 2.25 | 5.99 (102.59) | <0.001* | 1.09 | >10,000 |
-
Note: DYS – dyslexic group; CON – control group; F – females, M – males. BF10 – Bayes factor indicating ratio of the likelihood of an alternative hypothesis (H1) to a null hypothesis (H0). ARHQ-PL – Polish version of the Adult Reading History Questionnaire. RAN – rapid automatized naming. Boldface indicates statistical significance at p<0.05 level (uncorrected).
-
*Significance after Bonferroni correction for 14 planned comparisons for reading and reading-related tasks
-
an = 58 (two participants did not provide information about the father’s education)
-
bn = 59 (one participant did not attempt a verbal subtest of the scale, thus we were not able to calculate overall IQ)
Table 2
Semi-partial correlations between magnetic resonance spectroscopy (MRS) and electroencephalography (EEG) biomarkers of excitatory-inhibitory balance.
For Glu the effects of age and gray matter volume (GMV) were regressed, for GABA+, Glu/GABA+ ratio, and Glu/GABA+ imbalance the effect of GMV was regressed, while for exponents and offsets the effect of age was regressed.
| Variable | 1. r(BF10) | 2. | 3. | 4. | 5. | 6. | 7. | 8. |
|---|---|---|---|---|---|---|---|---|
| EEG resting state | ||||||||
| 1. Glu | – | |||||||
| 2. GABA+ | 0.32*a (1.82) | – | ||||||
| 3. Glu/GABA+ ratio | –0.08a (0.21) | –0.91***a (>10,000) | – | |||||
| 4. Glu/GABA+ imbalance | 0.12a (0.25) | 0.31*a (1.63) | –0.18a (0.37) | – | ||||
| 5. Exponent mean (rest) | –0.03b (0.18) | 0.04a (0.19) | –0.11a (0.23) | 0.29*a (1.21) | – | |||
| 6. Offset mean (rest) | –0.21b (0.49) | 0.08a (0.21) | –0.17a (0.35) | 0.25a (0.69) | 0.68***c (>10,000) | – | ||
| 7. Exponent left STS (rest) | –0.16b (0.32) | 0.01a (0.18) | –0.07a (0.20) | 0.35*a (2.87) | 0.68***c (>10,000) | 0.45***c (>10,000) | – | |
| 8. Offset left STS (rest) | –0.38**b (6.28) | –0.10a (0.23) | 0.02a (0.18) | 0.18a (0.38) | 0.18*c (0.80) | 0.47***c (>10,000) | 0.66***c (>10,000) | – |
| 9. Beta power left STS (rest) | –0.12b (0.25) | 0.17a (0.33) | –0.25a (0.74) | 0.01a (0.18) | 0.18*c (0.80) | 0.21*c (1.40) | 0.51***c (>10,000) | 0.59***c (>10,000) |
| EEG language task | ||||||||
| 5. Exponent mean (task) | –0.10b (0.22) | 0.06a (0.20) | –0.15a (0.29) | 0.21a (0.49) | – | |||
| 6. Offset mean (task) | –0.26b (0.92) | 0.09a (0.22) | –0.20a (0.43) | 0.22a (0.53) | 0.72***c (>10,000) | – | ||
| 7. Exponent left STS (task) | –0.20b (0.44) | 0.01a (0.18) | –0.09a (0.22) | 0.22a (0.51) | 0.65***c (>10000) | 0.51***c (>10,000) | – | |
| 8. Offset left STS (task) | –0.37**b (5.05) | –0.08a (0.21) | 0.00a (0.18) | 0.15a (0.30) | 0.29**c (18.31) | 0.55***c (>10,000) | 0.77***c (>10,000) | – |
| 9. Beta power left STS (task) | –0.19b (0.42) | 0.16a (0.32) | –0.22a (0.55) | –0.03a (0.19) | 0.05c (0.13) | 0.13c (0.31) | 0.47***c (>10,000) | 0.60***c (>10,000) |
-
Note: r – Pearson’s correlation coefficient; BF10 – Bayes factor indicating ratio of the likelihood of an alternative hypothesis (H1) to a null hypothesis (H0); mean – values averaged across all electrodes; left STS – values averaged across three electrodes corresponding to the left superior temporal sulcus (T7, TP7, TP9).
-
***p < 0.001 (uncorrected); **p < 0.01 (uncorrected); *p < 0.05 (uncorrected)
-
an = 47; bn = 50; cn = 119
Table 3
Semi-partial correlations between reading, phonological awareness, rapid automatized naming (RAN), multisensory integration, and biomarkers of excitatory-inhibitory balance.
For reading, phonological awareness, and multisensory integration the effect of age was regressed, for Glu the effects of age and gray matter volume (GMV) were regressed, for GABA+, Glu/GABA+ ratio, and Glu/GABA+ imbalance the effect of GMV was regressed, while for exponents and offsets the effect of age was regressed.
| Variable | 1. r(BF10) | 2. | 3. | 4. |
|---|---|---|---|---|
| EEG resting state | ||||
| 1. Reading | – | |||
| 2. Phonological awareness | 0.60***c (>10,000) | – | ||
| 3. RAN | 0.71***c (>10,000) | 0.48***c (>10,000) | – | |
| 4. Multisensory integration | 0.16d (0.41) | 0.25*d (2.09) | 0.02d (0.14) | – |
| 5. Glu | –0.03b (0.18) | –0.12b (0.25) | –0.05b (0.19) | 0.03b (0.18) |
| 6. GABA+ | –0.18a (0.36) | –0.06a (0.20) | –0.23a (0.56) | 0.31*a (1.62) |
| 7. Glu/GABA+ ratio | 0.07a (0.20) | 0.04a (0.19) | 0.09a (0.22) | –0.32*a (1.84) |
| 8. Glu/GABA+ imbalance | –0.21a (0.47) | –0.08a (0.21) | –0.20a (0.44) | 0.17a (0.33) |
| 9. Exponent mean (rest) | –0.08c (0.17) | 0.10c (0.20) | –0.06c (0.14) | 0.02d (0.14) |
| 10. Offset mean (rest) | 0.06c (0.14) | 0.14c (0.35) | 0.03c (0.12) | 0.16d (0.38) |
| 11. Exponent left STS (rest) | –0.08c (0.16) | 0.06c (0.14) | –0.04c (0.12) | –0.04d (0.14) |
| 12. Offset left STS (rest) | 0.12c (0.25) | 0.18*c (0.77) | 0.08c (0.17) | 0.08d (0.18) |
| 13. Beta power left STS (rest) | 0.04c (0.13) | 0.23*c (2.73) | –0.04c (0.12) | 0.05d (0.15) |
| EEG language task | ||||
| 9. Exponent mean (task) | –0.07c (0.16) | 0.13c (0.30) | –0.10c (0.21) | 0.01d (0.14) |
| 10. Offset mean (task) | 0.05c (0.13) | 0.14c (0.34) | 0.01c (0.12) | 0.18d (0.50) |
| 11. Exponent left STS (task) | –0.03c (0.12) | 0.09c (0.18) | –0.07c (0.15) | –0.04d (0.14) |
| 12. Offset left STS (task) | 0.13c (0.28) | 0.18c (0.71) | 0.07c (0.15) | 0.09d (0.19) |
| 13. Beta power left STS (task) | 0.07c (0.15) | 0.23*c (2.84) | 0.02c (0.12) | 0.15d (0.33) |
-
Note: r – Pearson’s correlation coefficient; BF10 – Bayes factor indicating ratio of the likelihood of an alternative hypothesis (H1) to a null hypothesis (H0); mean – values averaged across all electrodes; left STS – values averaged across three electrodes corresponding to the left superior temporal sulcus (T7, TP7, TP9).
-
***p < 0.001 (uncorrected); **p < 0.01 (uncorrected); *p < 0.05 (uncorrected)
-
an = 47 bn = 50; cn = 119; dn = 87
Appendix 1—table 1
Descriptive statistics for electroencephalography (EEG) and magnetic resonance spectroscopy (MRS) results separately for the groups.
| DYS | CON | ||||
|---|---|---|---|---|---|
| M | SD | M | SD | ||
| EEG resting statea | |||||
| Exponent mean (rest) | 1.54 | 0.14 | 1.54 | 0.18 | |
| Exponent left IFG (rest) | 1.54 | 0.16 | 1.53 | 0.18 | |
| Exponent left STS (rest) | 1.50 | 0.18 | 1.47 | 0.22 | |
| Exponent right IFG (rest) | 1.54 | 0.15 | 1.54 | 0.18 | |
| Exponent right STS (rest) | 1.48 | 0.18 | 1.45 | 0.22 | |
| Offset mean (rest) | –10.80 | 0.19 | –10.80 | 0.24 | |
| Offset left IFG (rest) | –10.72 | 0.34 | –10.74 | 0.33 | |
| Offset left STS (rest) | –10.97 | 0.38 | –10.98 | 0.37 | |
| Offset right IFG (rest) | –10.79 | 0.29 | –10.81 | 0.32 | |
| Offset right STS (rest) | –10.99 | 0.31 | –11.04 | 0.36 | |
| Beta power left IFG (rest) | 0.48 | 0.18 | 0.48 | 0.20 | |
| Beta power left STS (rest) | 0.49 | 0.19 | 0.48 | 0.21 | |
| Beta power right IFG (rest) | 0.49 | 0.18 | 0.50 | 0.19 | |
| Beta power right STS (rest) | 0.51 | 0.20 | 0.50 | 0.21 | |
| EEG language taska | |||||
| Exponent mean (task) | 1.55 | 0.15 | 1.56 | 0.18 | |
| Exponent left IFG (task) | 1.55 | 0.16 | 1.55 | 0.19 | |
| Exponent left STS (task) | 1.50 | 0.20 | 1.47 | 0.21 | |
| Exponent right IFG (task) | 1.54 | 0.17 | 1.55 | 0.19 | |
| Exponent right STS (task) | 1.47 | 0.19 | 1.45 | 0.22 | |
| Offset mean (task) | –10.67 | 0.25 | –10.67 | 0.28 | |
| Offset left IFG (task) | –10.58 | 0.39 | –10.60 | 0.37 | |
| Offset left STS (task) | –10.86 | 0.44 | –10.87 | 0.42 | |
| Offset right IFG (task) | –10.65 | 0.36 | –10.68 | 0.37 | |
| Offset right STS (task) | –10.88 | 0.36 | –10.94 | 0.41 | |
| Beta power left IFG (task)b | 0.50 | 0.23 | 0.51 | 0.21 | |
| Beta power left STS (task) | 0.54 | 0.24 | 0.53 | 0.23 | |
| Beta power right IFG (task) | 0.51 | 0.23 | 0.52 | 0.21 | |
| Beta power right STS (task) | 0.55 | 0.26 | 0.55 | 0.23 | |
| MRS | |||||
| Gluc | 1.11 | 0.12 | 1.07 | 0.10 | |
| GABA+d | 0.46 | 0.14 | 0.44 | 0.12 | |
| Glu/GABA +ratiod | 2.67 | 0.87 | 2.68 | 0.75 | |
| Glu/GABA +imbalanced | 0.27 | 0.11 | 0.24 | 0.12 | |
-
Note: DYS – dyslexic group; CON – control group; mean – values averaged across all electrodes; left IFG – values averaged across three electrodes corresponding to the left inferior frontal gyrus (F7, FT7, FC5); left STS – values averaged across three electrodes corresponding to the left superior temporal sulcus (T7, TP7, TP9); right IFG – values averaged across three electrodes corresponding to the right inferior frontal gyrus (F8, FT8, FC6); right STS – values averaged across three electrodes corresponding to the right superior temporal sulcus (T8, TP8, TP10).
-
an = 119 (DYS n = 59, CON n = 60); bn = 117 (DYS n = 57, CON n = 60); cn = 50 (DYS n = 21, CON n = 29); dn = 47 (DYS n = 20, CON n = 27).
Appendix 1—table 2
Demographic and behavioral characteristics of the subsample of 47 participants.
| DYS(n=20) | CON(n=27) | Test | p | Effect size | BF10 | |||
|---|---|---|---|---|---|---|---|---|
| M | SD | M | SD | |||||
| Demographics | ||||||||
| Sex | 12 F, 8 M | 11 F, 16 M | χ=1.71 | 0.192 | phi = –0.19 | 0.81 | ||
| Age | 19.98 | 3.92 | 20.33 | 3.25 | U=261.0 | 0.846 | rrb = 0.03 | 0.29 |
| Mother’s education (years) | 17.48 | 3.68 | 16.63 | 2.56 | U=242.5 | 0.551 | rrb = –0.10 | 0.36 |
| Father’s education (years) | 16.74a | 3.46a | 16.41 | 3.49 | U=237.0 | 0.659 | rrb = –0.08 | 0.31 |
| IQ | 103.80 | 14.30 | 113.56 | 9.23 | t(30.41)=2.67 | 0.012 | d=0.81 | 6.65 |
| Nonverbal IQ (scaled score) | 10.45 | 3.14 | 12.37 | 2.17 | U=174.5 | 0.038 | rrb = 0.35 | 1.79 |
| ARHQ-PL | 52.90 | 10.78 | 24.26 | 6.71 | U=6.0 | <0.001 | rrb = –0.98 | 1060.02 |
| Reading and reading-related tasks | ||||||||
| Words/min | 110.80 | 19.59 | 136.11 | 12.80 | U=74.0 | <0.001* | rrb = 0.73 | 108.53 |
| Pseudowords/min | 59.15 | 13.91 | 85.59 | 15.83 | t(45)=5.96 | <0.001* | d=1.76 | >10,000 |
| RAN objects (s) | 32.55 | 4.36 | 28.56 | 4.46 | U=122.0 | 0.001* | rrb = –0.55 | 7.92 |
| RAN colors (s) | 36.40 | 4.91 | 30.63 | 3.67 | t(45)=–4.61 | <0.001* | d=–1.36 | 571.37 |
| RAN digits(s) | 19.35 | 4.00 | 16.33 | 2.24 | U=134.0 | 0.003* | rrb = –0.50 | 3.82 |
| RAN letters (s) | 21.75 | 3.24 | 19.52 | 2.53 | t(45)=–2.65 | 0.011 | d=–0.78 | 4.52 |
| Reading comprehension (s) | 63.10 | 18.30 | 43.89 | 7.87 | U=82.0 | <0.001* | rrb = –0.70 | 65.88 |
| Phoneme deletion (% correct) | 74.62 | 29.20 | 94.16 | 6.61 | U=120.0 | 0.001* | rrb = 0.56 | 13.46 |
| Spoonerisms phonemes (% correct) | 52.14 | 38.23 | 87.83 | 8.36 | U=106.5 | <0.001* | rrb = 0.61 | 17.43 |
| Spoonerisms syllables (% correct) | 41.67 | 29.86 | 77.78 | 20.67 | U=87.5 | <0.001* | rrb = 0.68 | 27.77 |
| Orthographic awareness (accuracy/time) | 0.35 | 0.16 | 0.54 | 0.13 | t(45)=4.26 | <0.001* | d=1.26 | 215.19 |
| Perception speed (sten score) | 2.95 | 1.79 | 4.33 | 1.64 | U=126.0 | 0.002* | rrb = 0.53 | 4.49 |
| Digits forward | 5.65 | 1.79 | 7.04 | 2.03 | U=158.0 | 0.014 | rrb = 0.42 | 2.13 |
| Digits backward | 4.95 | 1.73 | 7.48 | 2.06 | t(45)=4.45 | <0.001* | d=1.31 | 355.64 |
-
Note: DYS – dyslexic group; CON – control group; F – females, M – males. BF10 – Bayes factor indicating ratio of the likelihood of an alternative hypothesis (H1) to a null hypothesis (H0). ARHQ-PL – Polish version of the Adult Reading History Questionnaire. RAN – rapid automatized naming. Non-parametric Mann-Whitney test was performed when assumption of normal distribution was violated. rrb – rank biserial correlation provided as an effect size parameter for Mann-Whitney test. Boldface indicates statistical significance at p<0.05 level (uncorrected).
-
*Significance after Bonferroni correction for 14 planned comparisons for reading and reading-related tasks;
-
an = 19 (one participant did not provide information about the father’s education).
Appendix 1—table 3
Zero-order correlations between magnetic resonance spectroscopy (MRS) and electroencephalography (EEG) biomarkers of excitatory-inhibitory balance.
| Variable | 1. r(BF10) | 2. | 3. | 4. | 5. | 6. | 7. | 8. |
|---|---|---|---|---|---|---|---|---|
| EEG resting state | ||||||||
| 1. Glu | – | |||||||
| 2. GABA+ | 0.40**a (8.08) | – | ||||||
| 3. Glu/GABA +ratio | –0.11 (0.24)a | –0.90***a (>10,000) | – | |||||
| 4. Glu/GABA +imbalance | 0.16 (0.32)a | 0.33*a (2.14) | –0.19 (0.42)a | – | ||||
| 5. Exponent mean (rest) | 0.13 (0.25)b | 0.10 (0.23)a | –0.11 (0.24)a | 0.31* (1.58)a | – | |||
| 6. Offset mean (rest) | 0.10 (0.23)b | 0.17 (0.35)a | –0.15 (0.30)a | 0.26 (0.79)a | 0.70*** (>10,000)c | – | ||
| 7. Exponent left STS (rest) | 0.04 (0.18)b | 0.09 (0.22)a | –0.08 (0.21)a | 0.37* (4.06)a | 0.70*** (>10,000)c | 0.52*** (>10,000)c | – | |
| 8. Offset left STS (rest) | –0.09 (0.21)b | 0.01 (0.18)a | 0.00 (0.18)a | 0.21 (0.48)a | 0.24** (3.92)c | 0.54*** (>10,000)c | 0.70*** (>10,000)c | – |
| 9. Beta power left STS (rest) | –0.06 (0.19)b | 0.22 (0.53)a | –0.28 (1.04)a | 0.03 (0.19)a | 0.19* (0.85)c | 0.20* (1.29)c | 0.50*** (>10,000)c | 0.56*** (>10,000)c |
| EEG language task | ||||||||
| 5. Exponent mean (task) | 0.14 (0.27)b | 0.15 (0.29)a | –0.14 (0.28)a | 0.24 (0.64)a | – | |||
| 6. Offset mean (task) | 0.10 (0.23)b | 0.19 (0.41)a | –0.16 (0.31)a | 0.23 (0.59)a | 0.75*** (>10,000)c | – | ||
| 7. Exponent left STS (task) | 0.05 (0.19)b | 0.09 (0.22)a | –0.09 (0.21)a | 0.24 (0.64)a | 0.69*** (>10000)c | 0.58*** (>10,000)c | – | |
| 8. Offset left STS (task) | –0.07 (0.20)b | 0.03 (0.19)a | –0.01 (0.18)a | 0.18 (0.38)a | 0.36*** (375.45)c | 0.62*** (>10,000)c | 0.80*** (>10,000)c | – |
| 9. Beta power left STS (task) | –0.07 (0.20)b | 0.22 (0.52)a | –0.25 (0.77)a | –0.01 (0.18)a | 0.07 (0.15)c | 0.15 (0.43)c | 0.47*** (>10,000)c | 0.59*** (>10,000)c |
-
Note: r – Pearson’s correlation coefficient; BF10 – Bayes factor indicating ratio of the likelihood of an alternative hypothesis (H1) to a null hypothesis (H0); mean – values averaged across all electrodes; left STS – values averaged across three electrodes corresponding to the left superior temporal sulcus (T7, TP7, TP9).
-
***p < 0.001 (uncorrected); **p < 0.01 (uncorrected); *p < 0.05 (uncorrected).
-
an = 47; bn = 50; cn = 119.
Appendix 1—table 4
Zero-order correlations between reading, phonological awareness, rapid automatized naming, multisensory integration, and biomarkers of excitatory-inhibitory balance.
| Variable | 1. r(BF10) | 2. | 3. | 4. |
|---|---|---|---|---|
| EEG resting state | ||||
| 1. Reading | – | |||
| 2. Phonological awareness | 0.62*** (>10,000)c | – | ||
| 3. RAN | 0.73*** (>10,000)c | 0.50*** (>10,000)c | – | |
| 4. Multisensory integration | 0.24* (1.44)d | 0.33** (16.94)d | 0.08 (0.17)d | – |
| 5. Glu | –0.10 (0.22)b | –0.16 (0.32)b | –0.08 (0.20)b | –0.08 (0.21)b |
| 6. GABA+ | –0.17 (0.35)a | –0.02 (0.18)a | –0.19 (0.41)a | 0.24 (0.62)a |
| 7. Glu/GABA+ ratio | 0.03 (0.19)a | –0.02 (0.18)a | 0.08 (0.21)a | –0.31* (1.62)a |
| 8. Glu/GABA+ imbalance | –0.21 (0.47)a | –0.06 (0.20)a | –0.19 (0.40)a | 0.13 (0.27)a |
| 9. Exponent mean (rest) | –0.13 (0.30)c | 0.05 (0.13)c | –0.08 (0.17)c | –0.05 (0.15)d |
| 10. Offset mean (rest) | –0.03 (0.12)c | 0.04 (0.13)c | –0.02 (0.12)c | –0.01 (0.14)d |
| 11. Exponent left STS (rest) | –0.14 (0.37)c | –0.01 (0.12)c | –0.07 (0.16)c | –0.15 (0.33)d |
| 12. Offset left STS (rest) | 0.03 (0.12)c | 0.09 (0.18)c | 0.03 (0.12)c | –0.07 (0.17)d |
| 13. Beta power left STS` (rest) | 0.03 (0.12)c | 0.22* (1.96)c | –0.04 (0.12)c | 0.04 (0.14)d |
| EEG language task | ||||
| 9. Exponent mean (task) | –0.13 (0.32)c | 0.06 (0.14)c | –0.14 (0.34)c | –0.09 (0.19)d |
| 10. Offset mean (task) | –0.05 (0.13)c | 0.04 (0.12)c | –0.05 (0.13)c | –0.01 (0.13)d |
| 11. Exponent left STS (task) | –0.11 (0.23)c | 0.01 (0.12)c | –0.11 (0.24)c | –0.17 (0.48)d |
| 12. Offset left STS (task) | 0.04 (0.12)c | 0.09 (0.18)c | 0.01 (0.12)c | –0.07 (0.16)d |
| 13. Beta power left STS (task) | 0.05 (0.13)c | 0.21* (1.61)c | 0.02 (0.12)c | 0.11 (0.22)d |
-
Note: r – Pearson’s correlation coefficient; BF10 – Bayes factor indicating ratio of the likelihood of an alternative hypothesis (H1) to a null hypothesis (H0); mean – values averaged across all electrodes; left STS – values averaged across three electrodes corresponding to the left superior temporal sulcus (T7, TP7, TP9).
-
***p < 0.001 (uncorrected); **p < 0.01 (uncorrected); *p < 0.05 (uncorrected).
-
an = 47; bn = 50; cn = 119; dn = 87.
Appendix 1—table 5
One-sample t-tests separately for visual (words>false fonts) and auditory runs (words>words backward) within control (CON) and dyslexic groups (DYS).
| Brain regions | Hemisphere | Peak of cluster coordinates | t-Value | Number of voxels | ||
|---|---|---|---|---|---|---|
| x | y | z | ||||
| CON (n=29) visual runs (FWEc = 127) | ||||||
| Middle temporal gyrus, superior temporal gyrus, inferior frontal gyrus (pars triangularis, orbitalis, opercularis), supramarginal gyrus, temporal pole (superior and middle temporal gyri), postcentral gyrus, hippocampus, posterior orbital gyrus, amygdala, parahippocampal gyrus, inferior parietal gyrus, rolandic operculum, lateral orbital gyrus, pallidum, anterior orbital gyrus, inferior frontal gyrus, putamen, middle frontal gyrus, insula, angular gyrus | L | –62 | –54 | 10 | 9.78 | 5360 |
| Precuneus, posterior cingulate gyrus, middle cingulate and paracingulate gyri, calcarine fissure, cuneus | L/R | -4 | –52 | 20 | 7.17 | 957 |
| Middle temporal gyrus, superior temporal gyrus, temporal pole (superior and middle temporal gyri), inferior temporal gyrus | R | 60 | –34 | 0 | 7.10 | 1117 |
| Cuneus, superior occipital gyrus, calcarine fissure | L/R | 14 | –92 | 26 | 5.98 | 334 |
| Superior frontal gyrus (dorsolateral and medial) | L | -8 | 54 | 34 | 5.95 | 678 |
| Superior frontal gyrus (medial orbital), anterior cingulate cortex (pregenual), superior frontal gyrus (medial) | L/R | -8 | 50 | -8 | 5.33 | 194 |
| Insula, putamen, rolandic operculum, inferior frontal gyrus (pars opercularis) | L | –36 | 4 | 6 | 5.09 | 127 |
| Angular gyrus, middle temporal gyrus, middle occipital gyrus | L | –40 | –58 | 26 | 4.56 | 167 |
| DYS (n=21) visual runs (FWEc = 665) | ||||||
| Inferior frontal gyrus (pars triangularis, orbitalis, opercularis), posterior orbital gyrus | L | –48 | 24 | 0 | 6.54 | 665 |
| Middle temporal gyrus, superior temporal gyrus, supramarginal gyrus | L | –62 | –32 | 2 | 6.40 | 677 |
| CON (n=29) auditory run (FWEc = 124) | ||||||
| Middle temporal gyrus, postcentral gyrus, cingulate gyrus (mid part), superior parietal gyrus, precentral gyrus, precuneus, middle occipital gyrus, supramarginal gyrus, inferior parietal gyrus, inferior temporal gyrus, calcarine fissure, fusiform gyrus, superior temporal gyrus, angular gyrus, temporal pole (superior and temporal gyri), cuneus, supplementary motor area, lingual gyrus, inferior frontal gyrus (pars triangularis, orbitalis), posterior cingulate gyrus, superior frontal gyrus (dorsolateral), inferior occipital gyrus, posterior orbital gyrus, paracentral lobule, rolandic operculum, parahippocampal gyrus, lateral orbital gyrus, middle frontal gyrus, superior occipital gyrus, anterior orbital gyrus | L/R | –52 | –12 | –10 | 9.75 | 13,444 |
| Middle temporal gyrus, superior temporal gyrus, temporal pole (superior temporal gyrus), inferior temporal gyrus | R | 50 | –4 | –20 | 7.98 | 1038 |
| Putamen, insula, rolandic operculum, pallidum, Heschl’s gyrus, amygdala, hippocampus, thalamus (lateral geniculate) | L | –34 | –20 | 8 | 6.15 | 463 |
| Thalamus (mediodorsal medial magnocellular, intralaminar, pulvinar medial, ventral posterolateral, mediodorsal lateral parvocellular, ventral lateral, pulvinar anterior, lateral posterior, pulvinar inferior, medial geniculate), hippocampus, lingual gyrus, parahippocampal gyrus | L | –10 | –20 | 0 | 5.82 | 259 |
| Superior frontal gyrus (dorsolateral and medial), middle frontal gyrus | L/R | –6, | 60 | 34 | 5.81 | 438 |
| Thalamus (ventral posterolateral, pulvinar medial, pulvinar anterior, lateral geniculate, intralaminar, pulvinar inferior, pulvinar lateral, ventral lateral, medial geniculate), hippocampus | R | 14 | –20 | 4 | 5.68 | 149 |
| Middle occipital gyrus, middle temporal gyrus, angular gyrus, superior occipital gyrus, superior temporal gyrus, superior parietal gyrus, cuneus, supramarginal gyrus, inferior parietal gyrus | R | 36 | –76 | 40 | 5.46 | 978 |
| Cerebellar hemispheres (lobules IV, V, VI, VIII, IX, crus I, crus II), vermis (lobules VI, VII, VIII, IX) | L/R | 12, | –50 | –30 | 5.35 | 630 |
| Inferior frontal gyrus (pars triangularis) | L | –50 | 22 | 20 | 4.54 | 124 |
| DYS (n=21) auditory run (FWEc = 192) | ||||||
| Middle temporal gyrus, superior temporal gyrus, temporal pole (superior temporal gyrus) | L | –52 | –12 | –12 | 7.00 | 403 |
| Middle temporal gyrus | L | –56 | –38 | 0 | 5.33 | 192 |
-
Note: L – left, R – right. All results are reported at p<0.001 height threshold corrected for multiple comparisons using p<0.05 FWE cluster threshold.
Appendix 1—table 6
Logical conjunction results from paired t-tests for both visual (words>false fonts) and auditory runs (words>words backward) within control (CON) and dyslexic groups (DYS).
| Brain regions | Hemisphere | Peak of cluster coordinates | t-Value | Number of voxels | ||
|---|---|---|---|---|---|---|
| x | y | z | ||||
| CON (n=29) visual and auditory runs conjunction (FWEc = 143) | ||||||
| Middle temporal gyrus, inferior frontal gyrus (pars triangularis, orbitalis, opercularis), superior temporal gyrus, temporal pole (superior and middle temporal gyri), supramarginal gyrus, posterior orbital gyrus, inferior parietal gyrus, angular gyrus, lateral orbital gyrus, anterior orbital gyrus, middle occipital gyrus | L | –54 | –58 | 12 | 9.58 | 3164 |
| Middle temporal gyrus, superior temporal gyrus | R | 50 | –34 | –2 | 7.98 | 186 |
| Superior frontal gyrus (dorsolateral and medial) | L | -6 | 56 | 36 | 5.94 | 430 |
| Superior temporal gyrus, temporal pole (superior and middle temporal gyri), middle temporal gyrus | R | 52 | 10 | –16 | 5.76 | 175 |
| Precuneus, posterior cingulate gyrus, middle cingulate and paracingulate gyri | L/R | –2 | –56 | 30 | 5.48 | 448 |
| Supramarginal gyrus, postcentral gyrus, rolandic operculum, superior temporal gyrus | L | –50 | –24 | 22 | 5.35 | 217 |
| Middle cingulate and paracingulate gyri | L/R | –2 | –10 | 40 | 5.17 | 143 |
| DYS (n=21) visual and auditory runs conjunction (FWEc = 545) | ||||||
| Middle temporal gyrus, superior temporal gyrus | L | –52 | –12 | –6 | 6.73 | 545 |
-
Note: L – left, R – right. All results are reported at p<0.001 height threshold corrected for multiple comparisons using p<0.05 FWE cluster threshold.
Appendix 1—table 7
Results from the flexible factorial model for both visual (words>false fonts) and auditory runs (words>words backward) between control (CON) and dyslexic groups (DYS).
| Brain regions | Hemisphere | Peak of cluster coordinates | t-Value | Number of voxels | ||
|---|---|---|---|---|---|---|
| x | y | z | ||||
| CON>DYS main effect of group for visual and auditory runs (FWEc = 121) | ||||||
| Middle temporal gyrus, supramarginal gyrus, superior temporal gyrus, inferior temporal gyrus, inferior parietal gyrus, middle occipital gyrus, fusiform gyrus, angular gyrus, postcentral gyrus, rolandic operculum | L | –58 | –30 | 30 | 7.19 | 2181 |
| Rolandic operculum, superior temporal gyrus, middle temporal gyrus, supramarginal gyrus, insula, postcentral gyrus, precentral gyrus, inferior frontal gyrus (pars opercularis), putamen, inferior temporal gyrus | R | 46 | –4 | 14 | 7.07 | 1512 |
| Superior frontal gyrus (dorsolateral and medial), middle frontal gyrus | R | 22 | 34 | 54 | 6.56 | 464 |
| Insula, rolandic operculum, superior temporal gyrus, Heschl’s gyrus | L | –40 | –6 | 18 | 6.21 | 266 |
| Middle cingulate and paracingulate gyri, paracentral lobule, supplementary motor area, precuneus | L/R | –8 | –26 | 42 | 5.96 | 1108 |
| Precentral gyrus, superior frontal gyrus (dorsolateral) | L | –32 | –8 | 68 | 5.70 | 191 |
| Angular gyrus, supramarginal gyrus, inferior parietal gyrus, middle occipital gyrus | R | 52 | –62 | 40 | 5.37 | 516 |
| Superior frontal gyrus (dorsolateral and medial), middle frontal gyrus | L | –18 | 38 | 34 | 5.13 | 241 |
| Precentral gyrus, postcentral gyrus, middle frontal gyrus | R | 58 | –12 | 46 | 5.09 | 140 |
| Lingual gyrus, cerebellar hemisphere (lobule VI), fusiform gyrus | R | 14 | –68 | –10 | 5.04 | 209 |
| Temporal pole (superior temporal gyrus), middle temporal gyrus, superior temporal gyrus | L | –54 | 10 | –16 | 5.00 | 156 |
| Supplementary motor area, middle cingulate and paracingulate gyri | L/R | 4 | 6 | 48 | 4.93 | 174 |
| Postcentral gyrus, superior parietal gyrus | R | 24 | –48 | 58 | 4.85 | 121 |
| Postcentral gyrus, supramarginal gyrus | R | 38 | –32 | 36 | 4.78 | 137 |
| DYS>CON main effect of group for visual and auditory runs | ||||||
| No suprathreshold clusters | ||||||
-
Note: L – left, R – right. All results are reported at p<0.001 height threshold corrected for multiple comparisons using p<0.05 FWE cluster threshold.
Appendix 1—table 8
Magnetic resonance spectroscopy (MRS) checklist.
| Hardware | |
|---|---|
| Field strength [T] | 7T |
| Manufacturer | GE Healthcare |
| Model (software version if available) | Discovery MR 950 |
| RF coils: nuclei (transmit/ receive), number of channels, type, body part | H1 32 channel head coil |
| Additional hardware | MR Safe Response PAD |
| Acquisition | |
| Pulse sequence | Semi-Laser |
| Volume of interest (VOI) locations | Left superior temporal sulcus (STS) |
| Nominal VOI size [cm3, mm3] | 15×15×15 mm3 |
| Repetition time (TR), echo time (TE) [ms, s] | TR = 4000 ms TE = 28 ms |
| Total number of excitations or acquisitions per spectrum | 320 averages |
| Additional sequence parameters (spectral width in Hz, number of spectral points, frequency offsets) | 5000 Hz, 4096 points |
| Water suppression method | VAPOR |
| Shimming method, reference peak, and thresholds for ‘acceptance of shim’ chosen | Automated linear shims adjustment, 0 and first shim order only, water peak, <20 Hz |
| Triggering or motion correction method (respiratory, peripheral, cardiac triggering, incl. device used and delays) | N/A |
| Data analysis methods and outputs | |
| Analysis software | fsl-mrs (version 2.0.7) |
| Processing steps deviating from quoted reference or product | fsl_mrs default pipeline+simulated basis set |
| Output measure (e.g. absolute concentration, institutional units, ratio) Processing steps deviating from quoted reference or product | Ratio to total creatine |
| Quantification references and assumptions, fitting model assumptions | The customized basis set includes: Ala, Asc, Asp, Cit, Cr, EtOH, GABA, GPC, GSH, Glc, Gln, Glu, Gly, Ins, Lac, NAA, NAAG, PCh, PCr, PE, Phenyl, Scyllo, Ser, Tau, Tyros, bHB, bHG. Macromolecules MM09, MM12, MM14, MM17, MM21 were added. |
| Data quality | |
| Reported variables (SNR, linewidth (with reference peaks)) | Linewidth (for metabolite group reported by fsl_mrs): mean 11.11 Hz, SD = 2.79 Hz SNR (for NAA reported by fsl_mrs): mean 7.05, SD = 23.95 |
| Data exclusion criteria | Linewidth >20 Hz, CRLB >20% and Visual inspection (baseline, residuals) Glu – 4 subjects excluded GABA – 7 subjects excluded |
| Quality measures of postprocessing Model fitting (e.g. CRLB, goodness of fit, SD of residual) | %CRLB of Glu: mean 2.96, SD = 0.79 %CRLB of GABA: mean 10.59, SD = 2.76 %CRLB of NAA: 1.76 SD = 0.46 |
| Sample spectrum | 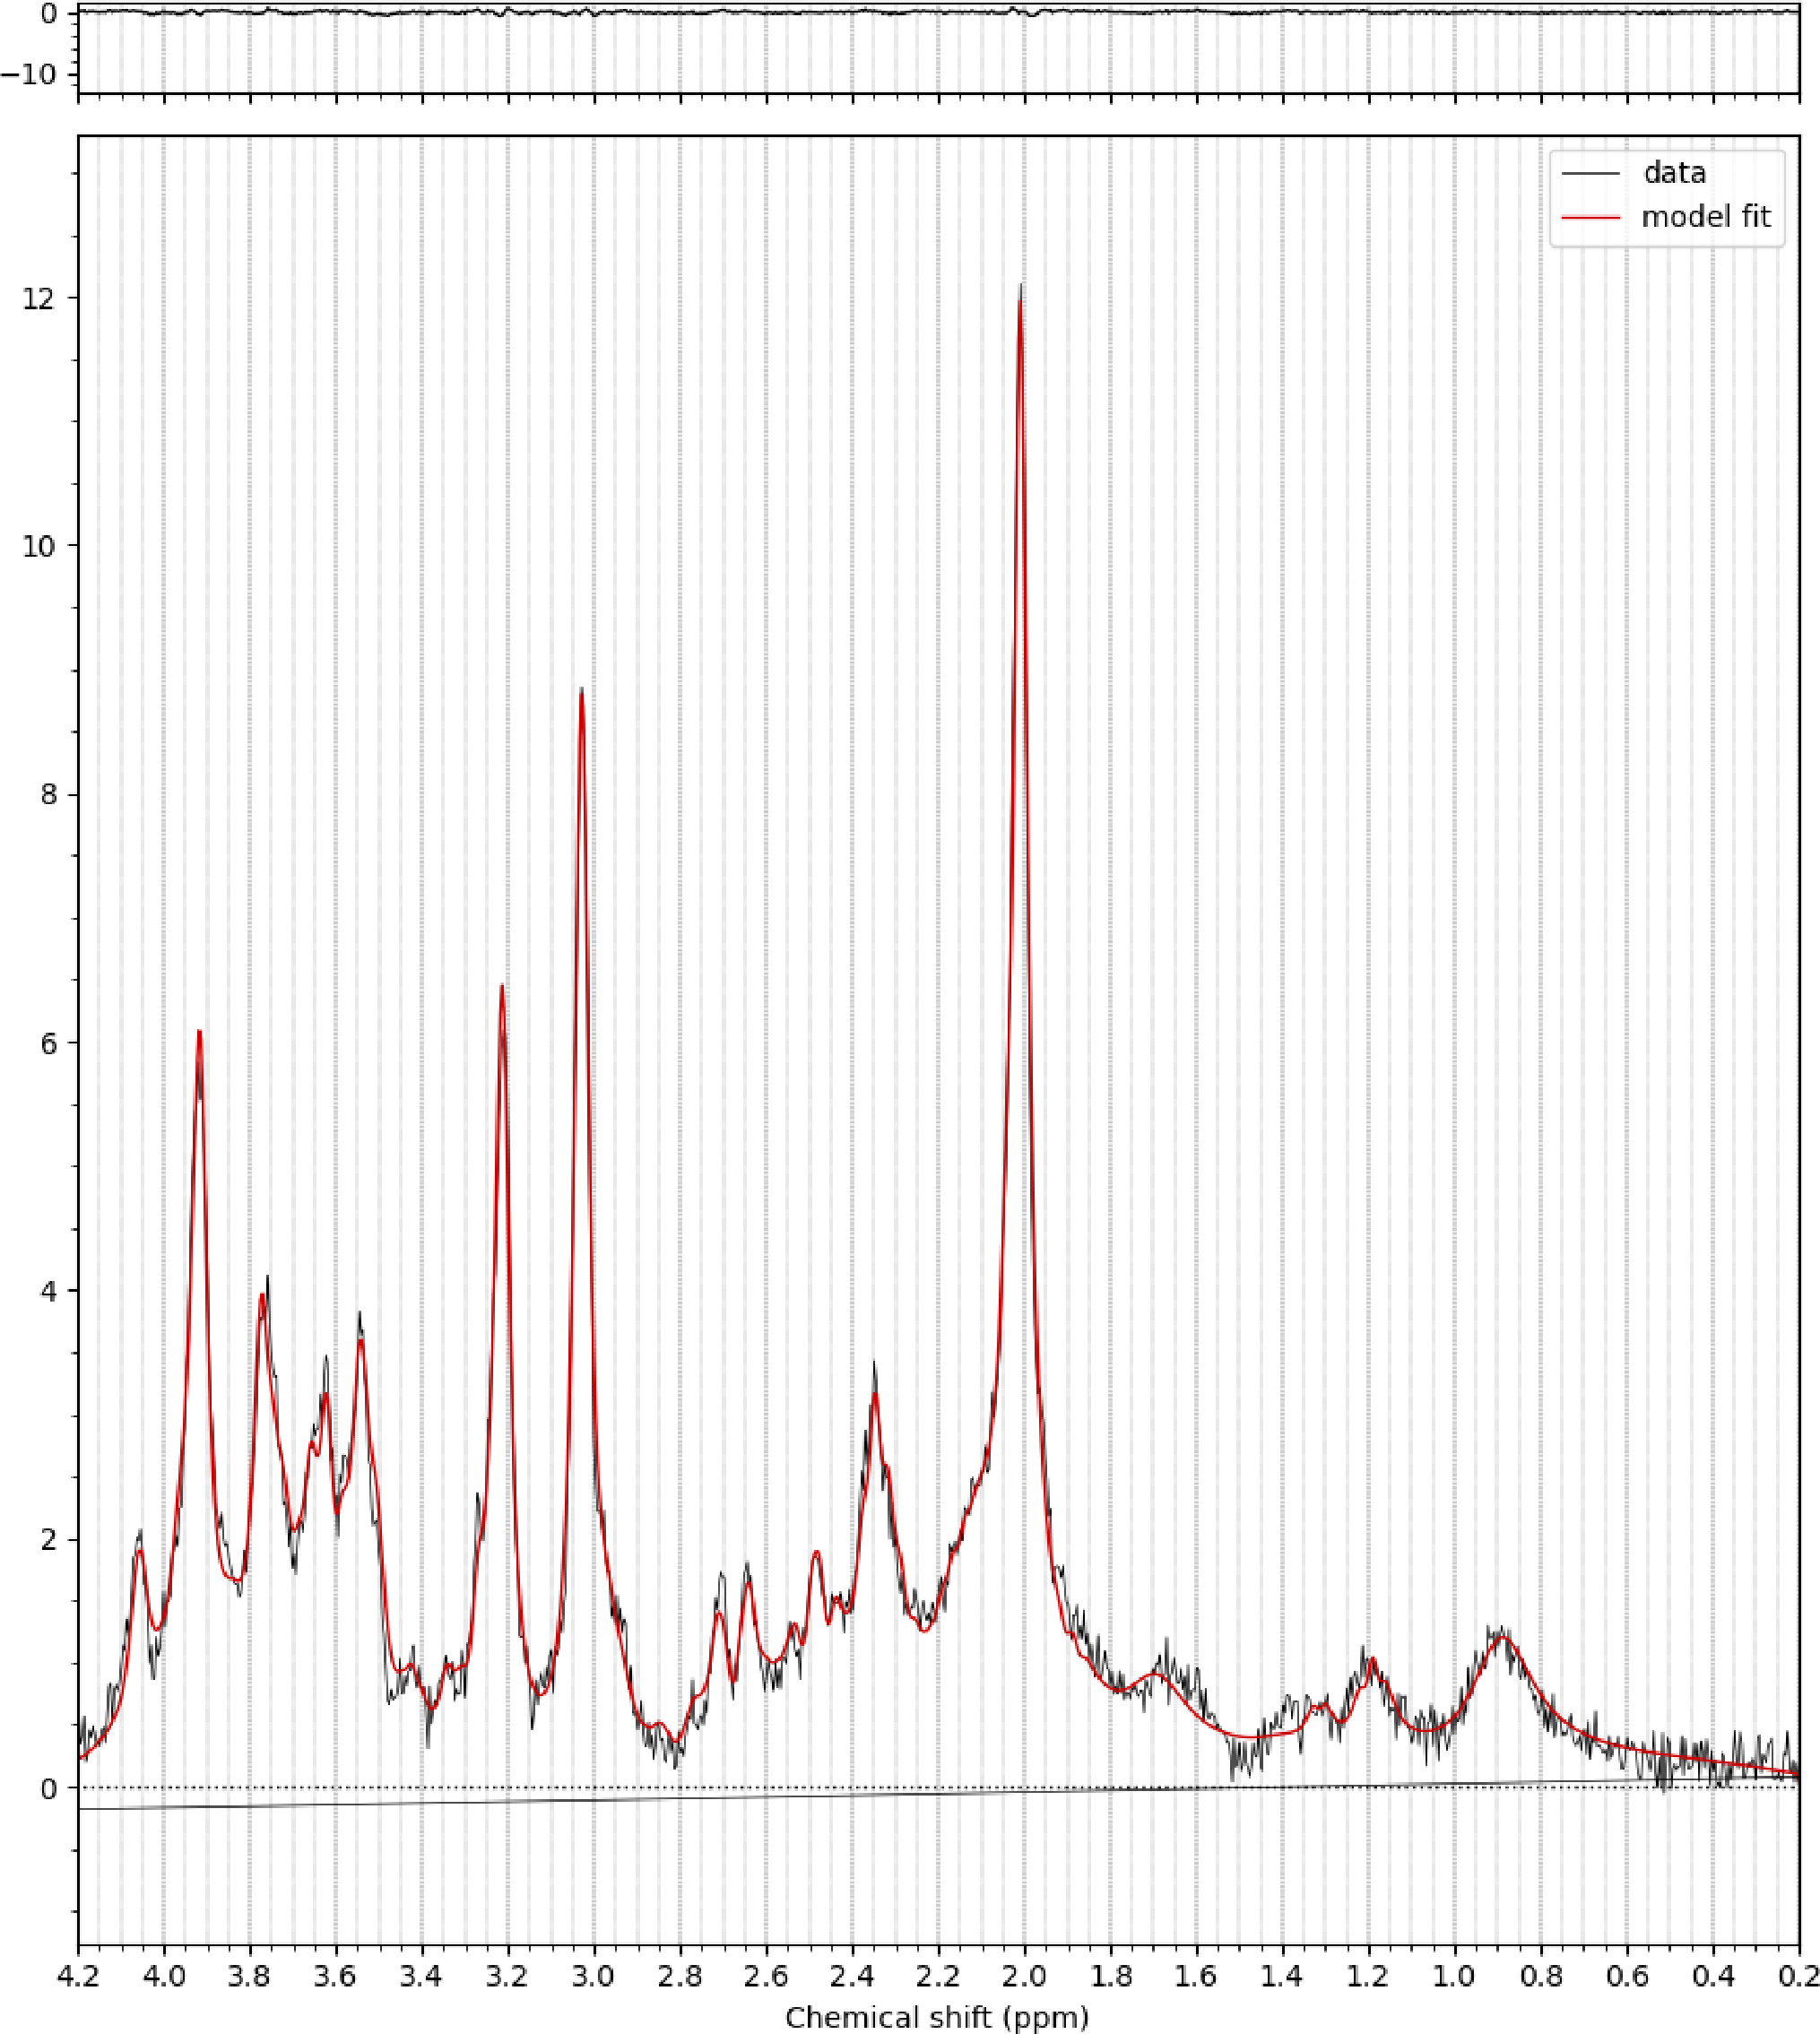 |
Additional files
Download links
A two-part list of links to download the article, or parts of the article, in various formats.
Downloads (link to download the article as PDF)
Open citations (links to open the citations from this article in various online reference manager services)
Cite this article (links to download the citations from this article in formats compatible with various reference manager tools)
Reevaluating the neural noise in dyslexia using biomarkers from electroencephalography and high-resolution magnetic resonance spectroscopy
eLife 13:RP99920.
https://doi.org/10.7554/eLife.99920.4


