Early-life stress induces persistent astrocyte dysfunction associated with fear generalisation
- Département de Neurosciences, Université de Montréal, Canada
- Centre de Recherche du Centre Hospitalier de l’Université de Montréal, Canada
Figures
Figure 1
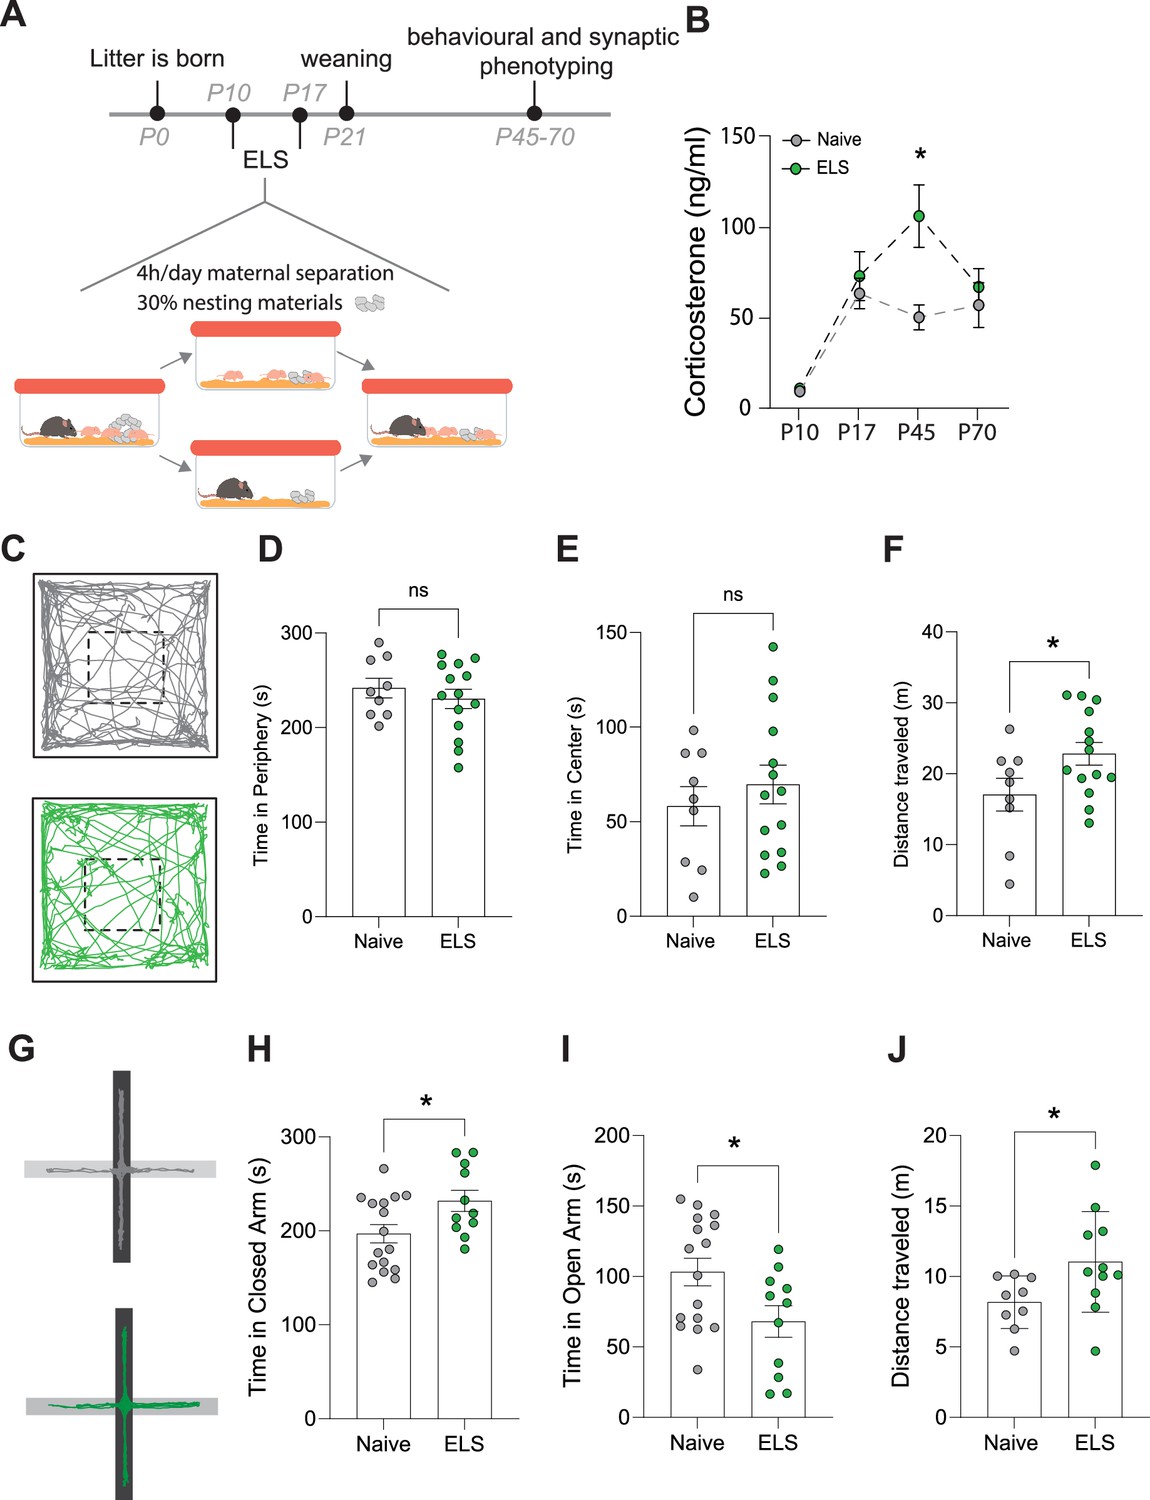
Effects of early-life stress (ELS) on anxiety-like behaviour.
(A) Timeline of ELS and behavioural assays. (B) Serum corticosterone levels are increased during adolescence, following ELS. p=0.01, naïve N = 9, ELS N = 11 mice. (C) Representative movement tracks of naive (grey) and ELS (green) mice in open-field task. (D) No significant difference in time spent in the periphery of open-field maze following ELS. p=0.4591, naïve N = 9, ELS N = 14 mice. (E) No significant difference in time spent in the centre of open-field maze following ELS. p=0.4591, naïve N = 9, ELS N = 14 mice. (F) Total distance travelled during open-field test was increased in ELS mice. p=0.04, naïve N = 9, ELS N = 14 mice. (G) Representative locomotor tracks in elevated plus maze in naïve and ELS mice, black segment represents closed arms with grey arms representing open arms. (H) ELS mice had increased time spent in closed arms p=0.0276, naïve N = 18, ELS N = 11 mice. (I) ELS mice had decreased time spent in open arms p=0.0276, naïve N = 18, ELS N = 11 mice. (J) Total distance travelled during elevated plus maze test was increased by ELS. p=0.02, naïve N = 9, ELS N = 11 mice. See Supplementary file 1 for detailed statistical summaries.
Figure 2 with 3 supplements
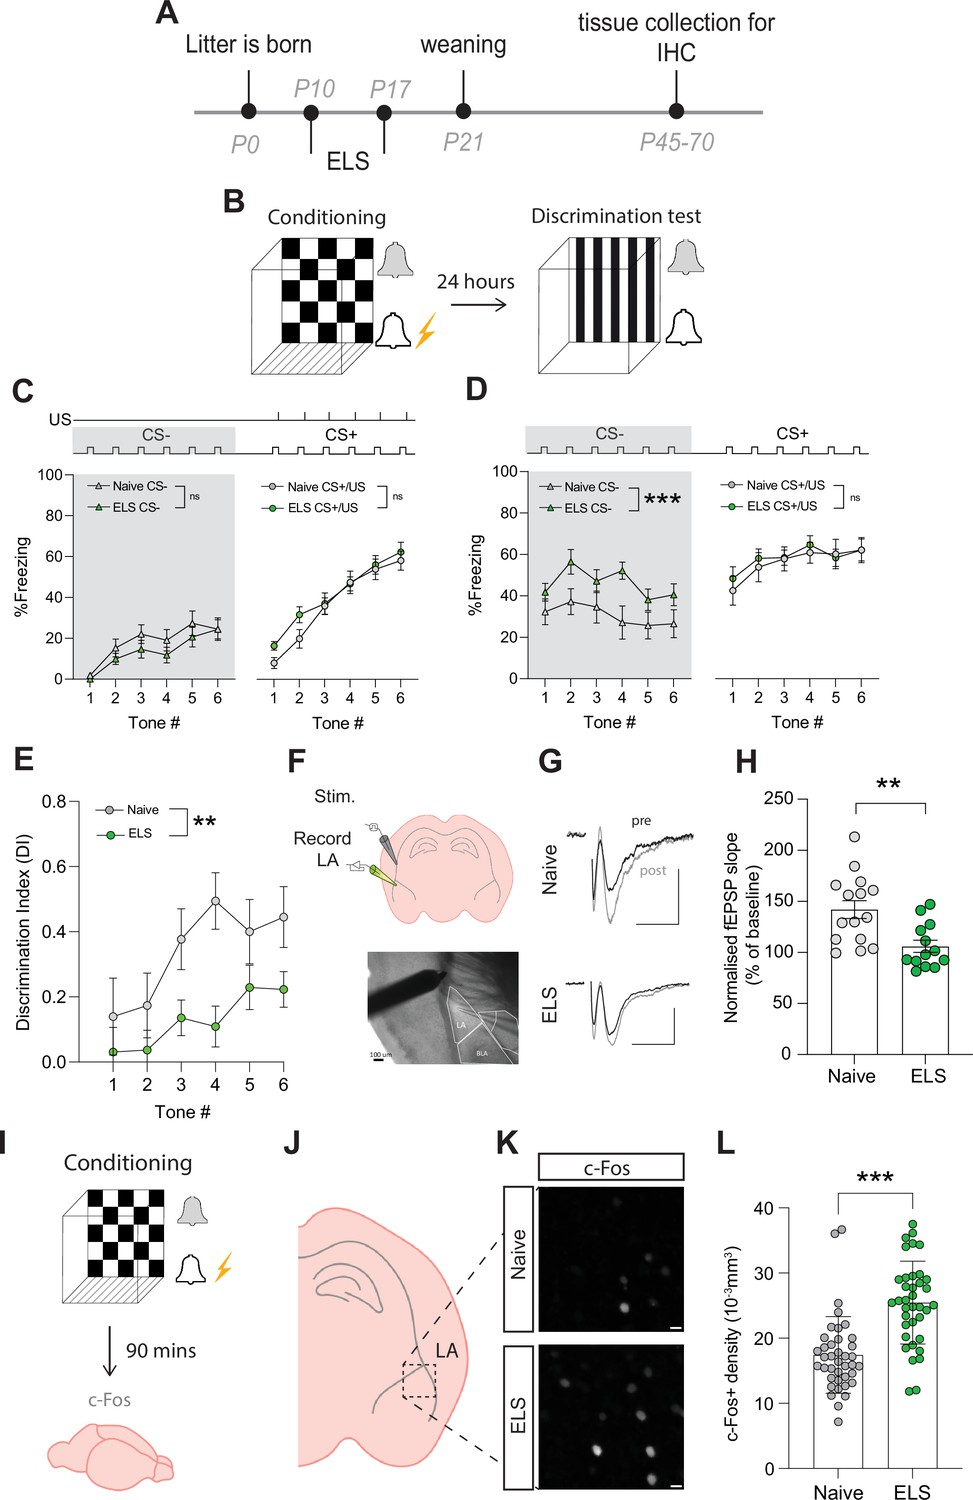
Early-life stress (ELS) alters fear memory, synaptic plasticity, and neural excitability.
(A) Experimental timeline. (B) Timeline of auditory discriminative fear conditioning paradigm. (C) ELS did not affect % freezing to neutral and aversive auditory cues during learning. Naïve N = 20, ELS N = 17. (D) % time freezing during presentation of neutral auditory cue (CS-; p=0.0002) and aversive cue (CS+; p=0.99). Naïve N = 20, ELS N = 17. (E) Discrimination Index was impaired by ELS. p=0.004, naïve N = 20, ELS N = 17. (F) Schematic representation of electrode placement in slice electrophysiology experiment (top) with DIC image below. (G) Representative EPSP traces from naïve (top) and ELS (bottom) brain slices during baseline (black trace) and after LTP stimulation (grey trace). Scale bars = 0.5 mV and 10 ms. (H) LTP was impaired by ELS. p=0.002, naïve N = 15, ELS N = 13. (I) Diagram of procedure for c-Fos staining experiments. (J) Brain slices containing lateral amygdala (LA) were selected for c-Fos staining. (L) Region of interest extracted from full amygdala image. Scale bars = 10 μm. (K) c-Fos-positive cell density was increased by ELS. p<0.0001, naïve n = 39 slices N = 10 mice, ELS n = 37 slices N = 10 mice. See Supplementary file 1 for detailed statistical summaries.
Figure 2—figure supplement 1
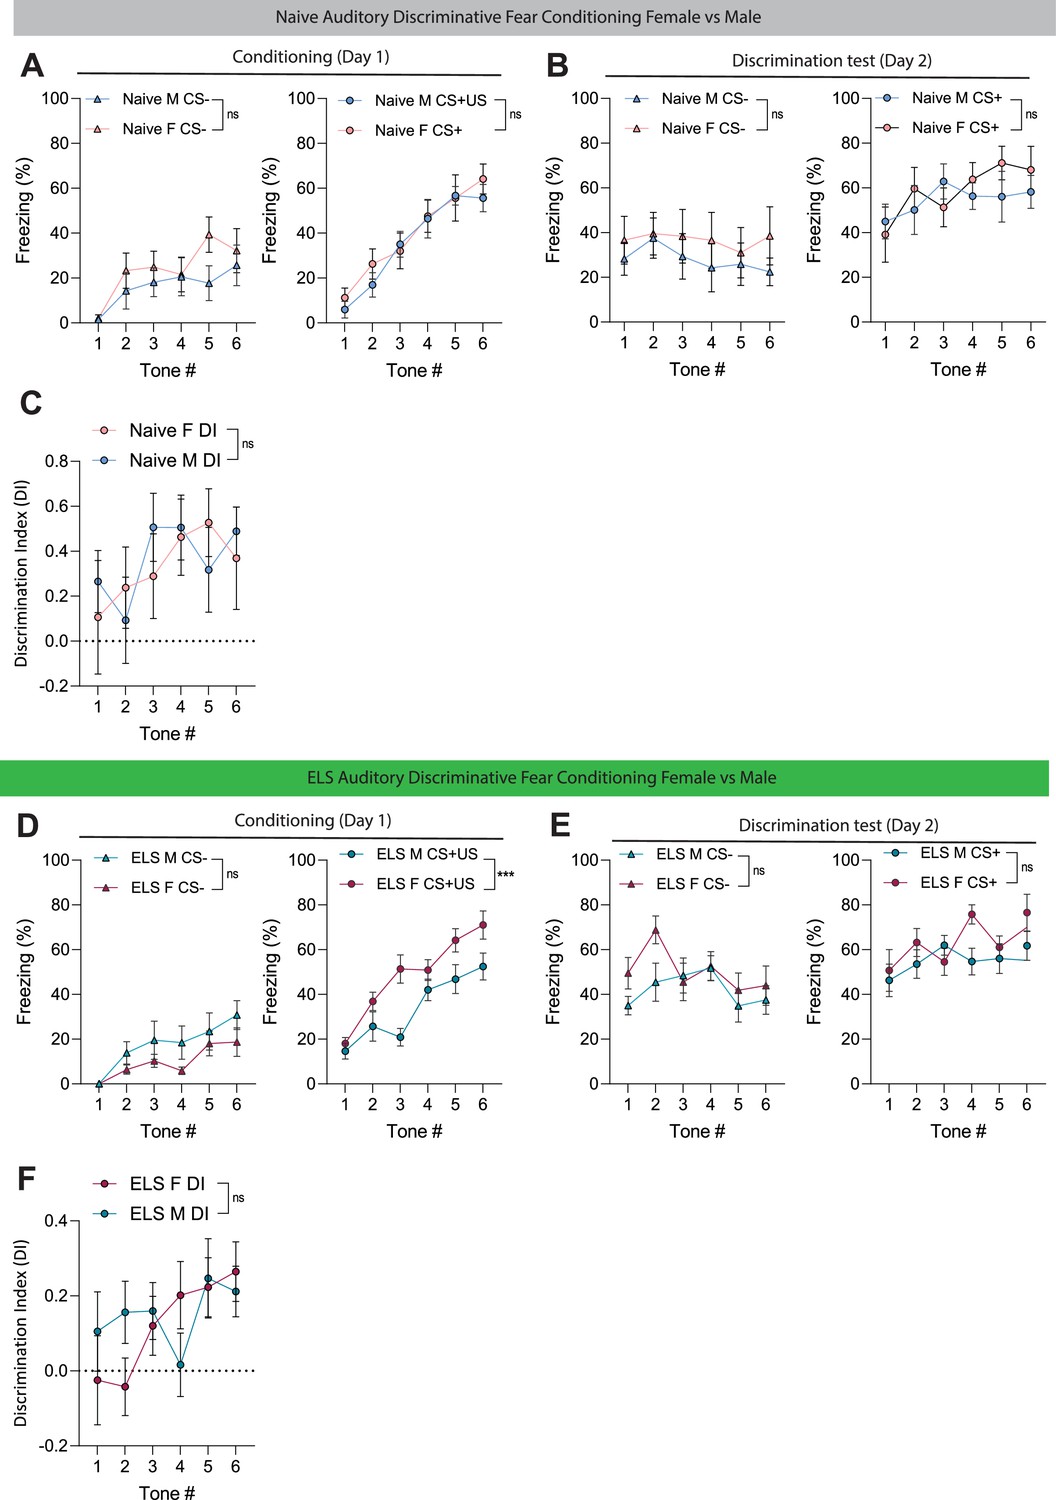
Effect of sex on amygdala-dependent learning and memory in naive and ELS mice.
(A) No differences between male and female naïve mice freezing during learning phase (conditioning) of auditory discriminative fear conditioning to CS- (left), p=0.2521; or CS+ (right), p=0.8432. Female N = 7, Male N = 8. (B) No differences between male and female naïve mice during memory recall of CS- (left), p=0.3956; and CS+ (right), p=0.8851. Female N = 7, Male N = 8. (C) No differences in auditory discrimination between male and female naïve mice. p=0.8505, Female N = 7, Male N = 8. (D) No differences between male and female early-life stress (ELS) mice freezing during learning phase (conditioning) of auditory discriminative fear conditioning to CS- (left), p=0.2521. Female ELS mice freeze significantly more to CS+ (right) than male counterparts, p<0.0001. Female N = 9, Male N = 8. (E) No differences between male and female ELS mice during memory recall of CS- (left), p=0.16220; or CS+ (right), p=0.1869. Female N = 9, Male N = 8. (F) No differences in auditory discrimination between male and female ELS mice. p=0.5157, female N = 9, male N = 8.
Figure 2—figure supplement 2
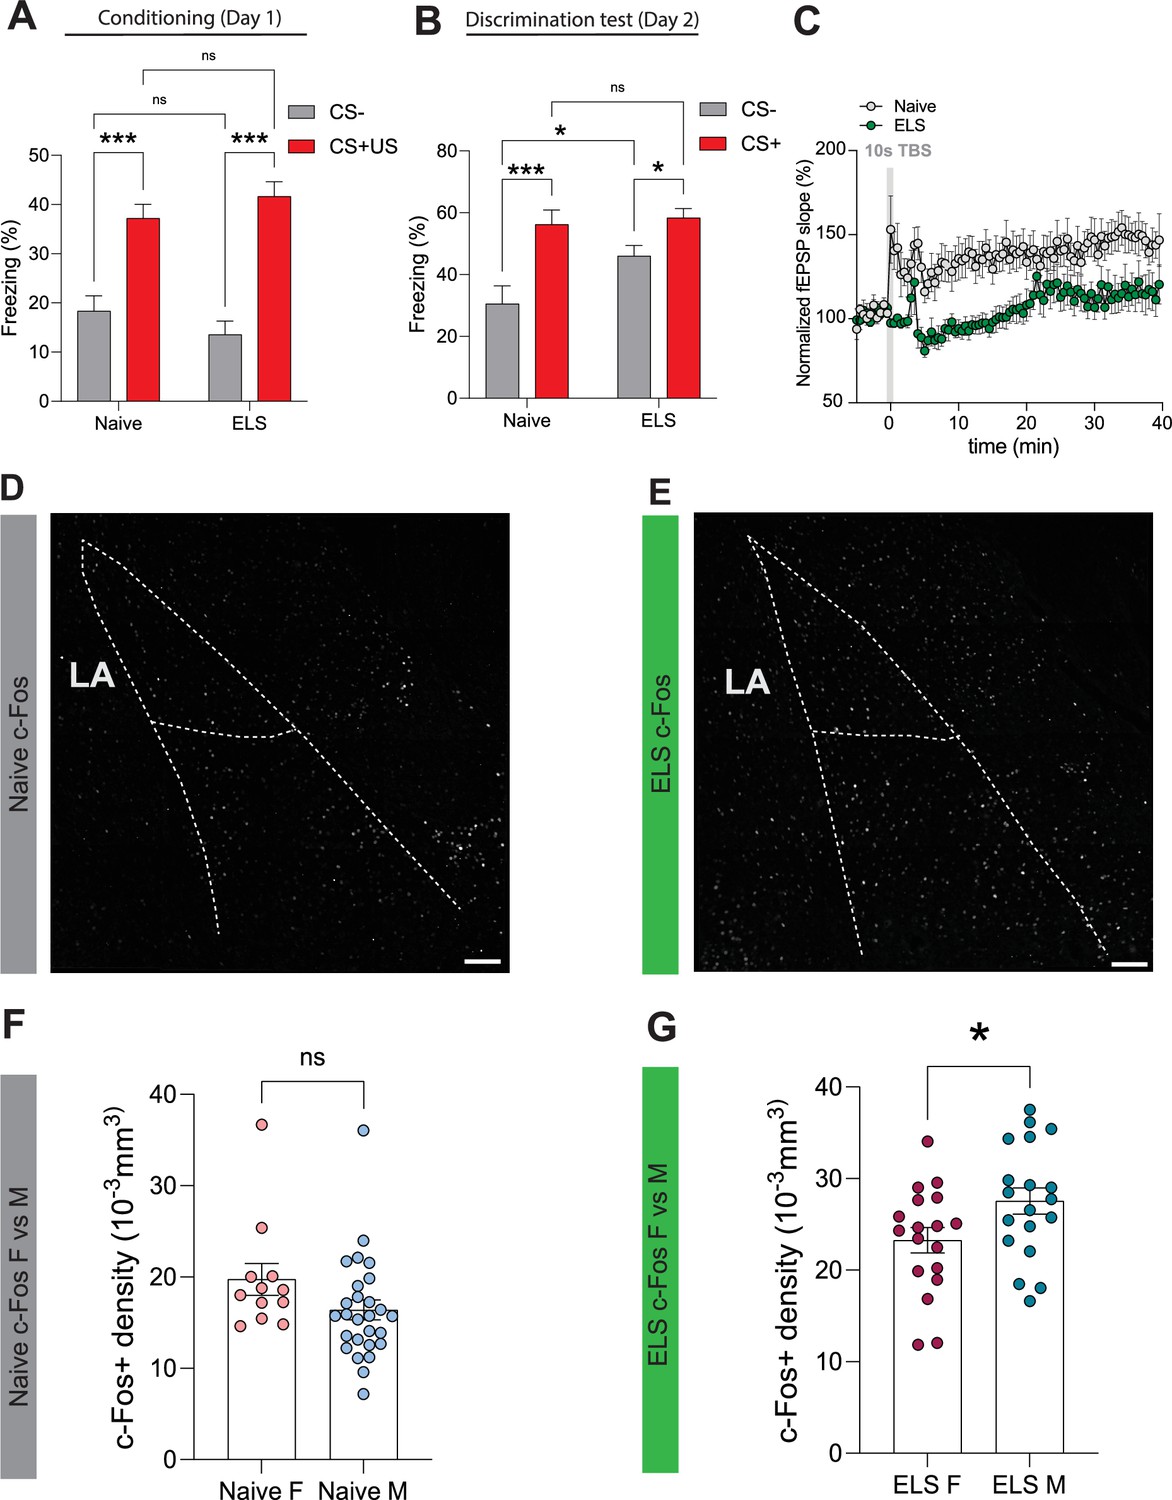
Sex-dependent effects of early-life-stress (ELS) on neuronal excitabiliy following fear conditioning.
(A) Average freezing responses to CS- (grey) and CS+ (red) during fear conditioning for naïve and early-life stress (ELS) mice. Tone (CS+/-) represents the within-subject variable while treatment (naïve/ELS) represents the between-subject variable. Naïve (CS- vs CS+/US), p<0.0001, N = 15 mice; ELS (CS- vs CS+/US), p<0.0001, N = 17; CS– (naïve vs ELS), p=0.2543, naïve N = 15 mice, ELS N = 17 mice; CS+/US (naïve vs ELS), p=0.2851, naïve N = 15 mice, ELS N = 17 mice. (B) Average freezing responses to CS- (grey) and CS+ (red) during discrimination for naïve and ELS mice. Tone (CS +/-) represents the within-subject variable while treatment (naïve/ELS) represents the between-subject variable. Naïve (CS- vs CS+/US), p=0.0001, N = 15 mice; ELS (CS- vs CS+/US), p=0.0392, N = 17 mice; CS- (naïve vs ELS), p=0.0128, naïve N = 15 mice, ELS N = 17 mice; CS+/US (naïve vs ELS), p=0.7267, naïve N = 15 mice, ELS N = 17 mice. (C) Normalised fEPSP slope showing synaptic response before and after theta burst stimulation (grey vertical bar) in naïve and ELS mice. (D) Representative Z-stack projection of c-Fos staining in entire lateral and basolateral amygdala in a naïve mice 90 min after conditioning. (E) Representative Z-stack projection of c-Fos staining in entire lateral and basolateral amygdala in an ELS mice 90 min after conditioning. (F) No differences in c-Fos density between male and female naïve mice 90 min after conditioning. p=0.1020, male n = 27, female n = 12. (G) ELS results in increased c-Fos density 90 min after conditioning in male mice compared to female counterparts. p=0.0383, male n = 19, female n = 18. Scale bars = 100 μm.
Figure 2—figure supplement 3
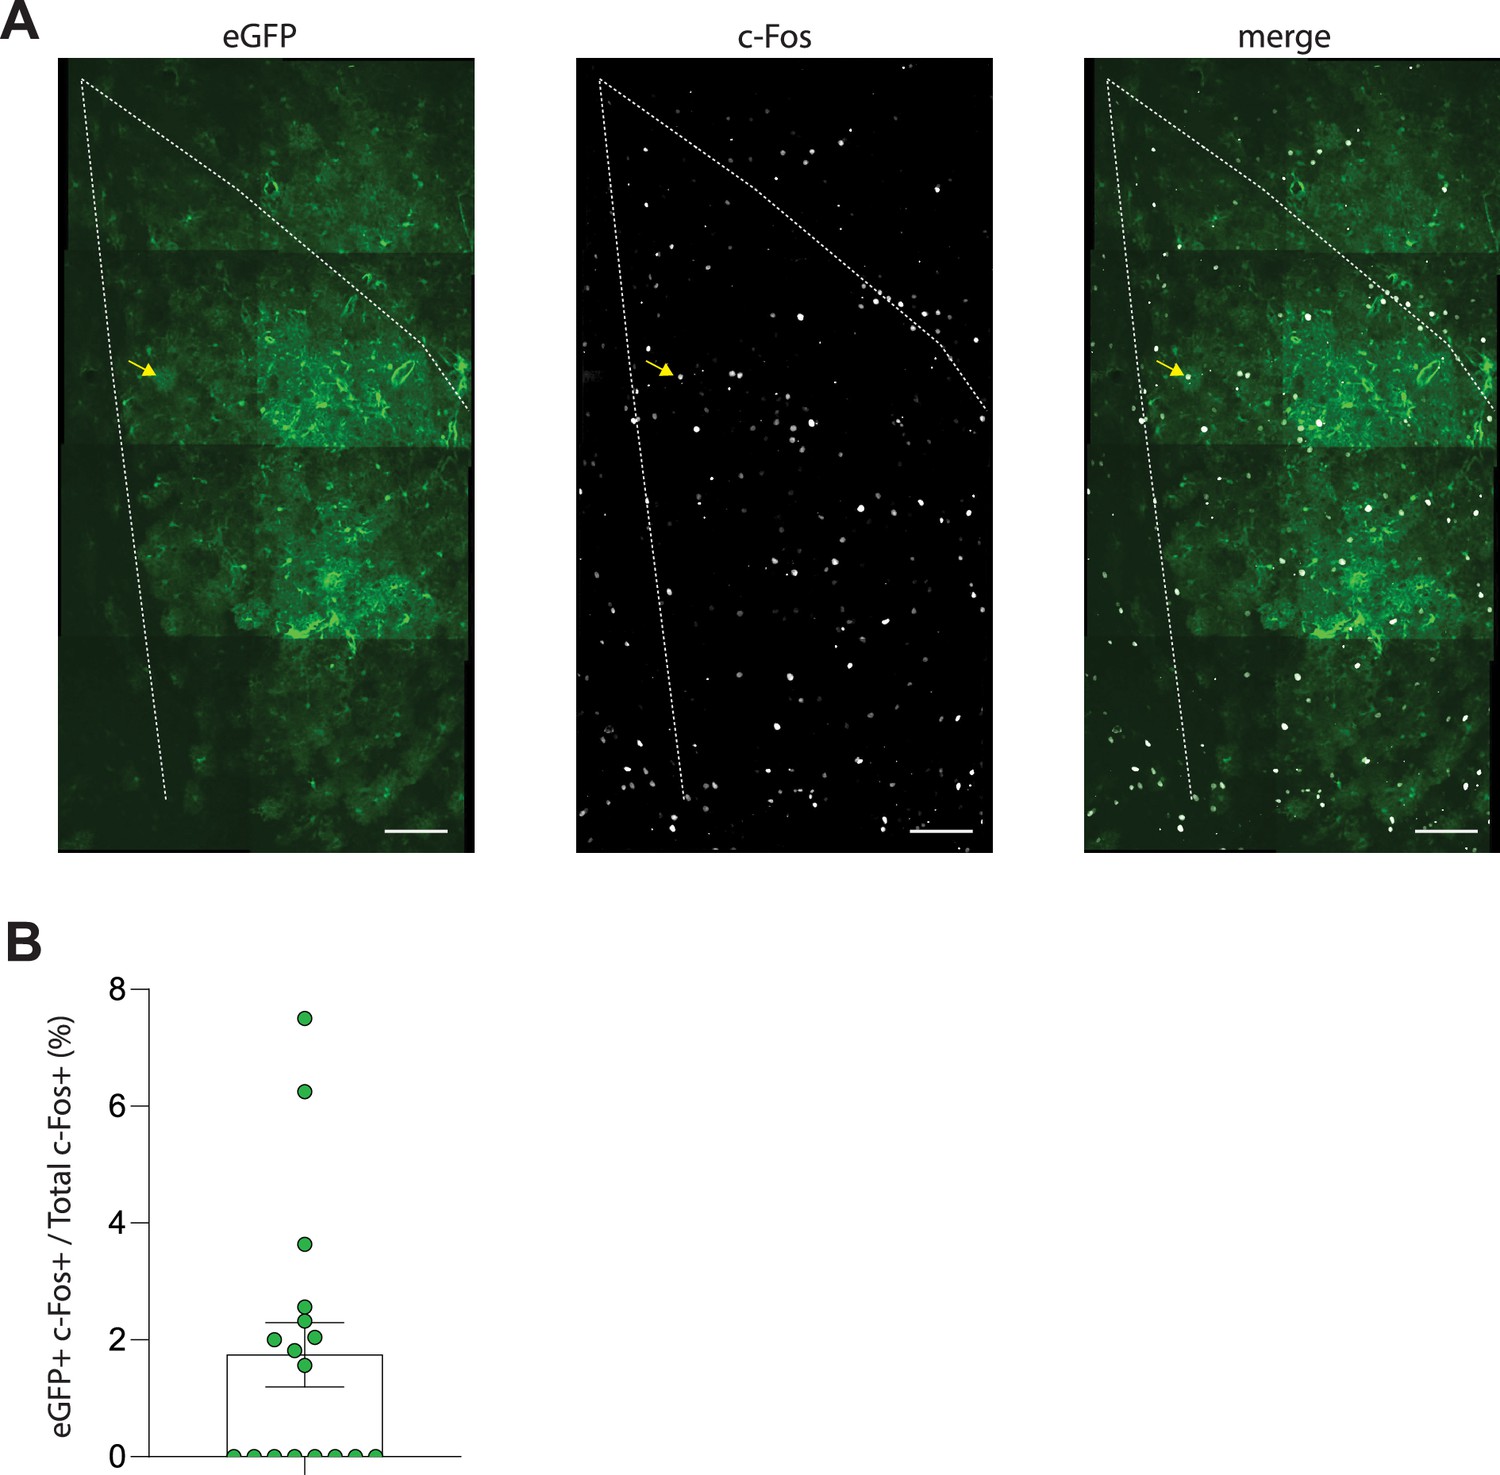
Astrocytic expression of c-Fos after fear conditioning.
(A) Representative immunostaining of eGFP-expressing astrocytes (left), c-Fos (middle), and merge (right), from the lateral amygdala 90 min following fear conditioning. Yellow arrows point to c-Fos-positive astrocyte. Scale bars = 100 μm. (B) Quantification of eGFP-positive c-Fos-positive astrocytes as a percentage of total c-Fos-positive counts in the lateral amygdala.
Figure 3 with 1 supplement
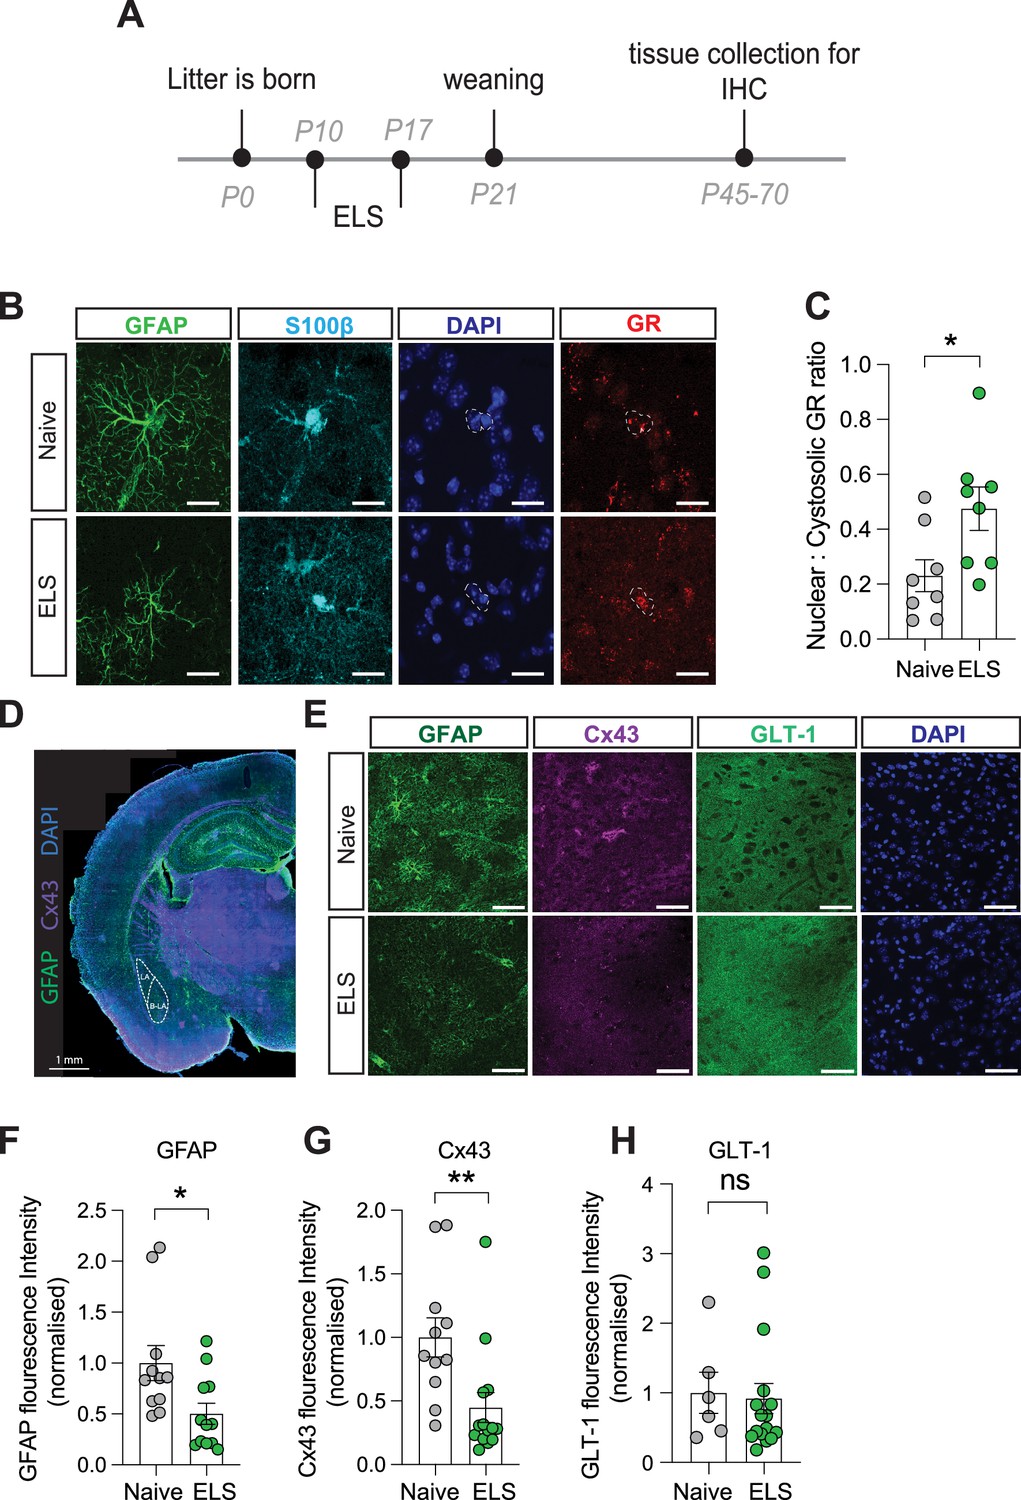
Long-term astrocyte dysfunction after early-life stress.
(A) Experimental timeline. (B) Representative immunostaining of GFAP, S100β, GR, DAPI, and GR/DAPI merge in naïve and early-life stress (ELS) conditions. Scale bars = 20 μm. (C) Nuclear/cystolic GR ratio in astrocytes was increased after ELS. p=0.026, naïve N = 8, ELS N = 8. (D) Representative slide scan image of immunostaining for astrocyte proteins GFAP and Cx43. (E) Representative immunostaining of GFAP, Cx43, GLT-1, and DAPI in naïve and ELS conditions. Scale bars = 50 μm (F) GFAP staining was reduced in ELS mice. p=0.02, Naïve N = 11, ELS N = 12. (G) Cx43 staining was decreased in ELS mice. p=0.008, naïve N = 11, ELS = 14. (H) GLT-1 expression was unchanged by ELS. p=0.8, naïve N = 6, ELS N = 16. See Supplementary file 1 for detailed statistical summaries.
Figure 3—figure supplement 1
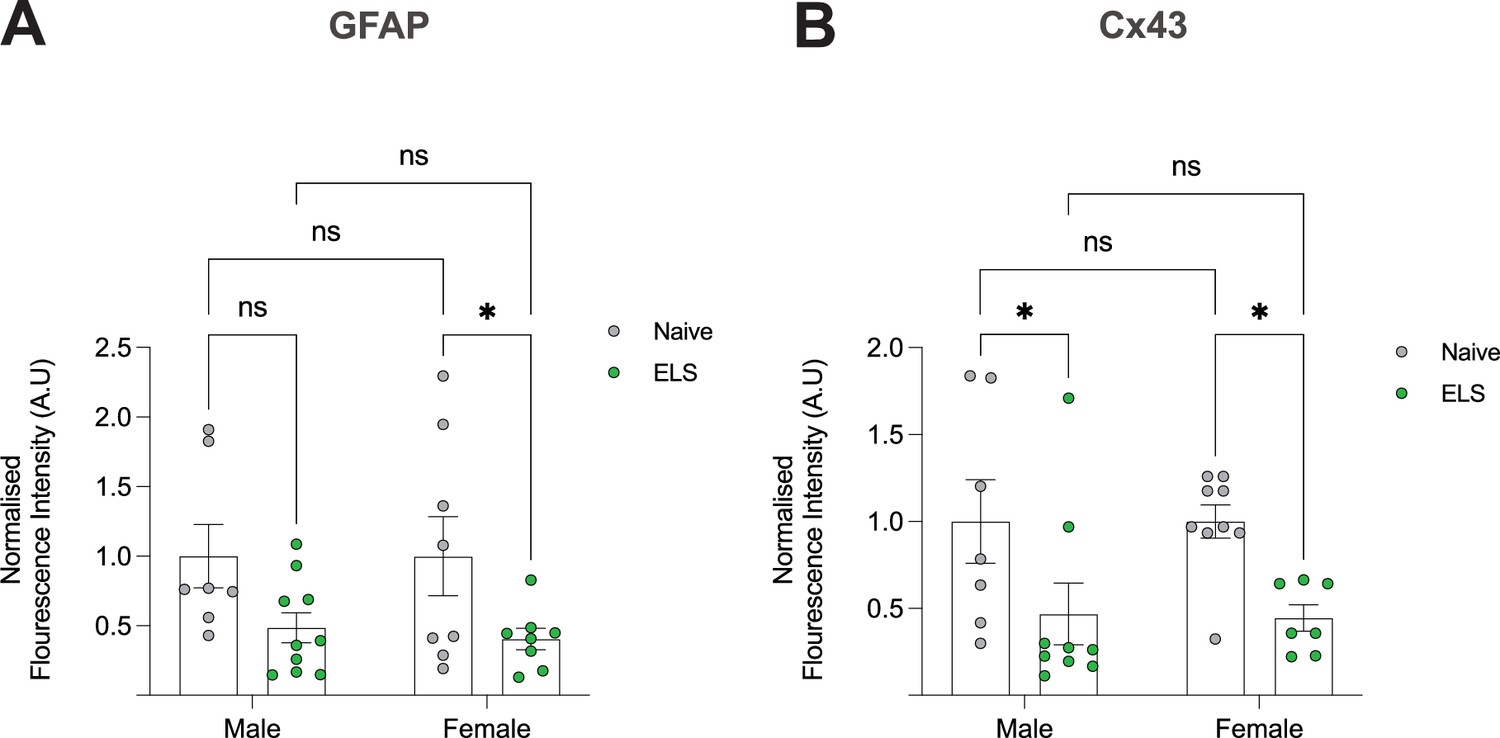
Absence of sex-differences in GFAP and Cx43 in naïve and ELS mice.
(A) Normalised fluorescence intensity values of GFAP in the lateral amygdala of naïve and early-life stress (ELS) mice split by sex. Naïve male (N = 7) vs ELS male (N = 10), p=0.582; naïve female (N = 8) vs ELS female (N = 8), p=0.0323; naïve male vs naïve female, p>0.999; ELS male vs ELS female, p=0.750. (B) Normalised fluorescence intensity values of Cx43 in the lateral amygdala of naïve and ELS mice split by Sex. Naïve male (N = 7) vs ELS male (N = 9), p=0.0253; naïve female (N = 9) vs ELS female (N = 7), p=0.0201; naïve male vs naïve female, pp>0.999; ELS male vs ELS female, p=0.9189.
Figure 4 with 1 supplement
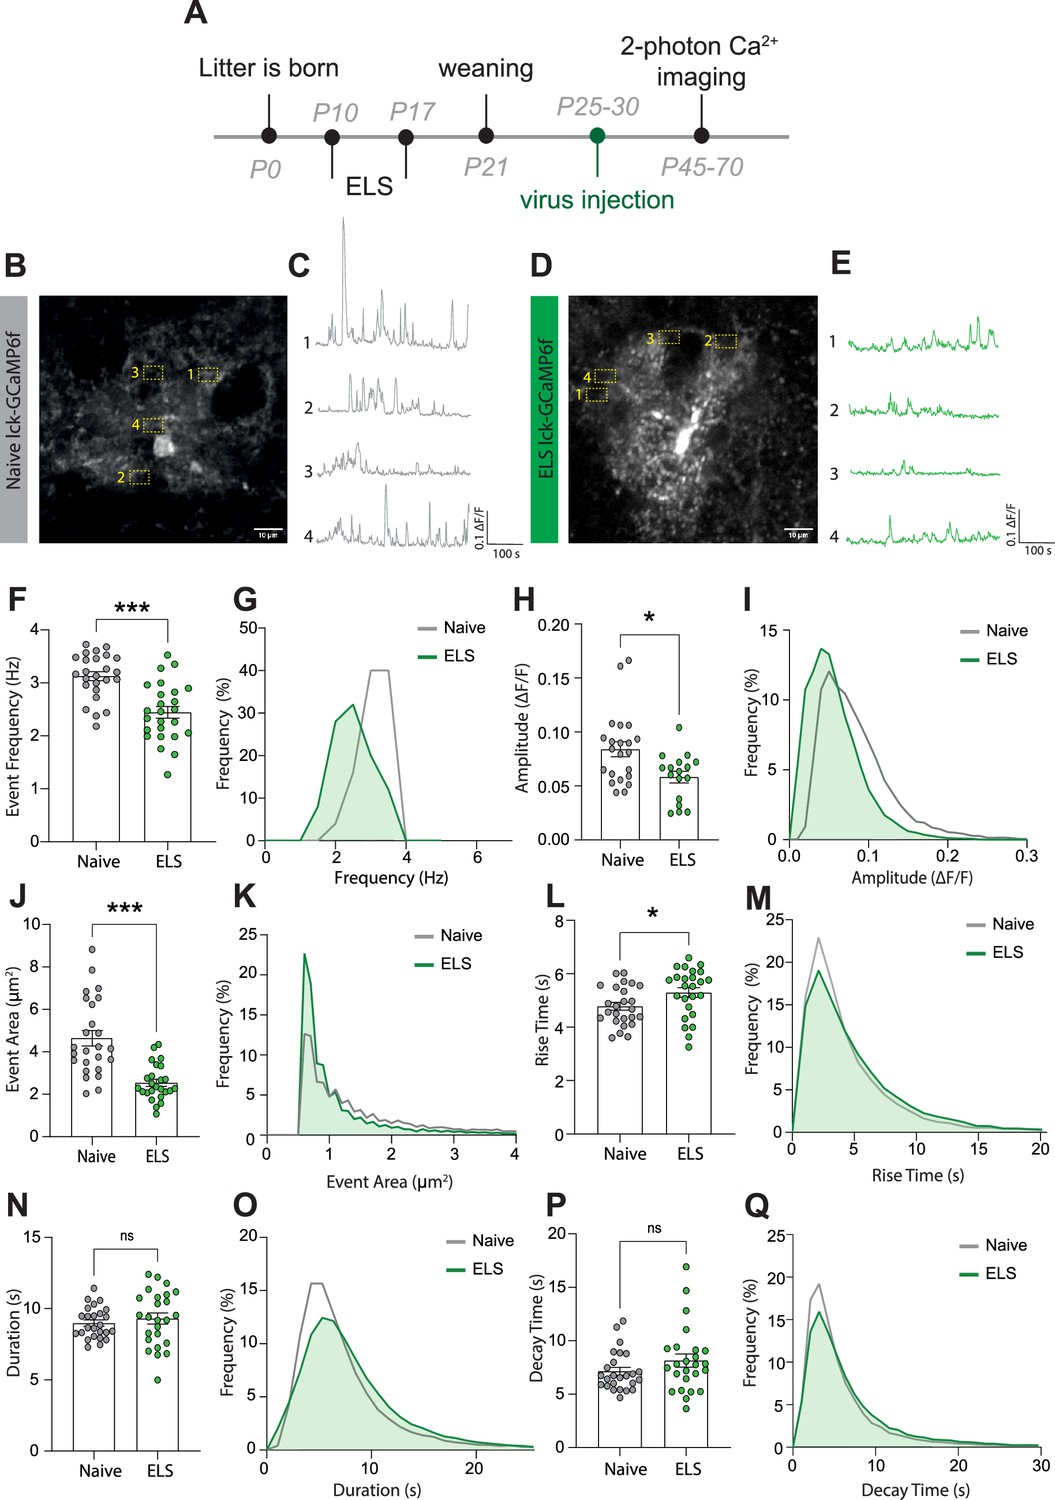
Early-life stress (ELS) induces a hypofunction in lateral amygdala astrocyte calcium signalling.
(A) Experimental timeline including age of viral injection and experimental window for two-photon calcium imaging. (B) Representative image of a lck-GCaMP6f-expressing astrocyte in the lateral amygdala with four regions of interest from a naïve animal. Scale bar = 10 μm. (C) Representative calcium-signalling traces from four regions of interest shown in (B). (D) Representative image of a lck-GCaMP6f-expressing astrocyte in the lateral amygdala with four regions of interest from an ELS animal. Scale bar = 10 μm. (E) Representative calcium-signalling traces from four regions of interest shown in (D). (F) Frequency of calcium events was decreased lateral amygdala astrocytes after ELS, p<0.0001, naïve n = 25 astrocytes from N = 8 animals, ELS n = 25 astrocytes from N = 7 animals. (G) Frequency distribution of calcium event frequency from naïve (grey line) and ELS (green line) animals. (H) Amplitude of calcium events was decreased after ELS, p=0.0165, naïve n = 22 astrocytes from N = 8 animals, ELS n = 17 astrocytes from N = 7 animals. (I) Frequency distribution of calcium event amplitude from naïve (grey line) and ELS (green line) animals. (J) Area of calcium events was decreased after ELS, p<0.0001, naïve n = 25 astrocytes from N = 8 animals, ELS n = 25 astrocytes from N = 7 animals. (K) Frequency distribution of event area from naïve (grey line) and ELS (green line) animals. (L) Rise time of calcium events was increased following ELS, p=0.0311, naïve n = 25 astrocytes from N = 8 animals, ELS n = 25 astrocytes from N = 7 animals. (M) Frequency distribution of calcium event rise from naïve (grey line) and ELS (green line) animals. (N) Calcium event duration was unchanged by ELS, p=0.4740, naïve n = 25 astrocytes from N = 8 animals, ELS n = 25 astrocytes from N = 7 animals. (O) Frequency distribution of calcium event duration from naïve (grey line) and ELS (green line) animals. (P) Decay time of calcium events was unaltered by ELS, p=0.2164, naïve n = 25 astrocytes from N = 8 animals, ELS n = 25 astrocytes from N = 7 animals. (Q) Frequency distribution of calcium event decay time duration from naïve (grey line) and ELS (green line) animals.
Figure 4—figure supplement 1
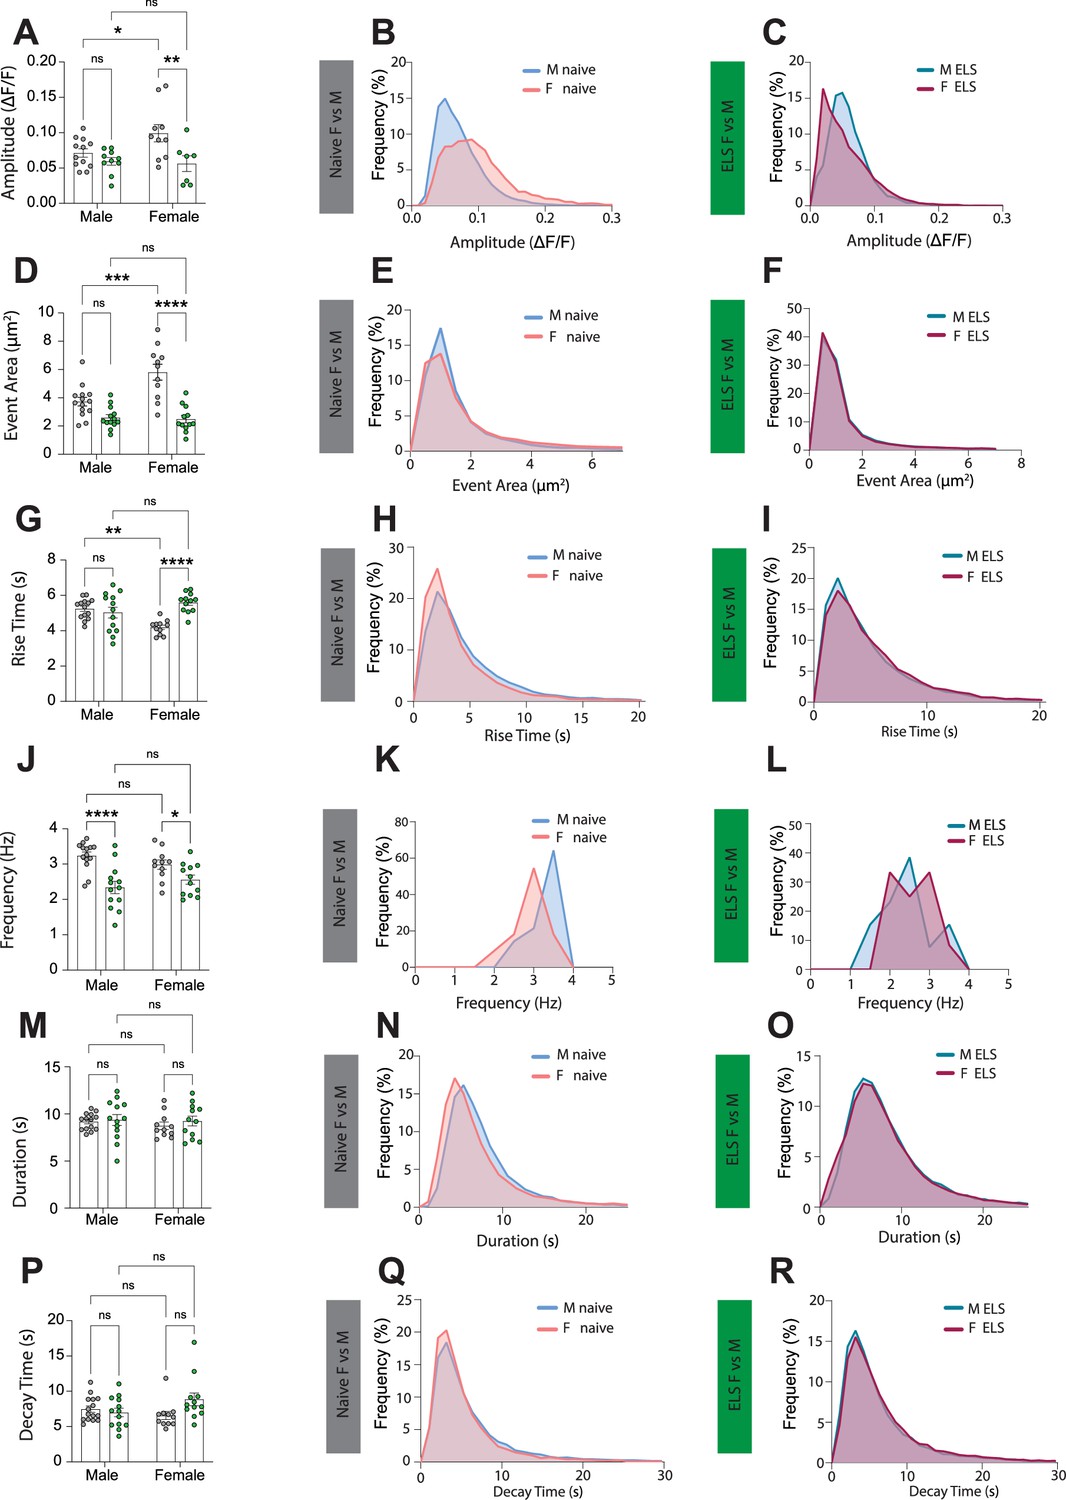
Early-life-stress suppresses sexual dimorphism in lateral amygdala astrocyte calcium activity.
(A) Early-life stress (ELS) results in decreased calcium event amplitude only for female mice. Male (naïve vs ELS), p=0.5478; female (naïve vs ELS), p=0.0058. Increased calcium event amplitude was observed in naïve females compared to males. Naïve (male vs female), p=0.0425. No differences were observed between male and female ELS animals. ELS (male vs female), p=0.9627. Naïve male n = 13 astrocytes, naïve female n = 10 astrocytes, ELS male n = 10 astrocytes, ELS female n = 8 astrocytes. (B) Frequency distribution of calcium event amplitude from naïve male (blue line) and female (red line) mice. (C) Frequency distribution of calcium event amplitude from ELS male (dark teal line) and female (purple line) mice. (D) ELS results in decreased calcium event area only for female mice. Male (naïve vs ELS), p=0.0385; female (naïve vs ELS), p<0.0001. Increased calcium event area was observed in naïve females compared to males. Naïve (male vs female), p=0.0002. No differences were observed between male and female ELS animals. ELS (male vs female), p=0.9702 naïve male n = 14 astrocytes, naïve female n = 11 astrocytes, ELS male n = 13 astrocytes, ELS female n = 12 astrocytes. (E) Frequency distribution of calcium event area from naïve male (blue line) and female (red line) mice. (F) Frequency distribution of calcium event area from ELS male (dark teal line) and female (purple line) mice. (G) ELS results in increased calcium event rise time only for female mice. Male (naïve vs ELS), p=0.6814; female (naïve vs ELS), p<0.0001. Increased calcium event amplitude was observed in naïve males compared to females. Naïve (male vs female), p=0.0014. No differences were observed between male and female ELS animals. ELS (male vs female), p=0.1062. Naïve male n = 14 astrocytes, naïve female n = 11 astrocytes, ELS male n = 13 astrocytes, ELS female n = 12 astrocytes. (H) Frequency distribution of calcium event rise time from naïve male (blue line) and female (red line) mice. (I) Frequency distribution of calcium event rise time from ELS male (dark teal line) and female (purple line) mice. (J) ELS results in decreased frequency of calcium events both for males and females. Male (naïve vs ELS), p<0.0001; female (naïve vs ELS), p=0.0419. No difference in calcium event frequency were observed between male and females within the naïve or ELS groups. Naïve (male vs female), p=0.2053; ELS (male vs female), p=0.2671. Naïve male n = 14 astrocytes, naïve female n = 11 astrocytes, ELS male n = 13 astrocytes, ELS female n = 12 astrocytes. (K) Frequency distribution of calcium event frequency from naïve male (blue line) and female (red line) mice. (L) Frequency distribution of calcium event frequency from ELS male (dark teal line) and female (purple line) mice. (M) No differences in calcium event duration between Naïve and ELS female and male mice. Male (naïve vs ELS), p=0.7688; female (naïve vs ELS), p=0.4499. Naïve (male vs female), p=0.4983; ELS (male vs female), p=0.8604. Naïve male n = 14 astrocytes, naïve female n = 11 astrocytes, ELS male n = 13 astrocytes, ELS female n = 12 astrocytes. (N) Frequency distribution of calcium event duration from naïve male (blue line) and female (red line) mice. (O) Frequency distribution of calcium event duration from ELS male (dark teal line) and female (purple line) mice. (P) No differences in calcium event decay time between naïve and ELS female and male mice. Male (naïve vs ELS), p=0.9997; female (naïve vs ELS), p=0.0718. Naïve (male vs female), p=0.5942; ELS (male vs female), p=0.3383. Naïve male n = 14 astrocytes, naïve female n = 11 astrocytes, ELS male n = 13 astrocytes, ELS female n = 12 astrocytes. (Q) Frequency distribution of calcium event decay time from naïve male (blue line) and female (red line) mice. (R) Frequency distribution of calcium event decay time from ELS male (dark teal line) and female (purple line) mice.
Figure 5 with 5 supplements
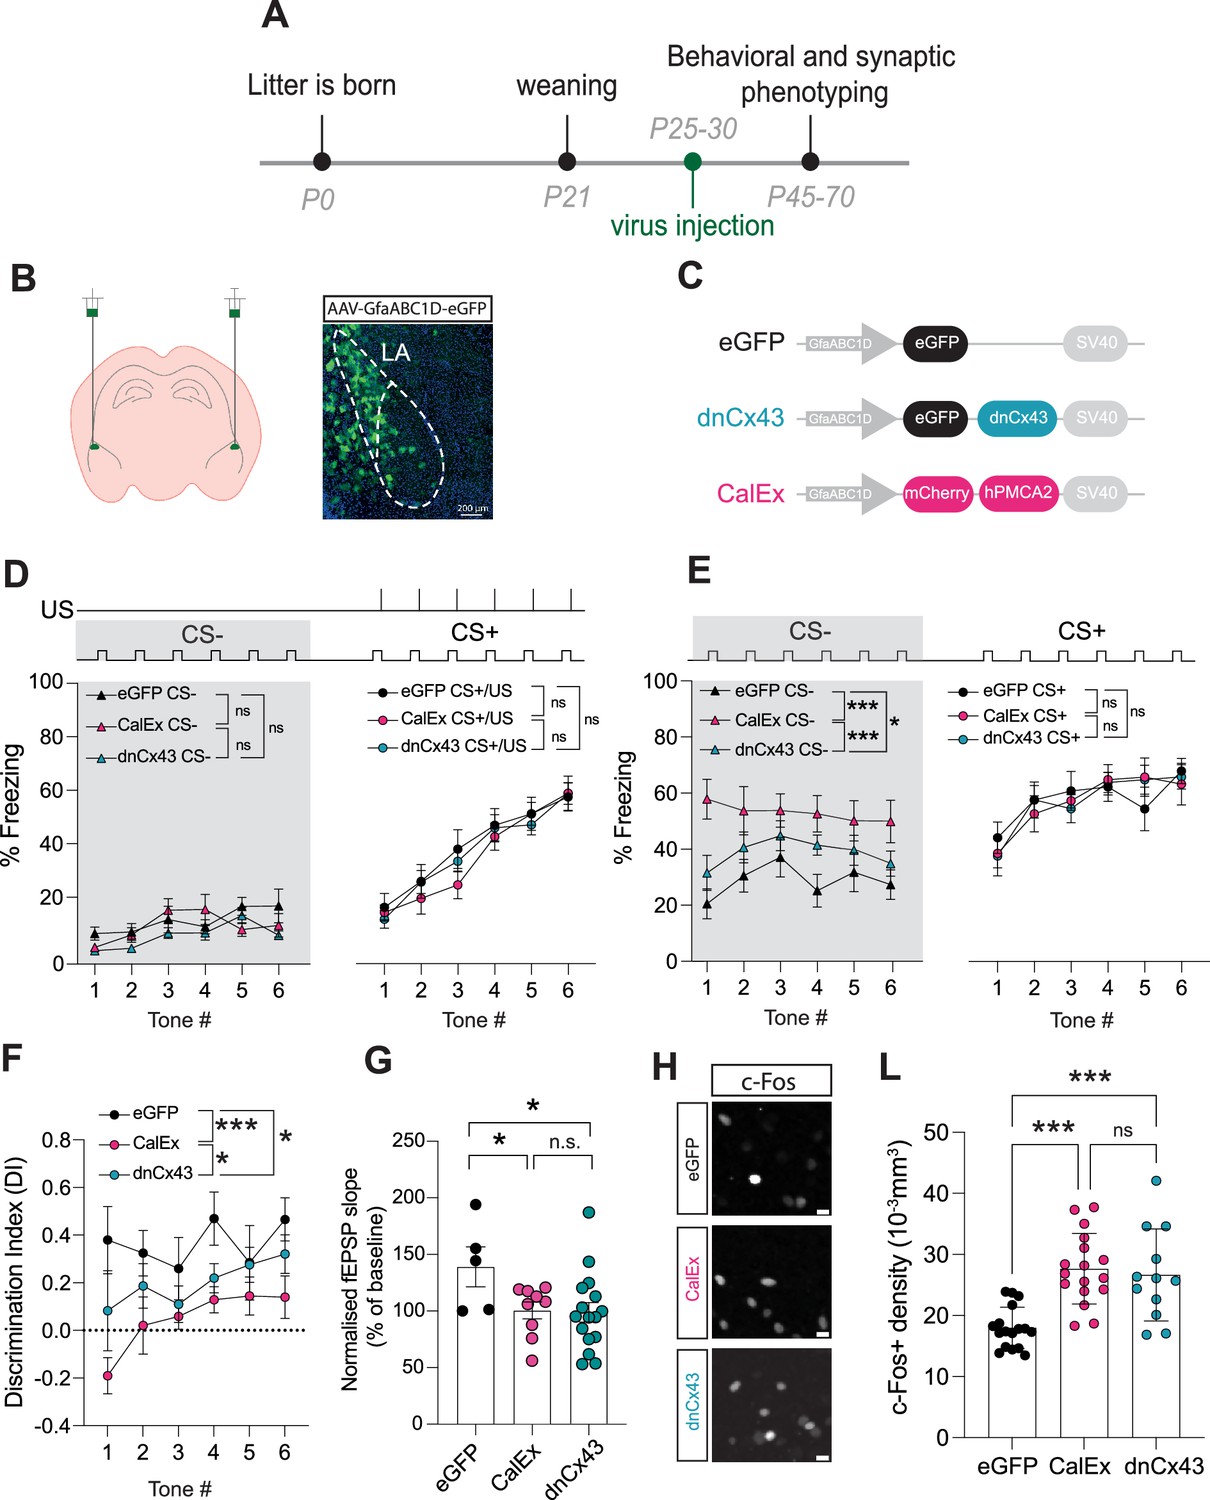
Astrocyte dysfunction mimics the effects of early-life stress (ELS) on behaviour, synapses, and neural excitability.
(A) Experimental timeline. (B) Representative image showing localisation of viral vector in lateral amygdala. (C) Viral constructs used to manipulate astrocyte function. (D) Astrocyte dysfunction did not affect % freezing to neutral and aversive auditory cues during learning. eGFP N = 12, CalEx N = 11, dnCx43 N = 17 mice. (E) % time freezing during presentation of neutral auditory cue (CS-) was increased with astrocyte dysfunction (eGFP vs CalEx: p<0.0001; eGFP vs dnCx43: p=0.029; CalEx vs dnCx43: p=0.0005) with no impact on % freezing to aversive cue (CS+). eGFP N = 12, CalEx N = 11, dnCx43 N = 17 mice. (F) Discrimination Indexes were impaired by astrocyte dysfunction. eGFP vs CalEx: p<0.0001; eGFP vs dnCx43: p=0.013; CalEx vs dnCx43: p=0.03. eGFP N = 12, CalEx N = 11, dnCx43 N = 17 mice. (G) Astrocyte dysfunction occluded the induction of LTP. eGFP vs CalEx: p=0.04; eGFP vs dnCx43: p=0.02; CalEx vs dnCx43: p=0.88. eGFP N = 5, CalEx N = 9, dnCx43 N = 16. (H) Representative c-Fos staining in the lateral amygdala in control (eGFP), CalEx, and dnCx43 conditions. Scale bars = 10 μm. (L) c-Fos-positive cell density was increased with astrocyte dysfunction. eGFP vs CalEx: p<0.0001; eGFP vs dnCx43: p=0.0005; CalEx vs dnCx43: p=0.88. eGFP n = 17 slices N = 5 mice, CalEx n = 17 slices N = 5 mice, dnCx43 n = 12 slices N = 5 mice.
Figure 5—figure supplement 1

Viral targeting of lateral amygdala astrocytes.
(A) Representative viral targeting of lateral amygdala astrocytes with AAV-GfaABC1D-eGFP.
Figure 5—figure supplement 2
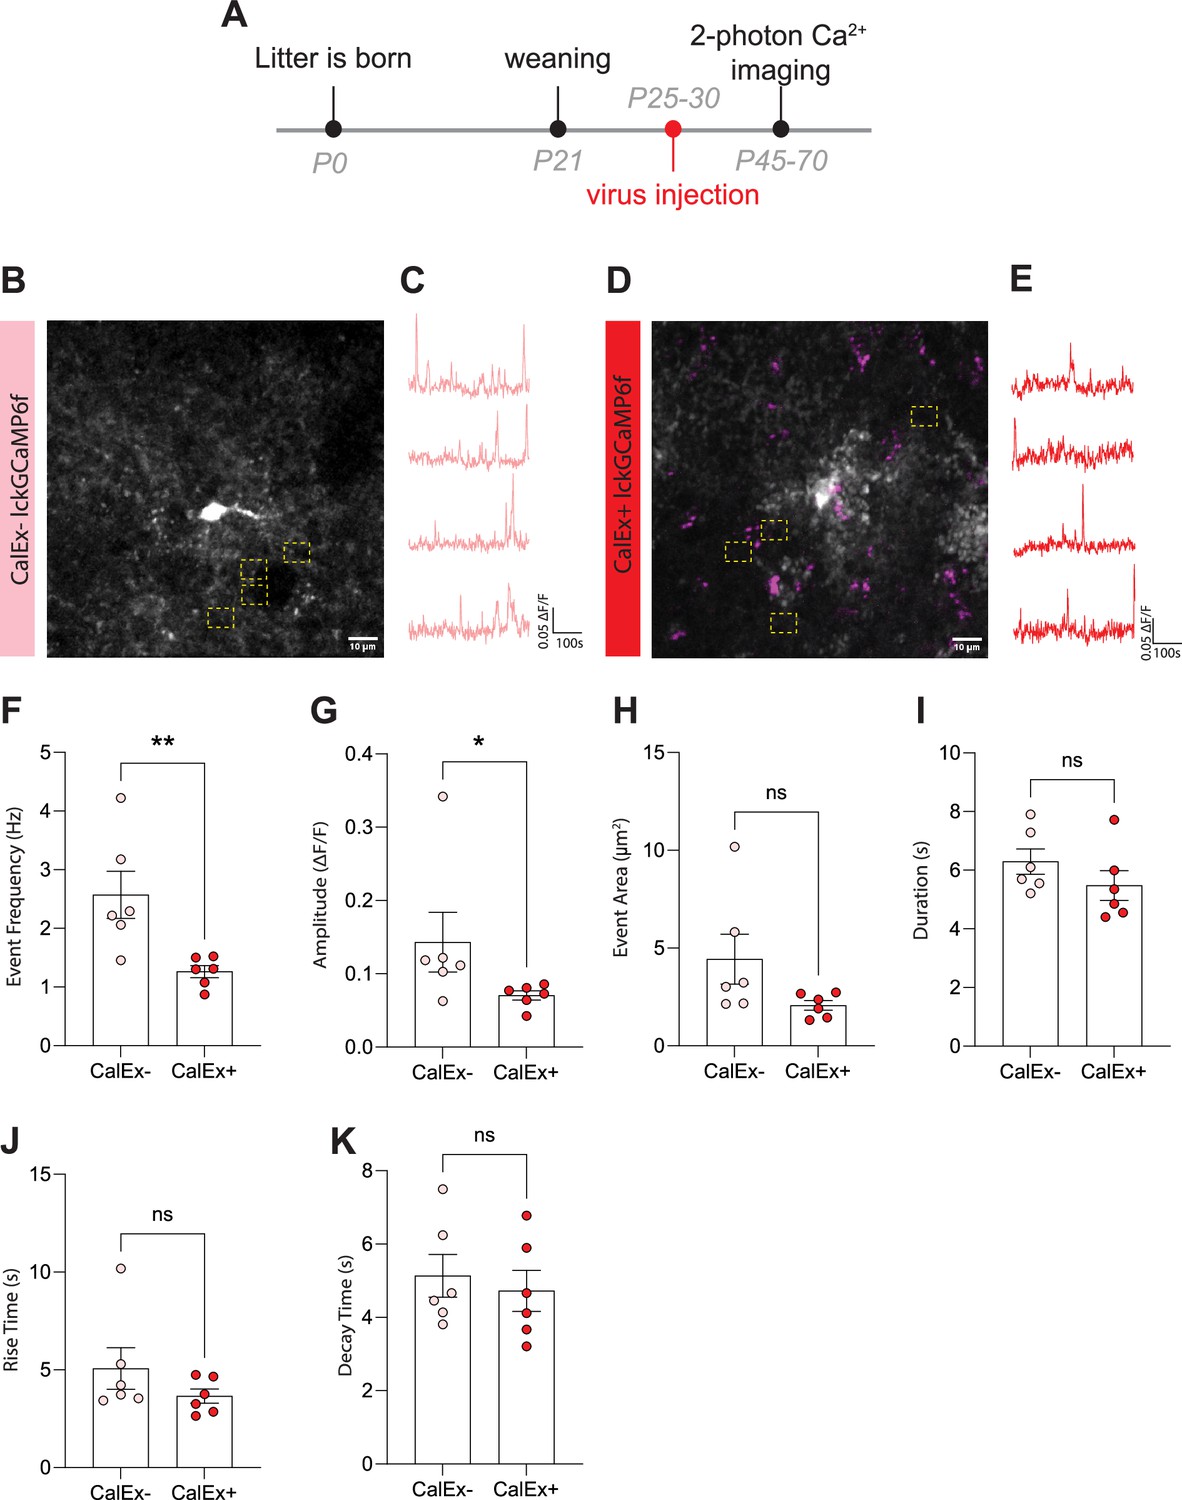
CalEx expression in lateral amygdala astrocytes suppresses calcium activity and closely mimics the effects of ELS on calcium activity.
(A) Timeline of CalEx/lck-GCaMP6 viral injections and two-photon calcium imaging experiments. (B) Representative image of a non-CalEx (CalEx-) lck-GCaMP6-expressing astrocyte in the lateral amygdala with four regions of interest from a naïve animal. Scale bar = 10 μm (C) Representative calcium-signalling traces from 4 regions of interest shown in (B). (D) Representative image of a CalEx+lck-GCaMP6-expressing astrocyte in the lateral amygdala with four regions of interest from an early-life stress (ELS) animal. Scale bar = 10 μm. (E) Representative calcium-signalling traces from four regions of interest shown in (D). (F) CalEx effectively decreases the frequency of calcium events in lateral amygdala astrocytes. p=0.0087, CalEx- n = 6 astrocytes from N = 3 animals, CalEx+n = 6 astrocytes from N = 3 animals. (G) CalEx decreases calcium event amplitude in lateral amygdala astrocytes. p=0.0411, CalEx- n = 6 astrocytes from N = 3 animals, CalEx+n = 6 astrocytes from N = 3 animals. (H) CalEx does not impact calcium event area in lateral amygdala astrocytes. p=0.0649, CalEx- n = 6 astrocytes from N = 3 animals, CalEx+n = 6 astrocytes from N = 3 animals. (I) CalEx does not impact calcium event duration in lateral amygdala astrocytes. p=0.1797, CalEx- n = 6 astrocytes from N = 3 animals, CalEx+n = 6 astrocytes from N = 3 animals. (J) CalEx does not impact calcium event rise time in lateral amygdala astrocytes. p=0.3095, CalEx- n = 6 astrocytes from N = 3 animals, CalEx+n = 6 astrocytes from N = 3 mice. (K) CalEx does not impact calcium event decay time in lateral amygdala astrocytes. p=0.5887, CalEx- n = 6 astrocytes from N = 3 animals, CalEx+n = 6 astrocytes from N = 3 mice.
Figure 5—figure supplement 3
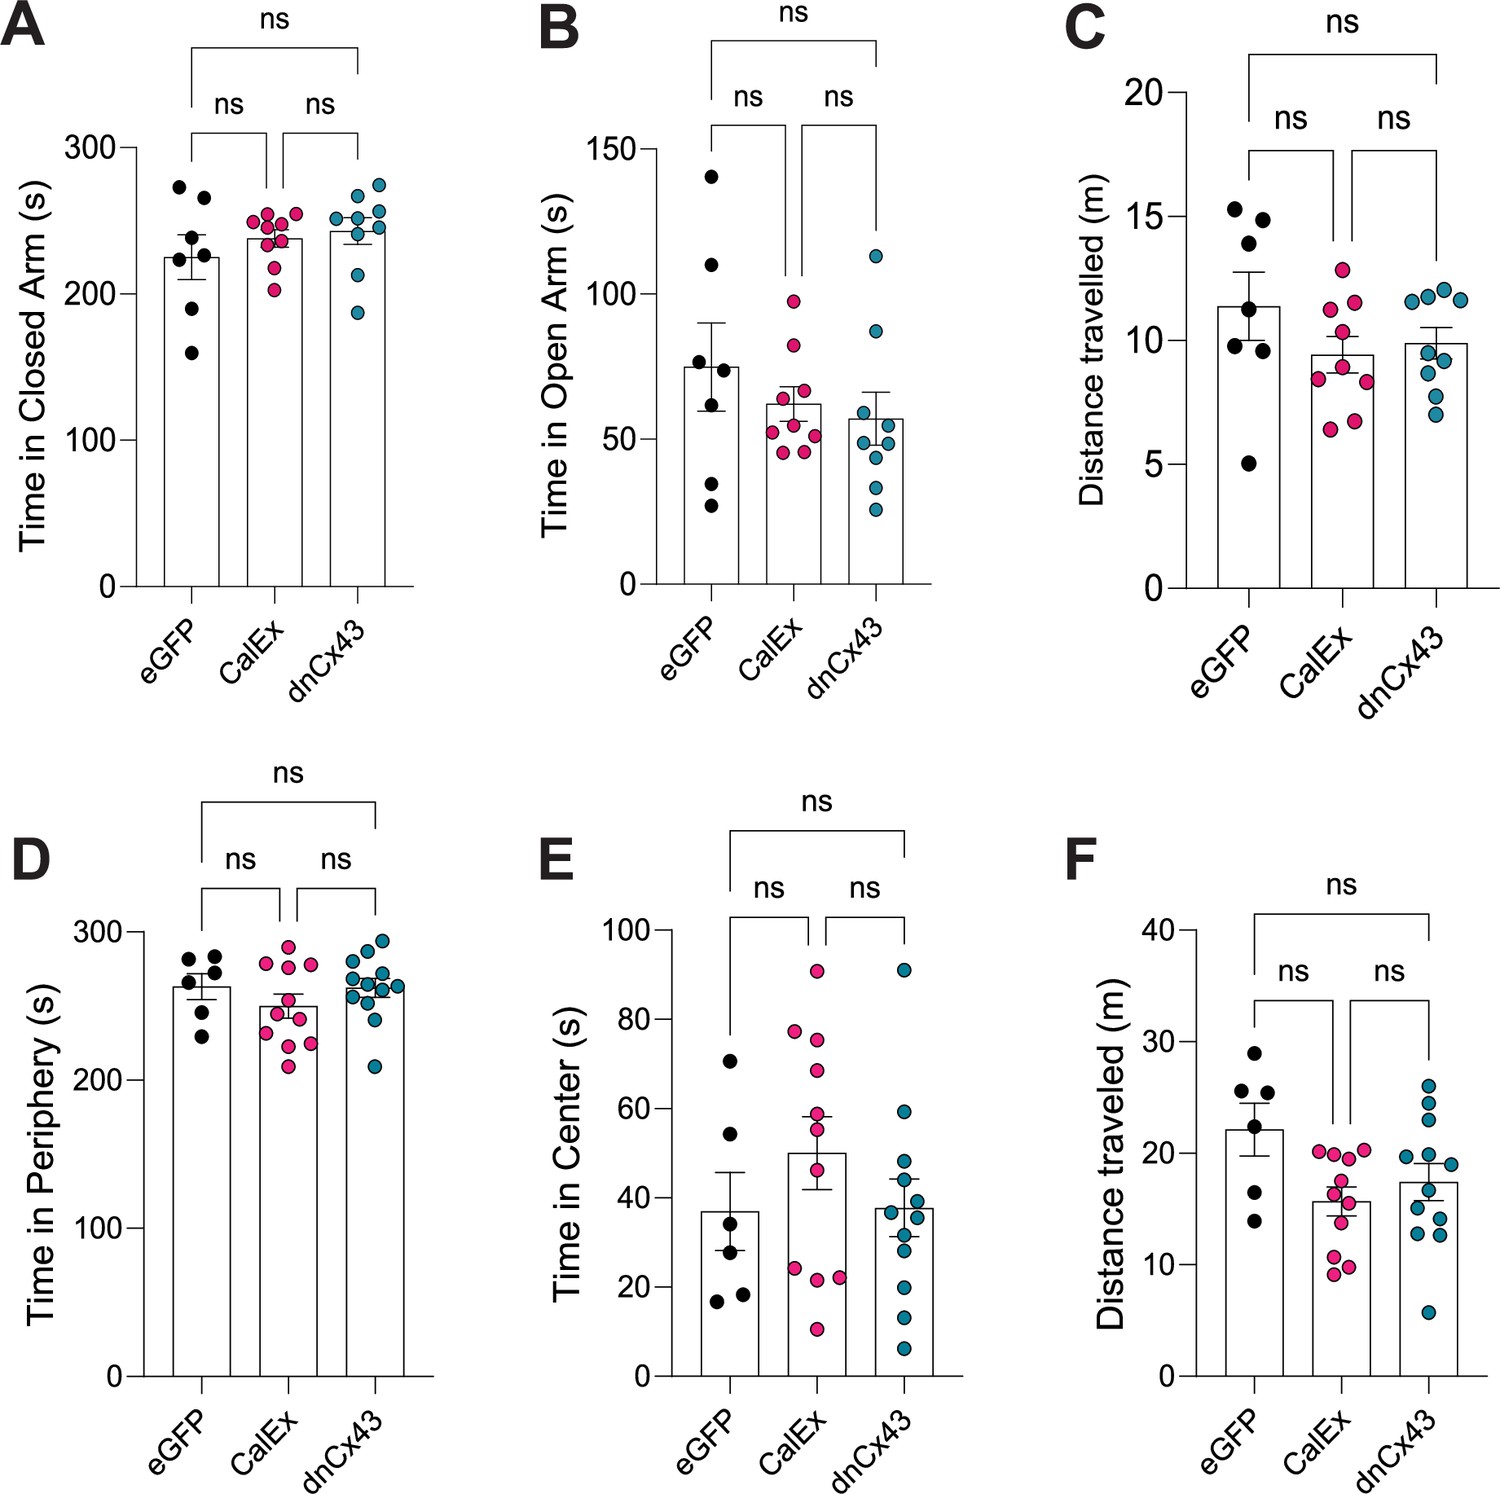
Impact of genetic manipulation of lateral amygdala astrocyte function on anxiety-related behaviours.
(A) No effect of lateral amygdala astrocyte viral manipulation on time spent in closed arms of elevated plus maze. eGFP vs CalEx; p>0.9999, eGFP vs dnCx43, p=0.7177; CalEx vs dnCx43, p>0.9999. eGFP N = 7 animals, CalEx N = 9 animals, dnCx43 N = 9 animals. (B) No effect of lateral amygdala astrocyte viral manipulation on time spent in open arms of elevated plus maze. eGFP vs CalEx; p>0.9999, eGFP vs dnCx43, p=0.7177; CalEx vs dnCx43, p>0.9999. eGFP N = 7 animals, CalEx N = 9 animals, dnCx43 N = 9 animals. (C) No effect of lateral amygdala astrocyte viral manipulation on total distance travelled in the elevated plus maze. eGFP vs CalEx; p=0.3095, eGFP vs dnCx43, p=0.5025; CalEx vs dnCx43, p=0.9197. eGFP N = 7 animals, CalEx N = 9 animals, dnCx43 N = 9 animals. (D) No effect of lateral amygdala astrocyte viral manipulation on time spent in the periphery of open-field maze. eGFP vs CalEx; p=0.8547, eGFP vs dnCx43, p>0.9999; CalEx vs dnCx43, p=0.9248. eGFP N = 6 animals, CalEx N = 11 animals, dnCx43 N = 12 animals. (E) No effect of lateral amygdala astrocyte viral manipulation on time spent in the centre of open-field maze. eGFP vs CalEx; p=0.8547, eGFP vs dnCx43, p>0.9999; CalEx vs dnCx43, p=0.9248. eGFP N = 6 animals, CalEx N = 11 animals, dnCx43 N = 12 animals. (F) No effect of lateral amygdala astrocyte viral manipulation on total distance travelled in the open-field maze. eGFP vs CalEx; p=0.8547, eGFP vs dnCx43, p>0.9999; CalEx vs dnCx43, p=0.9248. eGFP N = 6 animals, CalEx N = 11 animals, dnCx43 N = 12 animals.
Figure 5—figure supplement 4
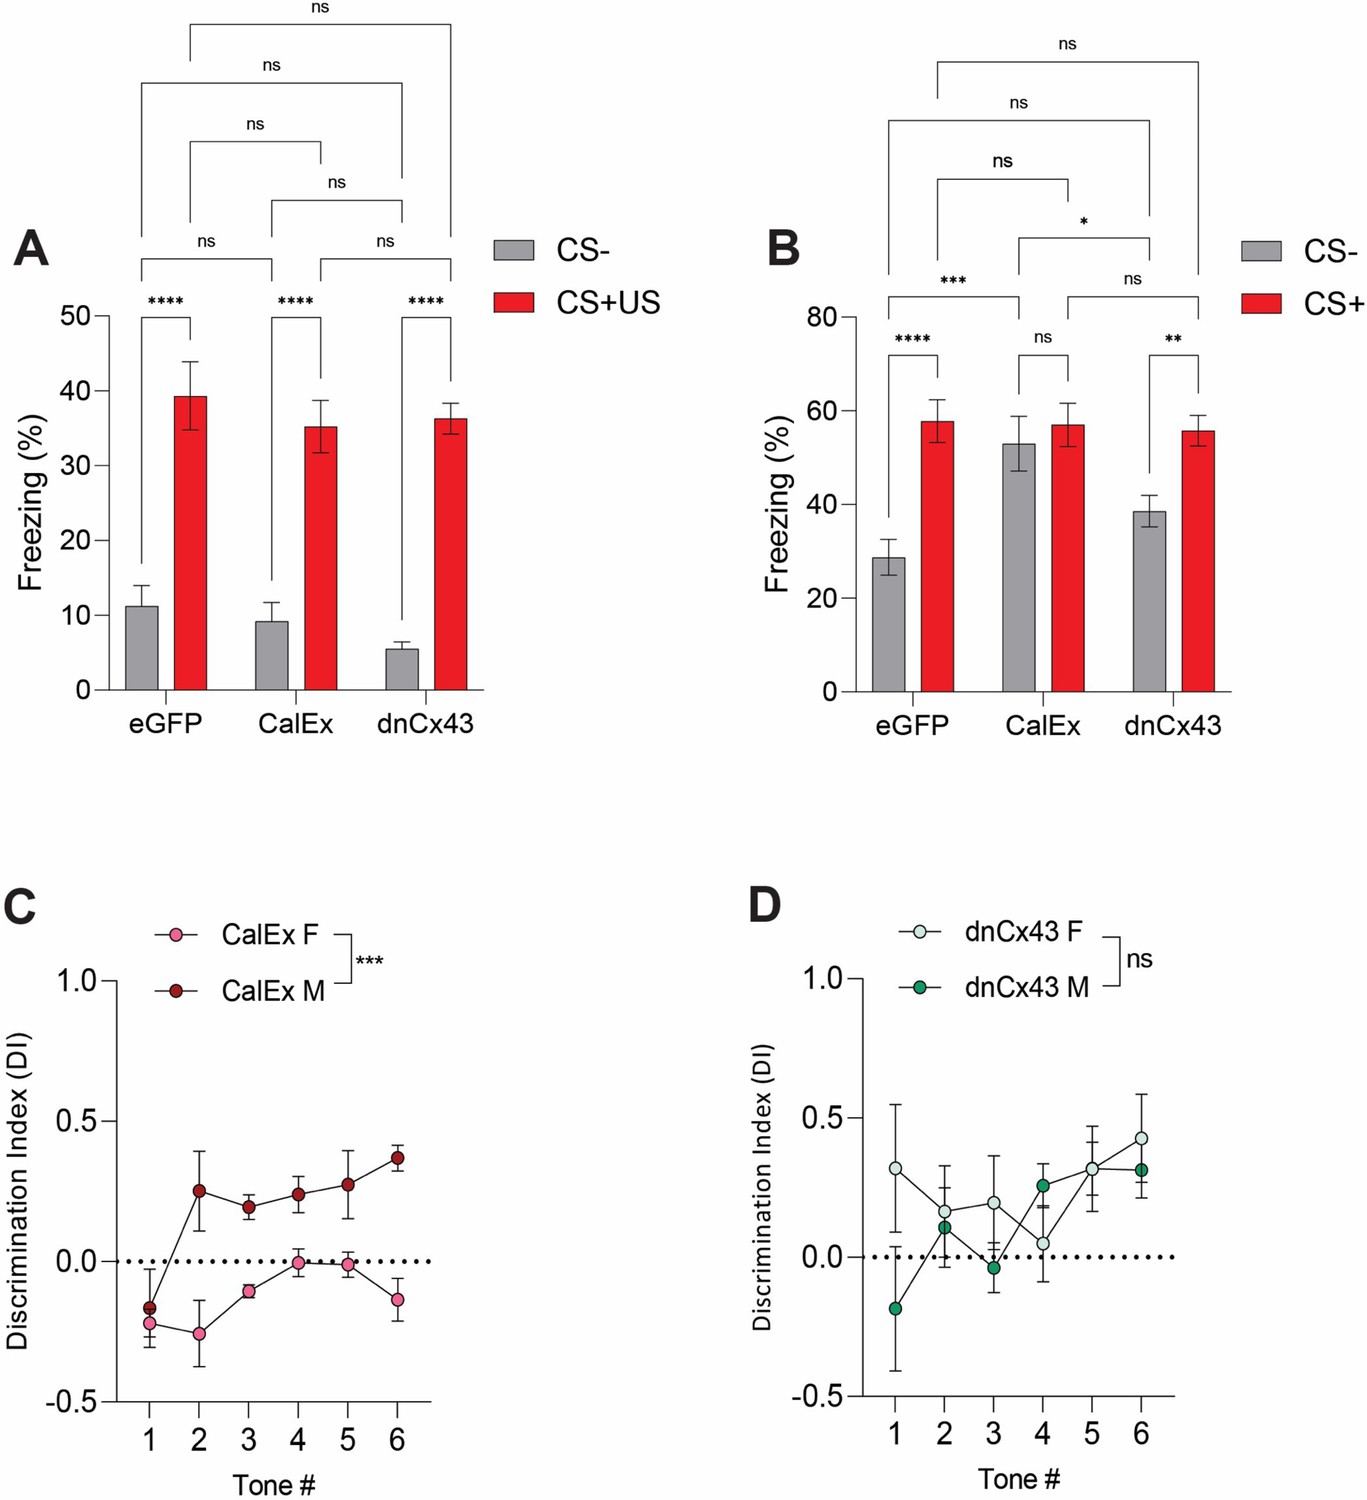
Expression of CalEx, but not dnCx43, in lateral amygdala astrocytes results in sexually dimorphic effects on discrimination.
(A) Average freezing responses to CS- (grey) and CS+ (red) during fear conditioning for eGFP, CalEx and dnCx43 mice. Tone (CS +/-) represents the within-subject variable while treatment (naïve/ELS) represents the between-subject variable. eGFP (CS- vs CS+US), p<0.0001, N = 12 animals; CalEx (CS- vs CS+US), p<0.0001, N = 11 animals; dnCx43 (CS- vs CS+US), p<0.0001, N = 17 animals; CS– (eGFP vs CalEx), p=0.9448; CS– (eGFP dnCx43), p=0.3372; CS– (CalEx vs dnCx43), p=0.7121; CS +US (eGFP vs CalEx), p=0.6879; CS+/US (eGFP vs dnCx43), p=0.8030; CS+/US (CalEx vs dnCx43), p=0.9891. (B) Average freezing responses to CS- (grey) and CS+ (red) during discrimination for eGFP, CalEx, and dnCx43 mice. Tone (CS +/-) represents the within-subject variable while treatment (naïve/ELS) represents the between-subject variable. eGFP (CS- vs CS+US), p<0.0001, N = 12 animals; CalEx (CS- vs CS+US), p<0.0001, N = 11 animals; dnCx43 (CS- vs CS+US), p<0.0001, N = 17 animals; CS– (eGFP vs CalEx), p=0.9448; CS– (eGFP dnCx43), p=0.3372; CS– (CalEx vs dnCx43), p=0.7121; CS+/US (eGFP vs CalEx), p=0.6879; CS+/US (eGFP vs dnCx43), p=0.8030; CS+/US (CalEx vs dnCx43), p=0.9891. (C) CalEx disruption of lateral amygdala astrocytes affects female auditory cue discrimination significantly more than male counterparts. p<0.0001, male N = 6 animals, female N = 5 animals. (D) No differences in the impact of dnCx43 on auditory cue discrimination between male and female animals. p=0.1803, male N = 10, female N = 7.
Figure 5—figure supplement 5
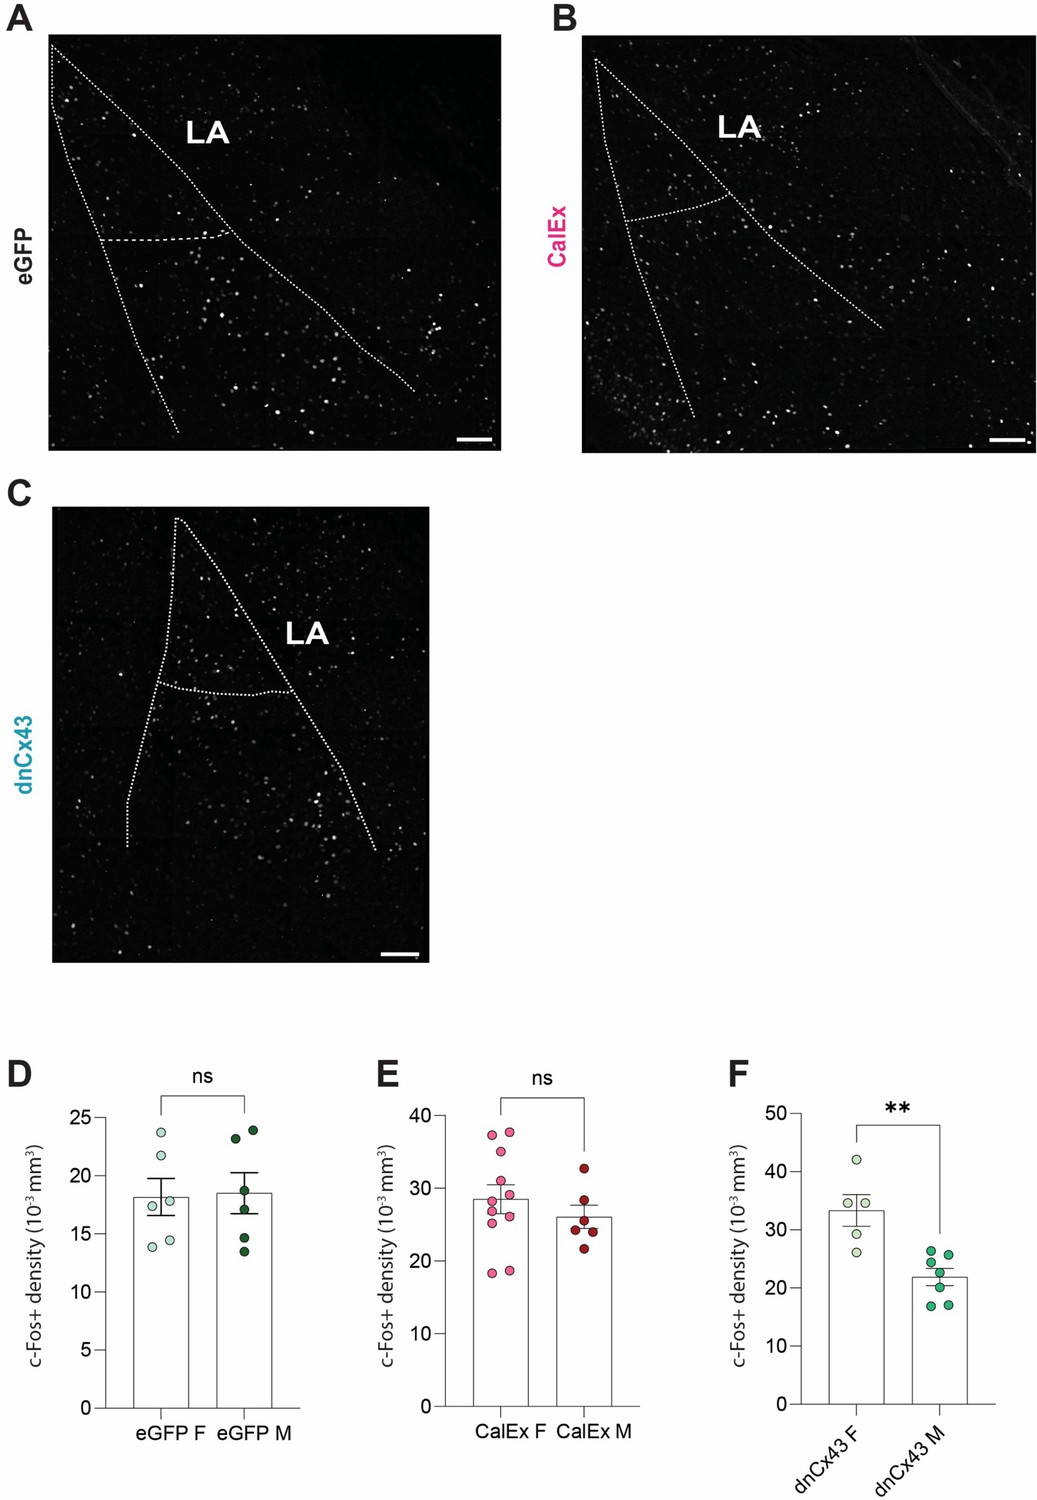
Expression of dnCx43, but not CalEx, in lateral amygdala astrocytes influences neuronal excitability in sex-specific manner following fear conditioning.
(A) Representative Z-stack projection of c-Fos staining in entire lateral and basolateral amygdala from an eGFP mice 90 min after conditioning. (B) Representative Z-stack projection of c-Fos staining in entire lateral and basolateral amygdala from a CalEx mice 90 min after conditioning. (C) Representative Z-stack projection of c-Fos staining in entire lateral and basolateral amygdala from a dnCX43 mice 90 min after conditioning. (D) No differences in lateral amygdala c-Fos density between male and female eGFP mice. p=0.9372, male n = 6 astrocytes, female n = 6 astrocytes. (E) No differences in lateral amygdala c-Fos density between male and female CalEx mice. p=0.3502, male n = 6 astrocytes, female n = 11 astrocytes. (F) dnCx43 leads to increased lateral amygdala c-Fos density in females compared to male counterparts. p=0.0051, male n = 5 astrocytes, female n = 7 astrocytes.
Figure 6
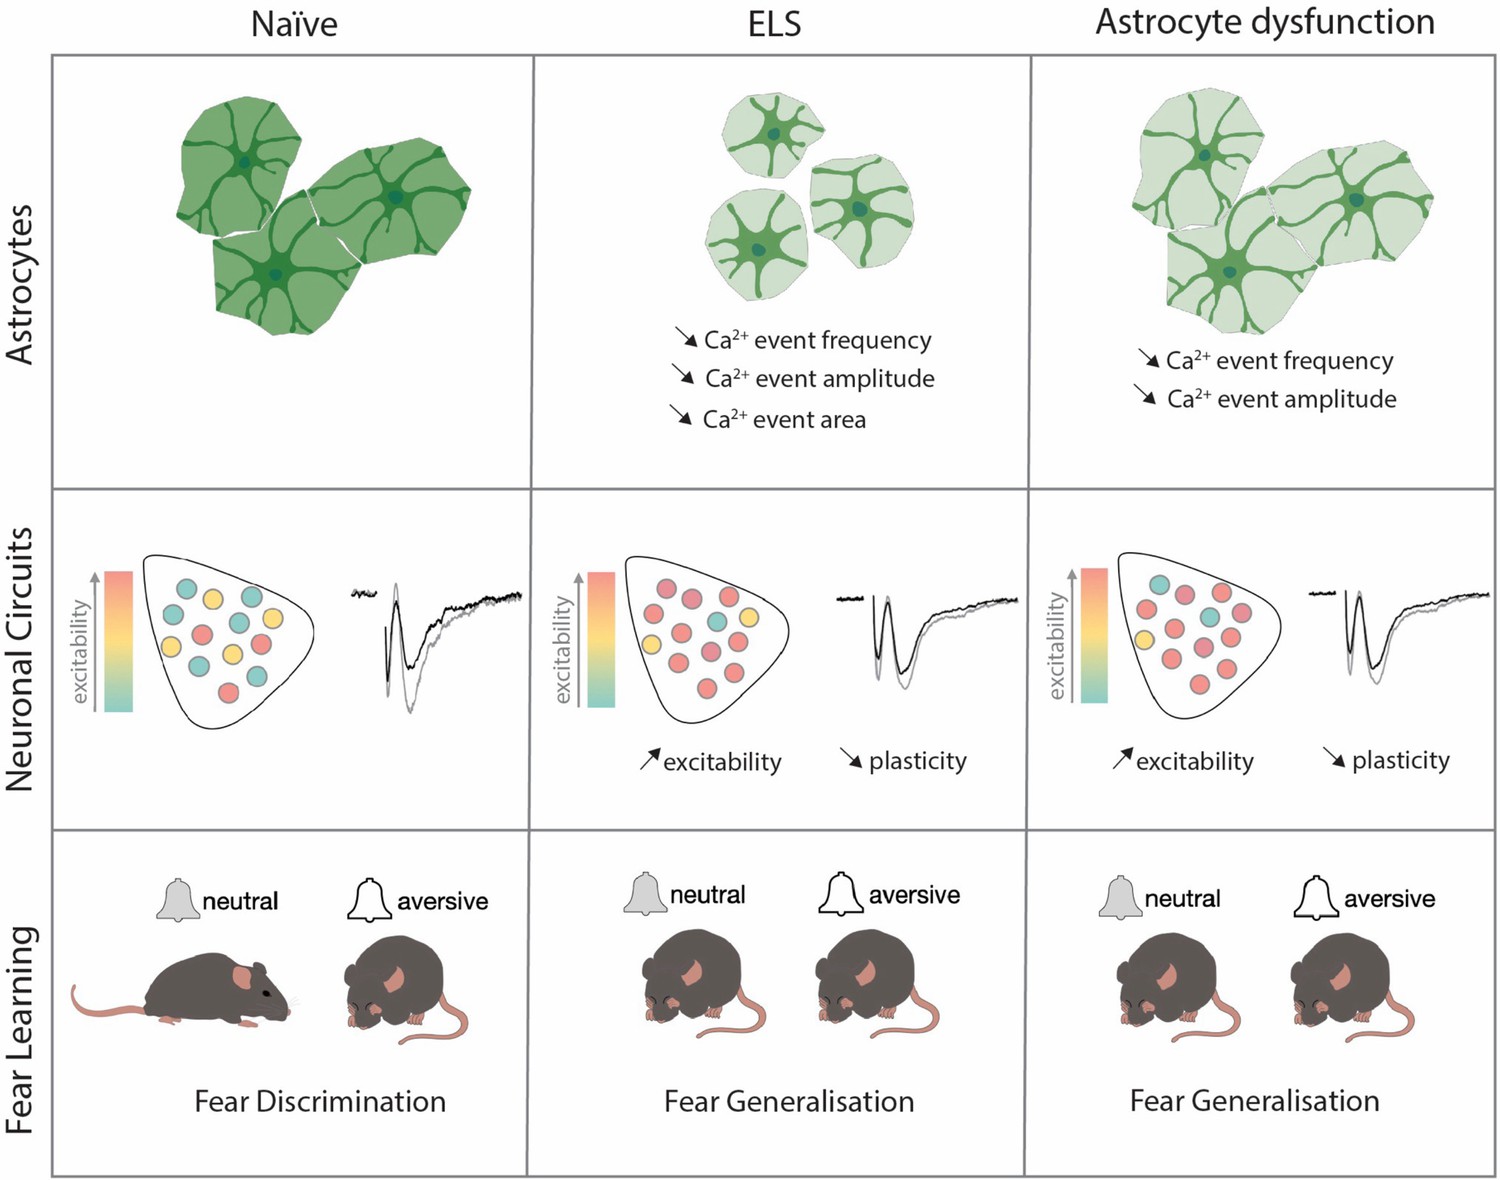
The effects of early-life-stress on astrocytic function, neuronal excitability, and fear memory are fully recapitulated by viral manipulations of lateral amygdala astrocytes.
Additional files
-
MDAR checklist
- https://cdn.elifesciences.org/articles/99988/elife-99988-mdarchecklist1-v1.docx
-
Supplementary file 1
Document containing detailed statistical tests used in each figure.
- https://cdn.elifesciences.org/articles/99988/elife-99988-supp1-v1.docx
Download links
A two-part list of links to download the article, or parts of the article, in various formats.
Downloads (link to download the article as PDF)
Open citations (links to open the citations from this article in various online reference manager services)
Cite this article (links to download the citations from this article in formats compatible with various reference manager tools)
Early-life stress induces persistent astrocyte dysfunction associated with fear generalisation
eLife 13:RP99988.
https://doi.org/10.7554/eLife.99988.3


