A bacterial sulfonolipid triggers multicellular development in the closest living relatives of animals
- University of California, Berkeley, United States
- Harvard Medical School, United States
- Stanford University School of Medicine, United States
Figures
Figure 1 with 1 supplement
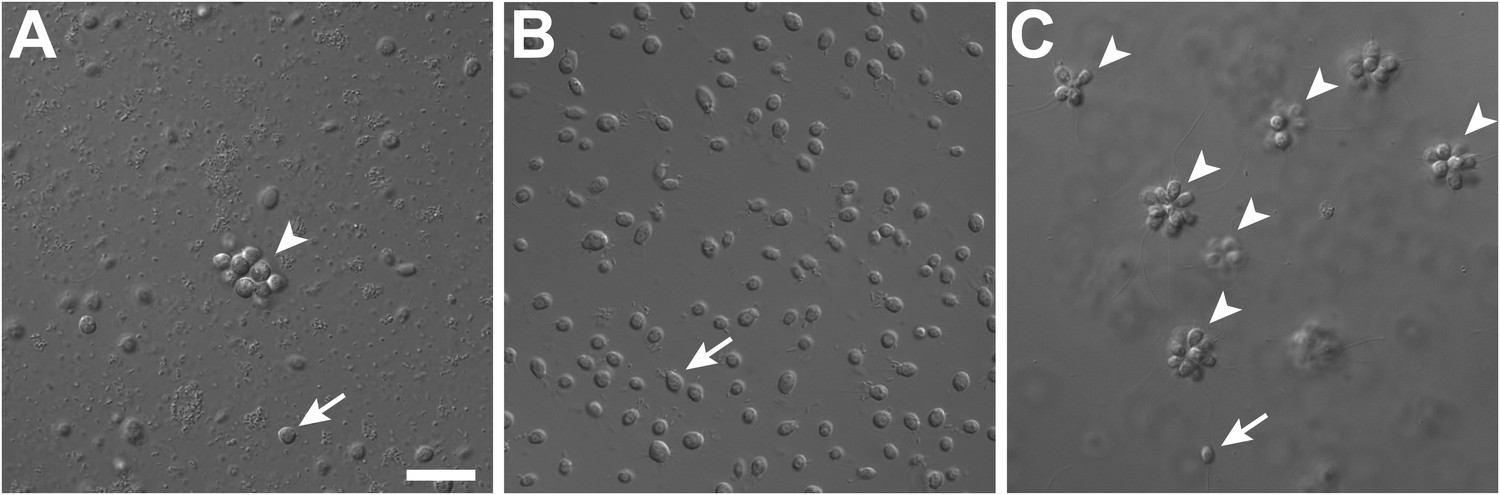
Rosette colony development in S. rosetta is regulated by A. machipongonensis.
(A) The original culture of S. rosetta, ATCC 50818, contains diverse co-isolated environmental bacteria and forms rosette colonies (arrowheads) rarely. (B) Treatment of ATCC50818 with a cocktail of antibiotics reduced the bacterial diversity and yielded an S. rosetta culture line, RCA, in which rosette colonies never formed. (Representative single cells indicated by arrows.) (C) Addition of A. machipongonensis to RCA cultures was sufficient to induce rosette development. Scale bar, 2 μm.
Figure 1—figure supplement 1
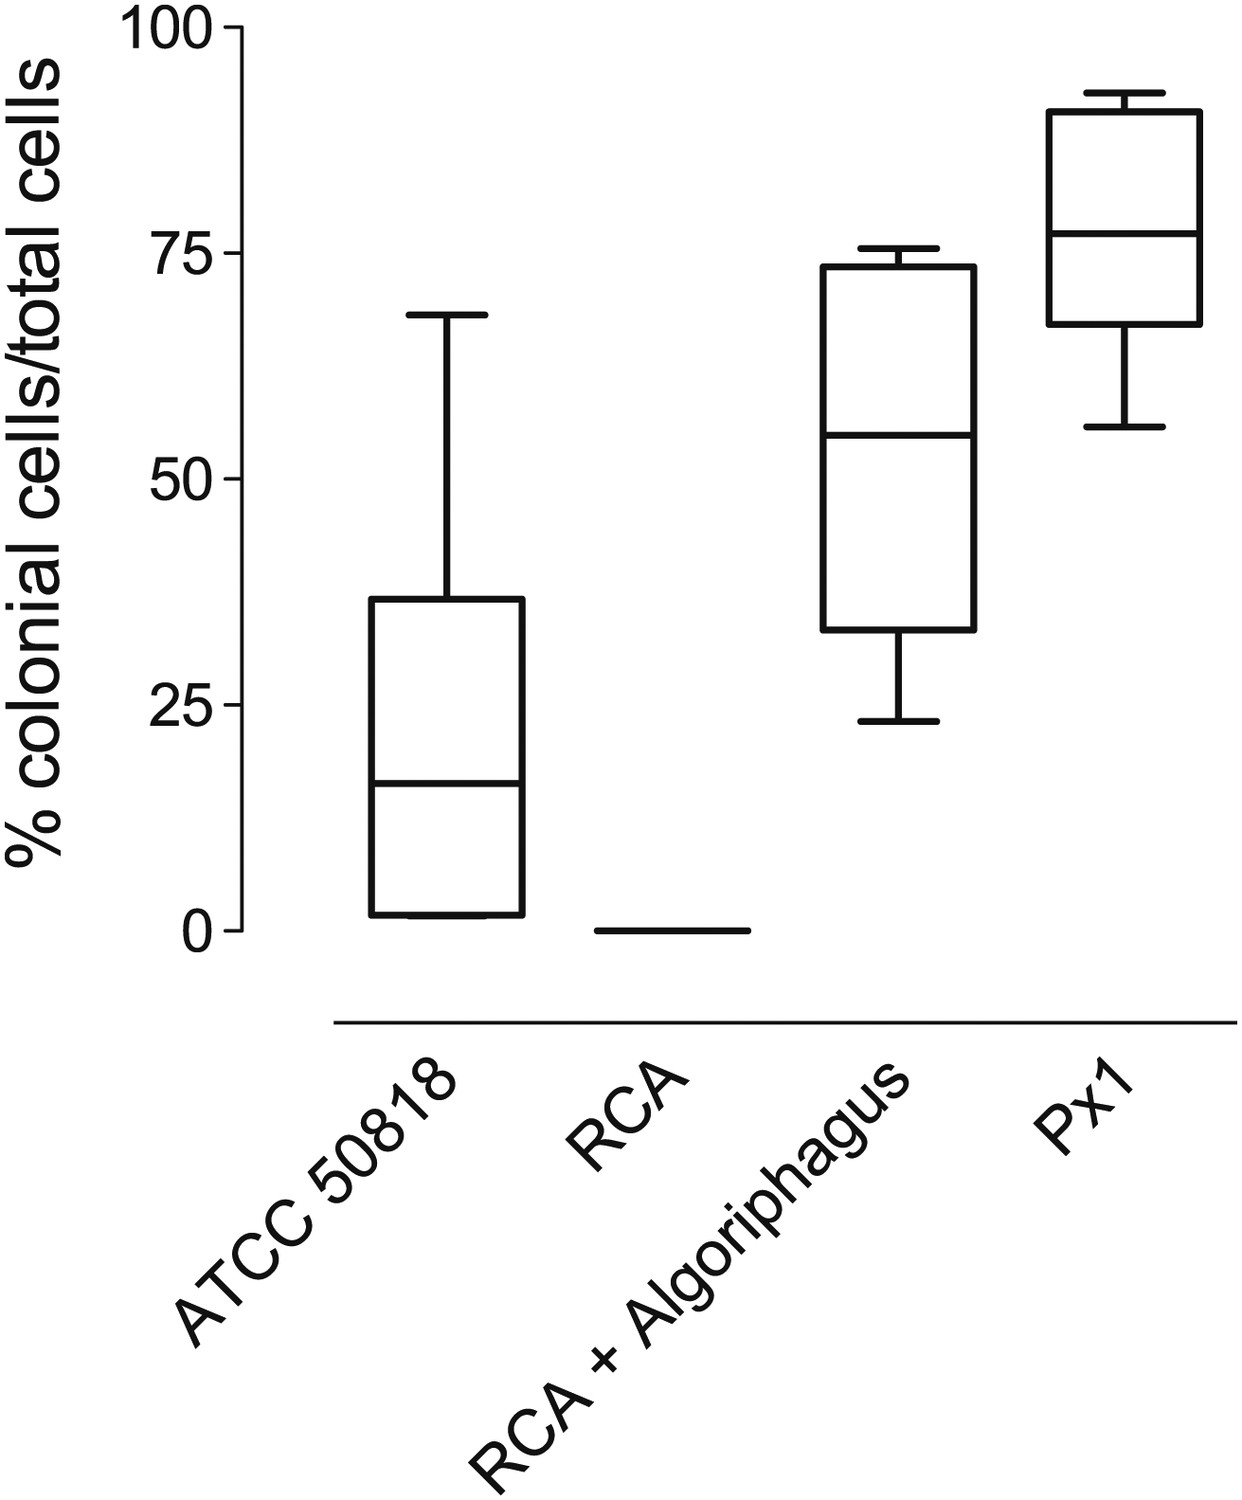
Frequency of rosette colonies in S. rosetta environmental isolate ATCC 50818, RCA with and without A. machipongonensis and a monoxenic line with A. machipongonensis feeder bacteria (Px1).
Altering bacterial diversity in S. rosetta cultures alters the frequency of rosette colonies. Data are the whisker-box plots of the frequency of colonial cells in ATCC 50818 and a monoxenic culture of S. rosetta fed only A. machipongonensis bacteria (Px1) for three experiments.
Figure 2
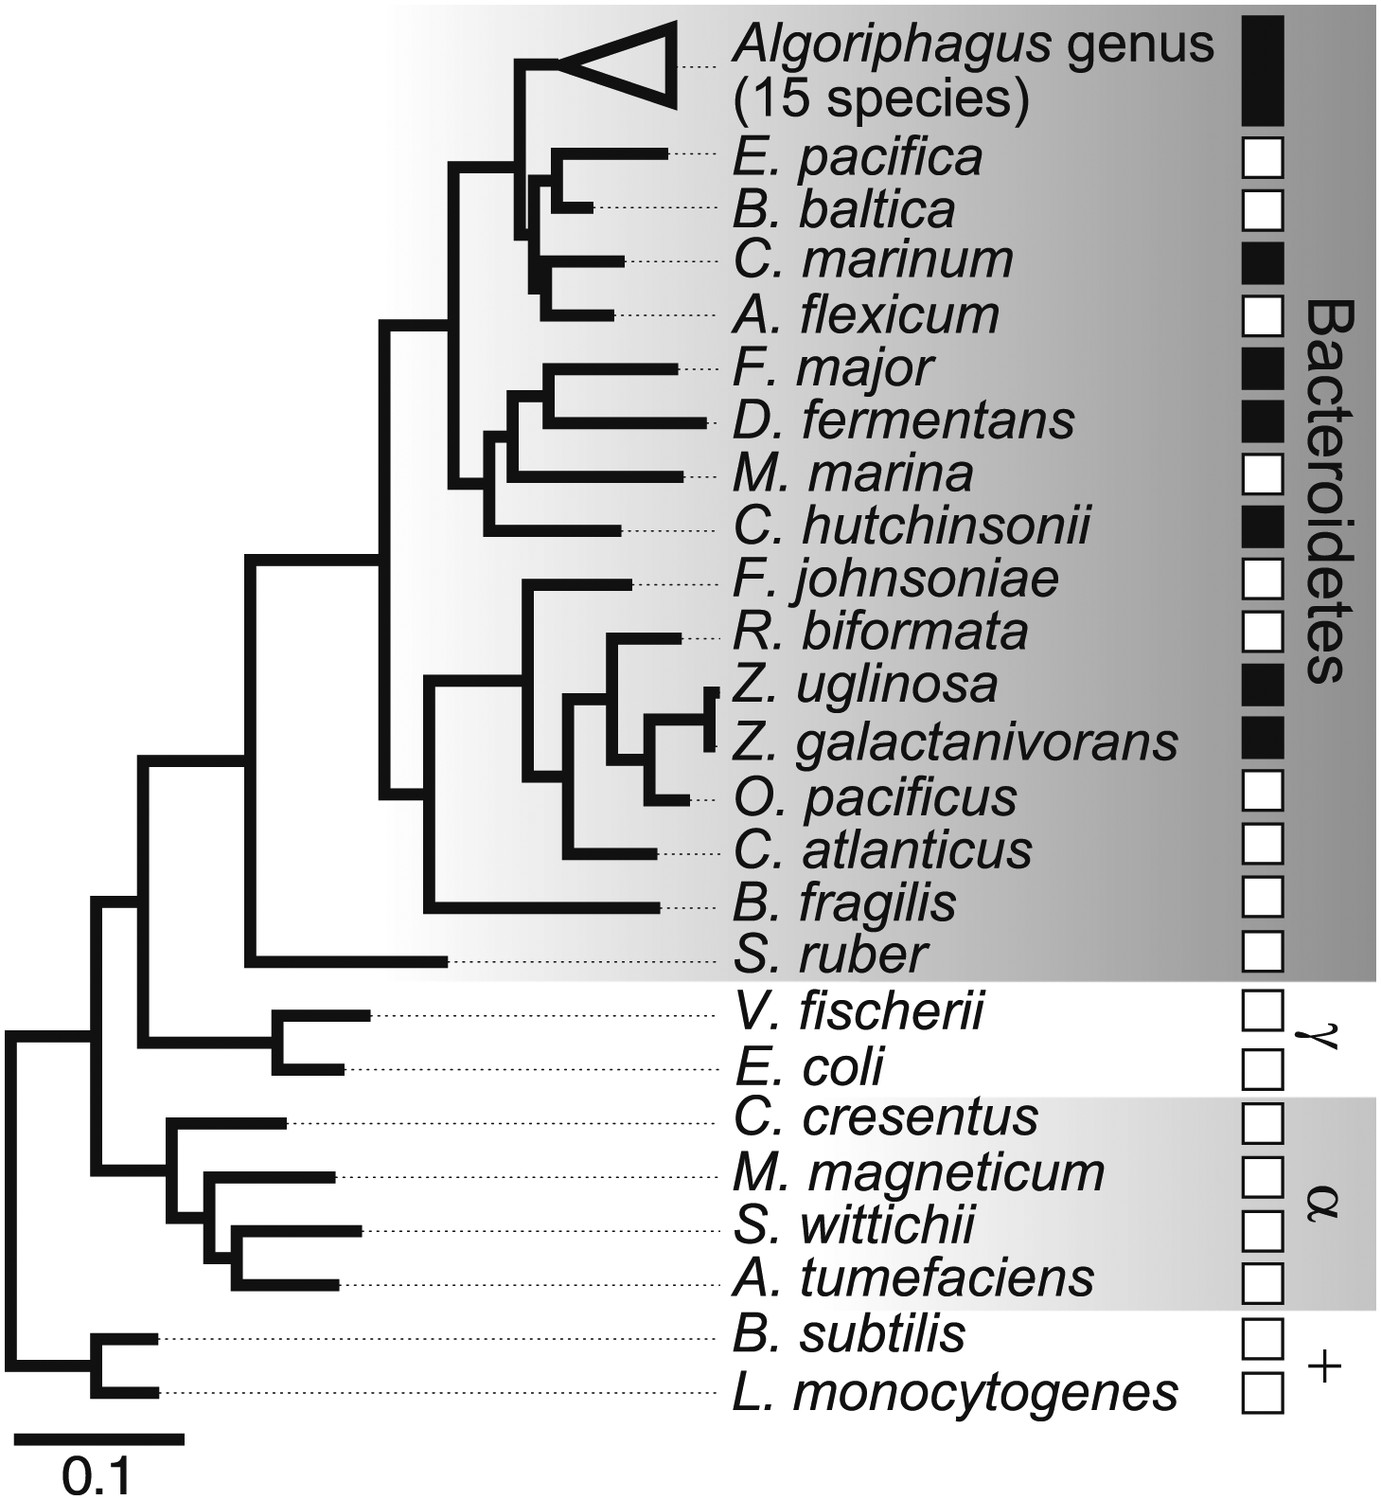
Diverse members of the Bacteroidetes phylum induce rosette colony development.
A maximum likelihood phylogeny inferred from 16S rDNA gene sequences reveals the evolutionary relationships among A. machipongonensis, other members of the Bacteroidetes phylum, and representative γ-proteobacteria (γ), α-proteobacteria (α), and Gram-positive (+) bacteria. All 15 members of the Algoriphagus genus (Table 1), as well as six other species in the Bacteroidetes phylum, were competent to induce colony development (filled squares). In contrast, no species outside of Bacteroidetes and most of the non-Algoriphagus bacteria tested failed to induce rosette colony development (open squares). Scale bar, 0.1 substitutions per nucleotide position.
Figure 3 with 15 supplements
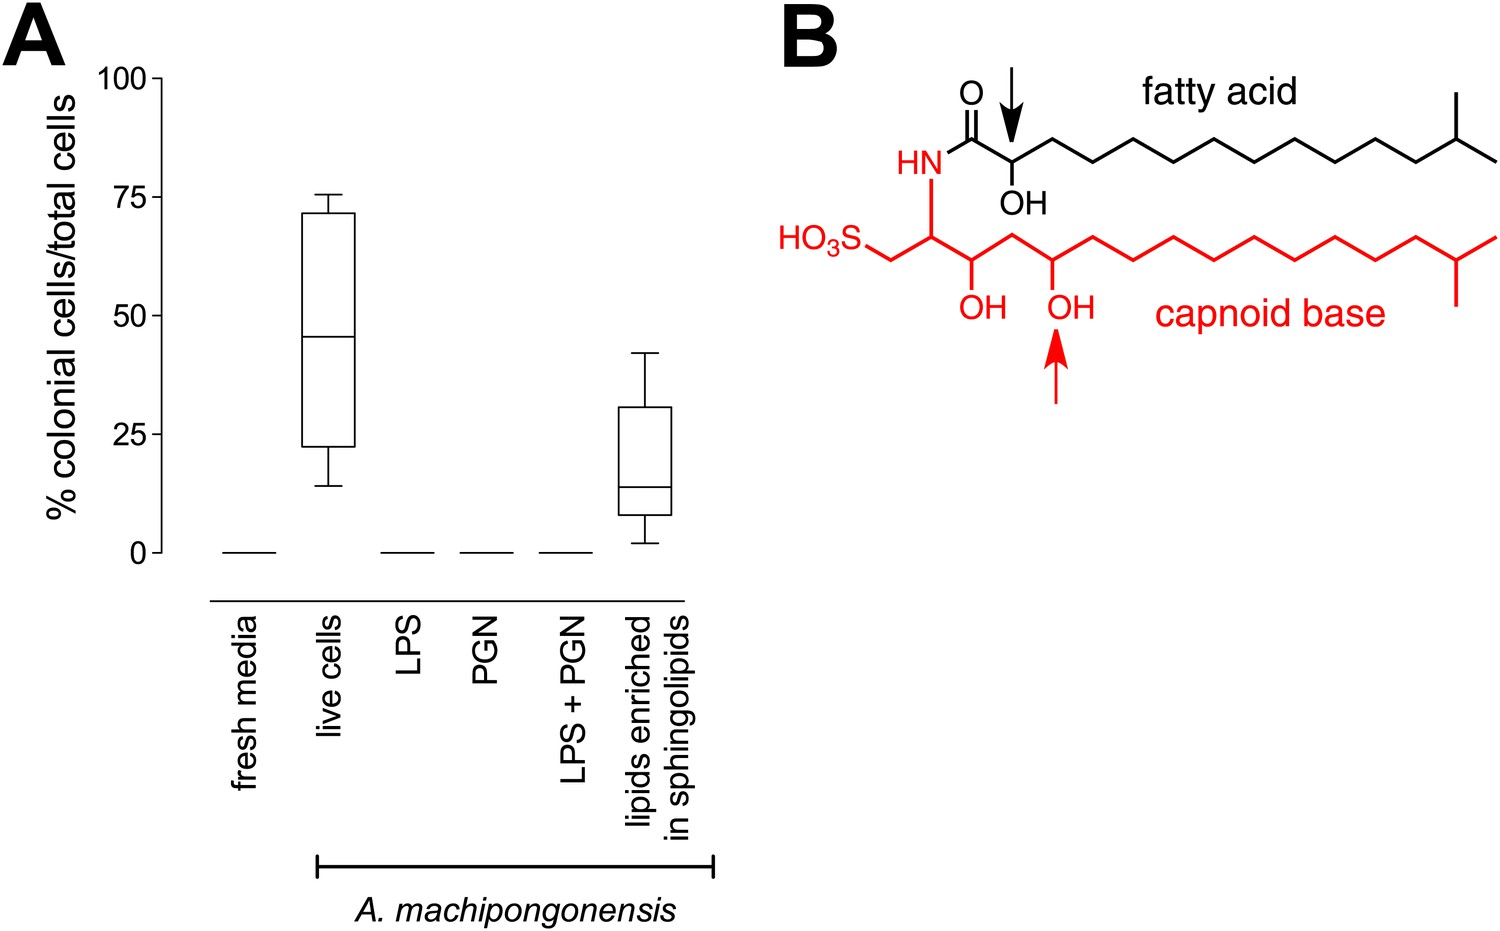
RIF-1, a sulfonolipid that induces rosette colony development.
(A) Rosette colony development is induced by live A. machipongonensis and the sphingolipid-enriched lipid fraction (20 mg mL−1), but not by fresh medium, A. machipongonensis LPS (10 mg mL−1), PGN (50 mg mL−1), or LPS+PGN. Shown are the whisker-box plots of the % colonial cells/total cells under each condition in three independent experiments. (B) The molecular structure of RIF-1 deduced from MS and 1D- and 2D-NMR data. The RIF-1 structure, 3,5-dihydroxy-2-(2-hydroxy-13-methyltetradecanamido)-15-methylhexadecane-1-sulfonic acid, has two parts: a base (shown in red) that defines the capnine, and a fatty acid (shown in black). Features that distinguish RIF-1 from other known capnoids are shown with colored arrows: the 2-hydroxy on the fatty acid (black) and the 5-hydroxy on the capnine base (red).
Figure 3—figure supplement 1
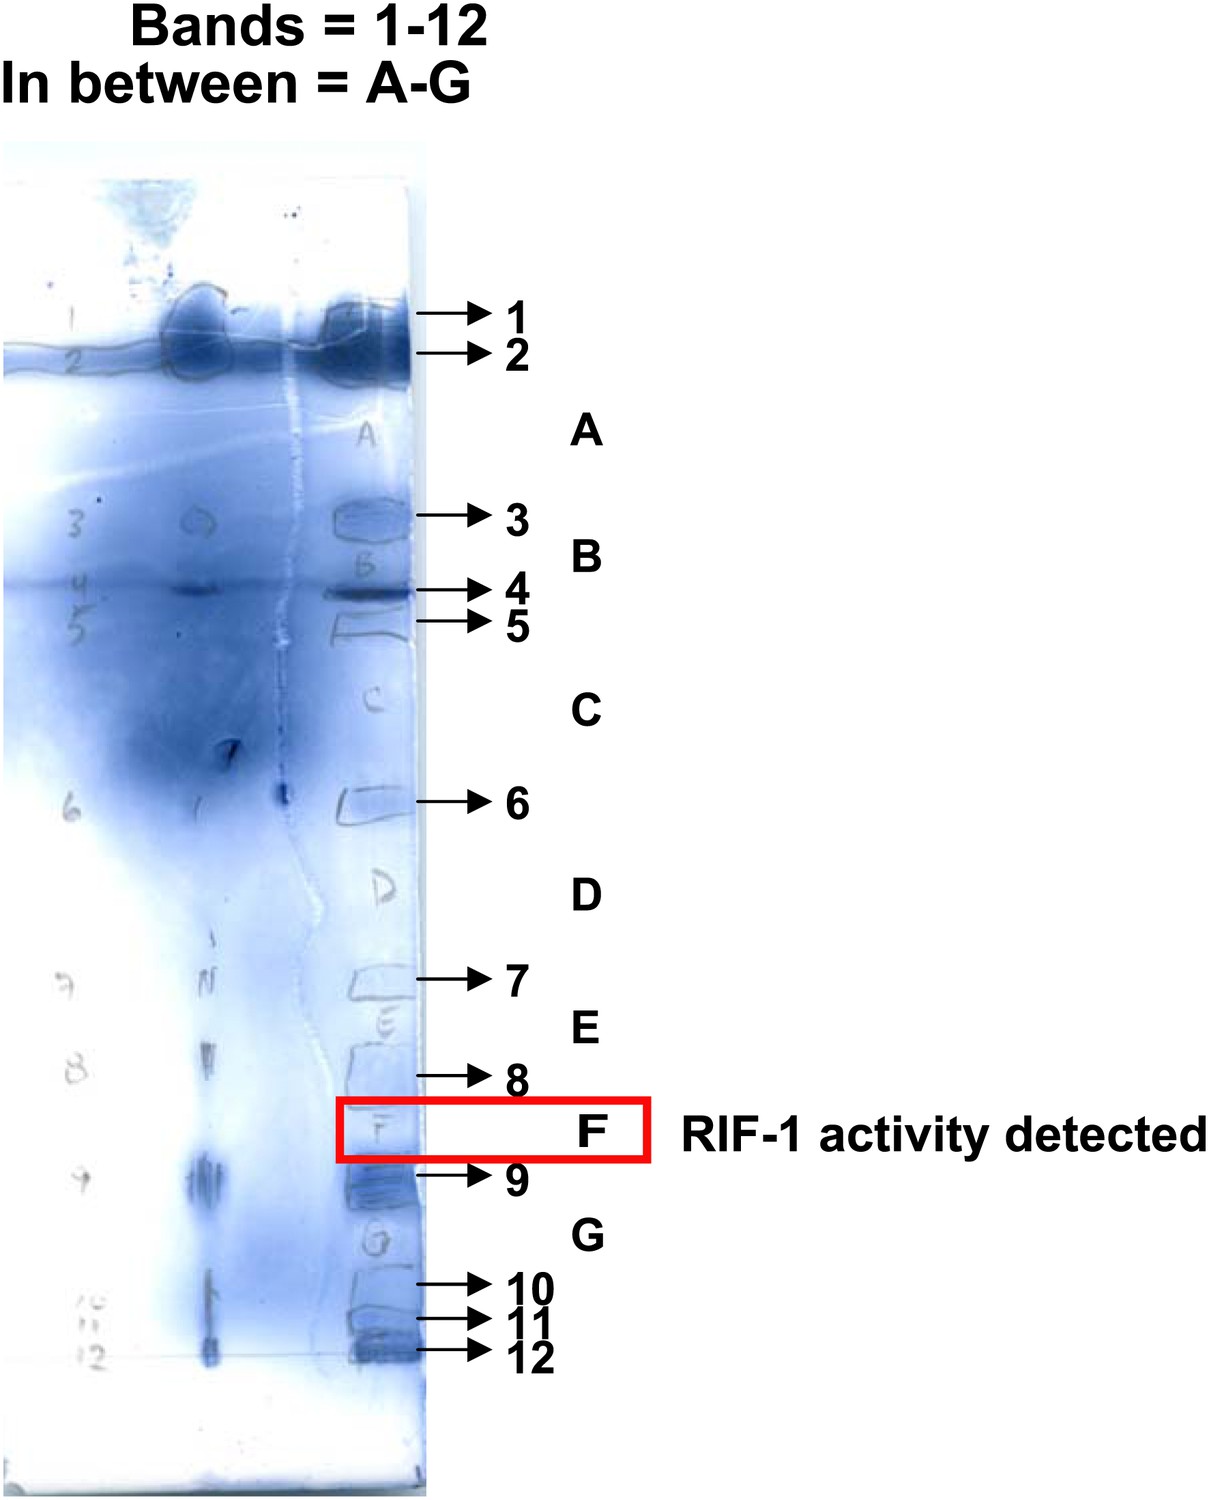
Separation of A. machipongonensis sphingolipids by thin layer chromatography (TLC).
Lipids enriched in sphingolipids were separated by TLC after visualization with ammonium molybdate in 10% H2SO4. Bands (1-12) as well as regions between bands (A-F) were tested for morphogenic activity. Region F possessed activity and was further purified.
Figure 3—figure supplement 2
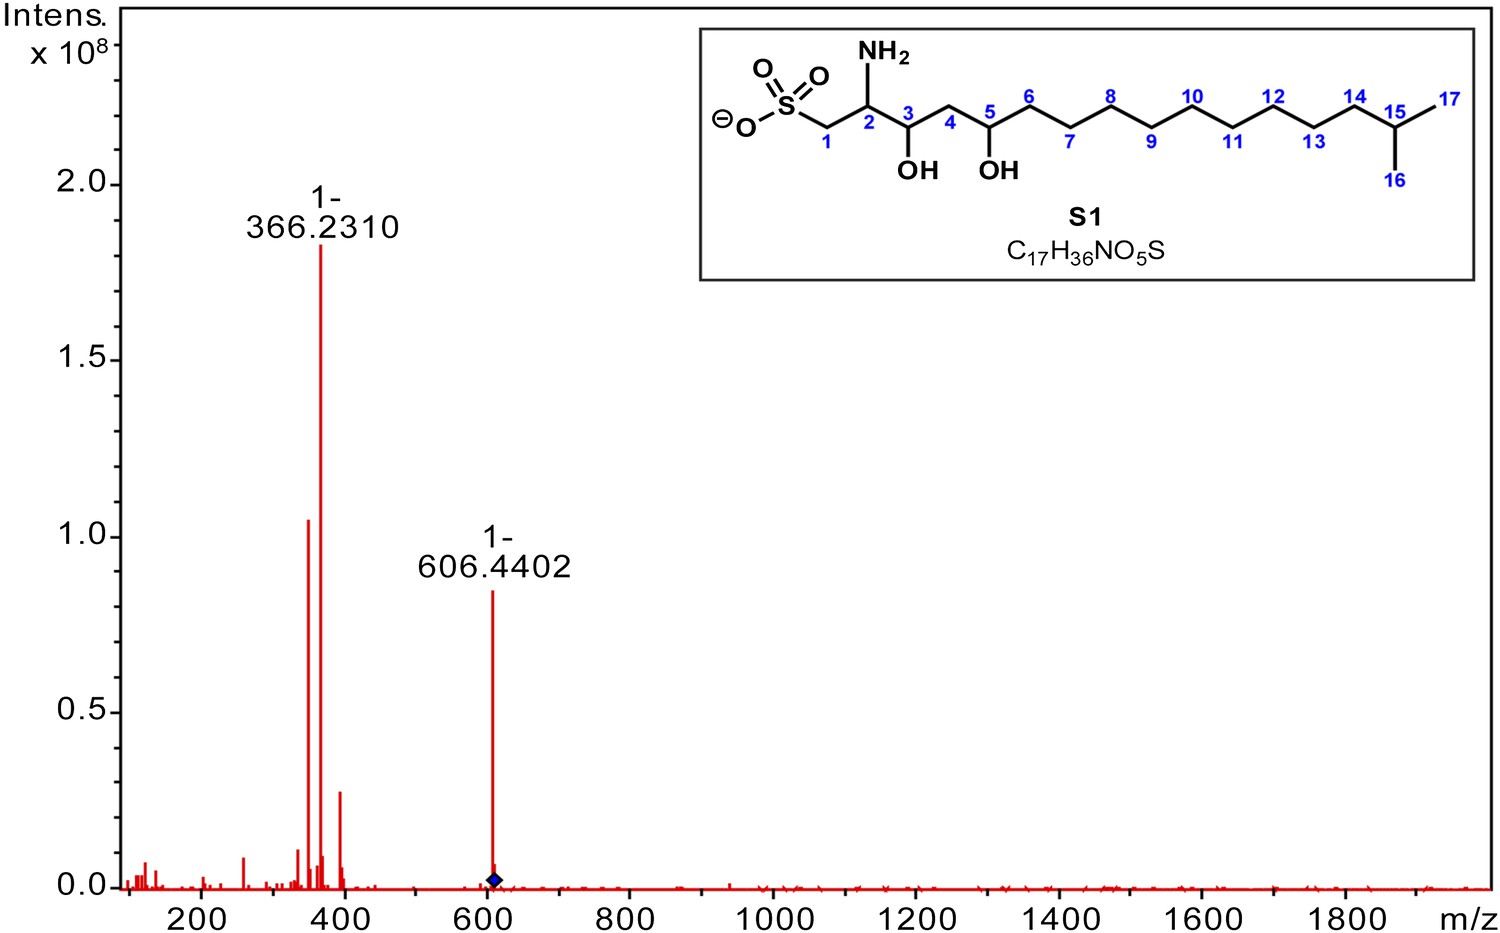
MS/MS analysis of RIF-1.
A major fragment derived from m/z = 606 (M-H) in the MS/MS spectrum of RIF-1 corresponds to amino-sulfonic acid S1. HRMS m/z calcd for C17H36NO5S (M-H): 366.23142. Found: 366.2310 (M-H)-.
Figure 3—figure supplement 3
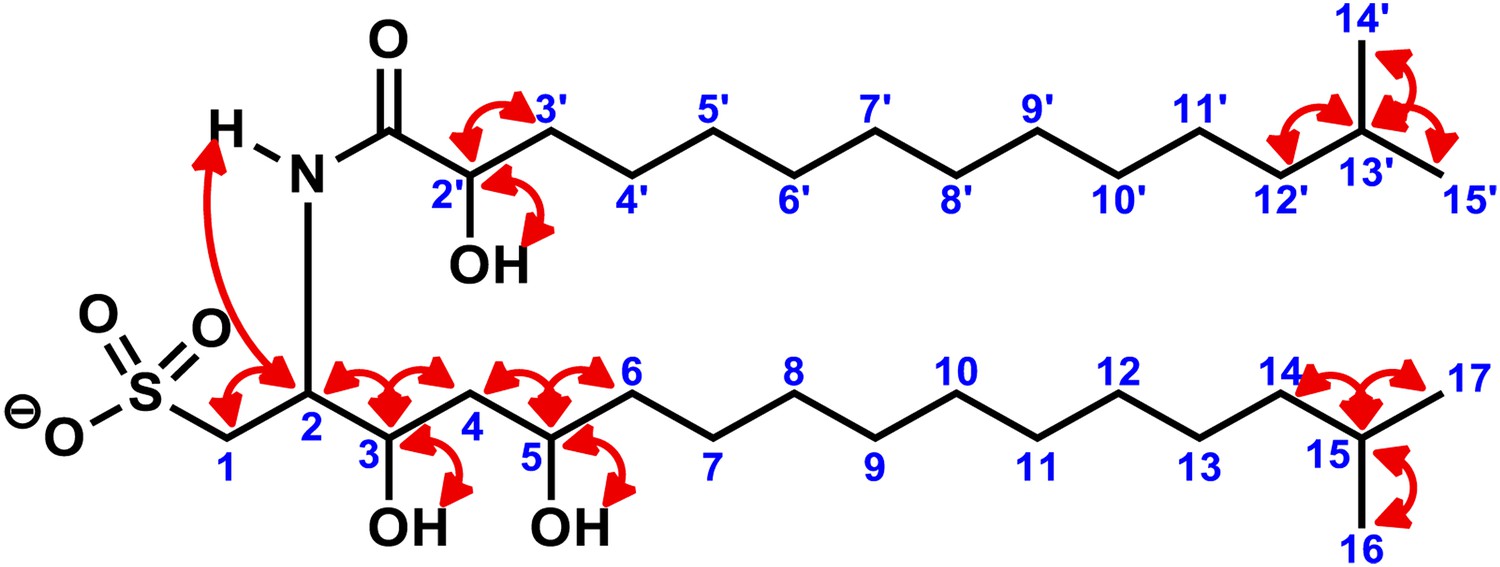
Key two-dimensional (2D) correlations of RIF-1: Observed COSY correlations.
Red double-head arrows show key 3J or 4J H-H correlations in the head regions (1 to 6 and 2′ to 3′) of the fatty acid and the capnine base and in the tail regions with geminal dimethyl groups (14 to 17 and 12′ to 15′).
Figure 3—figure supplement 4

Key two-dimensional (2D) correlations of RIF-1: Observed HMBC spin system.
Blue single-head arrows show key 2J or 3J H-C correlations in the head and tail regions of the fatty acid and capnine base. The correlations between C-1′ and H-2/N-H demonstrated that the fatty acid and capnine base are joined through an amide bond.
Figure 3—figure supplement 5
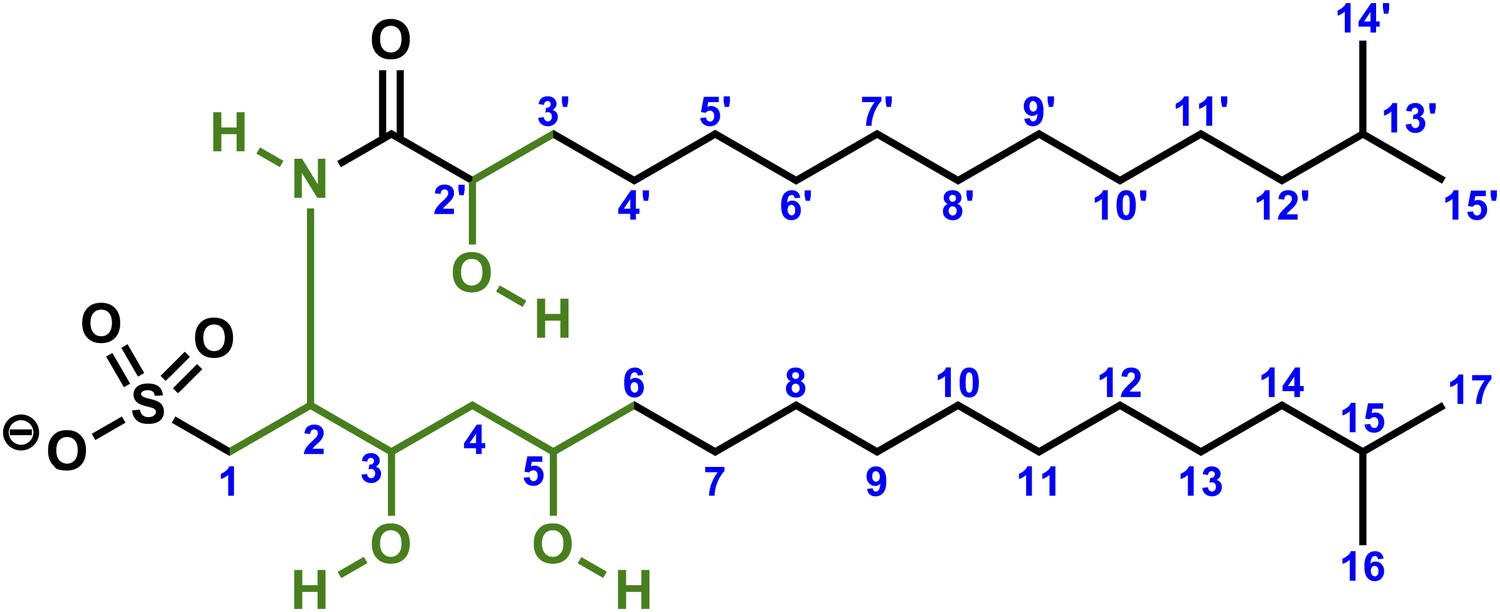
Key two-dimensional (2D) correlations of RIF-1: Observed TOCSY spin system.
Green bonds show two key spin systems in RIF-1 - HO-CH- in the fatty acid fragment and -CH2-CH(NH)-CH(OH)-CH2-CH(OH)-CH2- in the capnine base fragment.
Figure 3—figure supplement 6
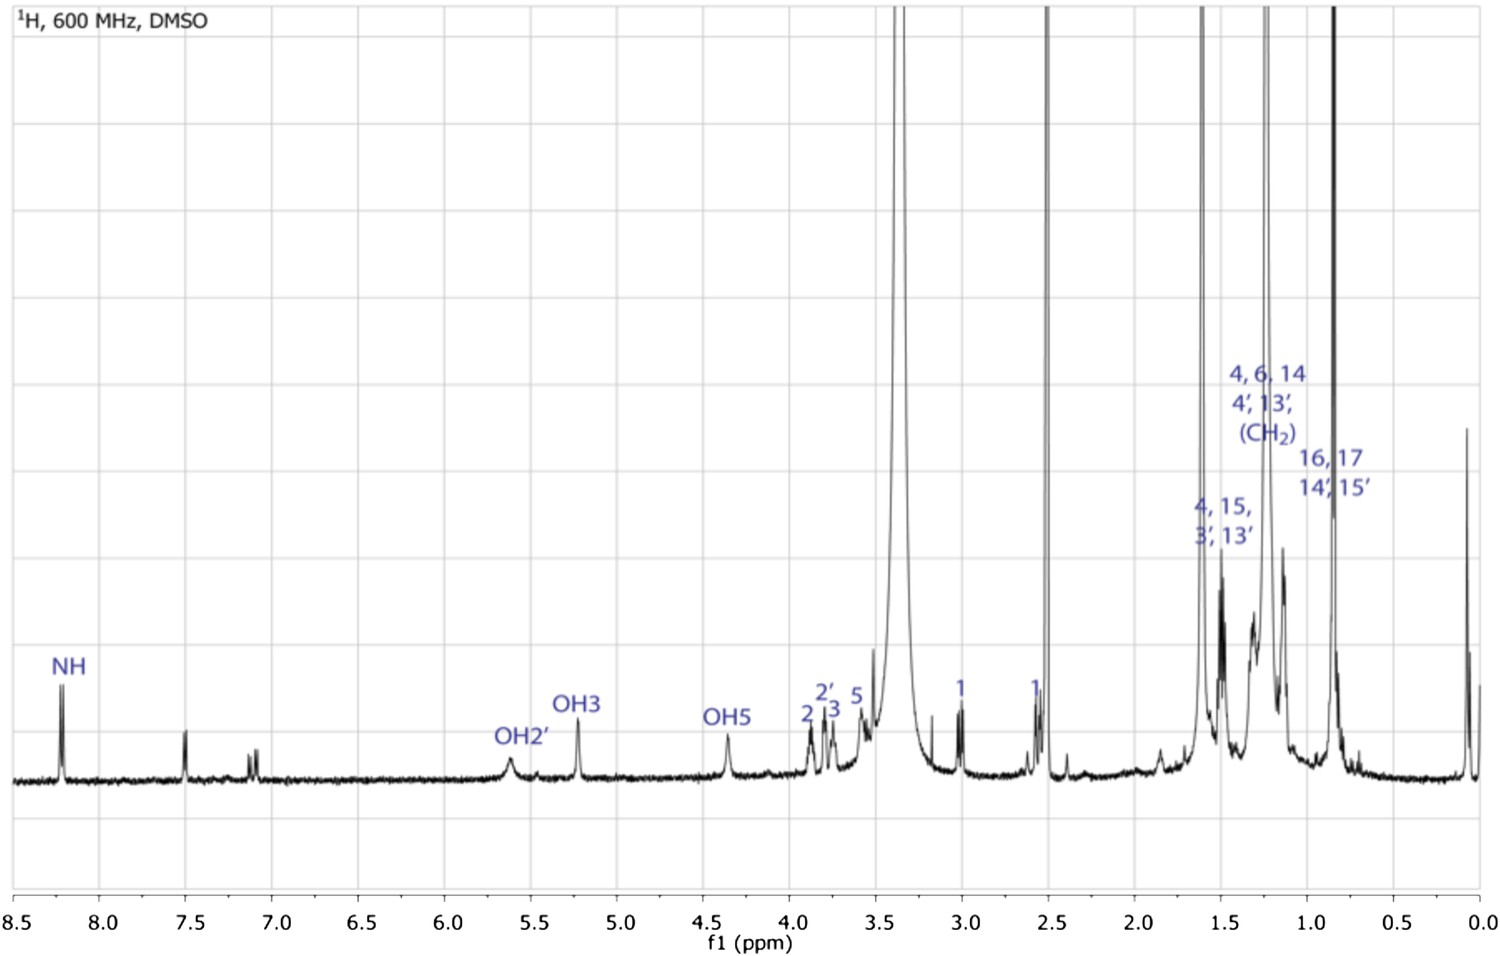
1H NMR spectrum of RIF-1.
The spectrum exhibits one NH (δH 8.21), three hydroxyl groups (δH 5.52, 5.20, and 4.31), five signals from 2.50-4.00 ppm (four methines connected to either nitrogen at δH-2 3.88 or oxygens at δH-2′ 3.80/δH-3 3.71-3.78/δH-5 3.53-3.61, and one methylene connected to sulfur at δH-1 2.56 & 3.01), twenty methylenes and four methyls (δH d, J = 6.6 Hz, 12H) in the high field region (δH 0.75-1.75 ppm).
Figure 3—figure supplement 7
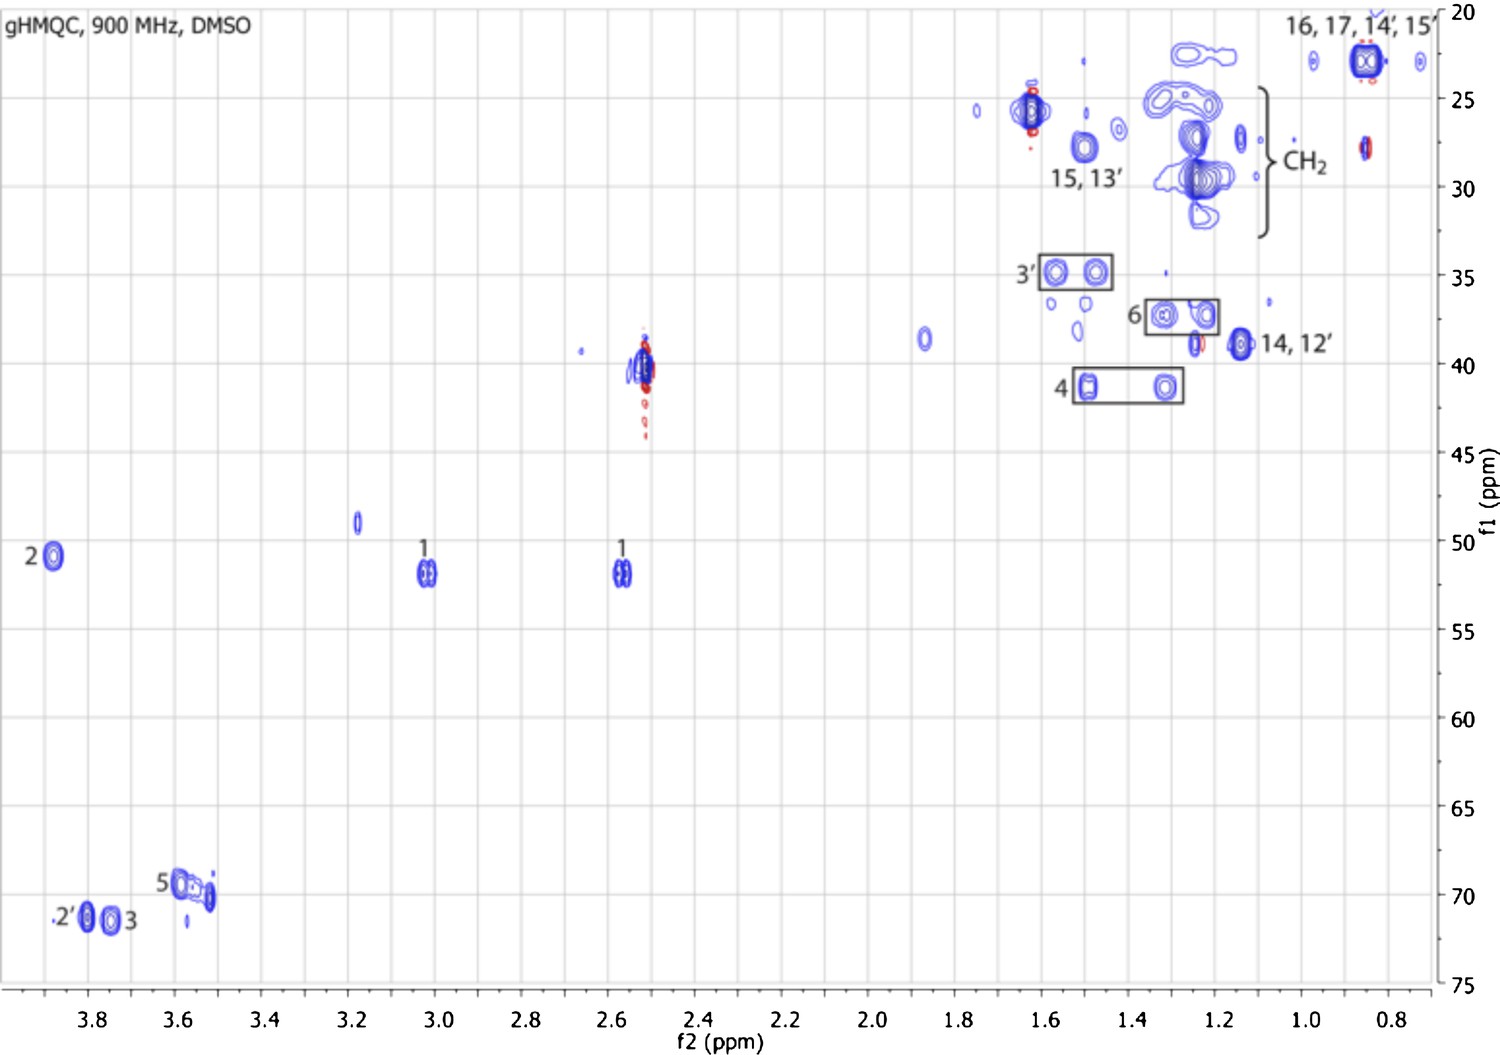
gHMQC spectrum of RIF-1.
The 1J H-C correlations demonstrate that 2 (δH 3.88, δC 50.89) is connected to a nitrogen; 2′, 3, and 5 (δH 3.80/δC 71.29, δH 3.71-3.78/δC 71.51, and δH 3.53-3.61/δC 70.20, respectively) are oxygenated; 1 (δH 3.01 and 2.56, δC 51.87) is adjacent to a sulfonic acid group; and all the other twenty methylenes and four methyls at high filed (δH 0.75-1.75/δC 22.00-42.00).
Figure 3—figure supplement 8
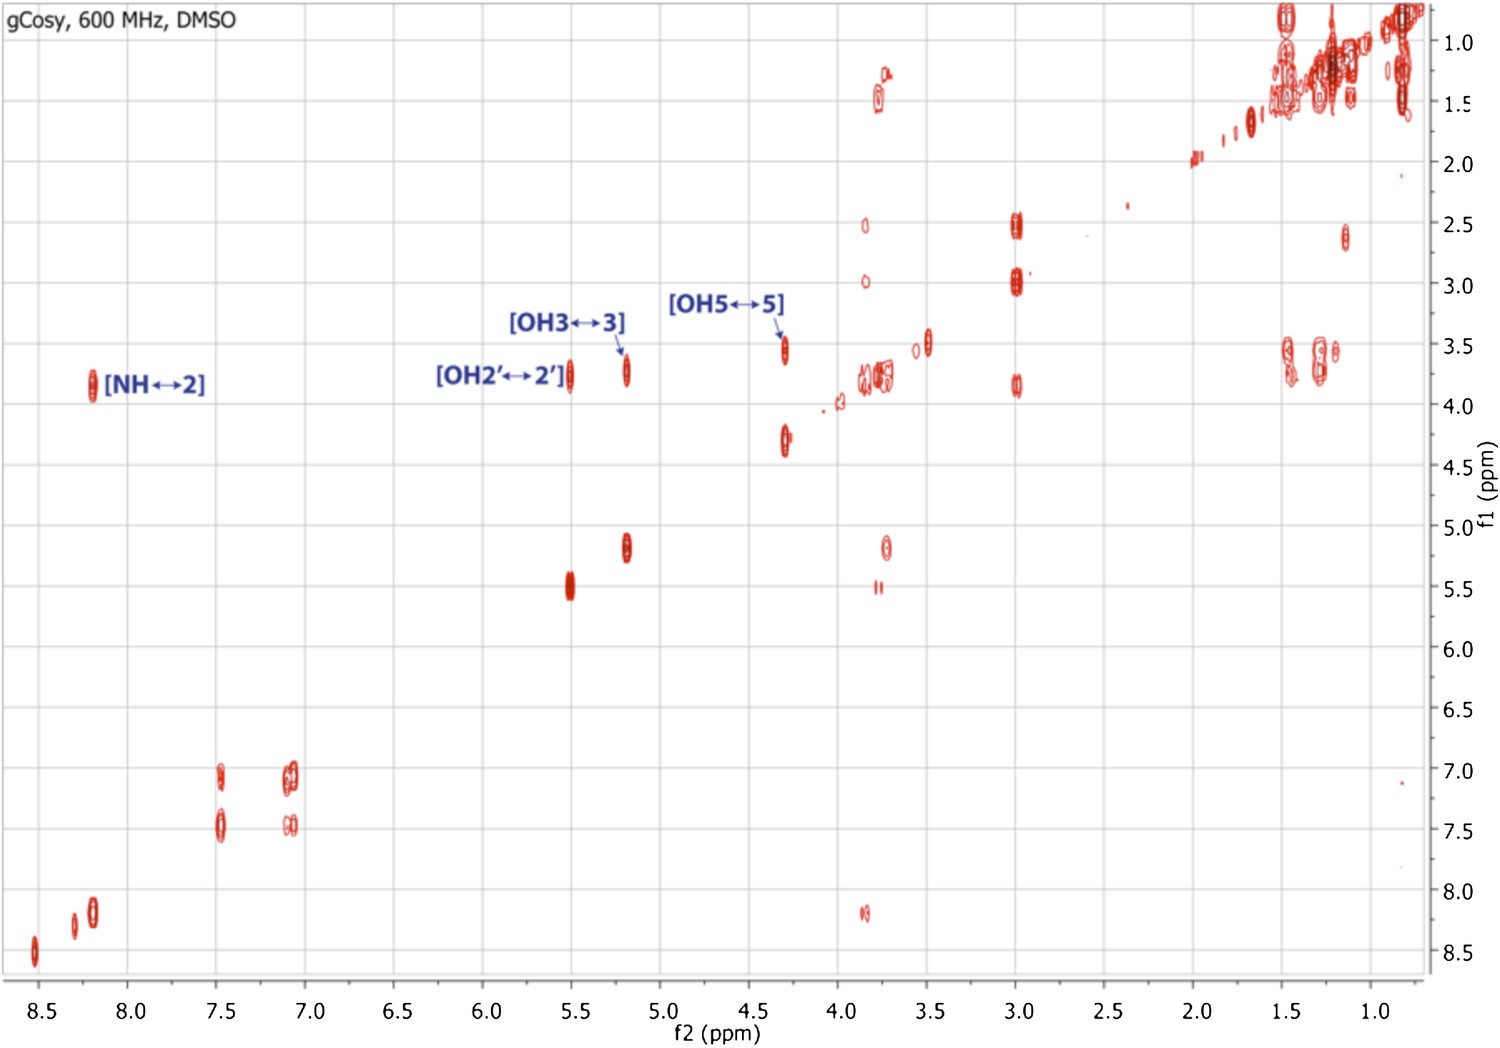
gCOSY spectrum of RIF-1.
Indicated are important H-H correlations between NH and H-2, 2′-OH and H-2′, 3-OH and H-3, and 5-OH and H-5.
Figure 3—figure supplement 9

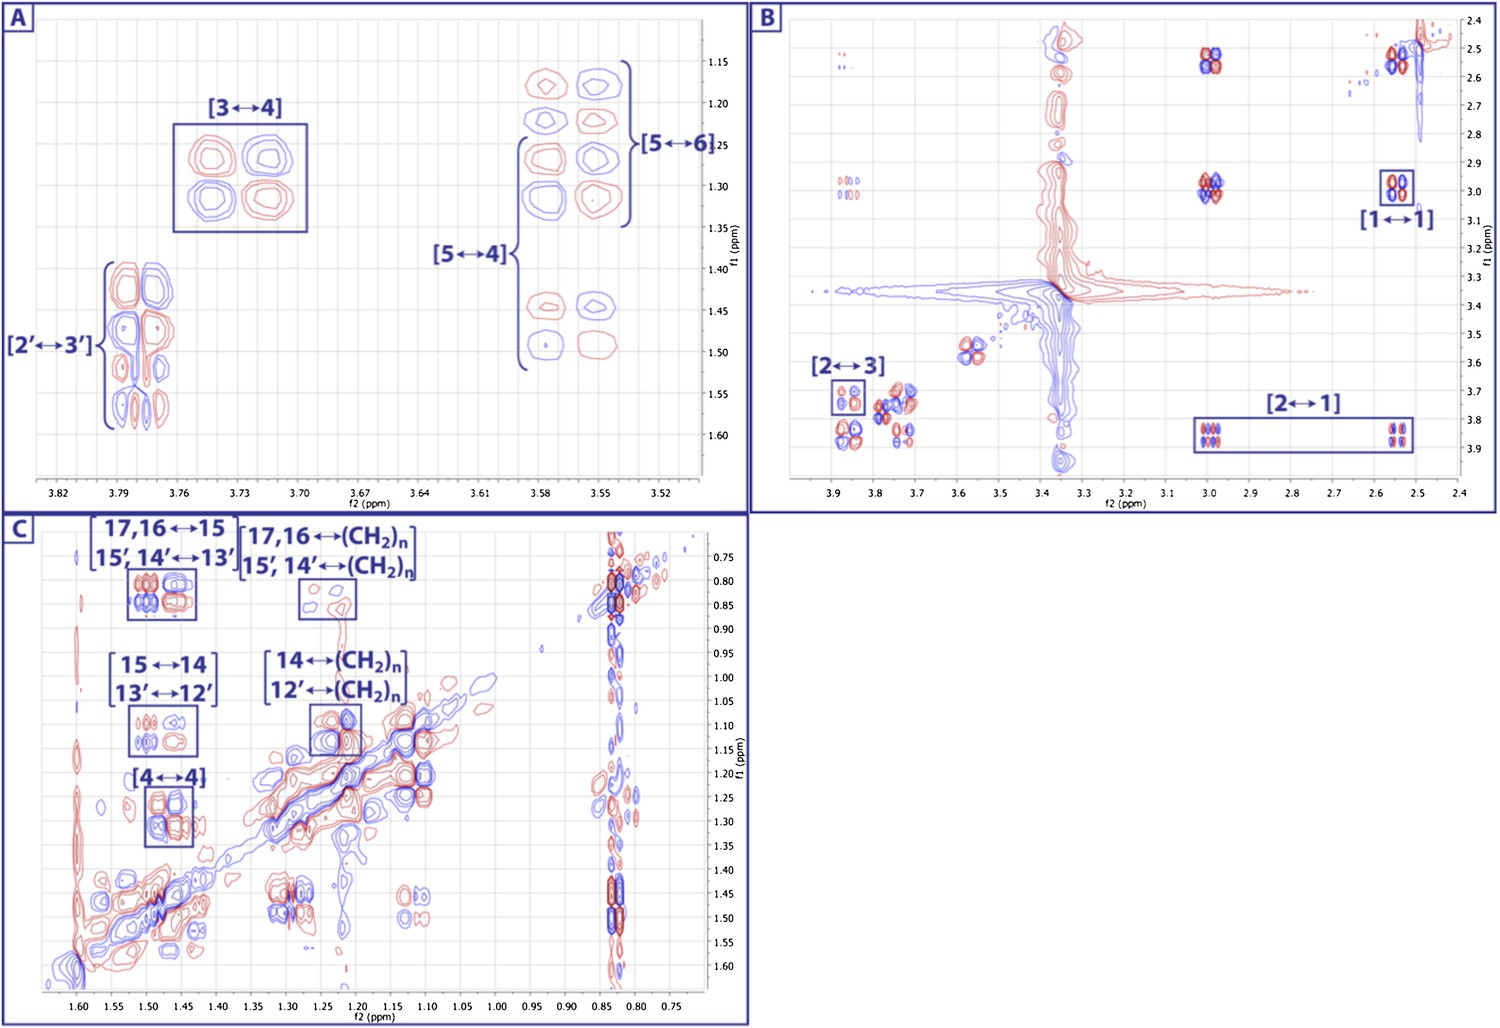
Expanded dqfCOSY spectrum of RIF-1.
In panel A (δH 1.15-1.65 ppm/δH 3.52-3.82 ppm), H-3 (δH 3.73) shows correlation to H-4a (δH 1.30), H-5 (δH 3.57) to H-4a/H-4b (δH 1.30/1.47), and H-5 to H2-6 (δH 1.20/1.29); H-2′ (∼δH 3.8) correlates to H2-3′ (δH 1.45 and 1.54). Panel B (δH 2.4-4.0 ppm/δH 2.4-4.0 ppm) demonstrates the correlations between H2-1 (δH 2.56/∼3.0) and H-2 (δH 3.88), and between H-2 and H-3. Panel C (δH 0.75-1.60 ppm/δH 0.75-1.60 ppm) exhibits correlations in the other methylenes and methyl groups.
Figure 3—figure supplement 10
Expanded dqfCOSY spectra of RIF-1.
A dqfCOSY spectrum was collected in order to get a clear connectivity in the oxygenated region (1-position to 6-position) in the capnoid base fragment.
Figure 3—figure supplement 11

gHMBC spectrum of RIF-1.
Indicated are important 2J or 3J H-C correlations between NH/H-2/H-2′ and C-1′ (δC 173.23), and between NH and C-2/C-3 (δC 50.89/71.51). Based on the MS/MS analysis, the fatty acid fragment must be 2-hydroxy-13-methyltetradecanoyl, and the capnine base fragment must be 2-NH-3,5-dihydroxy-15-methylhexadecane-1-sulfonate. Hence, the planar structure of RIF-1 is determined as shown in Fig. 3 and Fig. 3 – Figure Supplements 3-5.
Figure 3—figure supplement 12
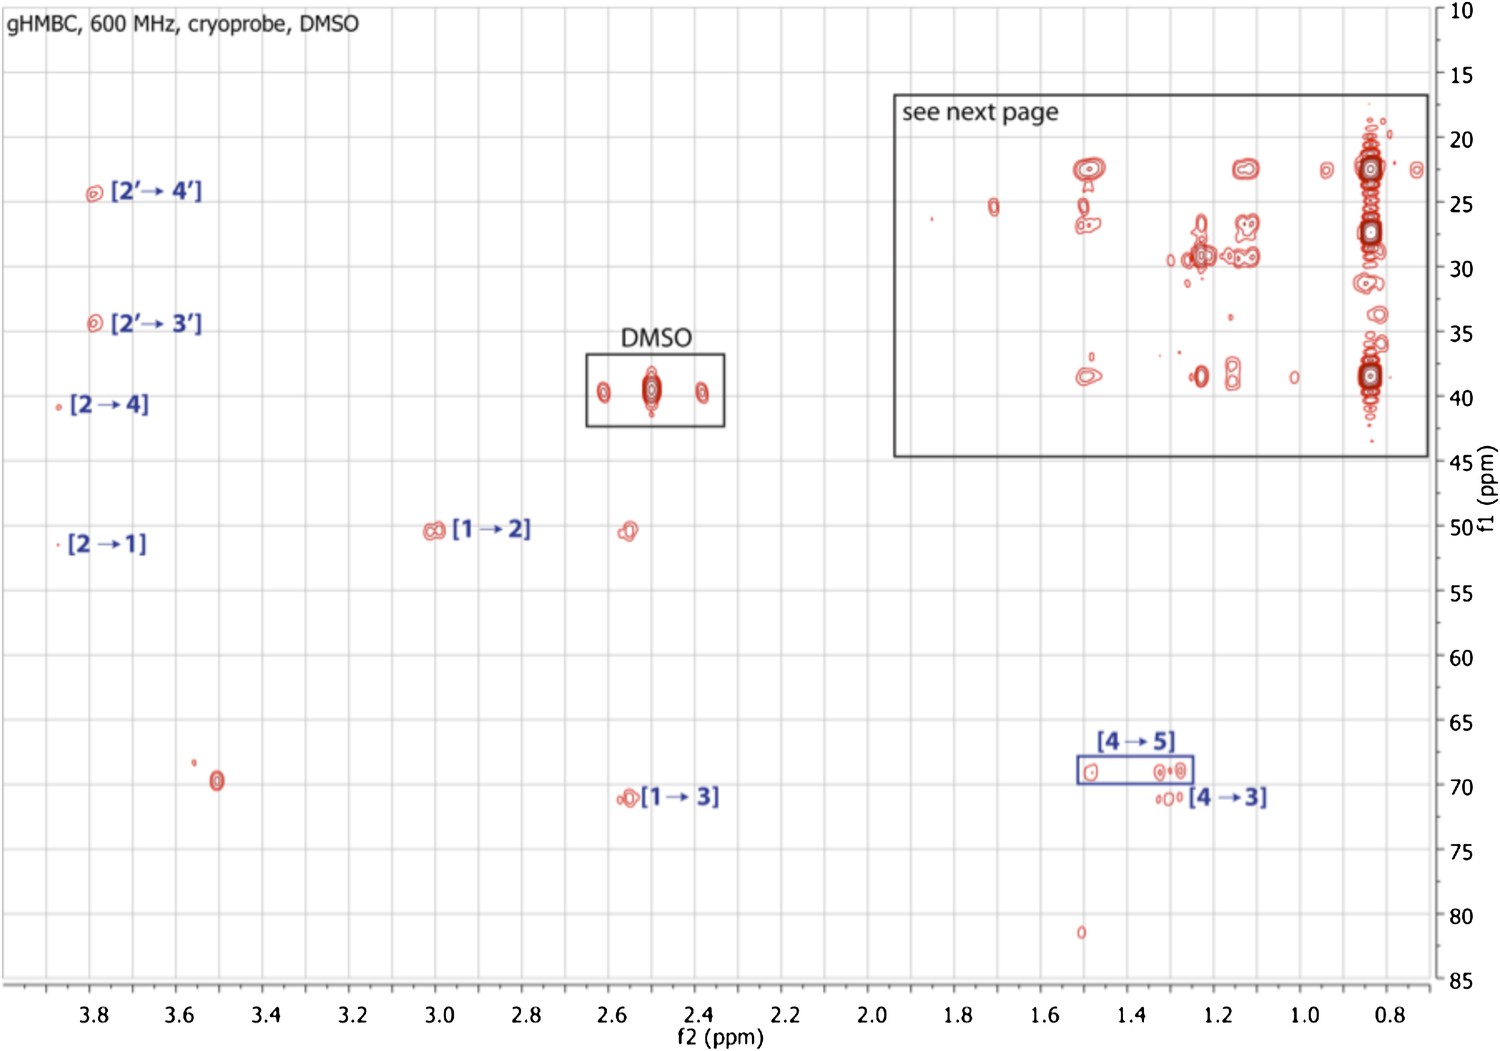
Expanded gHMBC spectrum of RIF-1 (δH 0-4.00 ppm/δC 15.0-85.0 ppm).
Indicated are correlations between H-2 to C-4/C-1 (δC 41.36/51.87), between H-2′ and C-4′/C-3′ (δC 24.99/34.85), between H-1 and C-2/C-3 (δC 50.89/71.51), and between H-4 and C-5/C-3 (δC 70.20/71.51).
Figure 3—figure supplement 13

Expanded gHMBC spectrum of RIF-1 (δH 0.80-1.80 ppm/δC 20.0-40.0 ppm).
Key correlations are between H-16 and C-14/C-15/C-17 (δC 38.91/27.79/22.09), between H-17 and C-14/C-15/C-16 (δC 38.91/27.79/22.09), between H-14′ and C-12′/C-13′/C-15′ (δC 38.91/27.79/22.09), and between H-15′ and C-12′/C-13′/C-14′ (δC 38.91/27.79/22.09).
Figure 3—figure supplement 14

TOCSY spectrum of RIF-1.
The spectrum shows correlations from NH to H2-1 and H-5 through H-2, H-3 and H2-4, and from 3-OH to H-5 via H2-4 and H2-1 through H-3 and H-2.
Figure 3—figure supplement 15
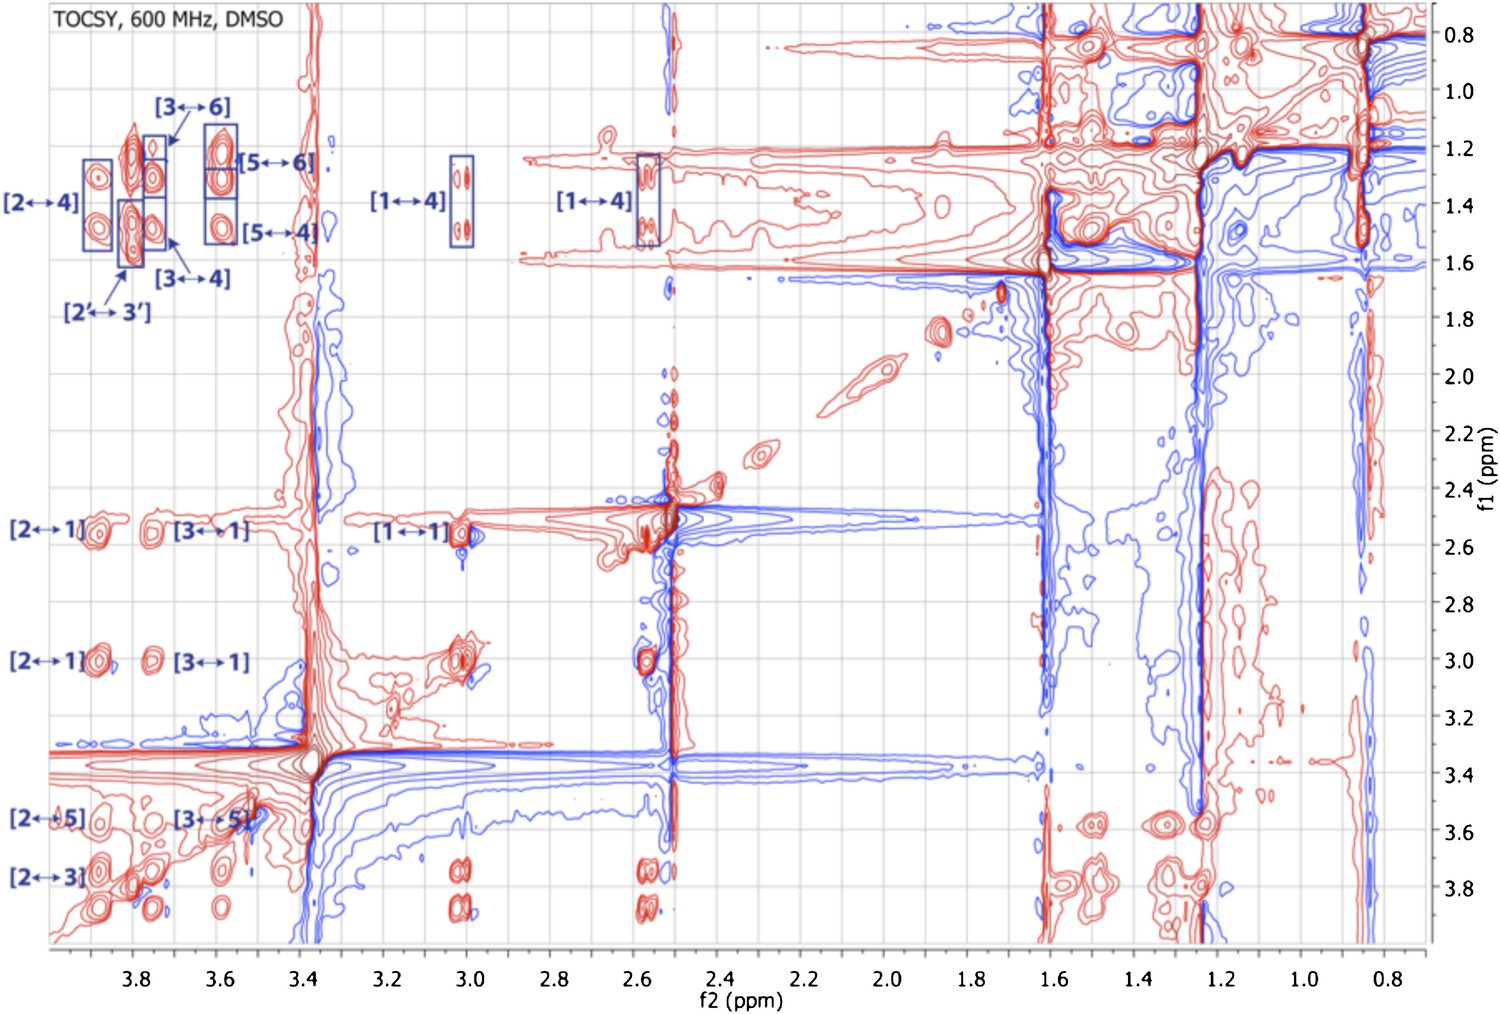
Expanded TOCSY spectrum of RIF-1 (δH 0.50-4.25 ppm/δC 0.50-4.25 ppm).
Another important spin system is clearly demonstrated by the TOCSY correlations between H-2′ and H2-3′/H-4′/H-5′ on the top left of the expanded spectrum.
Figure 4 with 3 supplements
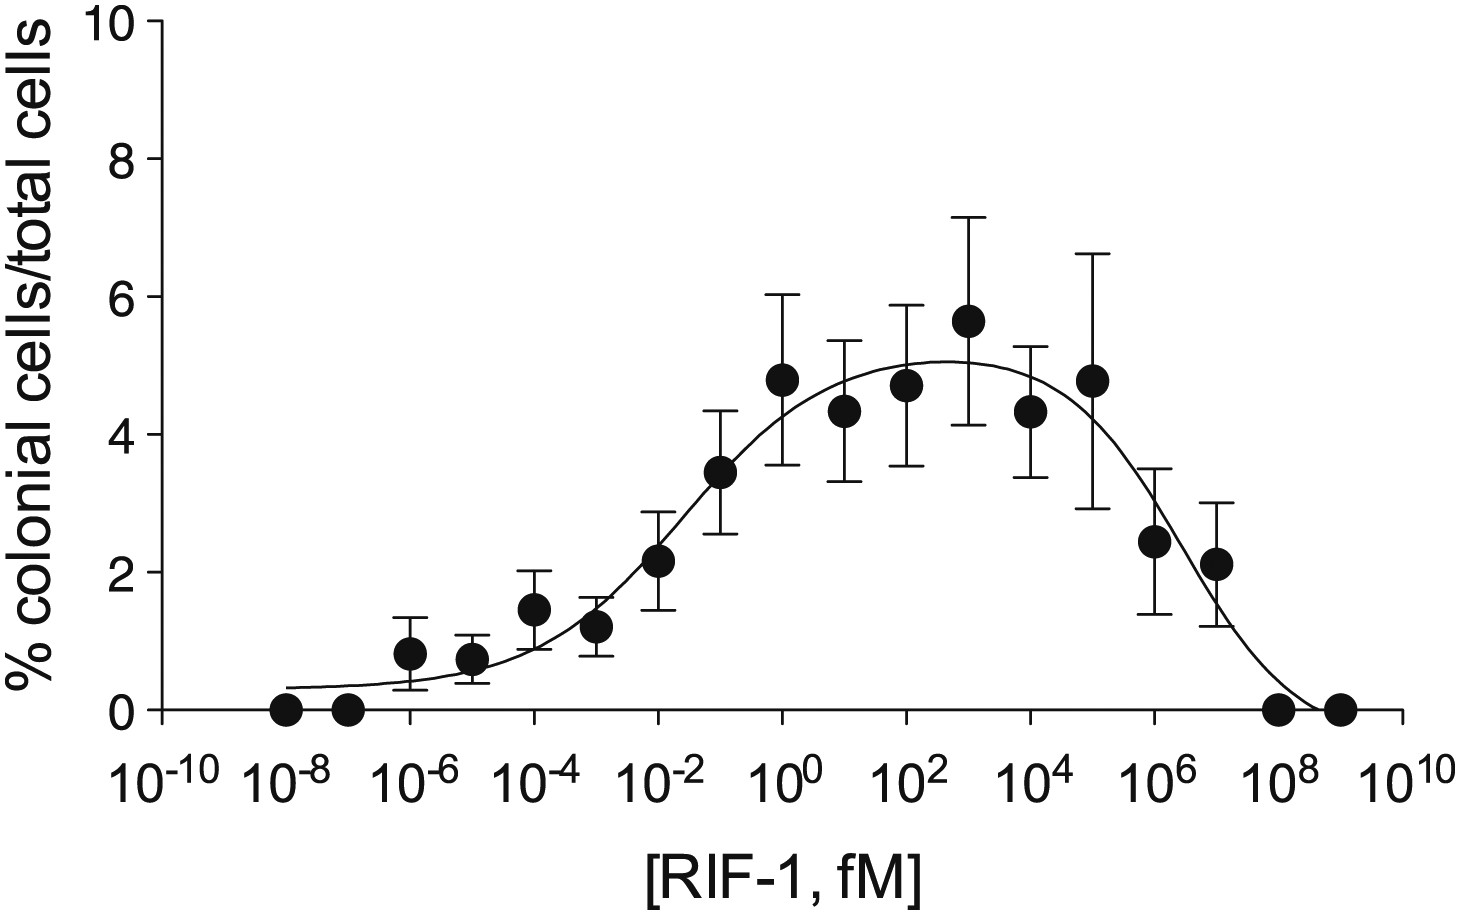
Purified RIF-1 is active at plausible environmental concentrations.
RIF-1 concentrations ranging from 10−2 to 107 fM induce rosette colony development in RCA cultures. Frequency of rosette colony development was quantified in RCA cultures 2 days after treatment with a dilution series of purified RIF-1. Data are mean ± s.e. from three independent experiments. Line indicates non-linear regression of the RIF-1 activity profile.
Figure 4—figure supplement 1
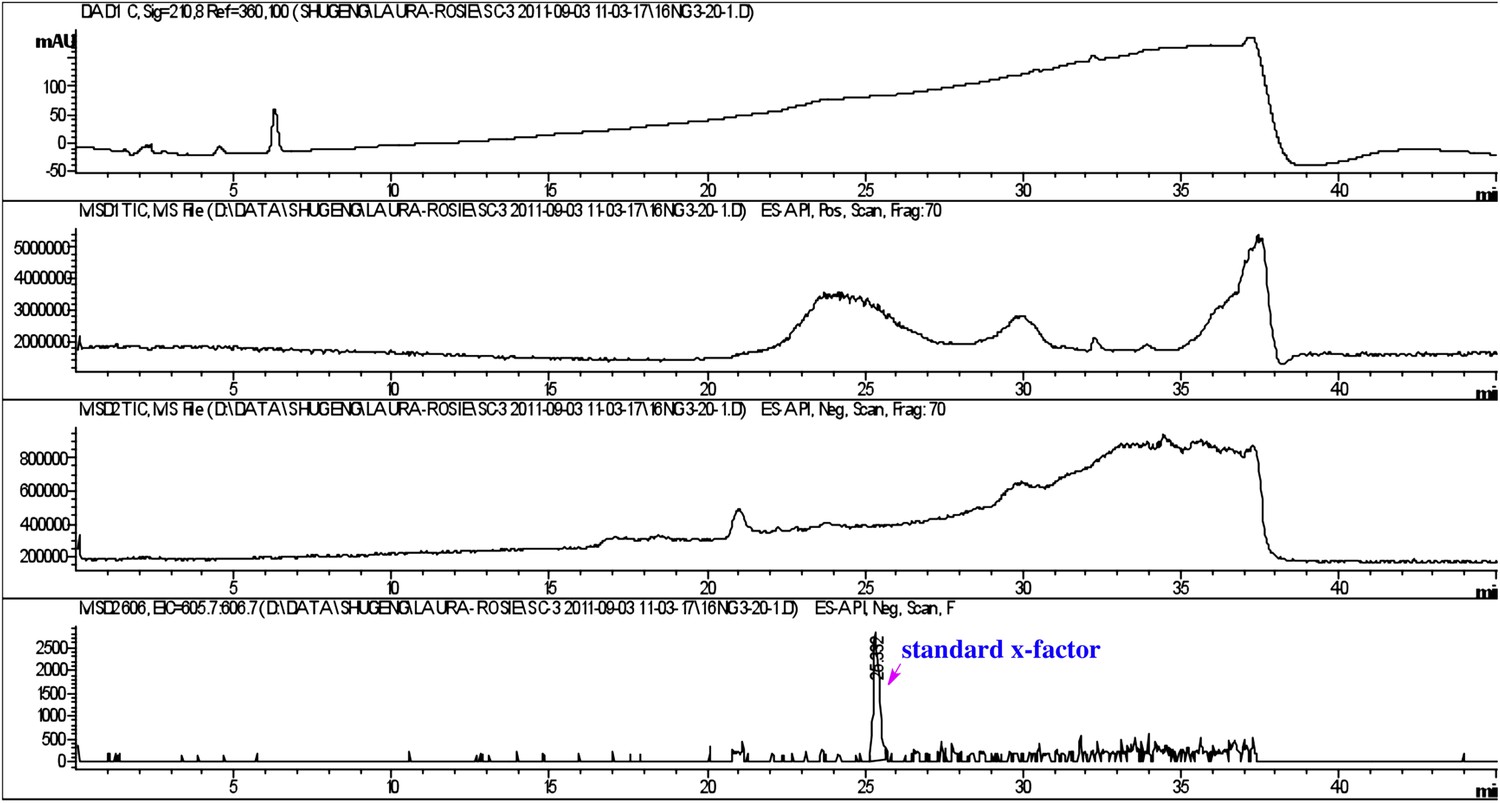
Detection of purified RIF-1.
RIF-1 did not show absorbance at 210 nm (top panel), but the molecule (606 Da, M-H) was detected between 25 and 26 minutes (bottom panel).
Figure 4—figure supplement 2
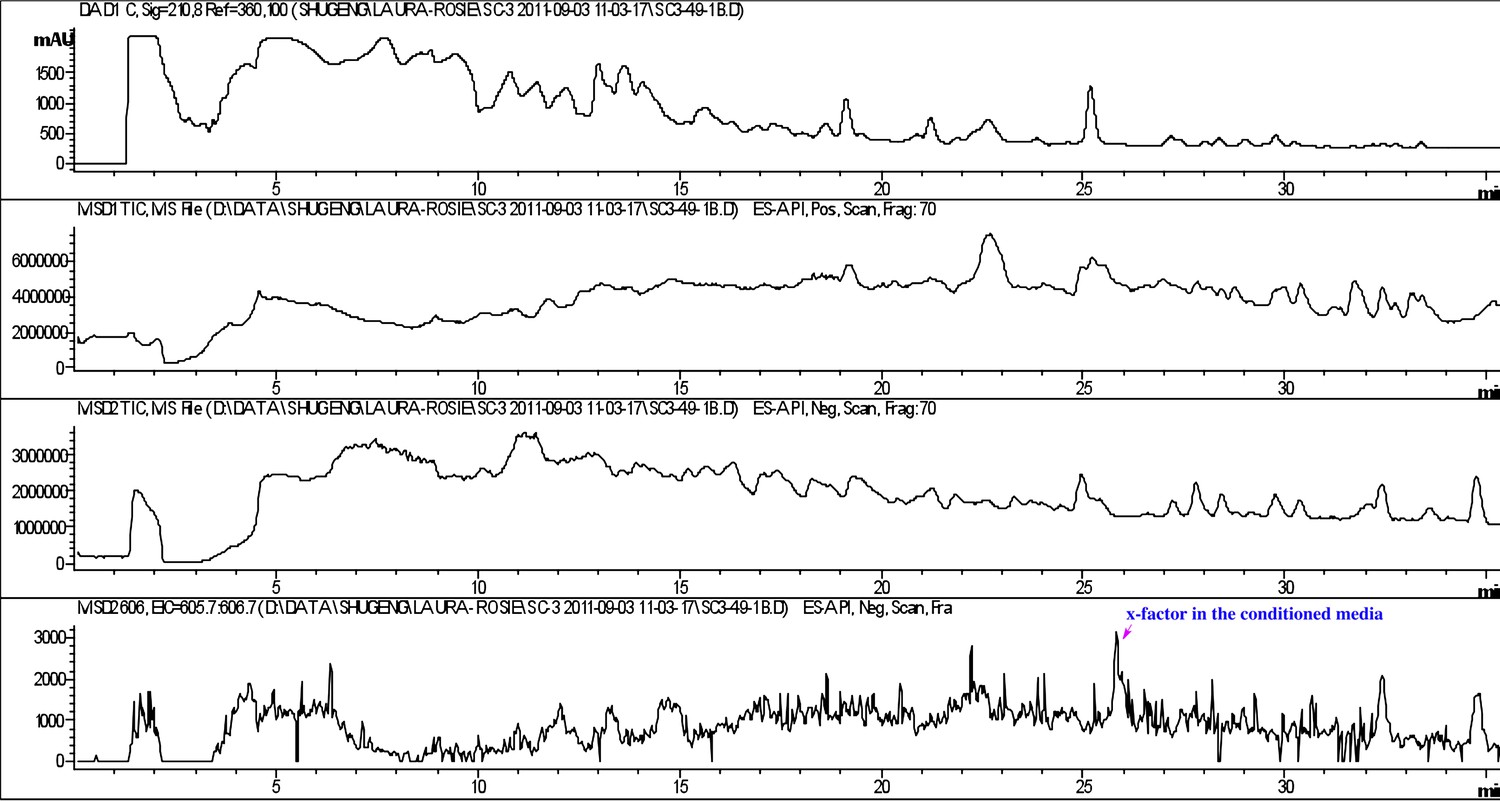
Detection of RIF-1 in the conditioned medium of A. machipongonensis.
RIF-1 (bottom panel) was detected in the conditioned medium after the broth was concentrated 250 times.
Figure 4—figure supplement 3
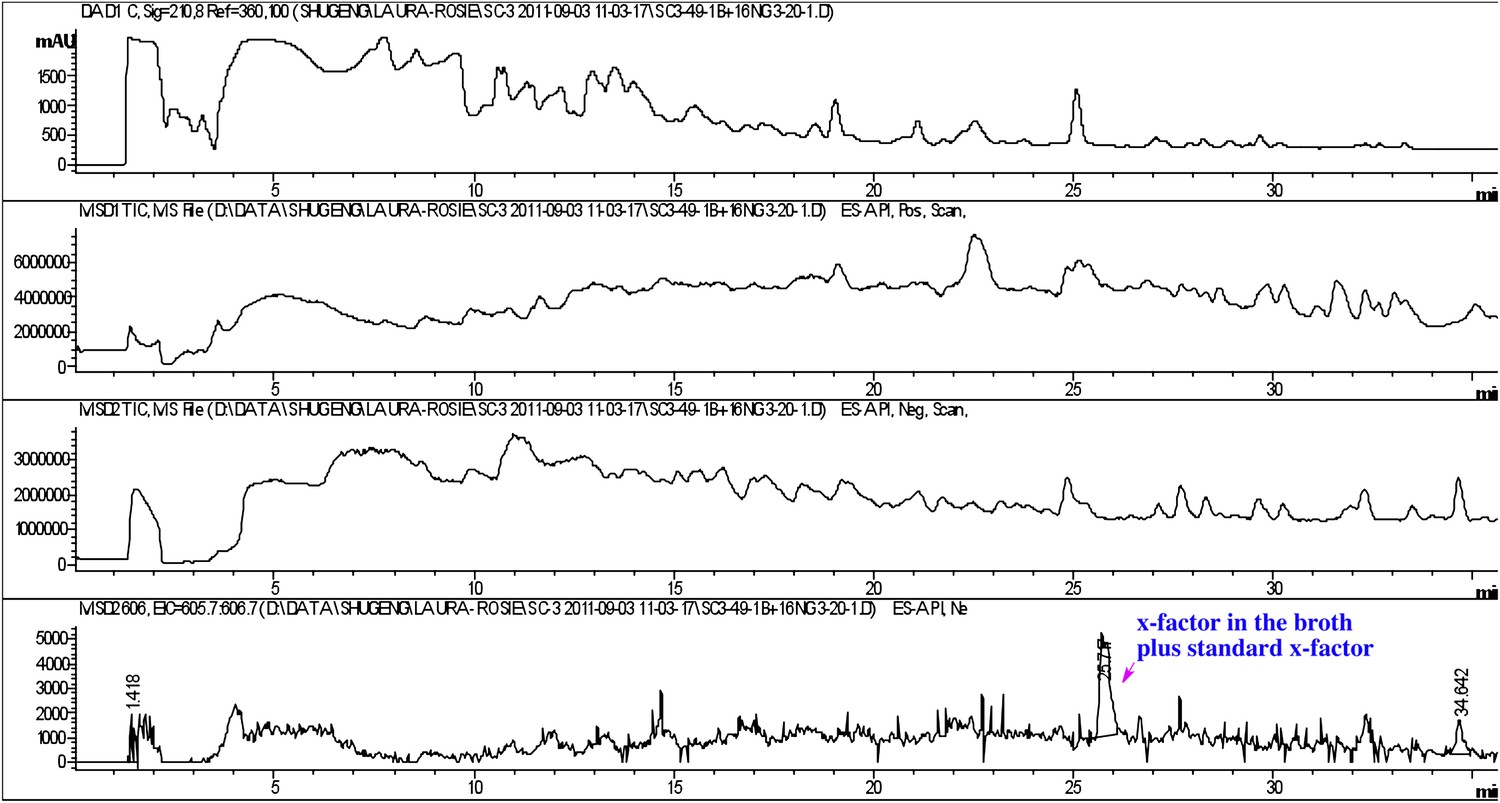
Co-injection of concentrated conditioned medium with purified RIF-1.
The peak of the RIF-1 in the conditioned medium was enhanced after the sample was spiked with purified RIF-1 (bottom panel).
Tables
Table 1
Species tested for colony induction
| Species | 16S rDNA accession number | Reference | Rosette colonies |
| Algoriphagus machipongonensis PR1 | NZ_AAXU00000000 | Alegado et al. (2012) | + |
| Algoriphagus alkaliphilus AC-74 | AJ717393 | Tiago et al. (2006) | + |
| Algoriphagus boritolerans T-22 | AB197852 | Ahmed et al. (2007) | + |
| Algoriphagus mannitolivorans JC2050 | AY264838 | Yi and Chun (2004) | + |
| Algoriphagus marincola SW-2 | AY533663 | Yoon et al. (2004) | + |
| Algoriphagus ornithinivorans JC2052 | AY264840 | Yi and Chun (2004) | + |
| Algoriphagus vanfongensis KMM 6241 | EF392675 | Van Trappen et al. (2004) | + |
| Algoriphagus antarcticus LMG 21980 | AJ577141 | Nedashkovskaya et al. (2004) | + |
| Algoriphagus aquimarinus LMG 21971 | AJ575264 | Nedashkovskaya et al. (2004) | + |
| Algoriphagus chordae LMG 21970 | AJ575265 | Nedashkovskaya et al. (2004) | + |
| Algoriphagus halophilus JC2051 | AY264839 | Yi and Chun (2004) | + |
| Algoriphagus locisalis MSS-170 | AY835922 | Yoon et al. (2005a) | + |
| Algoriphagus ratkowskyi LMG 21435 | AJ608641 | Bowman et al. (2003) | + |
| Algoriphagus terrigena DS-44 | DQ178979 | Yoon et al. (2006) | + |
| Algoriphagus winogradskyi LMG 21969 | AJ575263 | Nedashkovskaya et al. (2004) | + |
| Algoriphagus yeomjeoni MSS-160 | AY699794 | Yoon et al. (2005b) | + |
| Agrobacterium tumefaciens C58 | AE007870 | Wood et al. (2001) | + |
| Aquiflexum balticum BA160 | AJ744861 | Brettar et al. (2004a) | − |
| Bacillus subtilis 168 | AL009126 | Kunst et al. (1997); Burkholder and Giles (1947); Spizizen (1958) | − |
| Bacteroides fragilis NCTC9343 | CR626927 | Cerdeno-Tarraga et al. (2005) | − |
| Belliella baltica BA134 | AJ564643 | Brettar et al. (2004b) | − |
| Caulobacter crescentus CB15 | AE005673 | Nierman et al. (2001) | − |
| Croceibacter atlanticus HTCC2559 | NR_029064 | Cho and Giovannoni (2003) | − |
| Cyclobacterium marinum LMG 13164 | AJ575266 | Raj and Maloy 1990) | + |
| Cytophaga hutchinsonii ATCC 33406 | M58768 | Lewin (1969) | + |
| Dyadobacter fermentans DSM 18053 | NR_027533 | Chelius and Triplett (2000) | + |
| Echinicola pacifica KMM 6172 | NR_043619 | Nedashkovskaya et al. (2006) | − |
| Escherichia coli MG1655 | U00096 | Blattner et al. (1997) | − |
| Flavobacteria johnsoniae UW101 | CP000685 | Bernardet et al. (1996) | − |
| Flectobacillus major DSM 103 | M62787 | Raj and Maloy (1990) | + |
| Listeria monocytogenes 10403S | CP002002 | Edman et al. (1968) | − |
| Magnetospirillum magneticum AMB-1 | AP007255 | Matsunaga et al. (2005) | − |
| Microscilla marina ATCC 23134 | M123134 | Garrity (2010) | − |
| Oceanostipes pacificus HTCC2170 | CP002157 | Oh et al. (2011) | − |
| Robiginitalea biformata HTCC2501 | CP001712 | Cho and Giovannoni (2004) | − |
| Salinibacter ruber DSM13855 | CP000159 | Anton et al. (2002) | − |
| Sphingomonas wittichii RW1 | CP000699 | Miller et al. (2010) | − |
| Vibrio fischeri ES114 | CP000021 | Ruby et al. (2005) | − |
| Zobellia galactonovorans Dsij | NR_025053 | Barbeyron et al. (2001) | + |
| Zobellia uliginosa ATCC 14397 | M62799 | Matsuo et al. (2003) | + |
-
−: no rosette colonies observed; +: rosette colonies observed.
Table 2
Responses of RCA culture to various supplements
| Treatment | Rosette colonies | Interpretation |
| Sea water | − | |
| CM from ATCC50818 | + | RIF-1 present in environmental isolate ATCC 50818 |
| CM from RCA | − | RIF-1 is absent in RCA lines |
| Live A. machipongonensis (cell pellet) | ++ | RIF-1 is produced by A. machipongonensis |
| Heat killed A. machipongonensis (cell pellet) | ++ | RIF-1 is resistant to heat |
| A. machipongonensis CM | + | RIF-1 is released by live Algoriphagus |
| A. machipongonensis CM, boiled 10 min | + | RIF-1 is not labile |
| A. machipongonensis CM + Proteinase K | + | RIF-1 is not a protein |
| A. machipongonensis CM + DNAse | + | RIF-1 is not DNA |
| A. machipongonensis CM + RNAse | + | RIF-1 is not RNA |
| A. machipongonensis CM, MeOH extract | + | RIF-1 is an organic compound |
| A. machipongonensis cell pellet, MeOH extract | ++ | RIF-1 is present in the Algoriphagus cell envelope |
| A. machipongonensis cell pellet, Bligh-Dyer extract | ++ | RIF-1 is a lipid |
| Sphingomyelin (20 mg mL−1) | − | Sphingomyelin does not induce rosette colony development |
| Monosialoganglioside (20 mg mL−1) | − | Monosialoganglioside does not induce rosette colony development |
| Galactocerebroside (20 mg mL−1) | − | Galactocerebroside does not induce rosette colony development |
| N-palmitoyl-DL-dihydrolacto cerebroside (20 mg mL−1) | − | N-palmitoyl-DL-dihydrolacto cerebroside does not induce rosette colony development |
-
−: no induction; +: low induction; ++: high induction
-
CM: conditioned medium; RCA: rosette colonies absent; RIF-1: rosette inducing factor 1.
Table 3
Table of NMR chemical shifts
| Position | δ 1H (multiplicity, J, #H) | 13C (δ, ppm) |
| NH | 8.21 (d, J=9.1 Hz, 1H) | |
| 1 | 3.01 (dd, J=14.2, 5.1 Hz, 1H) | 51.87 |
| 2.56 (dd, J=14.3, 3.6 Hz, 1H) | ||
| 2 | 3.88 (ddd, J=13.0, 8.6, 4.5 Hz, 1H) | 50.89 |
| 3 | 3.78 – 3.71 (m, 1H) | 71.51 |
| OH3 | 5.20 (d, J=4.2 Hz, 1H) | |
| 4 | 1.51 – 1.47 (m, 1H) | 41.36 |
| 1.33 – 1.29 (m, 1H) | ||
| 5 | 3.61 – 3.53 (m, 1H) | 70.20 |
| OH5 | 4.31 (d, J=3.5 Hz, 1H) | |
| 6 | 1.34 – 1.29 (m, 1H) | 37.27 |
| 1.24 – 1.20 (m, 1H) | ||
| 7–13 | 1.21 – 1.27 (br s, 14H) | 22.5–29.6 |
| 14 | 1.16 – 1.11 (m, 2H) | 38.91 |
| 15 | 1.52 – 1.47 (m, 1H) | 27.79 |
| 16, 17 | 0.84 (d, J=6.6 Hz, 6H) | 22.09 |
| 1′ | 173.23 | |
| 2′ | 3.80 (dd, J=6.6, 4.2 Hz, 1H) | 71.29 |
| OH2′ | 5.52 (d, J=5.0 Hz, 1H) | |
| 3′ | 1.59 – 1.54 (m, 1H) | 34.85 |
| 1.50 – 1.45 (m, 1H) | ||
| 4′? | 1.35 – 1.30 (m, 2H) | 24.99 |
| 5′–11′ | 1.21 – 1.27 (br s, 14H) | 22.5–29.6 |
| 12′ | 1.16 – 1.11 (m, 2H) | 38.91 |
| 13′ | 1.52 – 1.47 (m, 1H) | 27.79 |
| 14′, 15′ | 0.84 (d, J=6.6 Hz, 6H) | 22.09 |
Download links
A two-part list of links to download the article, or parts of the article, in various formats.
Downloads (link to download the article as PDF)
Open citations (links to open the citations from this article in various online reference manager services)
Cite this article (links to download the citations from this article in formats compatible with various reference manager tools)
A bacterial sulfonolipid triggers multicellular development in the closest living relatives of animals
eLife 1:e00013.
https://doi.org/10.7554/eLife.00013


