Structure-based discovery of fiber-binding compounds that reduce the cytotoxicity of amyloid beta
- Howard Hughes Medical Institute, UCLA–DOE Institute for Genomics and Proteomics, University of California, Los Angeles, United States
Figures
Figure 1 with 3 supplements
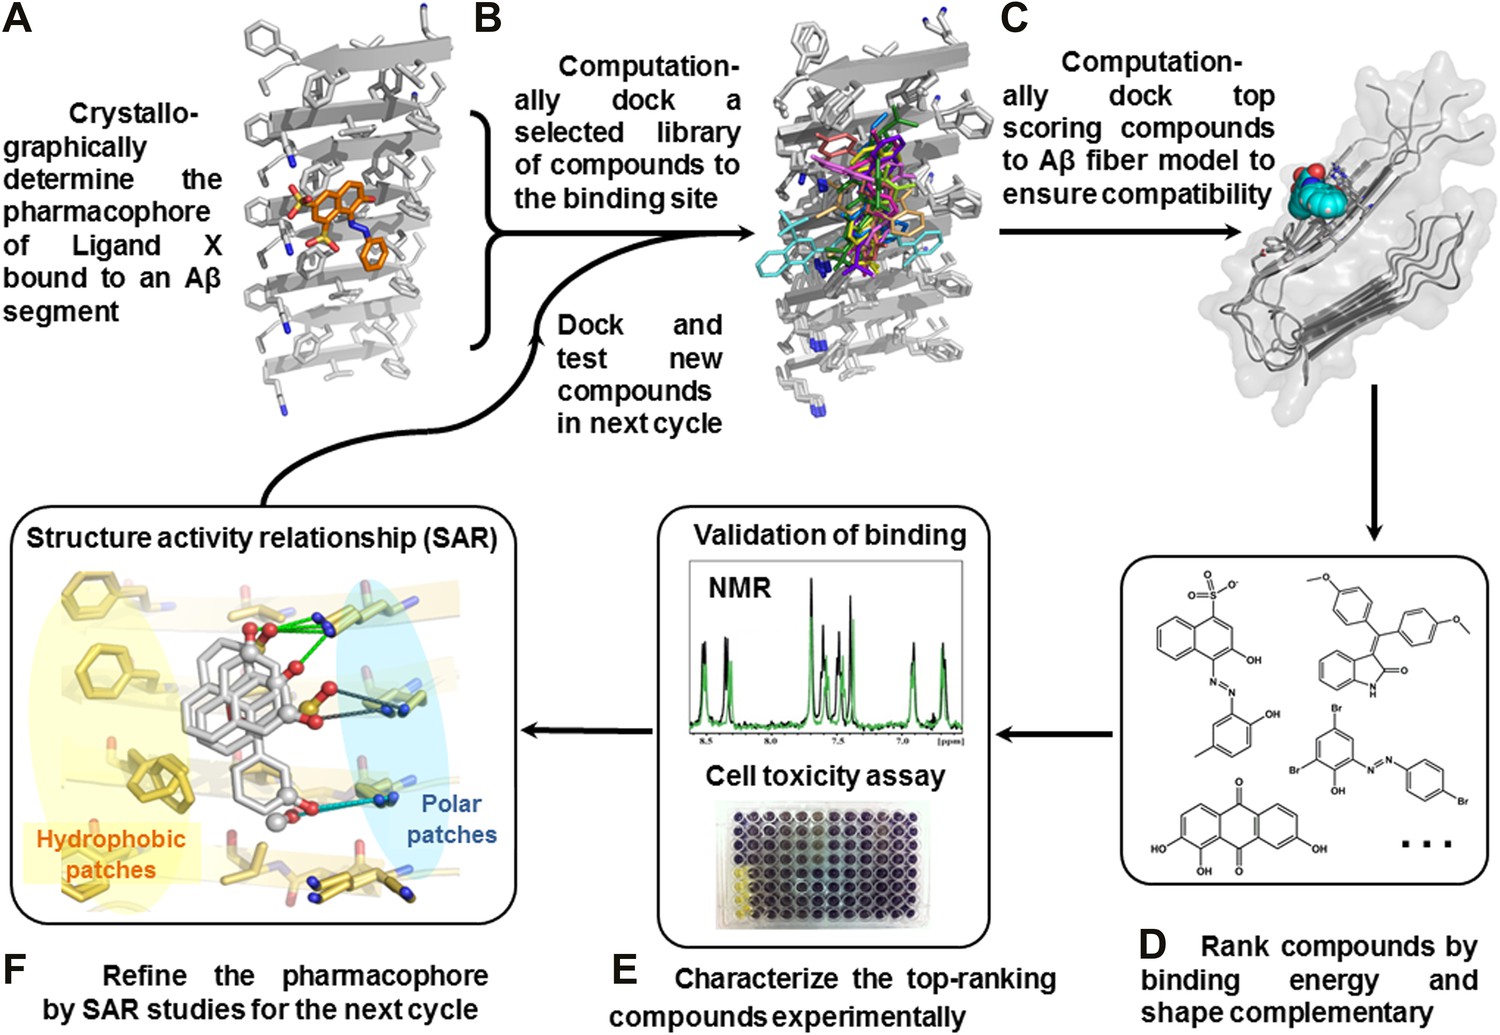
Structure-based identification of small compound inhibitors of Aβ toxicity.
In step (A) the crystal structure (Landau et al., 2011) is determined of a complex of an amyloidogenic segment of Aβ (in this case residues 16-KLVFFA-21 of the spine of the Aβ fiber) with an amyloid-binding Ligand X (in this case orange G), revealing aspects of the pharmacophore for Ligand X. Prior to step (B) a large library of available compounds is selected for computational docking (∼18,000 purchasable compounds in this case). In step (B) computational docking is applied to test the compatibility of each member of the library for the pharmacophore of the amyloidogenic segment defined in step (A). In step (C), the top scoring members of the library are tested for compatibility of binding within a full-length Aβ fiber (in this case the 400 top scoring members were tested on a solid state NMR-derived model of an Aβ fiber, pdb entry 2LMO) (Petkova et al., 2006). The representative models from steps B and C are shown in Figure 1—figure supplements 1 and 2. In step (D), the compounds are ranked by tightest binding energy and best shape complementarity for the pharmacophore. In step (E), the top-ranking compounds (25 in this case) are selected for experimental characterization and validation, including NMR assessment of binding, EM assays of their effects on fiber formation, and cell viability assays for their effects on Aβ cytotoxicity. In step (F), new compounds (9 in this case) and compound derivatives (17 in this case) are selected for an additional cycle of computational and experimental testing, based on their similarity to the lead compounds from the initial cycle.
Figure 1—figure supplement 1
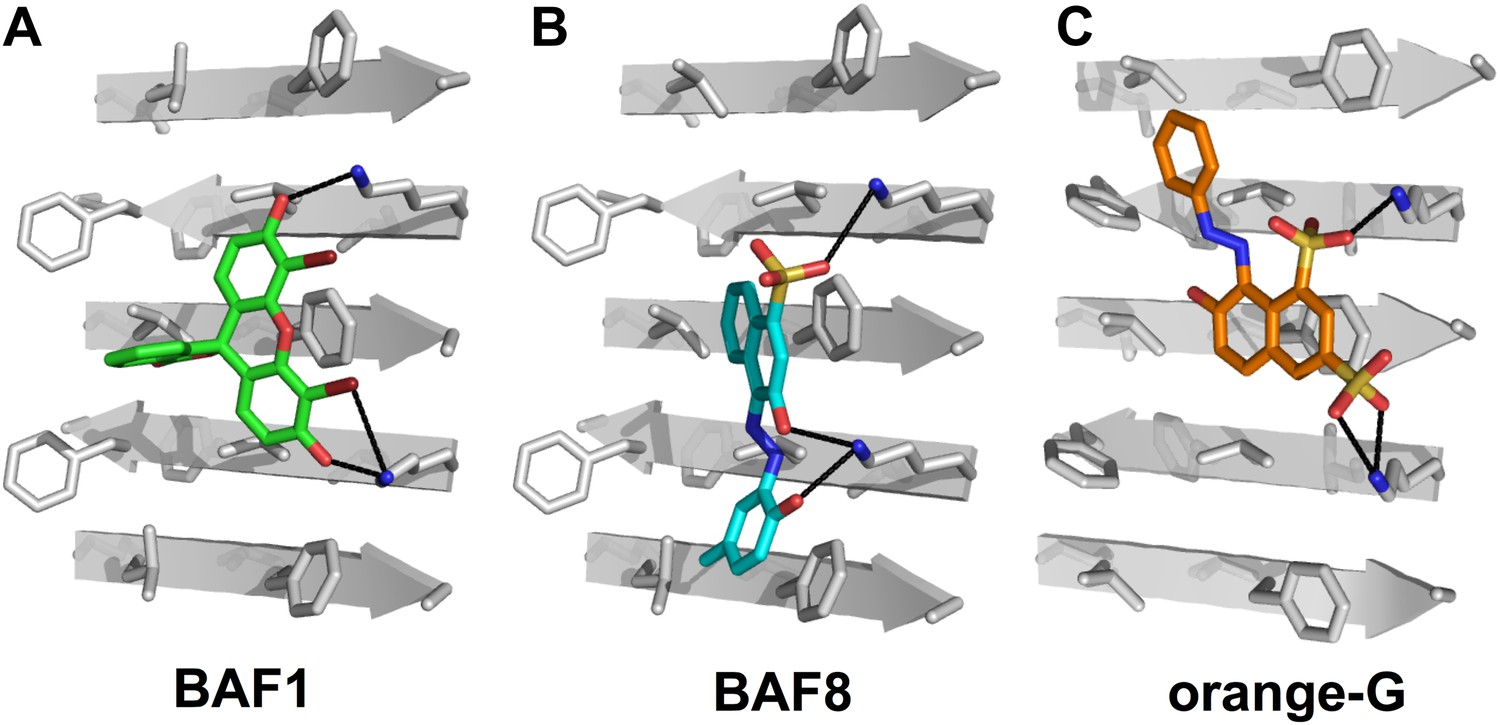
Structural models of the representative BAFs and orange G docked to the side of the KLVFFA(Aβ16–21) fiber.
In step (B) (Figure 1), a large library of ∼18 thousand commercially available compounds were docked onto the Aβ16–21 fiber, and ∼400 top ranking compounds, whose binding energy and shape complementary score are better than the control molecule orange G, were selected for the next docking step. The models of representative BAFs docked on single beta-sheet of Aβ16–21 fiber are compared to that of orange G. (A). A side view of the compound BAF1 (in green sticks) docked on the Aβ16–21 fiber (in a grey color) with a predicted binding energy of −8.4 kcal/mol. (B). A side view of BAF8 (in cyan sticks) docked on the Aβ16–21 fiber with a predicted binding energy of −12 kcal/mol. (C). A side view of orange G (in orange sticks) docked on the Aβ16–21 fiber with a predicted binding energy of −8.0 kcal/mol. The charge interactions between the compounds and Lysine residues of Aβ16–21 fiber are highlighted by black lines.
Figure 1—figure supplement 2
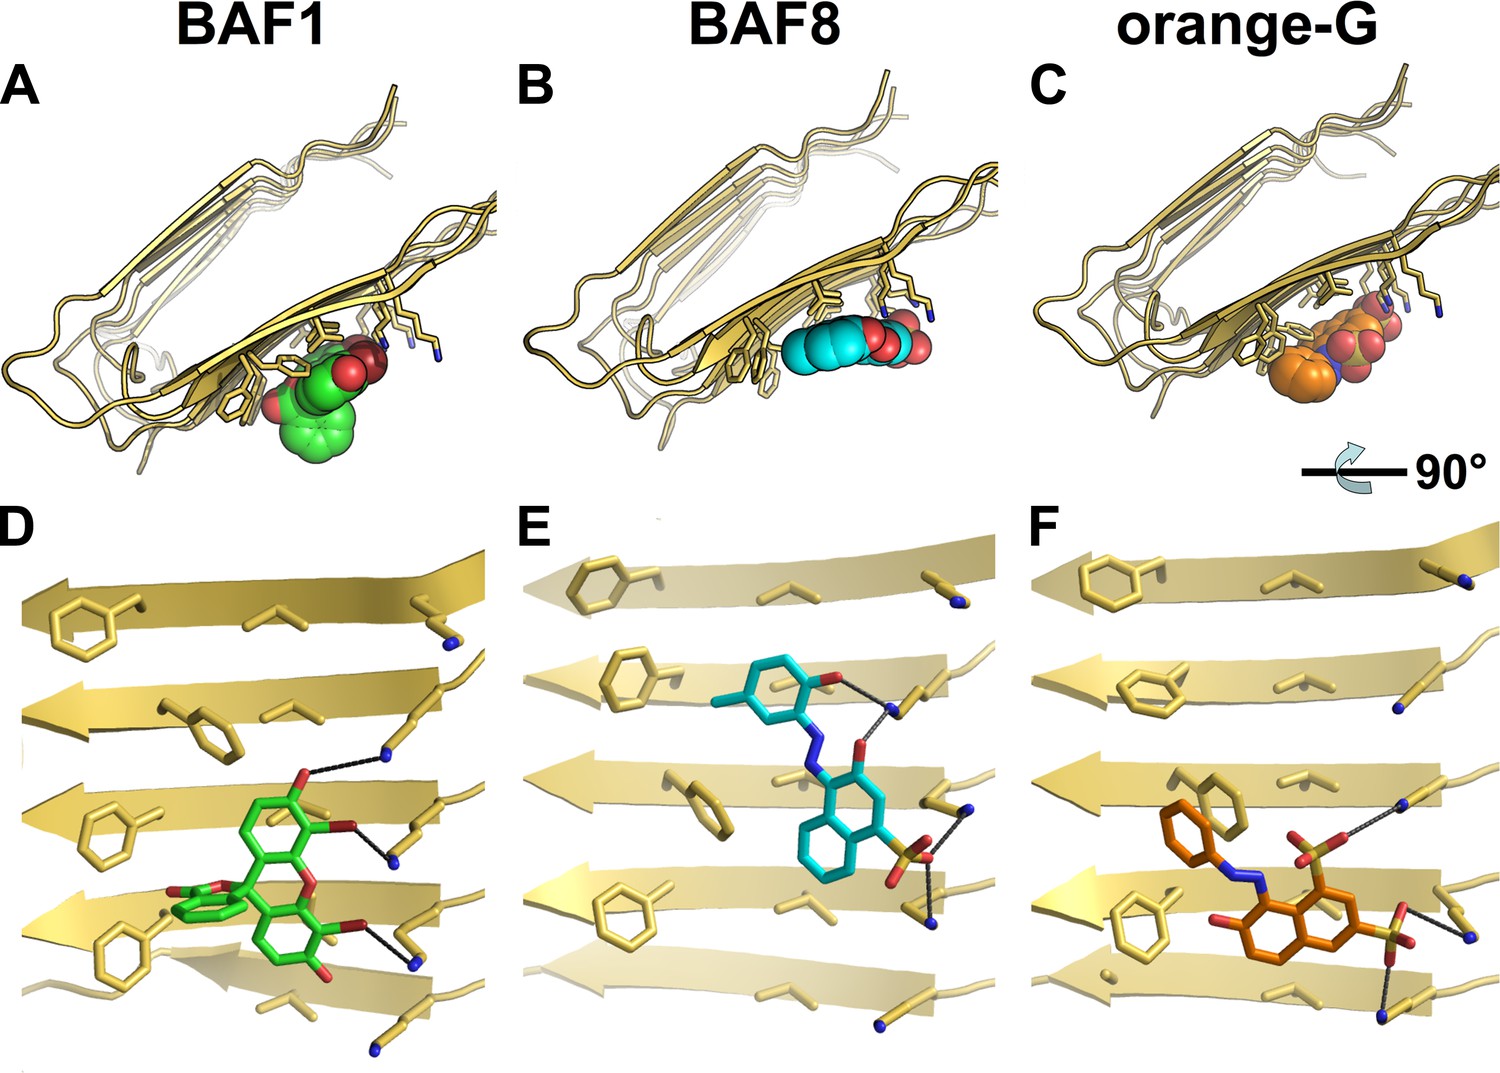
Structural models of the representative BAFs and orange G docked onto the full-length Aβ fiber.
In step (C) (Figure 1), the top-ranking compounds after the first docking step were further filtered by docking onto full-length Aβ fiber model (pdb entry 2LMO) (Petkova et al., 2006). The models of representative BAFs docked onto Aβ fiber are compared to that of orange G. (A–C). A top view of the compounds (BAF1, BAF8 and orange G) docked onto Aβ fiber (in a light yellow color). (D–F). A side view of the same compounds docked onto Aβ fiber. (A and D). BAF1 (in a green color) binds to the side of Aβ fiber (in a light yellow color) with a predicted binding energy of −10 kcal/mol. (B and E). BAF8 (in a cyan color) binds to the side of Aβ with a predicted binding energy of −12 kcal/mol. (C and F). Orange G (in an orange color) binds to the side of Aβ fiber with a predicted binding energy of −9 kcal/mol. The charge interactions between the compounds and Lysine residues are highlighted by black lines.
Figure 1—figure supplement 3
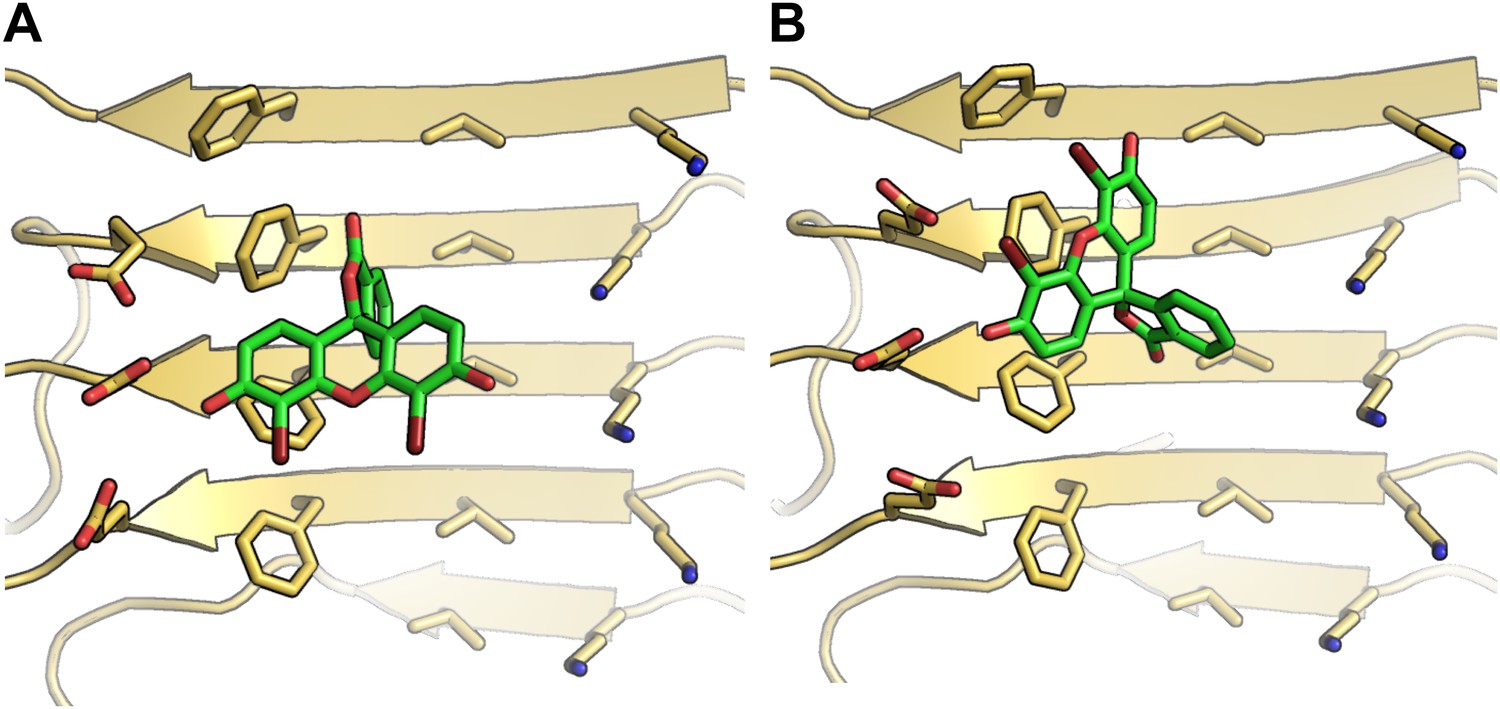
Alternative binding modes of BAF1 with the Aβ full-length fibers.
When identifying BAFs by two steps of computational docking (Figure 2A as well as step B and C in Figure 1), most models of the second docking step (docking to full-length Aβ fiber in step (C) retained their binding modes found in the previous docking step (docking to Aβ16–21 fiber in step (B). Interestingly, docking of BAF1 onto full-length Aβ fiber not only recapitulated the initial binding mode found in previous Aβ16–21 docking step but also revealed the different binding mode with comparable binding energies. Two examples of those alternative binding modes are shown in (A and B). In both modes, BAF1 tends to use its polar (hydroxyl) group to interact with the charged residues Glu22 of Aβ and use its non-polar (aromatic) portion to pack against the hydrophobic residues Phe20 of Aβ full fibers.
Figure 2 with 2 supplements
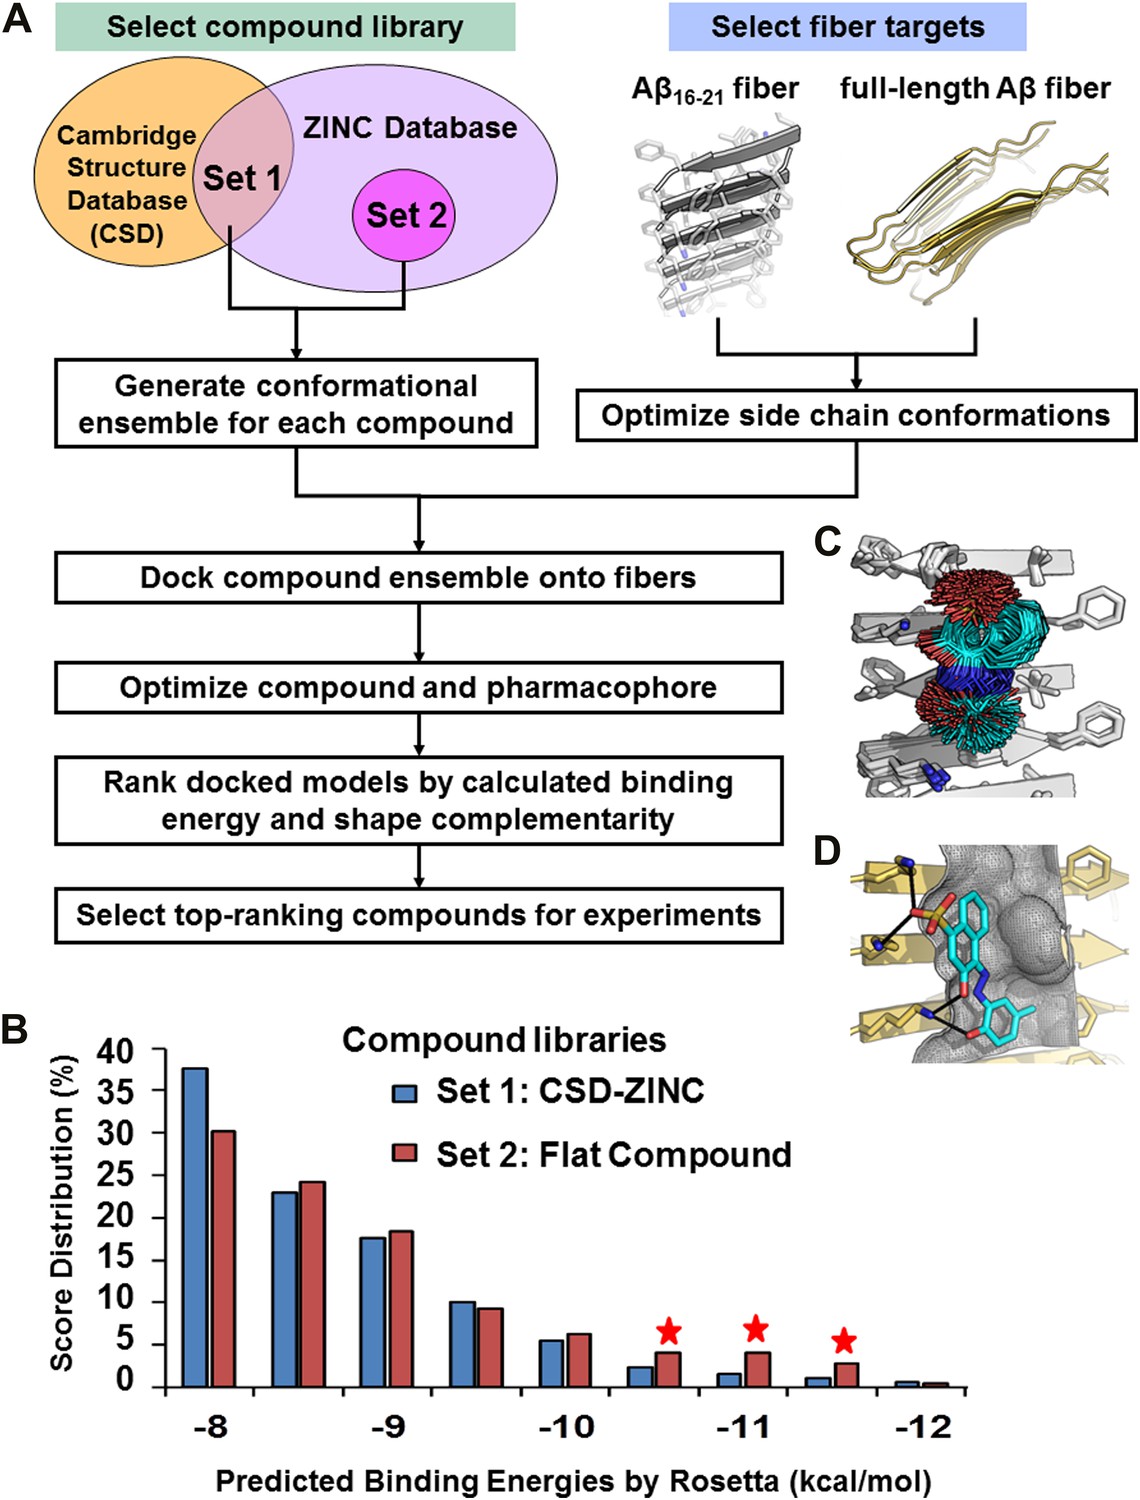
Computational screening for fiber-binding compounds.
(A). Outline of our procedure for structure-based screening. We prepare two sets of compounds (shown in the upper left) for screening against both types of fibers shown in the upper right. Compound Set 1 is the intersection of the ZINC Database of purchasable compounds with the Cambridge structural database (CSD) of known structures. Set 2 consists of other flat aromatic and multiple conjugated compounds found in the ZINC Database. The full description of each computational step is in ‘Materials and methods’. (B). Distribution of calculated binding energies for the compound libraries of Sets 1 and 2. Those top-ranking compounds have better predicted binding energy than orange G. Structural comparison of docked models of such compound BAF8 and orange-G is discussed in the Figure 2—figure supplement 1. Notice the starred bins which suggest that some members of Set 2, containing flat compounds, tend to be among the top scoring compounds, presumably having the tightest binding to the flat fiber surface. (C). The conformational ensemble of a compound representative shown docked onto the Aβ16–21 fiber structure. (D). A model of BAF8 docked onto an NMR-derived model of full-length Aβ fiber. Notice that the apolar ring structure of the compound binds to the relatively flat apolar (gray) surface of the fiber, and the polar moieties of the compound (red) form hydrogen bonds to the polar groups of the fiber (yellow). The stereo view of BAF8 model is shown in Figure 2—figure supplement 2.
Figure 2—figure supplement 1
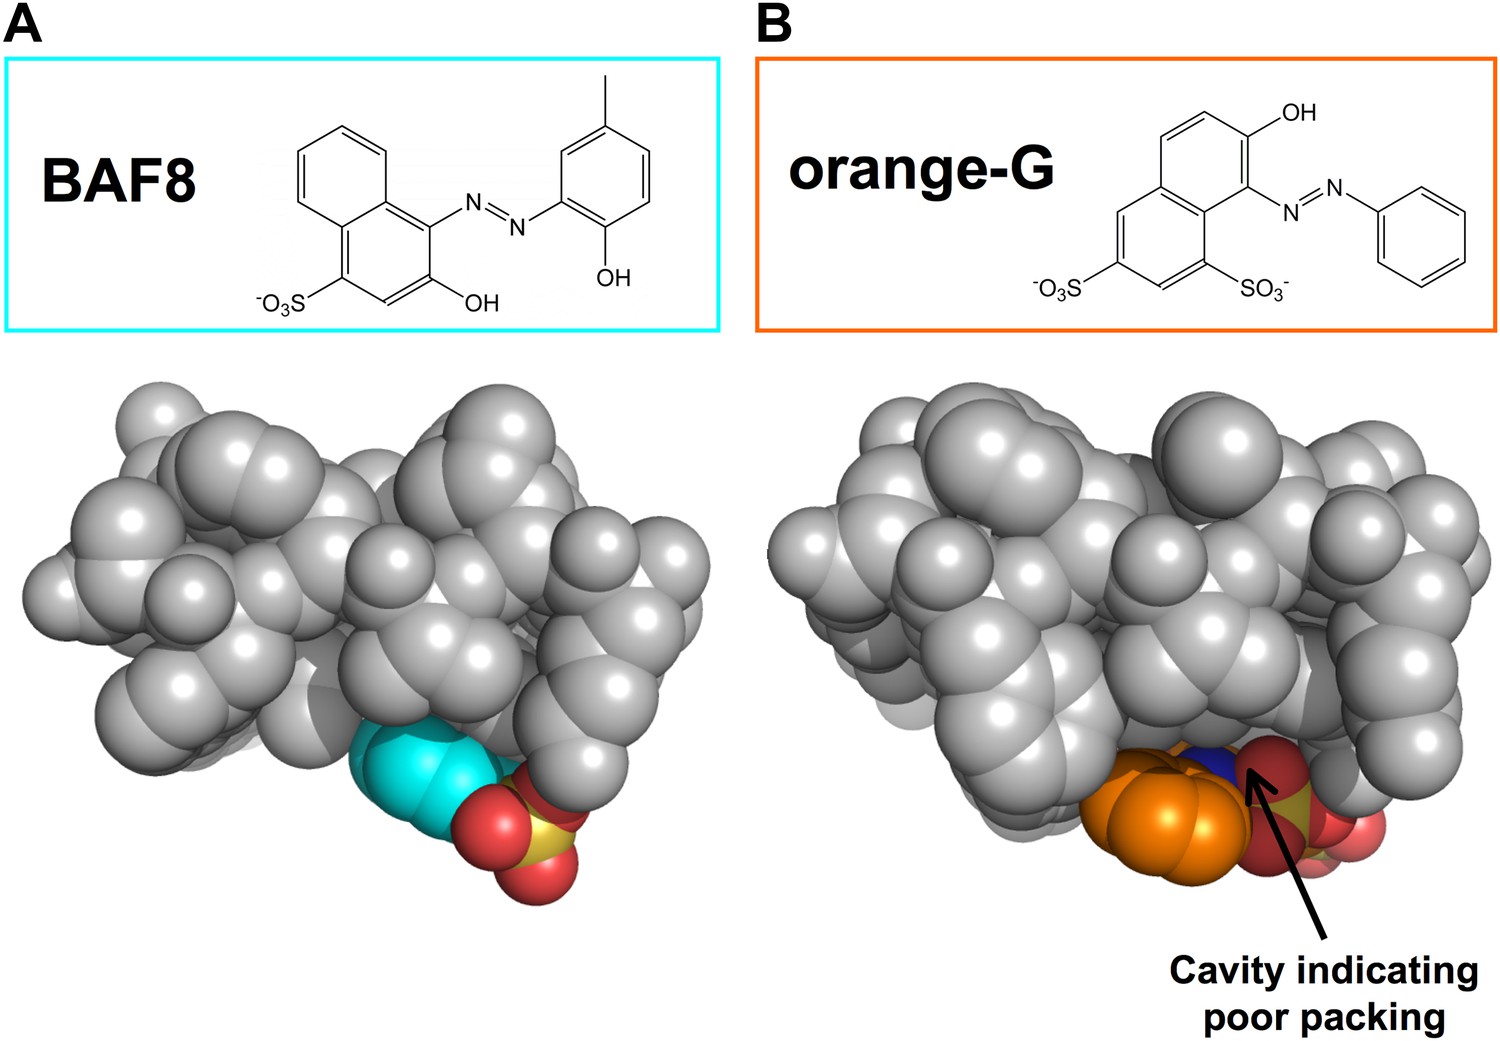
Structural comparison between docked models of BAF8 and orange G.
BAF8 has a chemical structure similar to orange G (top panels). The comparison of the shape complimentary at binding interfaces reveals that BAF8 binds more tightly to the side of fibers than orange G. (A). A top view of the docked model of BAF8 (in a cyan color) with the predicted binding energy of −12 kcal/mol highlights the tight shape complementary at the fiber-ligand interface. (B). A top view of the docked model of orange G (in an orange color) with the predicted binding energy of −8 kcal/mol shows a poorly packed interface with cavities.
Figure 2—figure supplement 2
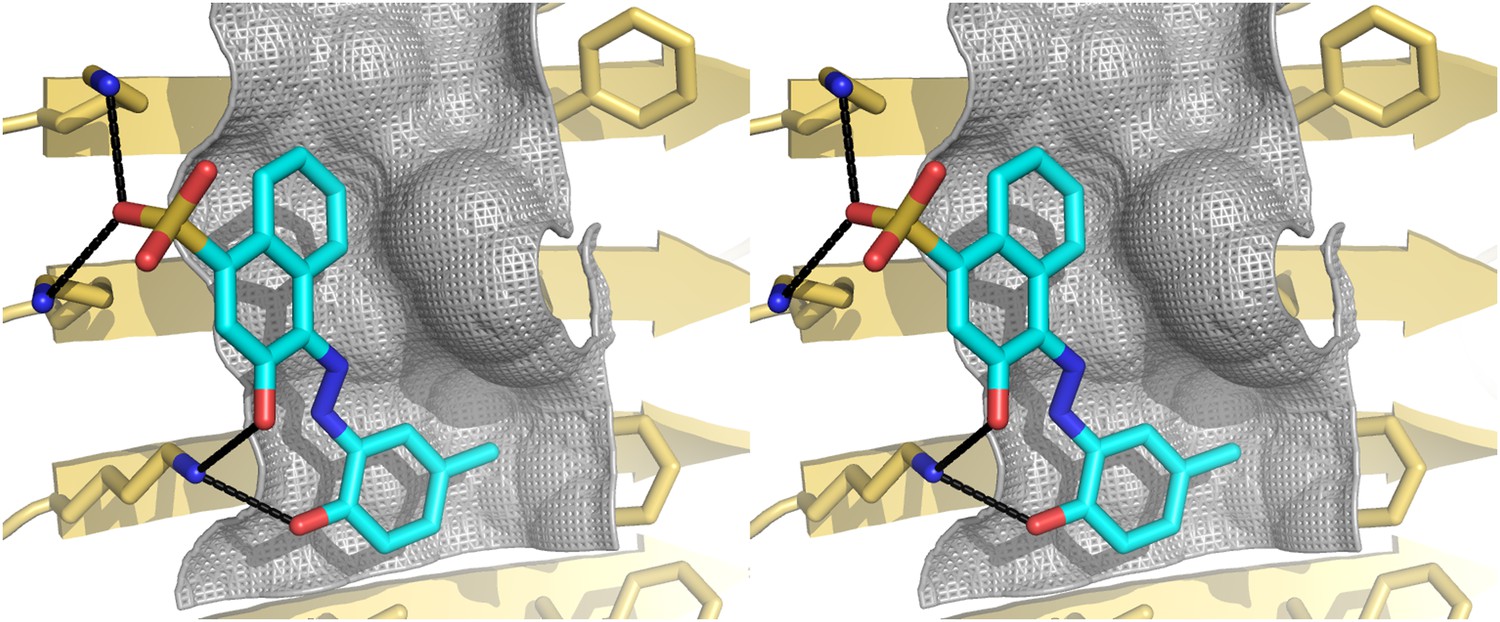
Stereo view of the structural model of BAF8 with Aβ fiber.
A wall-eyed stereo view of BAF8 (Figure 2D) (in cyan sticks) docked to the side of an Aβ16–21 fiber (light yellow) reveals good non-polar and polar interaction across binding interfaces. The hydrophobic binding site for the aromatic portion of BAF8 is indicated by grey mesh surfaces to highlight the good shape complementary. The polar interaction of hydrogen bonds between the charged residues Lys 16 of Aβ and the polar portion of BAF8 are indicated by black thick lines.
Figure 3 with 2 supplements
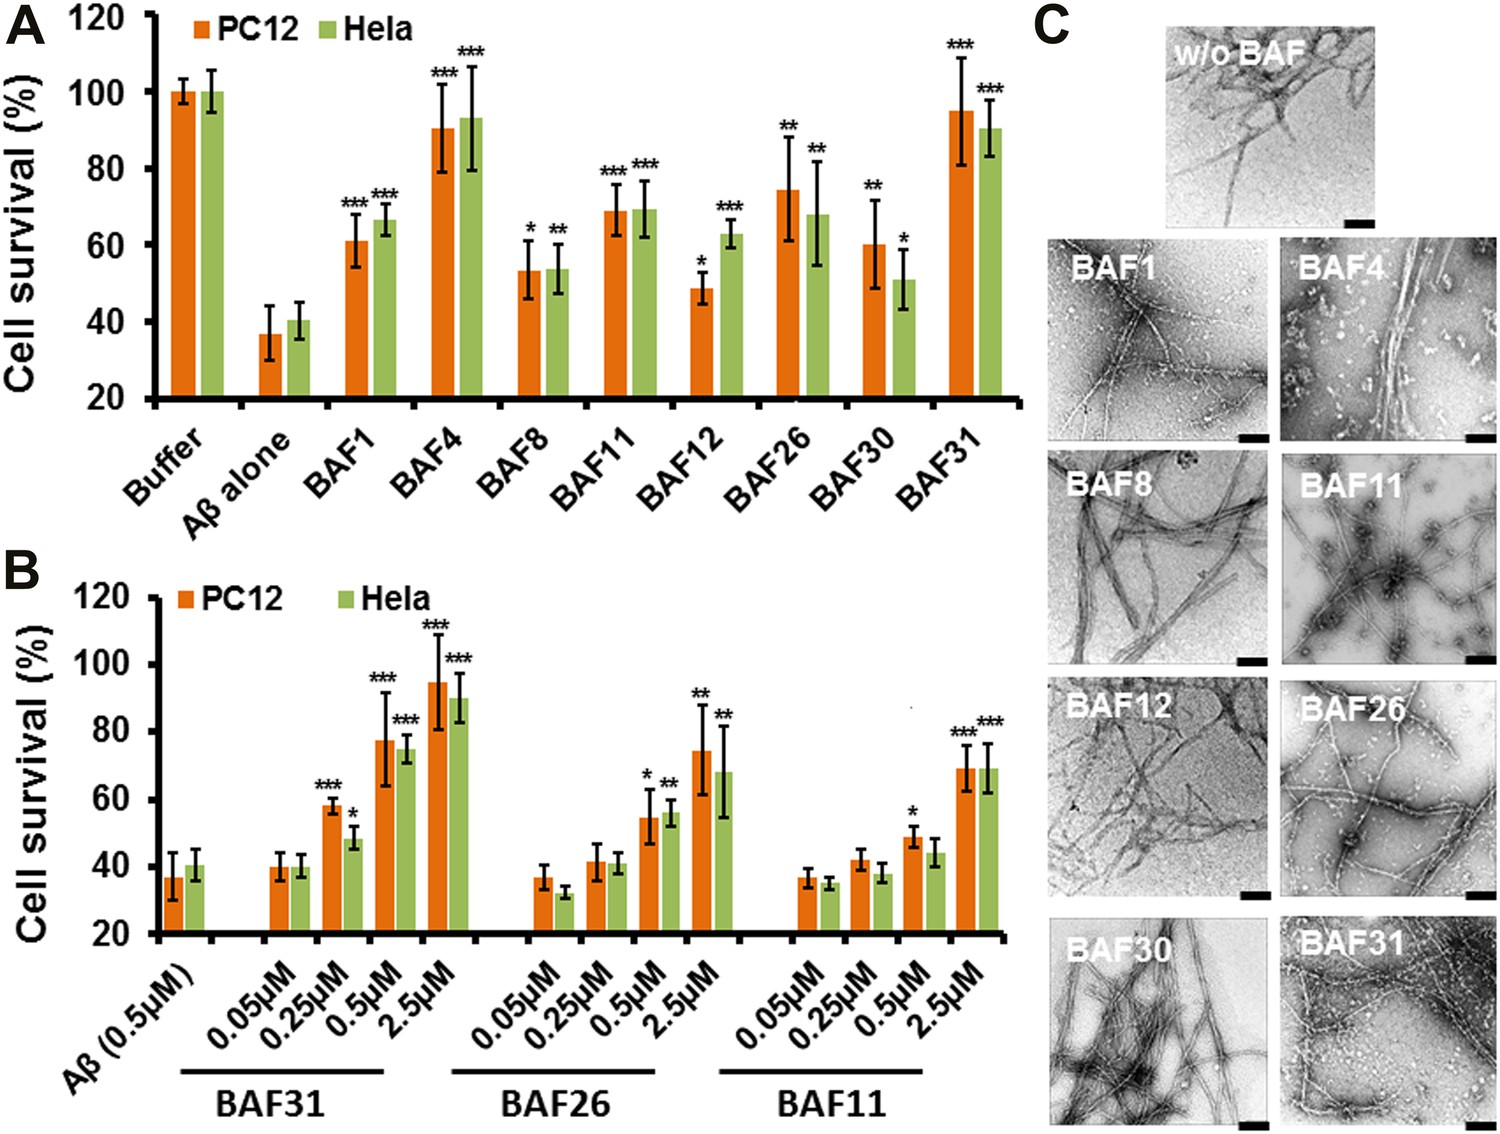
Experimental characterization of compounds that bind to amyloid fibers.
Our newly discovered BAFs diminish Aβ1–42 toxicity without significantly reducing Aβ1–42 fibrillation. (A). Eight BAFs reduce Aβ toxicity in mammalian cell lines (PC12 in orange; HeLa in green). These identified compounds with diversified chemical structures are quite different from orange G, whose co-crystal structure with an amyloid segment is the basis of our approach (Figure 4 and Table 2). For each compound, 2 to 4 repeats of each independent experiment were performed. For each experimental repeat, four replicates per sample per concentration were tested. The symbol * indicates a p<0.1; the symbol ** indicates a p<0.01 and the symbol *** indicates a p<0.001. The student’s t-test and p-value analysis are in Table 4. (B). The representative BAFs—31, 26, and 11—inhibit Aβ cyto-toxicity in a dose-dependent manner. (C). Transmission electron microscopy (TEM) images of Aβ fibers alone and Aβ fibers with the BAFs, the same samples prepared for cell viability assay. All 8 BAFs that diminish Aβ toxicity do not noticeably diminish Aβ fibrillation. Scale bars indicate 200 nm.
Figure 3—figure supplement 1
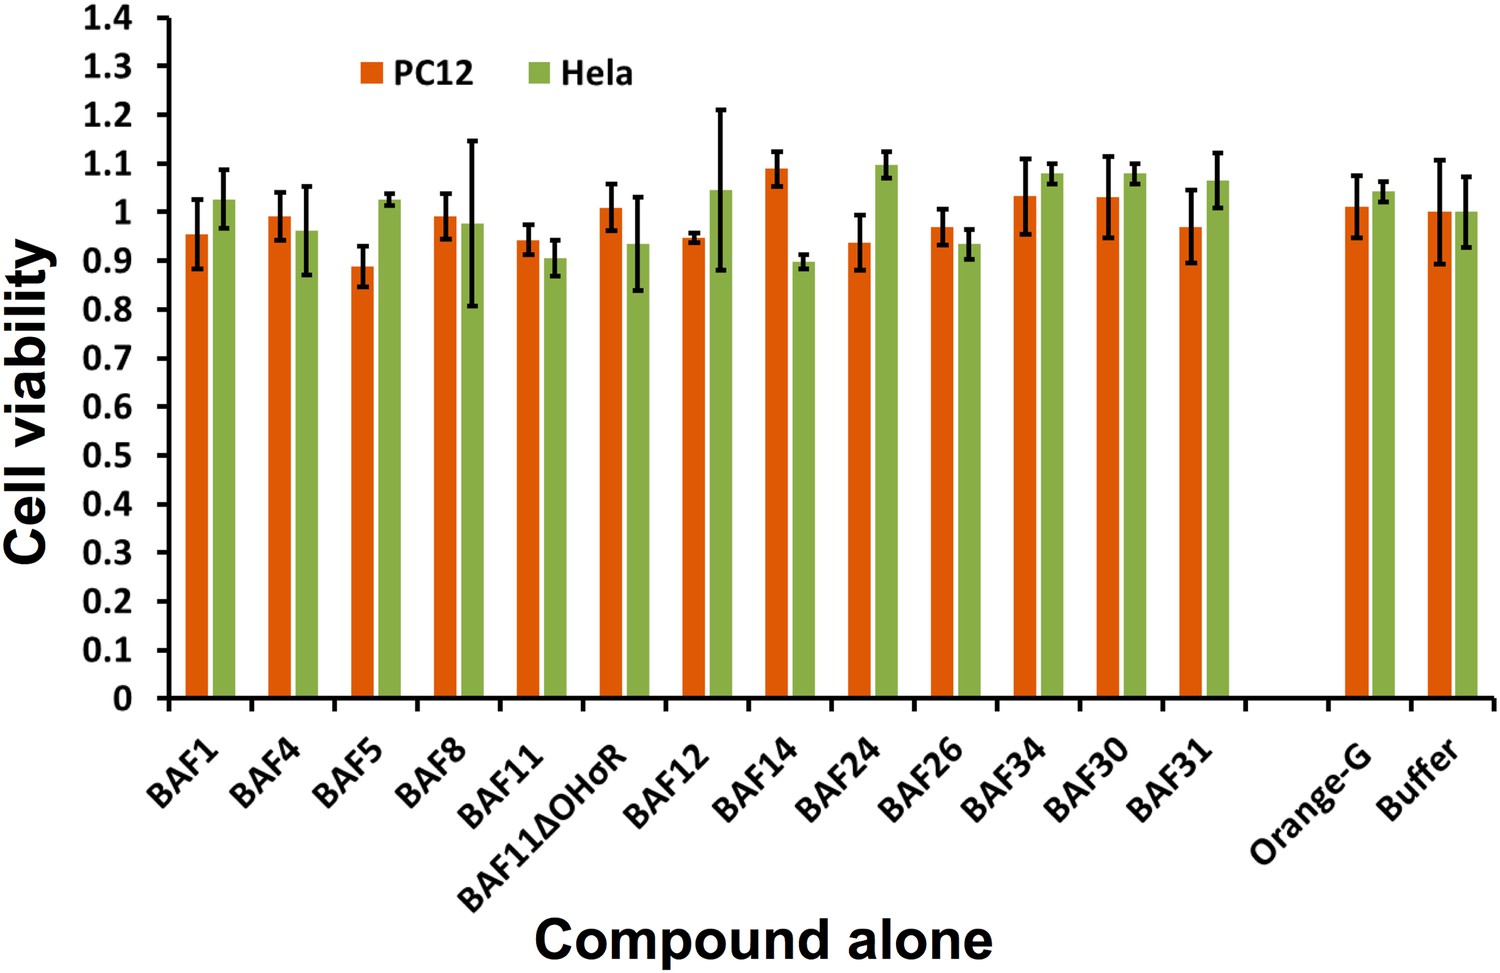
The BAFs alone exhibit little or no toxicity on mammalian cell lines.
Incubating cells with or without BAFs for 24 hours caused little or no change for cell viability of both PC12 and HeLa. The error bars are calculated from four experiment replicates.
Figure 3—figure supplement 2
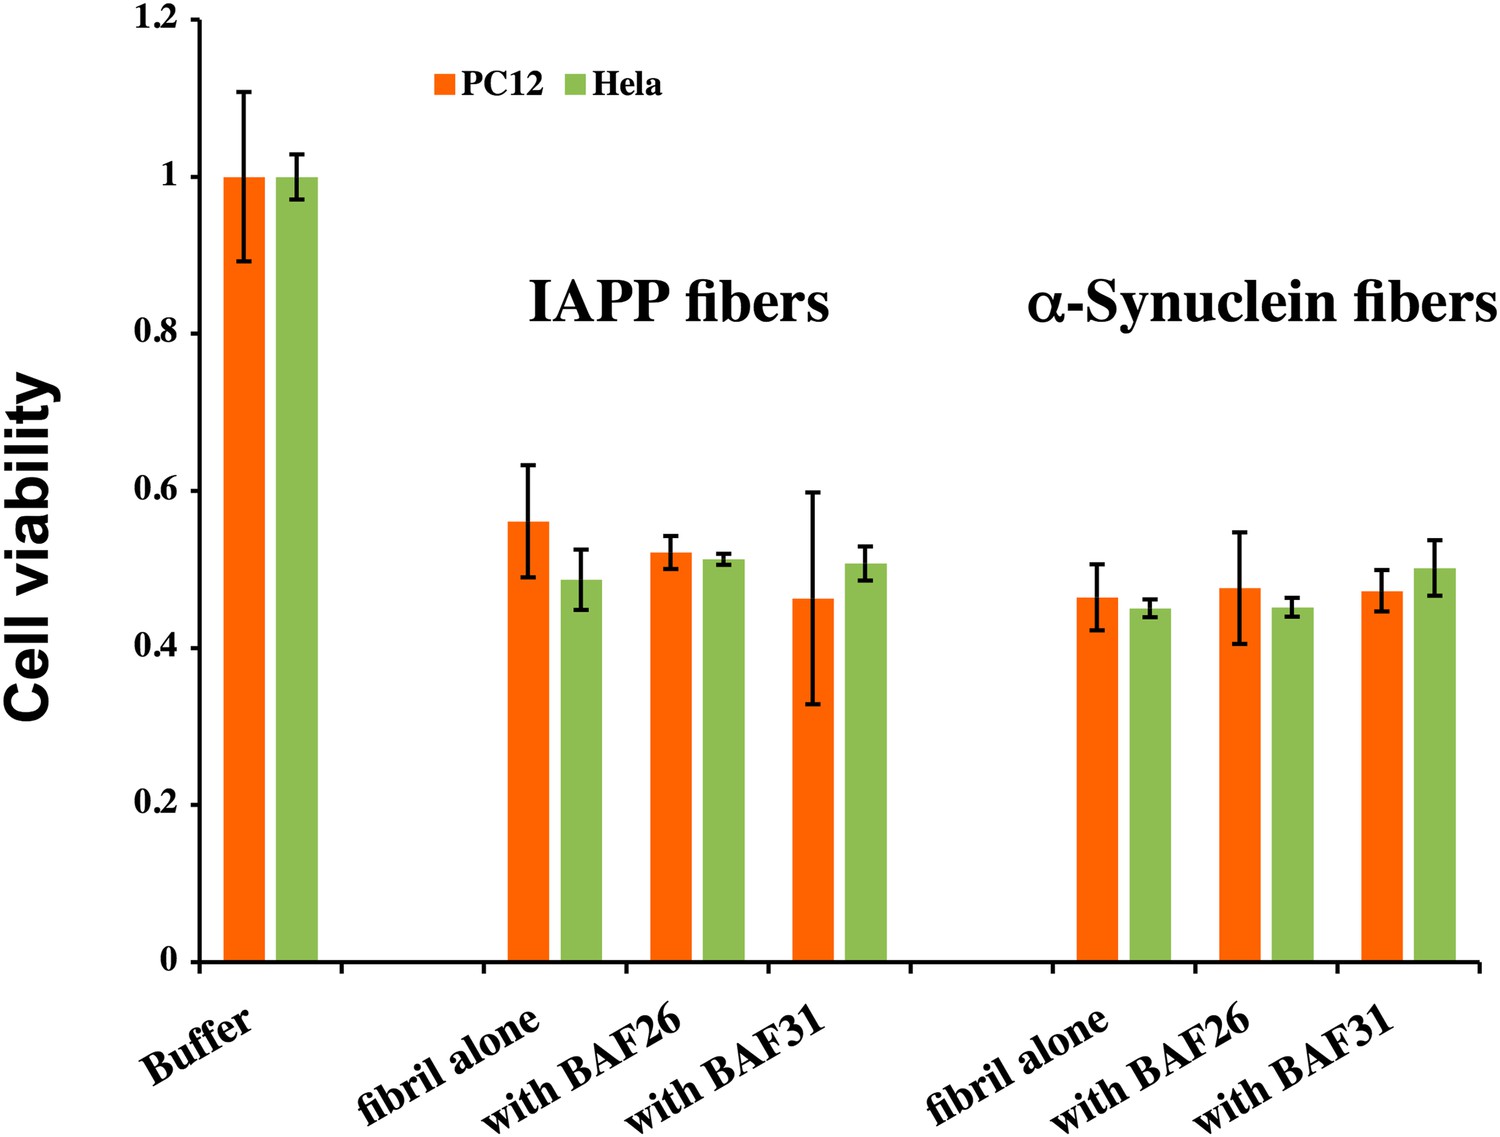
BAFs cannot reduce the cytotoxicity of amyloid fibers formed by IAPP and α-synuclein, as much as those fibers formed by Aβ.
The final concentration of IAPP is 1 µM and α-synuclein is 2 µM. The molar ratio of amyloid fibers and BAFs is 1:1. BAFs (26 and 31), which significantly reduces Aβ toxicity (Figure 3), cannot rescue the toxicity of IAPP and α-synuclein, suggesting that the toxicity alleviating effect of BAFs are specific to the fibers for which they were designed.
Figure 4

Diversified chemical structures of 8 active BAF compounds that reduce Aβ toxicity.
Orange G in an orange box is also displayed for comparison.
Figure 5 with 3 supplements
NMR evidence for binding of compounds to both Aβ16–21 and Aβ1–42 fibers.
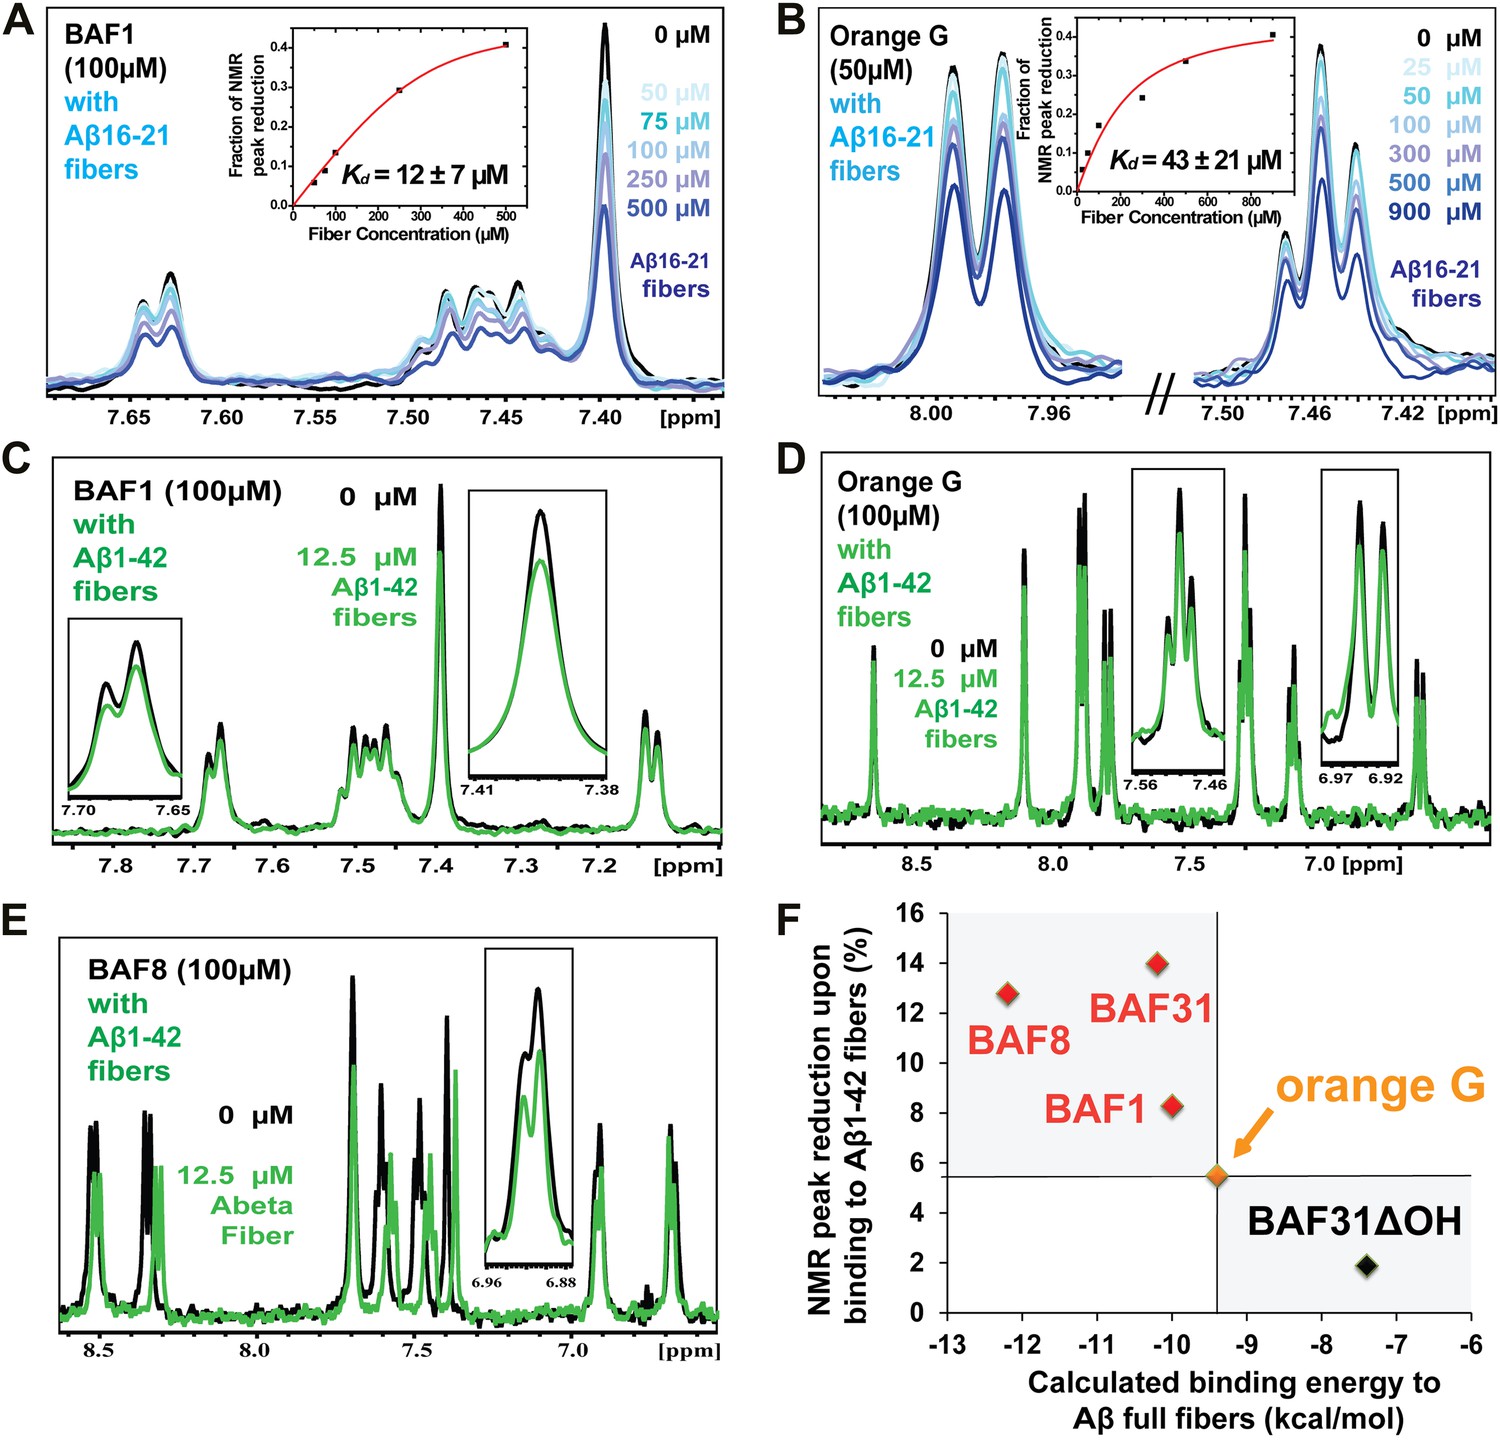
NMR binding experiments were performed on BAF compounds and the dye orange G. By monitoring the aromatic regions of the 1H NMR spectra of BAFs 1, 8, and 31, these compounds were shown to bind to both Aβ16–21 and Aβ1–42 fibers more tightly than does orange G. As shown in (A and B), BAF1 binds to Aβ16–21 fibers with affinity stronger than orange G. The determination of binding parameters for Aβ16–21 fibers is detailed in Table 5 and Figure 5—figure supplements 1 and 3. In panel (A), the 1H NMR spectrum of compound BAF1 (at 100 μM) is shown as a function of increasing concentration of Aβ16–21 fibers (0–500 μM, as monomer). The insert shows the area decrease of BAF1 NMR peaks as a function of Aβ16–21 concentration, and the red curve fitting the data defines an apparent Kd of 12 ± 7 µM. In panel (B), the NMR spectrum of orange G (50 μM) is plotted against increasing concentration of Aβ16–21 fibers (0–950 μM), giving an apparent Kd of 43 ± 21 µM. In (C, D and E), BAFs 1 and 8 both bind to Aβ1–42 fibers more strongly than orange G. Notice that the molar ratio of BAFs to Aβ1–42 fibers is comparable to that used in cell toxicity assays (Figure 3). (F). The calculated binding energies of BAFs—1, 8, and 31—to Aβ1–42 fibers are compared to the decreases in NMR peak of these compounds upon their binding to full-length Aβ fibers. These three BAFs have higher affinities and a larger NMR peak reduction than orange G while the ‘knock-out’ derivative with removal of key interactions (BAF31ΔOH) discussed below has a weaker calculated affinity and a smaller NMR peak reduction than orange G. We observe good correlation between computed energies and experimental data from NMR.
Figure 5—figure supplement 1
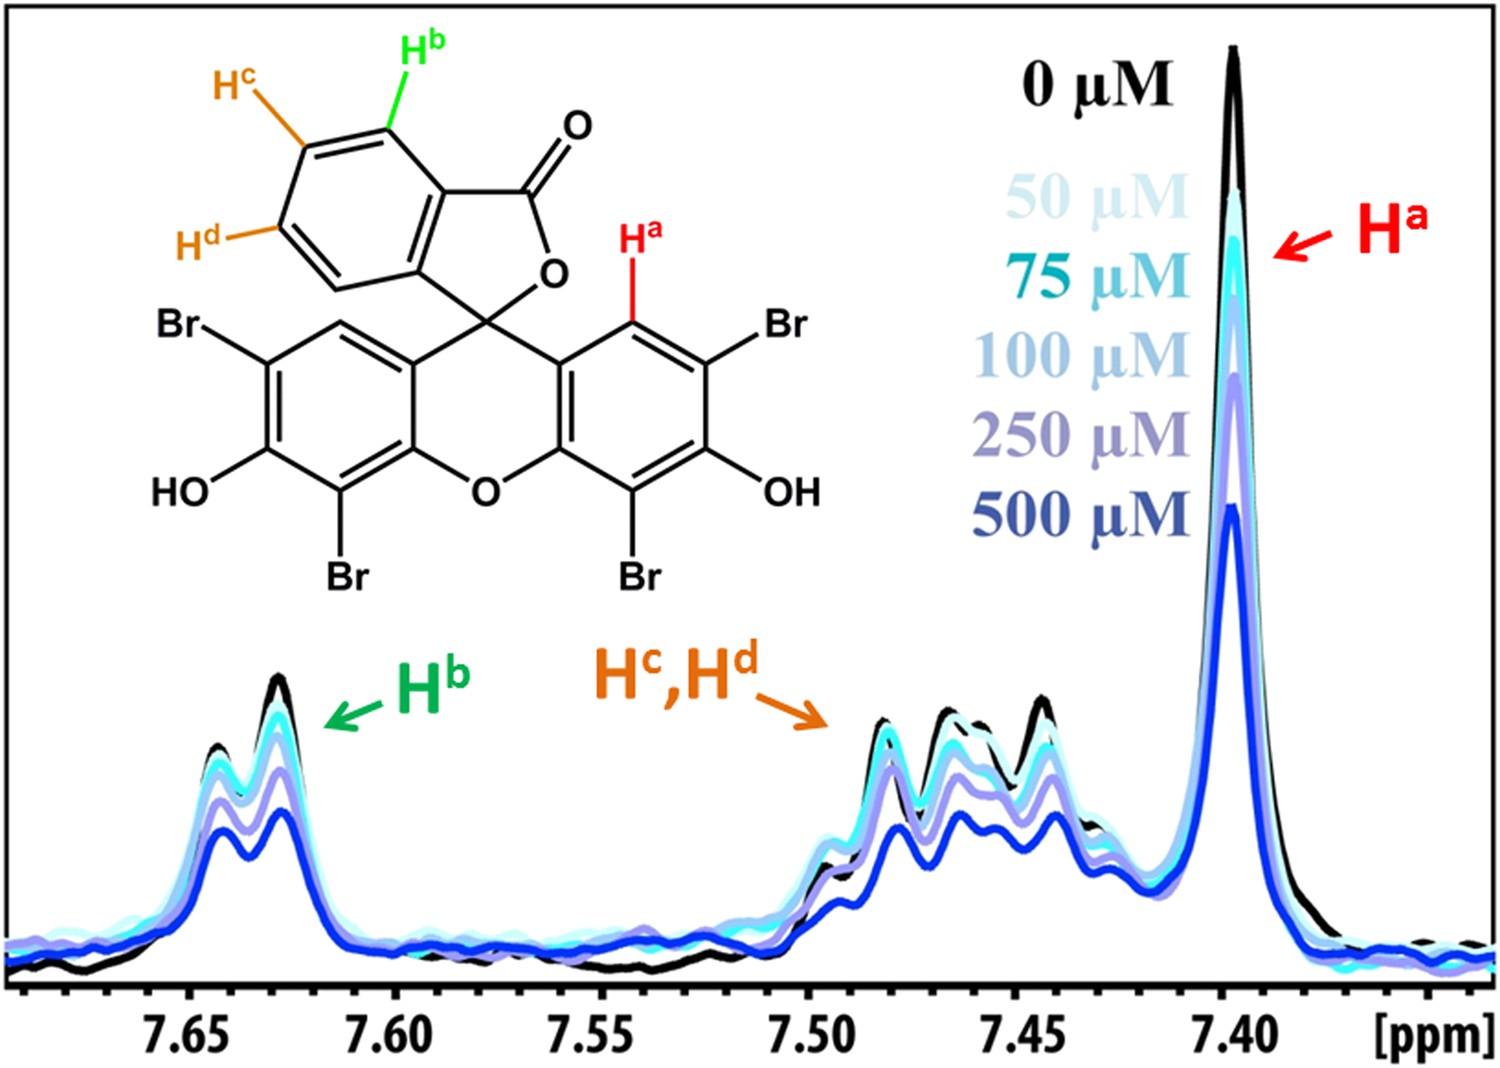
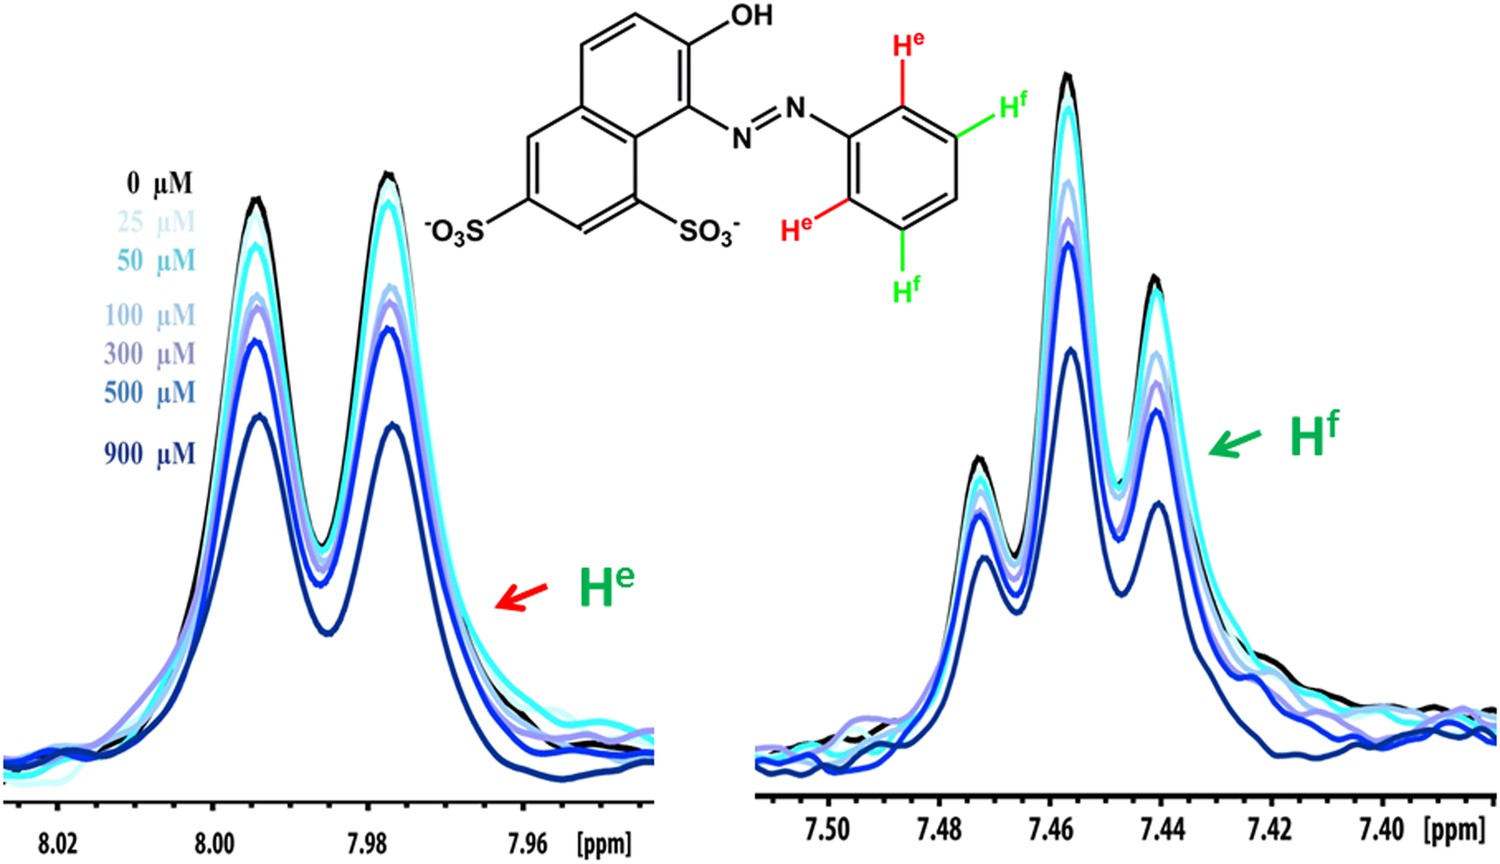
NMR peak assignment of BAF1 with Aβ16–21 fiber.
The 1D 1H NMR spectrum shows the aromatic proton regions of BAF1 upon the titration of Aβ16–21 fibers shown in Figure 5A. The insert is the chemical structure of BAF1 with the color-labeled aromatic proton observed in the NMR spectrum. The arrows with different colors indicate the proton assignment for NMR peaks.
Figure 5—figure supplement 2
NMR peak assignment of the control compound orange G with Aβ16–21 fiber.
The 1D 1H NMR spectrum shows the aromatic proton regions of orange G against the increasing concentrations of Aβ16–21 fibers shown in Figure 5B. The insert is the chemical structure of orange G with the highlighted label of the aromatic proton shown in the NMR spectrum. The arrows with different colors indicate the proton assignment for NMR peaks.
Figure 5—figure supplement 3
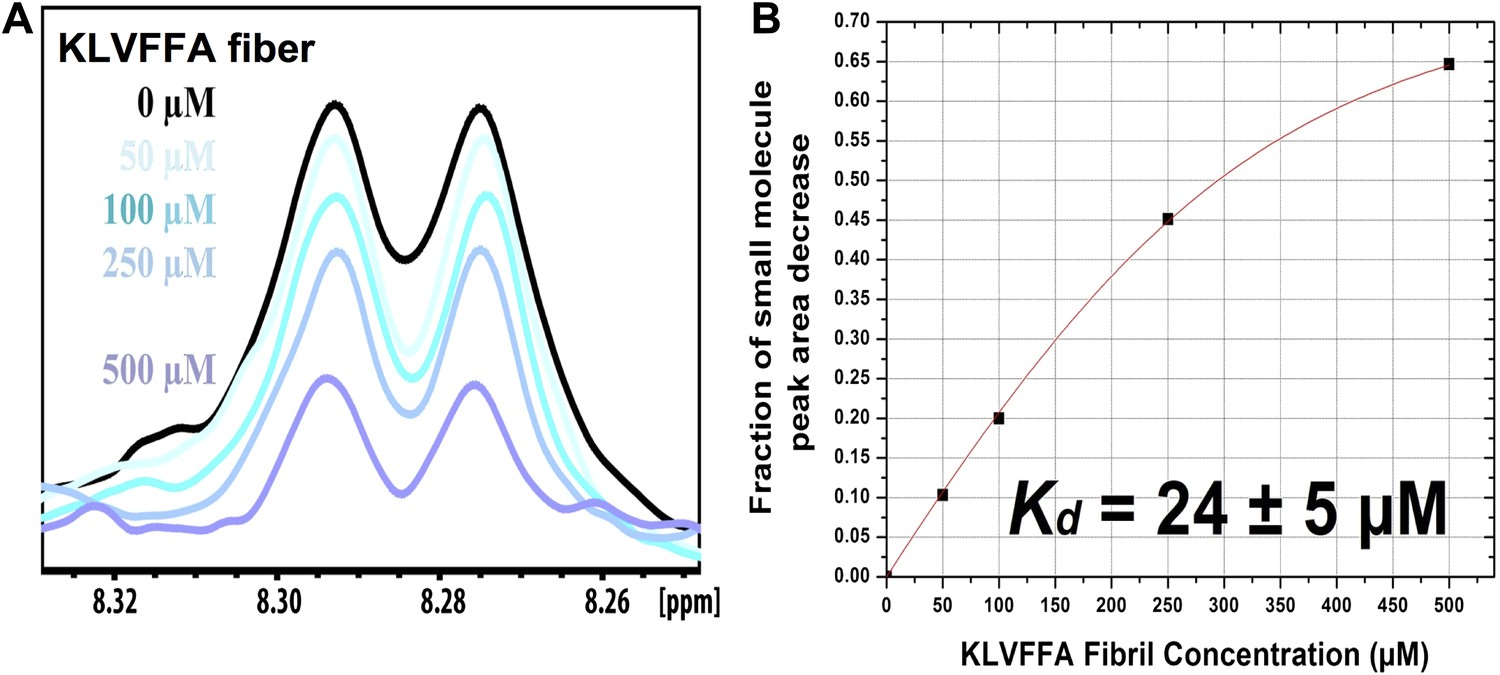
NMR titration of BAF8 with Aβ16–21 fibers.
To validate our computation methods, NMR titration experiments were performed. (A) One representative peak of aromatic protons of the 1D 1H NMR spectra of the compound BAF8 (at 100µM) upon Aβ16–21 fibers titration (0–500 µM, monomer equivalent). (B) Fitting curve upon the area decrease of BAF8 NMR peaks as a function of fiber concentration. The apparent Kd of BAF8 (24 ± 5 µM) is lower than that of orange-G (Figure 4B), indicating the tighter binding affinity of BAF8 to Aβ16–21 fibers.
Figure 6 with 1 supplement
Refinement of the Aβ pharmacorphore based on studies of BAF11.
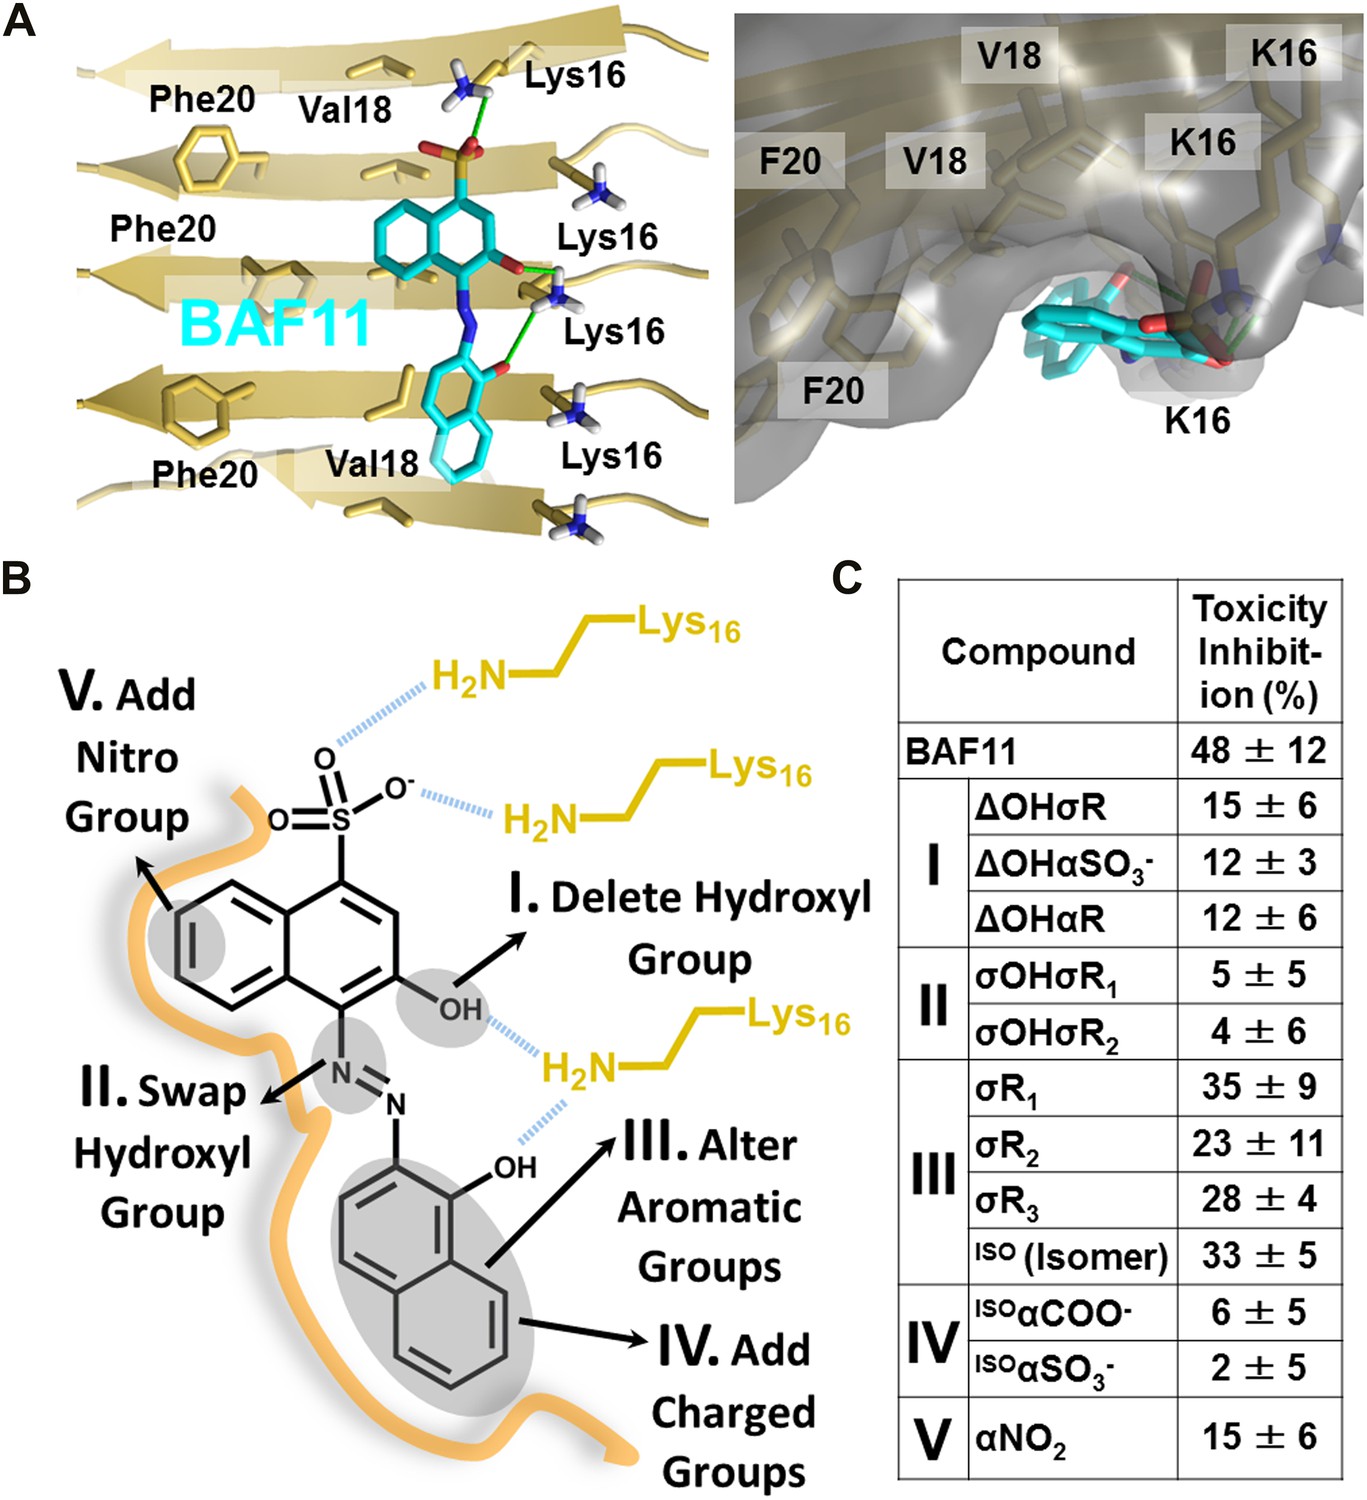
(A) Atomic model of BAF11 from the initial cycle docked on the full-length Aβ fiber, viewed in perpendicular to the fiber axis (left panel) and down the fiber axis (right panel). BAF11 is shown as a cyan stick model, whose polar groups form hydrogen bonds (green thick lines) to Lys16 of Aβ. The extensive non-polar interactions arise from the flat aromatic rings of BAF11 packing against the hydrophobic surface formed by Val18 and Phe20 of Aβ. (B) Schematic representation of the polar and nonpolar interactions of BAF11 and its derivatives modeled on the Aβ fiber (in orange and light brown). In the process of the Aβ pharmacophore refinement, five different classes (I–V) of BAF11 derivatives were introduced into the second cycle of screening, to expand the BAF set and to assess the specificity of the compounds identified in the initial cycle. The full description and chemical structure of each derivative are in Table 3 and Figure 5—figure supplement 1. (C) Comparison of the toxicity inhibition (defined in ‘Materials and methods’) among five types of BAF11 derivatives after 24 hr incubation with Aβ (0.5 µM). Notice that all changes to BAF11 which remove binding groups diminish its effectiveness as an inhibitor of toxicity.
Figure 6—figure supplement 1
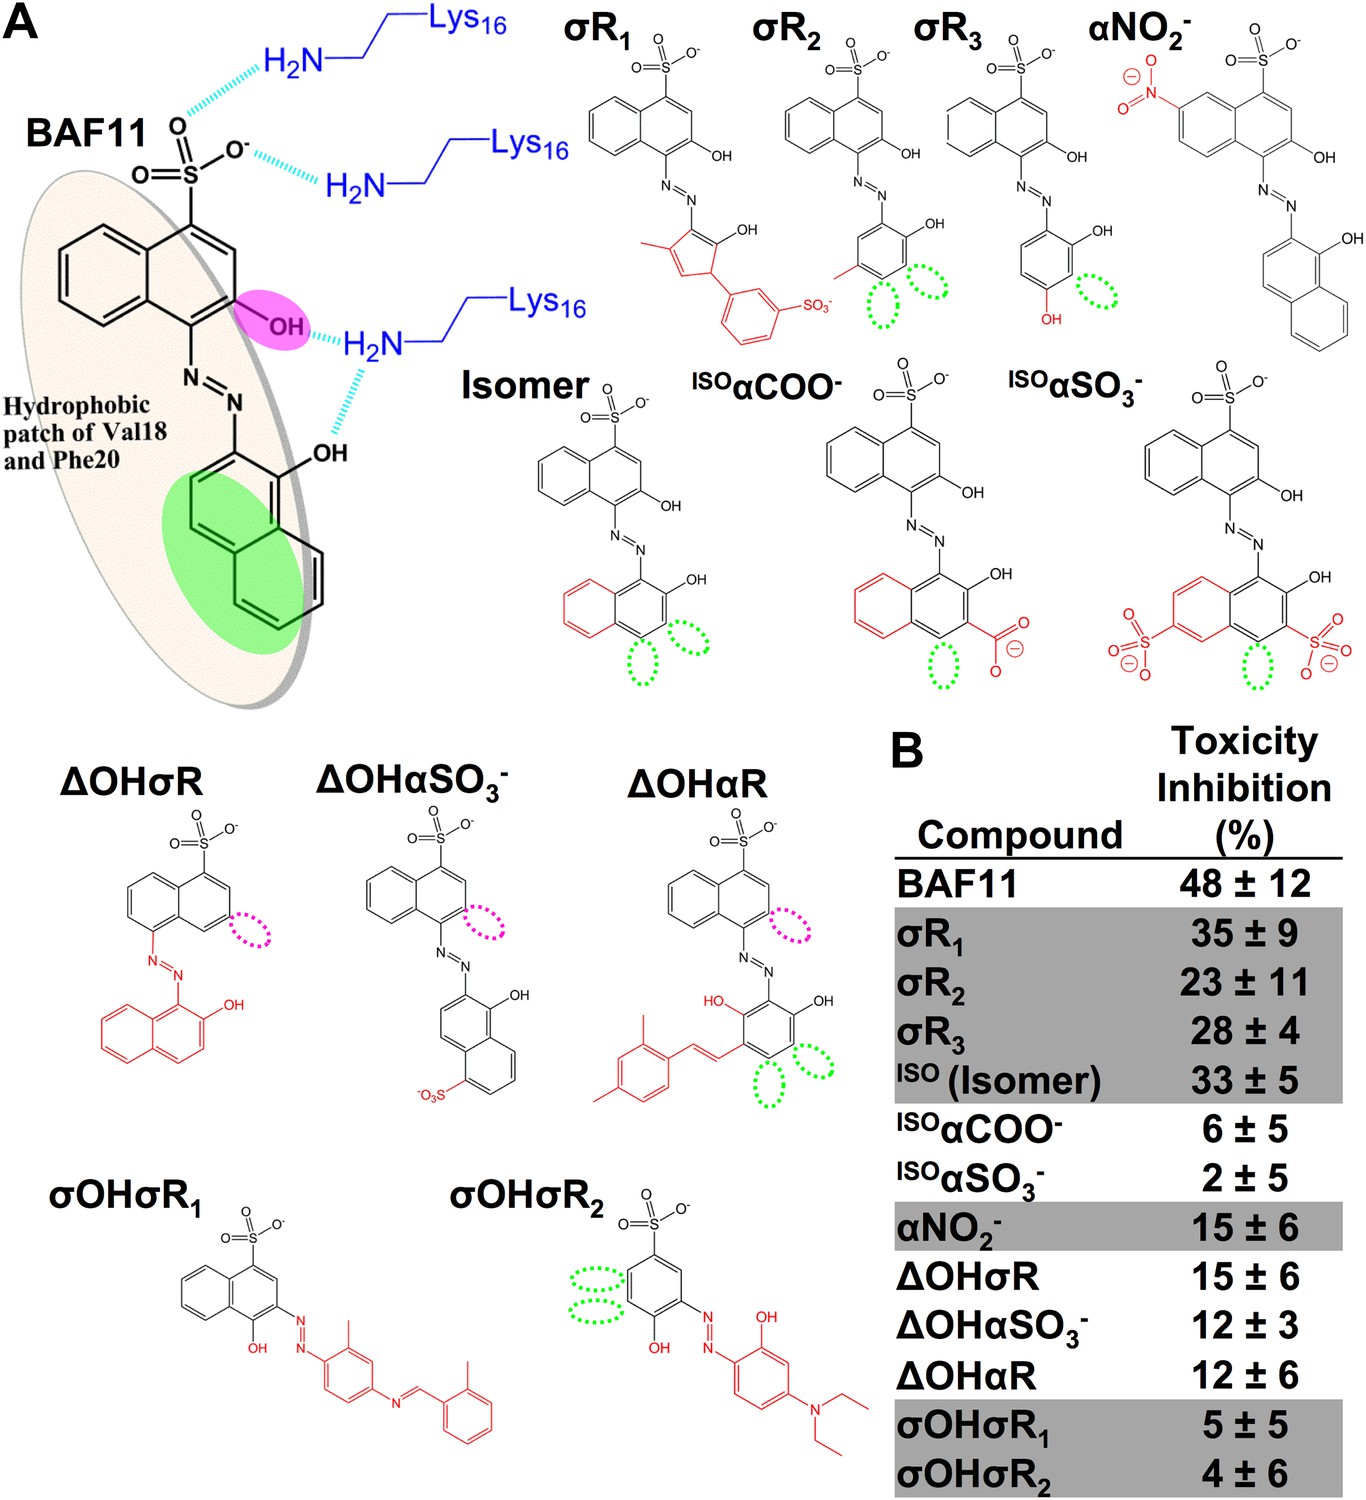
Chemical structures of the lead compound BAF11 and its derivatives.
12 derivatives of the lead compound BAF11 were included to expand the set during the refinement of amyloid pharmacophore (Figure 6C). (A) Chemical structures of BAF11 derivatives. A magenta open circle indicates the deletion of the important hydroxyl group. A green open circle indicates the missing of aromatic atoms in hydrophobic region of BAF11. The red color in chemical structures indicates the addition of atoms or groups to BAF11. The full description of each derivative is in Table 3. (B) Comparison of toxicity inhibition among BAF11 derivatives after 24 hour incubation with Aβ fibers.
Figure 7
New BAFs derived from the refined amyloid pharmacophore.
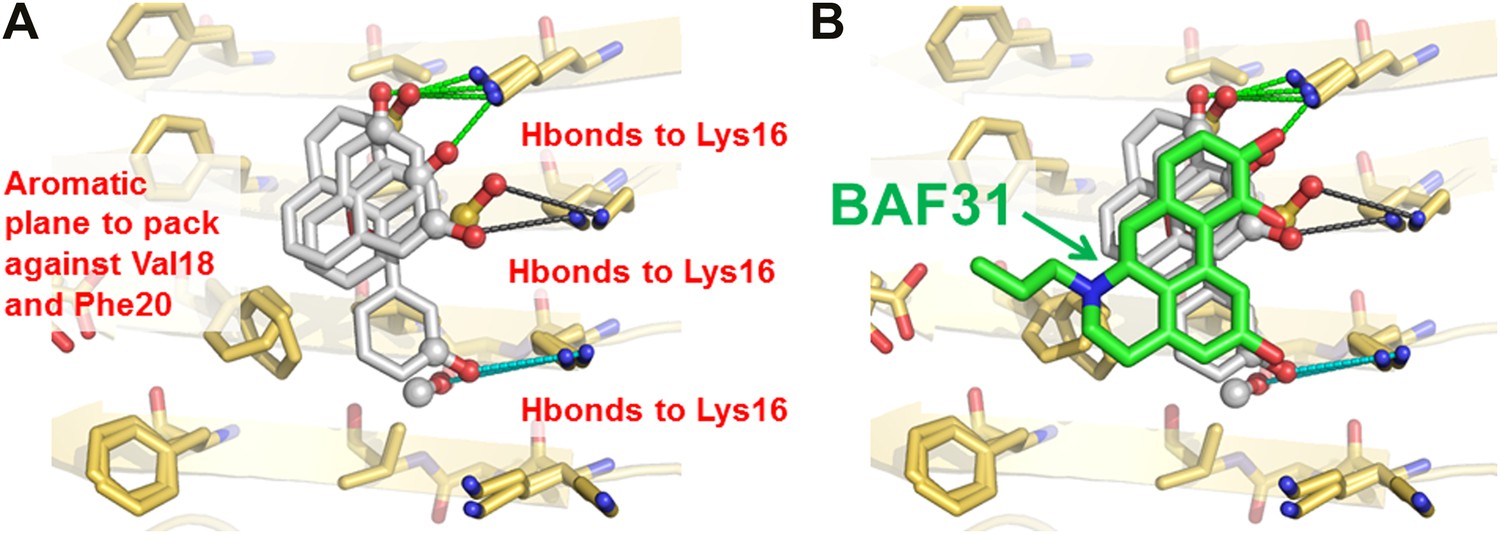
(A). Amyloid pharmacophore based on the structural overlay of active BAFs and derivatives. The overlay of the lead compounds from the initial round (BAF4, BAF8, and BAF11) elucidated the consensus of polar and nonpolar interactions at fiber binding interfaces, which sheds light on the amyloid pharmacophore. The amyloid pharmacophore was further refined by iterative approaches of computational docking and experimental testing. The derivatives of those lead compounds were tested to explore the essential role of those consensus interactions, and the differences of binding patterns and toxicity inhibition effects of the BAF derivatives can provide a guideline for the further refinement of amyloid pharmacophore. (B). New BAFs were ‘designed’ based on the refined pharmacophore. One successful example, BAF31 (green sticks) derived from the pharmacophore (grey sticks), showed the enhanced capability of inhibiting Aβ toxicity (Figure 8C). The success of developing enhanced binder from pre-defined pharmacophore highlights the important role of iterative docking/test approach in structure-based drug development.
Figure 8 with 1 supplement
Elimination of one key hydrogen bond from BAF31 causes both the loss of NMR binding to Aβ fibers and the decrease in inhibition of Aβ cyto-toxicity.
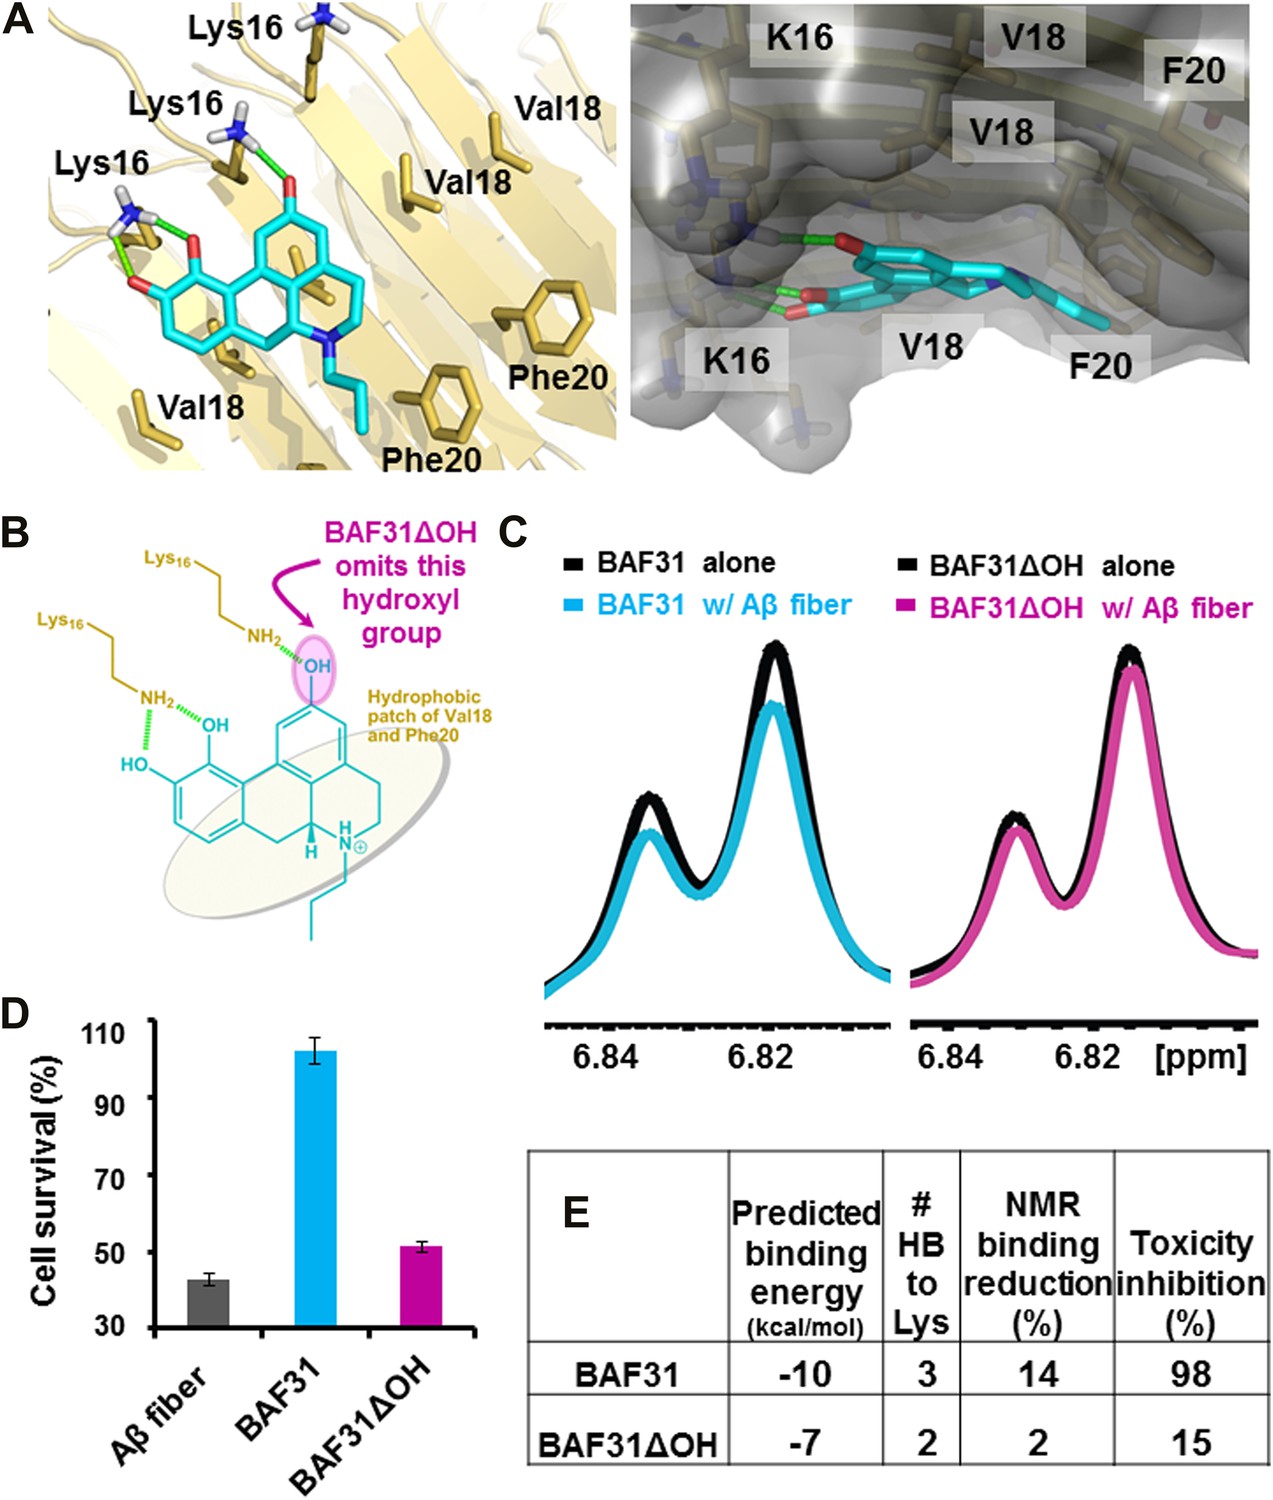
(A) Atomic model of the new inhibitor BAF31 (our most tightly binding BAF) derived from the refined pharmacophore (Figure 7, Figure 1F) in the second cycle, viewed perpendicular to the fiber axis on the left and down the fiber axis on the right. In panel (B), one important hydroxyl group forming hydrogen bonds to Lys16 residue of Aβ is highlighted by a magenta circle. (C) A representative NMR band (left panel) of mixture of Aβ fiber with the compound BAF31 compares with that (right panel) of Aβ fiber the derivative BAF31ΔOH which omits that important hydroxyl group. Their full NMR spectrums showing the same trend are shown in Figure 8—figure supplement 1. (D) Cell survival rates after 24 hr incubation with Aβ (0.5 µM), the molar ratio (1:5) of Aβ and the compound is comparable with the ratio in NMR binding experiment (C). (E) Notably, the elimination of one hydrogen bond from BAF31 (the derivative BAF31ΔOH) causes both the marked decrease in inhibition of Aβ toxicity to HeLa cells (D) and the loss of NMR binding to Aβ fibers (C).
Figure 8—figure supplement 1
NMR titration of BAF31 and its derivative with the Aβ1–42 fiber.
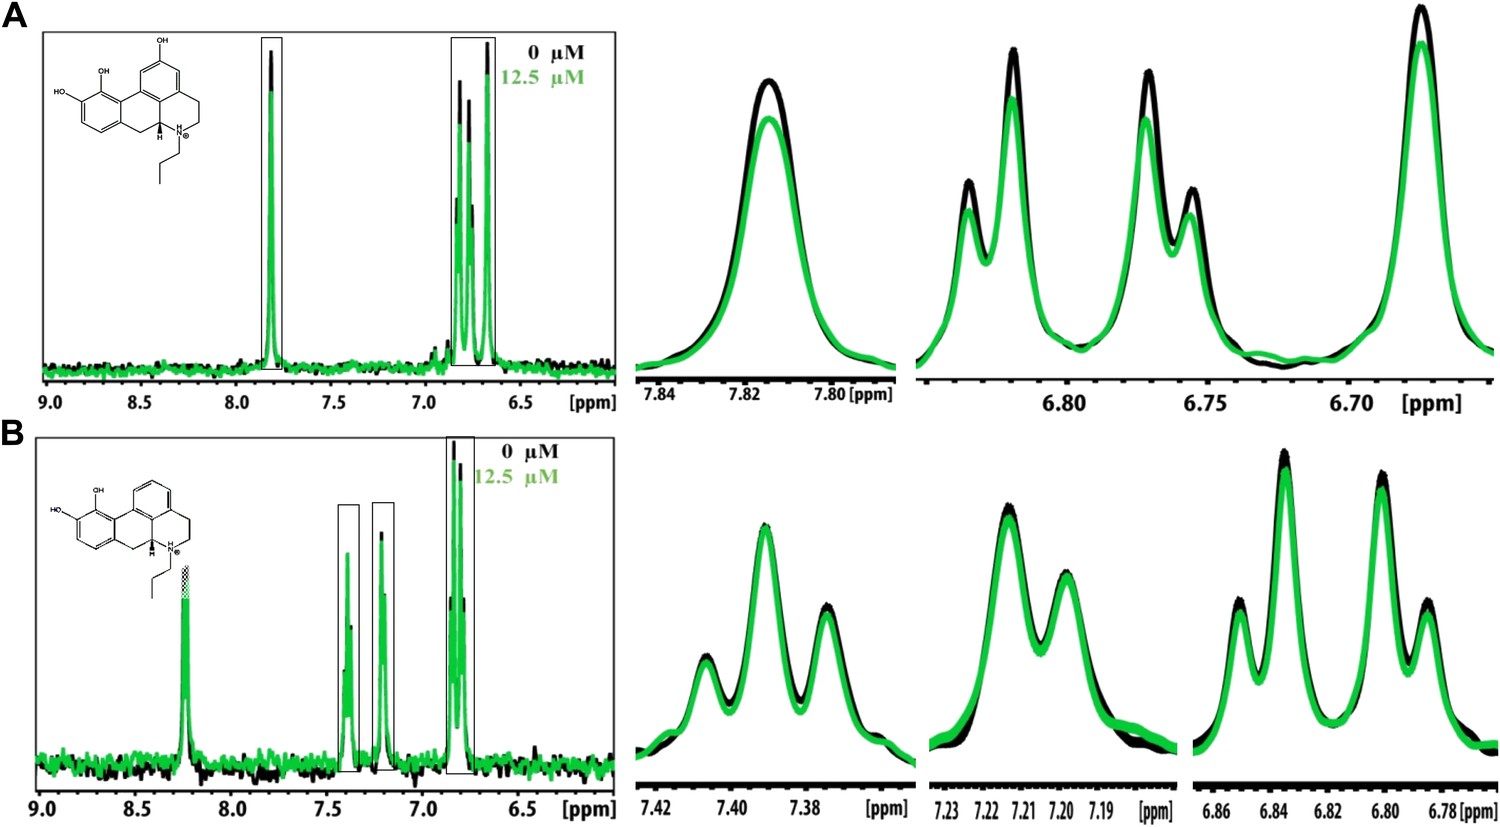
(A). 1D 1H NMR spectrum of BAF31 (100 µM) without (in black) and with Aβ1–42 fiber (12.5 µM monomer equivalent, in a green color). The magnified peaks are shown in the right panel to highlight the peak differences. (B). NMR spectrum of its derivative BAF31ΔOH (100 µM) when BAF31 is modified by the removal of a key hydroxyl group, without or with Aβ1–42 fiber (0 µM, 12.5 µM). The significant difference in NMR signal reduction between the BAF31 and BAF31ΔOH further validates the model of BAF31docked onto Aβ fibers.
Figure 9

Analysis of the lead compound BAF30 and its derivatives.
Structural models of BAF30 (green sticks) docked on Aβ fiber structure (in a light yellow color) are shown in (A and B). The important polar (black hydrogen bonds) interaction between BAF30 and single β-sheet of Aβ fiber, as well as shape complimentary between the aromatic rings of BAF30 and the hydrophobic patches of Aβ fiber are highlighted respectively. Schematic representation of the polar and nonpolar interactions of BAF30 with Aβ fiber is shown in panel (C). The magenta circles highlight two important hydroxyl groups which are absent in BAF30 derivatives. (D). The chemical structure of each derivative is listed. The dark blue open circles indicate the deletion of the important hydroxyl group. The red color in chemical structures indicates the addition of atoms or groups to BAF30. (E). HeLa cell survival rates in the presence of Aβ (0.5 µM monomer equivalent) and BAF30 or the derivatives are compared. The hydrogen bonds between BAF30 and Lys16 residues of Aβ fiber are important for binding of Aβ fiber and inhibition of Aβ toxicity. With additional groups at the opposite side of hydrogen binding sites, the derivative BAF30αR showed little change in toxicity inhibition. However, two BAF30 derivatives (σOHAαOH and σOHAΔOHBαCOO), which alter or delete the two important hydroxyl groups (magenta circles in panel C) of BAF30 that form hydrogen bonds to Lys16, showed a significant decrease in the toxicity inhibition. Furthermore, when BAF30 was modified by shifting both hydroxyl groups (A and B) to their neighboring positions, the derivative BAF30σOHABαCH3 almost lost the inhibition of Aβ toxicity. The rescuing percentage (%) is defined in ‘Materials and methods’.
Figure 10
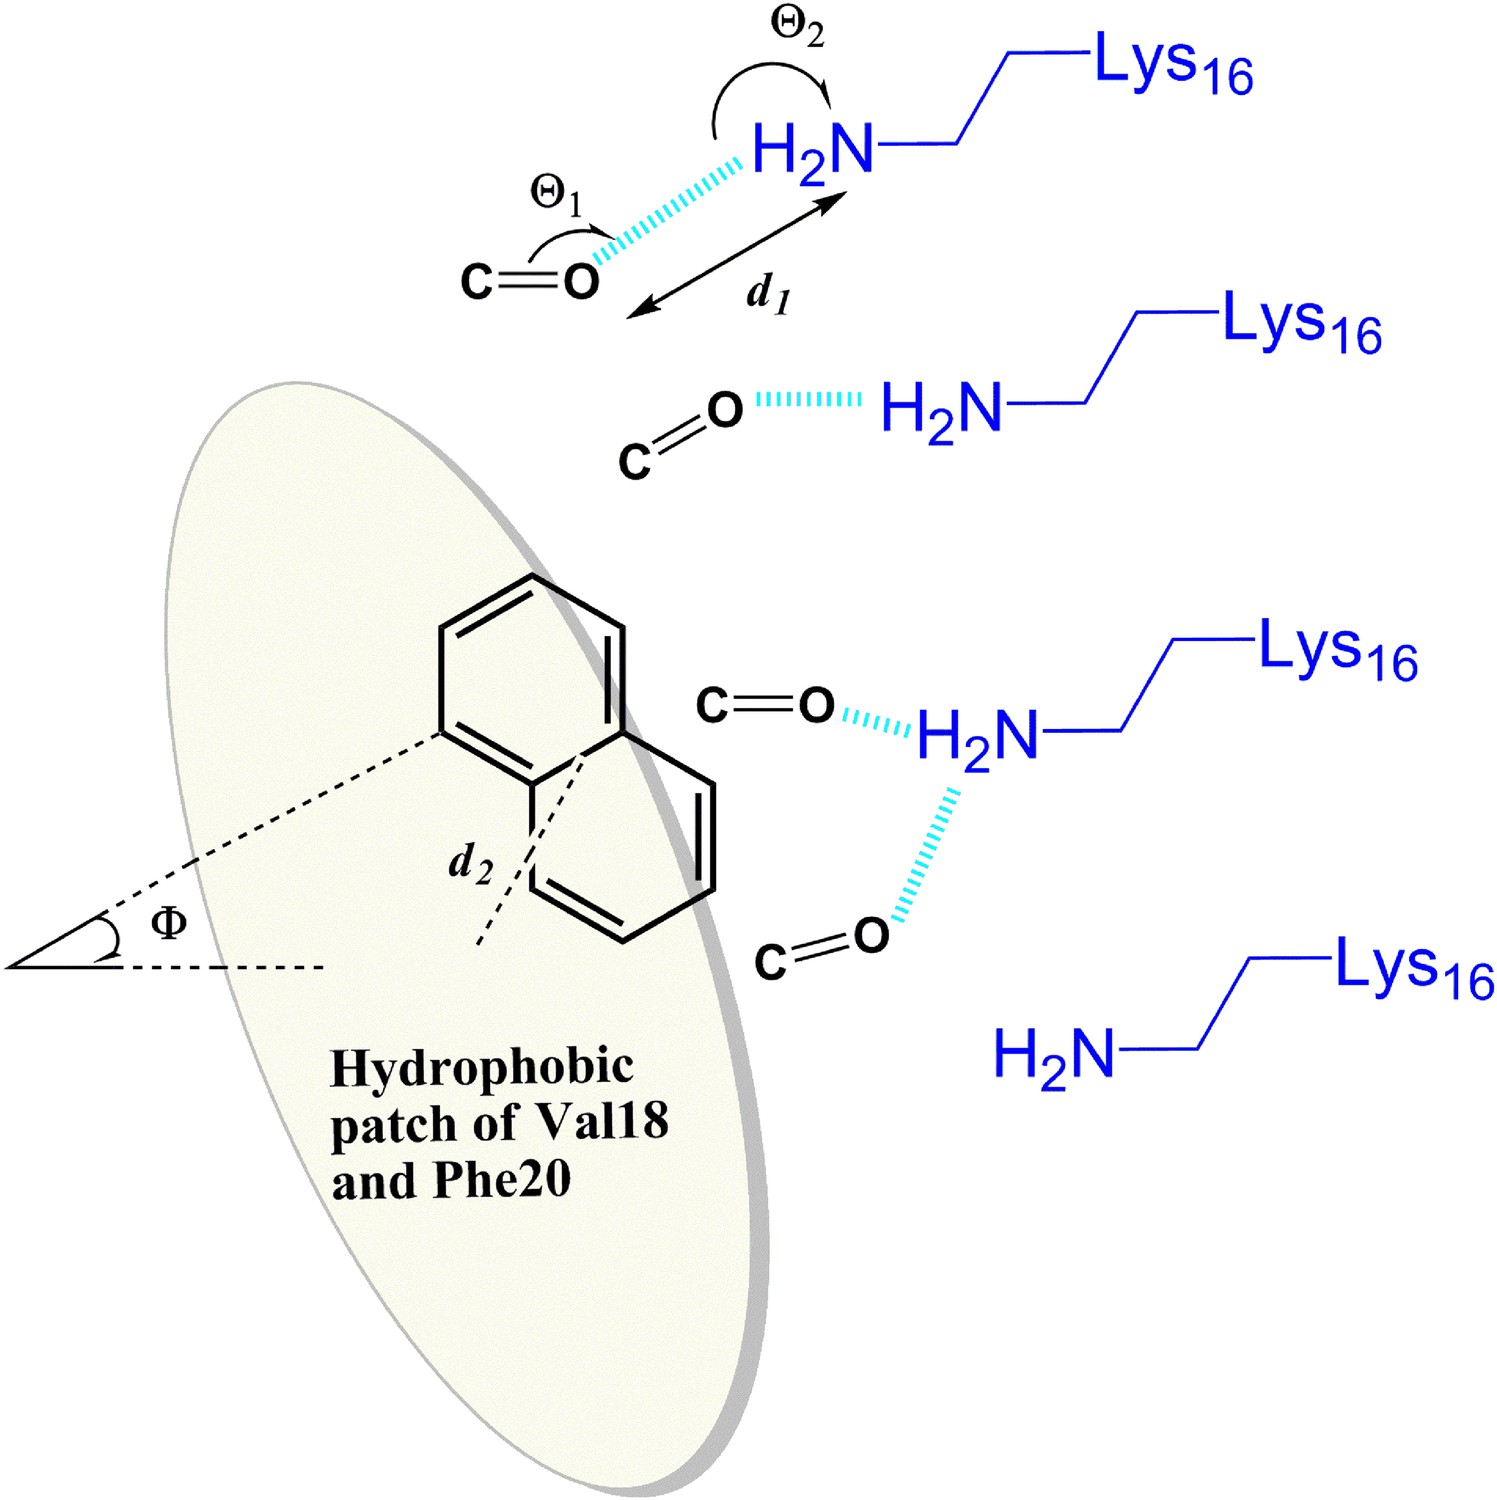
General rule of the essential interactions between BAFs and Aβ fiber can be derived from structure-based screening of Aβ toxicity inhibitor.
The carbonyl group is used to represent the H-bond acceptor (or negative charge) of BAFs, and the naphthalene ring is used to represent the planar aromatic portion of BAFs. Based on the rounds of computing search and experimental test, the detailed description about essential interactions and geometrical parameters are in ‘Materials and methods’.
Figure 11 with 1 supplement
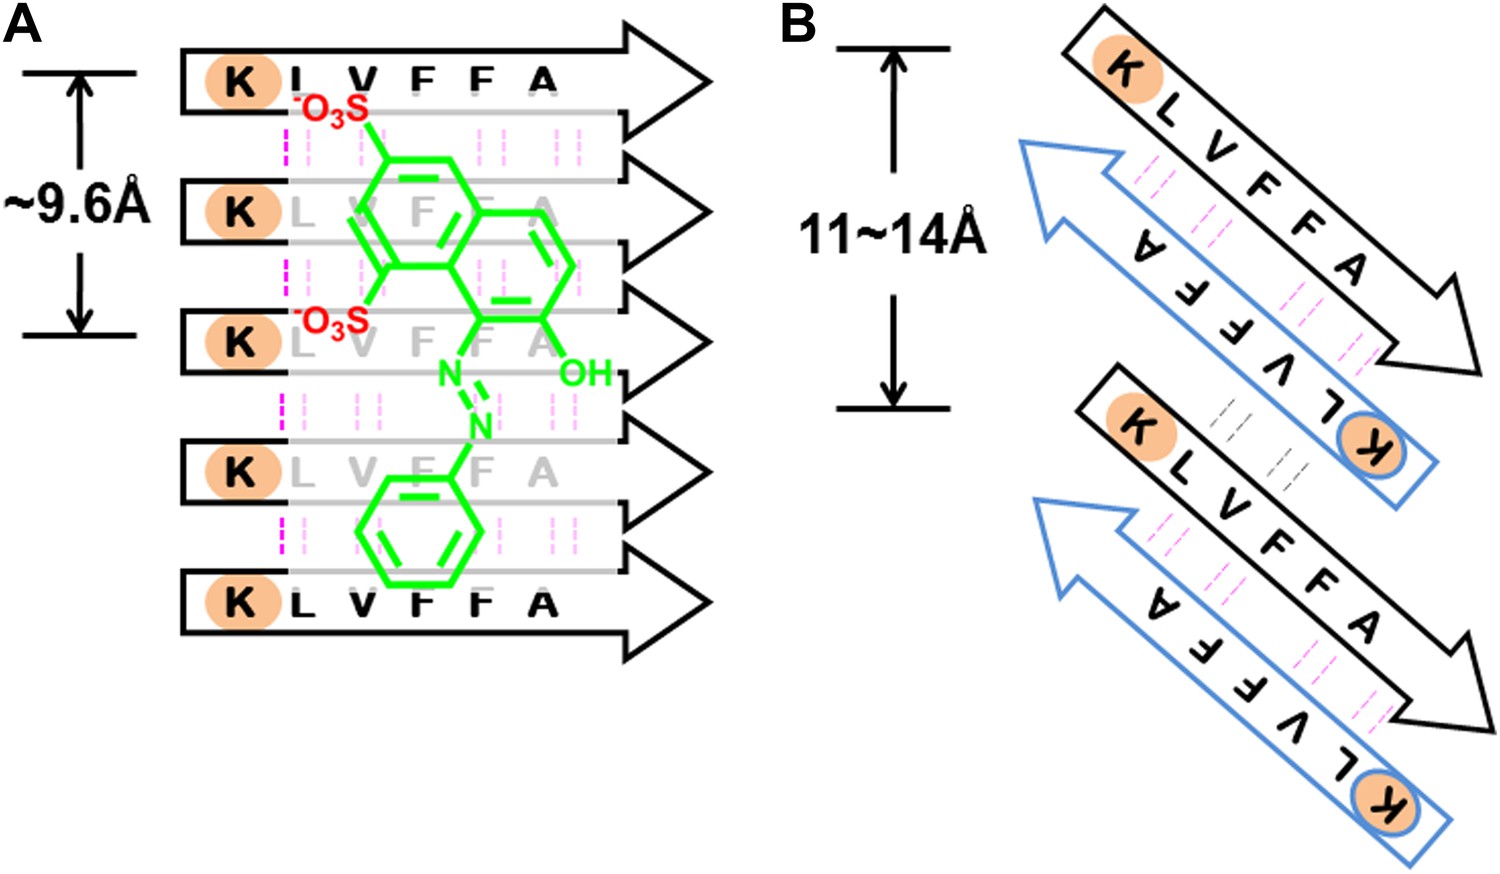
BAFs are designed to bind to in-register β-sheets, rather than out-of-register β-sheets.
As illustrated in (A), BAFs bind to in-register β-sheets. Our structure-based approach searches for BAFs based on in-register β-sheets in Aβ fibers. These BAFs are predicted to bind along the flat hydrophobic surfaces of the fibers and are anchored by polar sidechains of Lysine residues. The Cβ distances between the Lys residues interacting with the BAFs are ∼9.6 Å following the stacked arrangement of in-register β-sheets. Orange G, as well as screened BAFs, favorably interact with the in-register fiber and are compatible with the geometry of the Lys residues aligned in in-register β-sheets. As illustrated in (B), BAFs cannot bind to out-of-register β-sheets. The estimation of Cβ distance between the lysine residues, based on three out-of-register β-sheets structures previously determined (Laganowsky et al., 2012; Liu et al., 2012), ranges from 11 Å to 14 Å, quite different from the ∼9.6 Å measured in in-register β-sheet. We speculate that the BAFs are unable to bind to out-of-register β-sheets, and this difference accounts for the diminished toxicity that accompanies compound binding. Supporting this is our in vitro cell toxicity tests (Table 7 and Figure 11—figure supplement 1).
Figure 11—figure supplement 1
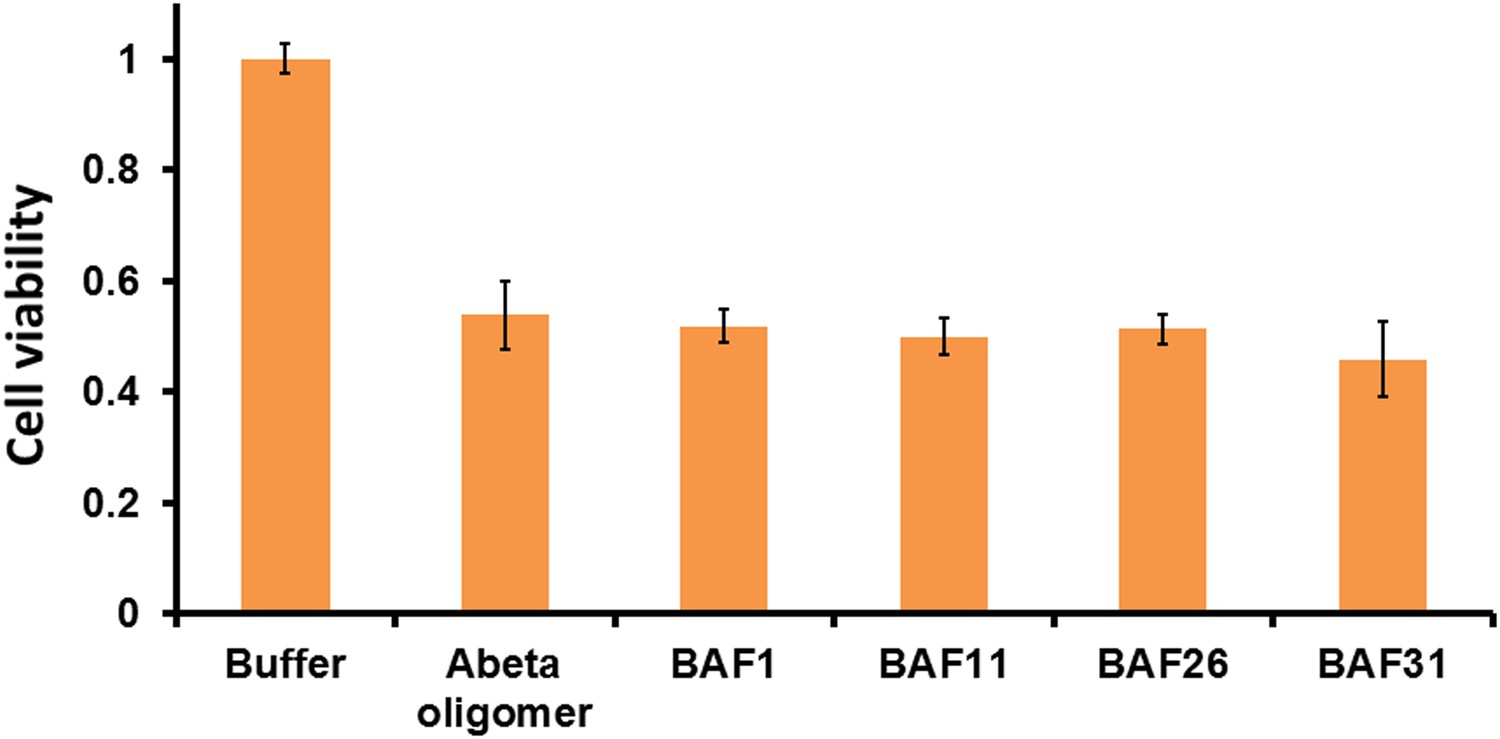
Active BAFs show no or little effects on the cyto-toxicity of pre-formed Aβ oligomers.
To assess if BAFs inhibit Aβ toxicity by directly interfering with toxic Aβ oligomers, four BAFs —1,11,26,31—, showing the inhibition to Aβ toxicity, were incubated with pre-formed Aβ oligomer and then tested by MTT cell viability assay using HeLa cell line. None of the BAFs significantly reduces toxicity of pre-formed Aβ oligomer. Aβ oligomer was prepared by incubating purified Aβ1–42 in PBS for 4 hr at 37°C at the concentration of 5 µM without agitation. Pre-formed Aβ oligomer was mixed with four different BAFs (Aβ1–42/BAFs = 1:1 molar ratio) and further incubated for 15 min to allow potential binding of BAFs to pre-formed oligomer. The final concentration of Aβ oligomer as monomer is 0.5 µM, the same as what we test Aβ toxicity in MTT cell viability assay.
Figure 12
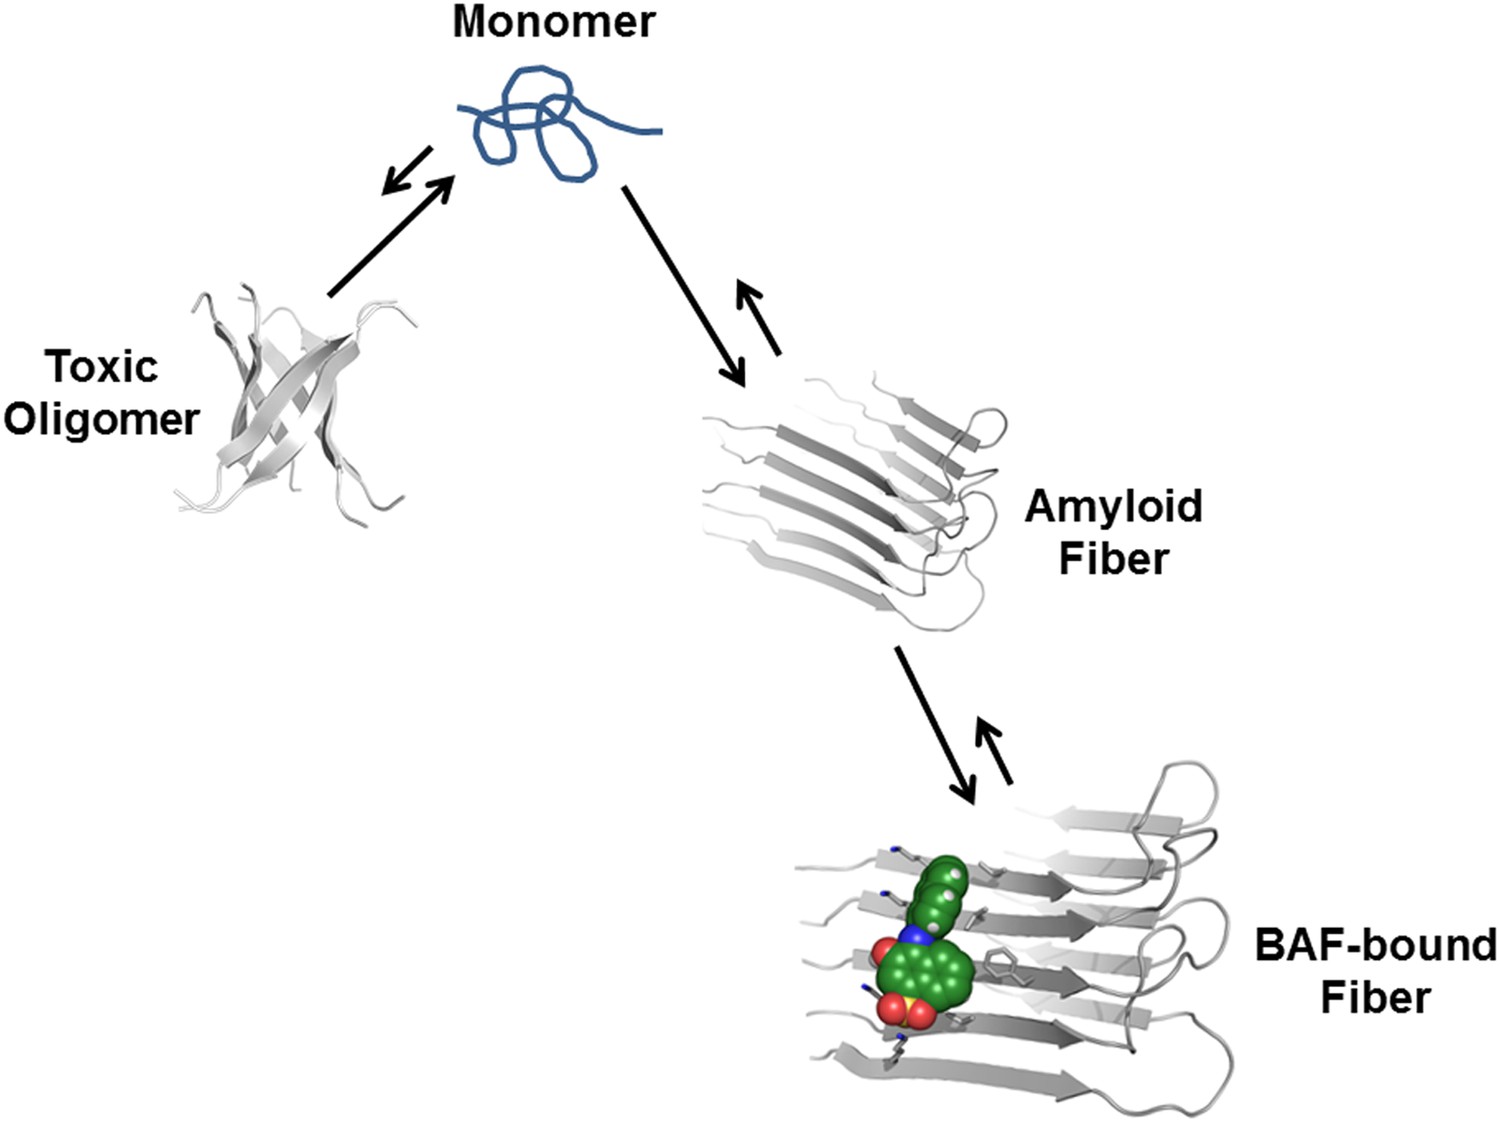
Proposed mechanism of how compound binding increases fiber stability and decreases fiber toxicity.
BAFs (green) bind to the side of amyloid fibers, stabilizing the fiber, and shifting the equilibrium from smaller and more toxic oligomers towards fibers. This shift in equilibrium reduces amyloid toxicity.
Figure 13 with 1 supplement
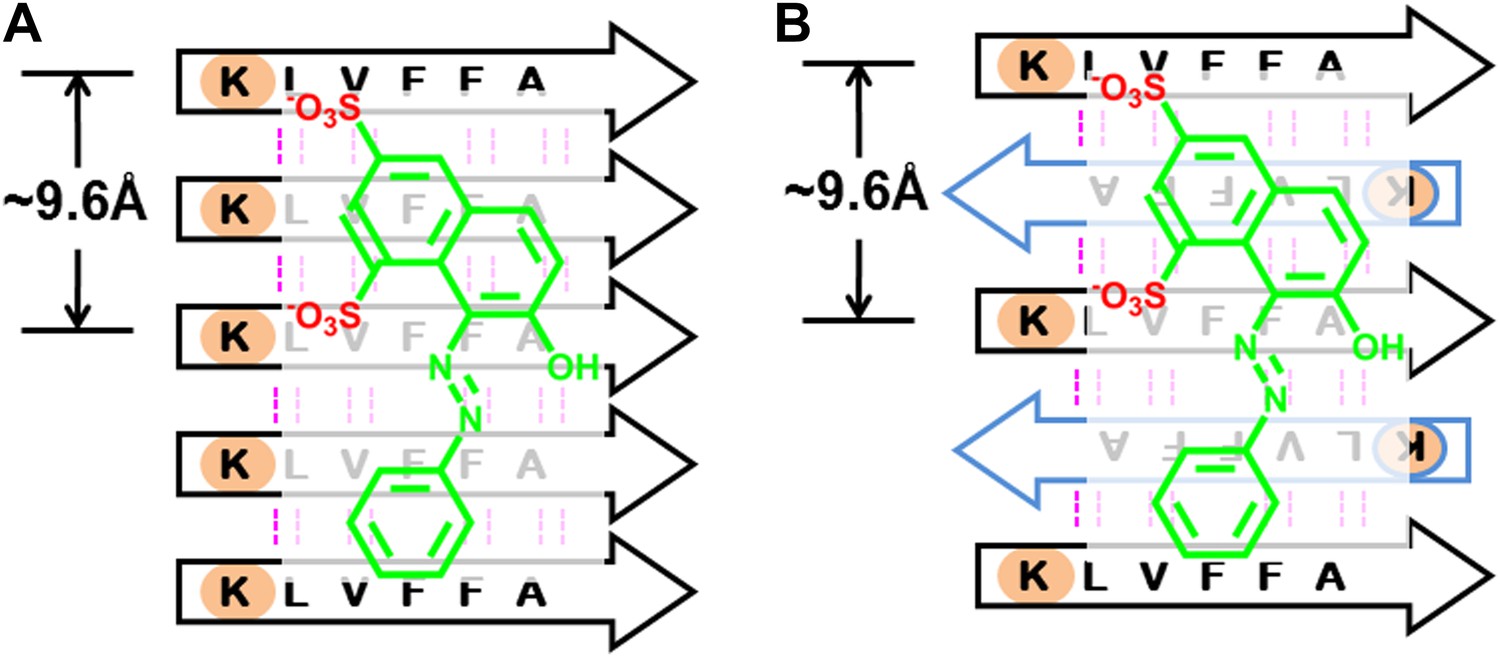
BAFs bind to in-register β-sheets and are compatible to both parallel and antiparallel amyloid β-sheets.
A subtlety of our procedure for compound discovery is that it involves both parallel (A) and antiparallel (B) amyloid β-sheets. In the X-ray structure of orange G bound to the segment Aβ16–21(KLVFFA) of Aβ, the sheets are antiparallel (B). The library of compounds is initially selected based on docking to the antiparallel β-sheet of Aβ16–21. In the next step of our procedure, each compound is further screened against the solid-state-NMR-derived model of full-length Aβ fiber, which is a parallel sheet (A). The structure models of orange G docked onto Aβ16–21 structure and full-length Aβ model are shown in Figure 13—figure supplement 1. As simplified here in (A and B), sulfate ions (red) of orange G are respectively hydrogen bonded to two lysine residues (light brown), which keep nearly identical geometry (the same ∼9.6 Å distance between the two lysine residues) in either parallel or antiparallel sheet. Evidence that orange G, as well as BAF compounds identified by our procedure, all bind to both antiparallel and parallel sheets is given by the NMR experiments summarized in Figure 5, where orange G and BAFs are shown to bind to both Aβ16–21 and full-length Aβ fibers. Apparently both parallel and antiparallel amyloid β-sheets are effective in binding to the same compounds.
Figure 13—figure supplement 1

Structural models of orange G docked onto the antiparallel Aβ16–21 (A) and parallel full-length Aβ (B) fiber.
(A). The side view of orange G (in an orange color) docked on the Aβ16–21 fiber (in a grey color) with a predicted binding energy of—8 kcal/mol. (B) side view of orange G (in an orange color) docked on the Aβ full fiber (in a light pink color) with a predicted binding energy of—9 kcal/mol. The charge interactions between the orange G and Lysine 16 are highlighted by dark grey lines.
Tables
Table 1
List of all tested BAF compounds
| Compound | Molecular formula | Molecular weight* | Sources/purchasing | Rescuing percentage (%) | ZINC entry |
|---|---|---|---|---|---|
| BAF1 | C20H8Br4O5 | 648 | Sigma-Aldrich | 44 ± 7 | ZINC04261875 |
| BAF2 | C19H14O5S | 354 | Sigma-Aldrich | 4 ± 3 | ZINC03860918 |
| BAF3 | C16H13NO3 | 267 | Ryan Scientific | 4 ± 5 | ZINC04289063 |
| BAF4 | C24H16N2O6 | 428 | Aldrich | 88 ± 22 | ZINC13346907 |
| BAF5 | C16H7Na3O10S3 | 524 | Sigma-Aldrich | 11 ± 7 | ZINC03594314 |
| BAF6 | C26H20N2 | 360 | Alfa-Aesar | 5 ± 7 | ZINC08078162 |
| BAF7 | C18H12N6 | 312 | Alfa-Aesar | 2 ± 2 | ZINC00039221 |
| BAF8 | C17H14N2O5S | 358 | Sigma-Aldrich | 23 ± 11 | ZINC12358966 |
| BAF9 | C19H13N3O4S | 379 | NCI plated 2007† | −3 ± 22 | ZINC03954432 |
| BAF10 | C17H13NO3 | 279 | NCI plated 2007 | 3 ± 5 | ZINC00105108 |
| BAF11 | C20H13N2O5S | 393 | NCI plated 2007 | 48 ± 12 | ZINC04521479 |
| BAF12 | C13H8Br3NO | 434 | NCI plated 2007 | 38 ± 6 | ZINC12428965 |
| BAF13 | C19H16ClNO4 | 358 | Sigma-Aldrich | 0 ± 2 | ZINC00601283 |
| BAF14 | C10H6S2O8 | 318 | Sigma-Aldrich | 3 ± 3 | ZINC01532215 |
| BAF15 | C23H28O8 | 432 | Sigma-Aldrich | 13 ± 4 | ZINC00630328 |
| BAF16 | C19H19NO5 | 341 | Sigma-Aldrich | 5 ± 8 | ZINC28616347 |
| BAF17 | C23H25N5O2 | 404 | Sigma-Aldrich | 6 ± 3 | ZINC00579168 |
| BAF18 | C24H16O2 | 336 | ChemDiv | 6 ± 2 | ZINC02168932 |
| BAF19 | C18H14N2O6 | 354 | ChemDiv | 3 ± 4 | ZINC01507439 |
| BAF20 | C25H19N5OS | 438 | ChemDiv | 8 ± 4 | ZINC15859747 |
| BAF21 | C19H14Br2O | 418 | ChemDiv | 6 ± 3 | ZINC38206526 |
| BAF22 | C21H16N2O3S2 | 408 | Life Chemicals | 3 ± 5 | ZINC04496365 |
| BAF23 | C16H11ClO5S | 351 | Enamine Ltd | 3 ± 5 | ZINC02649996 |
| BAF24 | C23H19NO3 | 357 | Sigma-Aldrich | 16 ± 5 | ZINC03953119 |
| BAF25 | C14H8Cl2N4 | 303 | Sigma-Aldrich | 4 ± 3 | ZINC00403224 |
| BAF26 | C17H10O4 | 278 | Aldrich | 46 ± 23 | ZINC05770717 |
| BAF27 | C21H16BrN3O6 | 486 | ChemBridge | 4 ± 1 | ZINC01208856 |
| BAF28 | C17H12N2O3 | 292 | ChemBridge | 2 ± 4 | ZINC00061083 |
| BAF29 | C22H10N4O2 | 362 | ChemBridge | 1 ± 5 | ZINC00639061 |
| BAF30 | C14H8O5 | 256 | Aldrich | 18 ± 13 | ZINC03870461 |
| BAF31 | C19H21NO3 | 311 | Sigma | 84 ± 12 | ZINC00011665 |
| BAF32 | C15H14O7 | 306 | Sigma-Aldrich | 15 ± 9 | ZINC03870336 |
| BAF33 | C27H33N3O8 | 528 | Sigma-Aldrich | 7 ± 2 | SIGMA-R2253§ |
| BAF34 | C30H16N4O14S4 | 785 | Aldrich | ‡ | ALDRICH-S432830§ |
| orange G | C16H12N2O7S2 | 408 | Sigma-Aldrich | −2 ± 8 | ZINC04261935 |
-
The 25 compounds (BAF1-25) are from the first round, and the nine compounds (BAF26-34) are from the second round. Another set of the 17 derivatives of the BAFs are shown in Table 3.
-
*
Molecular weight (anhydrous basis) excluding the salt and water molecules.
-
†
National Cancer Institute (NCI) free compound library (http://dtp.nci.nih.gov/).
-
‡
Toxicity results of BAF34 were not consistent among several independent replica experiments, possibly due to impurity and the high molecular weight of the compound.
-
§
ZINC entry of the compound is not applicable, and the catalog number from Sigma-Aldrich is provided.
Table 2
Detailed list of the active BAF compounds
| Compound | Molecular formula | Molecular weight* | Sources/companies | Purity | Rescuing percentage§ (%) | ZINC entry code¶ | SMILES string | |
|---|---|---|---|---|---|---|---|---|
| PC12 | Hela | |||||||
| BAF1 | C20H8Br4O5 | 647.9 | Sigma-Aldrich | ∼99% | 38 ± 11 | 44 ± 7 | ZINC04261875 | c1ccc2c(c1)C(=O)OC23c4ccc(c(c4Oc5c3ccc(c5Br)O)Br)O |
| BAF4 | C24H16N2O6 | 428.4 | Aldrich | ≥95% | 85 ± 18 | 88 ± 22 | ZINC13346907 | c1cc(c(cc1O)O)c2cc3c(cc2N)oc-4cc(=O)c(cc4n3)c5ccc(cc5O)O |
| BAF8 | C17H14N2O5S | 358.4 | Sigma-Aldrich | ≥90% | 26 ± 12 | 23 ± 11 | ZINC12358966 | Cc1ccc(c(c1)/N=N/c2c3ccccc3c(cc2O)S(=O)(=O)[O-])O |
| BAF11 | C20H13N2O5S | 393.5 | NCI plated 2007 | † | 51 ± 11 | 48 ± 12 | ZINC04521479 | c1ccc2c(c1)ccc(c2O)/N=N/c3c4ccccc4c(cc3O)S(=O)(=O)[O-] |
| BAF12 | C13H8Br3NO | 433.9 | NCI plated 2007 | † | 19 ± 6 | 38 ± 6 | ZINC12428965 | c1cc(ccc1/N=C/c2cc(cc(c2O)Br)Br)Br |
| BAF26 | C17H10O4 | 278.3 | Aldrich | ‡ | 60 ± 21 | 46 ± 23 | ZINC05770717 | c12c(cc(cc1)C(=O)C=O)Cc1c2ccc(c1)C(=O)C=O |
| BAF30 | C14H8O5 | 256.2 | Aldrich | ‡ | 37 ± 18 | 18 ± 13 | ZINC03870461 | c1cc2c(cc1O)C(=O)c3c(ccc(c3O)O)C2=O |
| BAF31 | C19H21NO3 | 311.4 | Sigma | ≥98% | 92 ± 22 | 84 ± 12 | ZINC03874841 | CCCN1CCC2=C3C1CC4=C(C3=CC(=C2)O)C(=C(C=C4)O)O |
-
BAFs 1, 4, 8, 11, 12 are from the first round. BAFs 26, 30, 31 are from the second round.
-
*
Molecular weight (anhydrous basis) excluding the salt and water molecules.
-
†
With the standard of NCI free compound library.
-
‡
Analytical data for AldrichCPR products are not available.
-
§
Rescue percentage is a scaled cell survival rate.
-
¶
Entry code for the ZINC database (http://zinc.docking.org).
Table 3
List of the representative BAFs 11, 30, 31 and their derivatives
| Compound | Molecular formula | Molecular weight | Description | Toxicity inhibition (%) | ZINC entry/catalog no. |
|---|---|---|---|---|---|
| BAF31 | C19H21NO3 | 311 | 84 ± 12 | ZINC03874841 | |
| BAF31ΔOH | C19H21NO2 | 295 | remove one hydroxyl (OH) | 15 ± 2 | ZINC03874841 |
| BAF30 | C14H8O5 | 256 | 18 ± 13 | ZINC03870461 | |
| BAF30αR | C22H20O13 | 492 | add additional R group away from binding interface | 20 ± 10 | ZINC28095922 |
| BAF30σOHAαOH | C14H8O6 | 272 | change one OH (A) position; add another OH | 9 ± 9 | ZINC03874832 |
| BAF30σOHAΔOHBαCOO | C15H8O6 | 284 | move one OH (A) position; delete an OH from loc B; add a carboxyl | 9 ± 3 | ZINC04098704 |
| BAF30σOHABαCH3 | C15H10O5 | 270 | move two OH (AB) positions; add a methyl | 6 ± 3 | ZINC03824868 |
| BAF11 | C20H13N2O5S | 393 | 48 ± 12 | ZINC04521479 | |
| BAF11ISO | C20H13N2O5S | 393 | isomer form of BAF11 | 33 ± 5 | ZINC12405071 |
| BAF11σR1 | C20H14N4O8S2 | 502 | change the aromatic group | 35 ± 9 | ZINC25558261 |
| BAF11σR2 (BAF8) | C17H14N2O5S | 358 | change the aromatic group | 22 ± 11 | ZINC12358966 |
| BAF11σR3 | C16H12N2O6S | 360 | change the aromatic group | 28 ± 4 | ZINC04900892 |
| BAF11αNO2- | C20H12N3O7S | 438 | add charged group (nitro) | 15 ± 6 | ZINC16218542 |
| BAF11ISOαCOO- | C21H12N2O7S | 436 | BAF11 isomer; add charged group (carboxyl) | 6 ± 5 | ZINC03861030 |
| BAF11ISOαSO3- | C20H11N2O11S3 | 552 | BAF11 isomer; add charged group (sulfate) | 2 ± 5 | SIGMA-33936 |
| BAF11ΔOHσR | C20H14N2O4S | 378 | remove an OH;change the position of the aromatic group | 15 ± 6 | ZINC04803992 |
| BAF11ΔOHαSO3− | C20H14N2O7S2 | 458 | remove an OH; add sulfate group | 12 ± 3 | ZINC03954029 |
| BAF11ΔOHαR | C20H18N4O5S | 426 | remove an OH; add additional group to the aromatic ring | 12 ± 6 | ZINC04416667 |
| BAF11σOHαR1 | C24H20N4O4S | 461 | swap the position of the OH and aromatics | 5 ± 5 | ZINC04804174 |
| BAF11σOHαR2 | C16H19N3O5S | 365 | swap the position of the OH and aromatics | 4 ± 6 | ZINC17378758 |
Table 4
Student’s t-test and p value analysis suggests that BAFs reduce the cytotoxicity of Aβ fibers significantly
| Average of cell viability (n = 4) | SD(σ) | Comparison to Aβ fiber alone | ||
|---|---|---|---|---|
| t value | p value | |||
| HeLa cell line | ||||
| Aβ fiber alone | 0.40 | 0.05 | / | / |
| BAF1 | 0.66 | 0.04 | 8.4 | 5E-05 |
| BAF4 | 0.93 | 0.13 | 7.4 | 1E-4 |
| BAF8 | 0.54 | 0.06 | 3.3 | 1E-2 |
| BAF11 | 0.69 | 0.07 | 6.6 | 2E-04 |
| BAF12 | 0.63 | 0.04 | 7.6 | 1E-04 |
| BAF26 | 0.68 | 0.14 | 3.8 | 5E-3 |
| BAF30 | 0.51 | 0.08 | 2.3 | 4E-2 |
| BAF31 | 0.91 | 0.07 | 11.5 | 7E-06 |
| PC12 cell line | ||||
| Aβ fiber alone | 0.37 | 0.07 | / | / |
| BAF1 | 0.61 | 0.07 | 4.9 | 1E-3 |
| BAF4 | 0.90 | 0.11 | 8.0 | 7E-05 |
| BAF8 | 0.53 | 0.07 | 3.2 | 1E-2 |
| BAF11 | 0.69 | 0.07 | 6.5 | 2E-4 |
| BAF12 | 0.49 | 0.04 | 2.9 | 2E-2 |
| BAF26 | 0.74 | 0.13 | 5.0 | 1E-3 |
| BAF30 | 0.60 | 0.11 | 3.5 | 8E-3 |
| BAF31 | 0.95 | 0.14 | 7.4 | 1E-4 |
-
The Student’s T-test and p-value are based on the comparison to Aβ fiber alone.
Table 5
Predicted binding energy and experimental measurement of the binding of two BAFs and orange G against both Aβ16–21 (KLVFFA) and full-length Aβ fibers
| Binding to KLVFFA fiber | Binding to Aβ fiber | |||
|---|---|---|---|---|
| Predicted binding energy (kcal/mol) | NMR Kd (µM) | Predicted binding energy (kcal/mol) | NMR peak reduction (%) | |
| BAF1 | −8 | 12 | −10 | 8 |
| BAF8 | −12 | 24 | −12 | 13 |
| orange G | −8 | 43 | −9 | 6 |
-
The determination of the binding parameters with KLVFFA fiber is detailed in Table 6.
Table 6
Comparison of the measured binding parameters of the representative BAFs with orange G by NMR titrations
| Compound | Predicted binding energy (kcal/mol) | fmax | Kd (µM) |
|---|---|---|---|
| BAF1 | −8 | 0.47 ± 0.04 | 12 ± 7 |
| BAF8 | −12 | 0.82 ± 0.04 | 24 ± 5 |
| Orange-G | −8 | 0.46 ± 0.06 | 43 ± 21 |
-
The second column lists the predicted binding energy for each top docked model of BAF compounds with KLVFFA fiber, and the binding energy of Orange-G with KLVFFA fiber were also calculated for comparison. Our computational method identified the BAF with better fit to the binding interface than Orange-G. We then used NMR titration to determine the binding affinity. Our previous mass spectrometric analyses of the crystal of the Orange-G with KLVFFA fibers have suggested a binding ratio of compound:fiber with the range of 1:1 to 1:10 (Landau et al., 2011). Together with our structural models and single binding site assumption, we estimated the binding ratio to be 1:3. Accordingly, calculated NMR binding parameters are listed in the table. The third column fmax is the maximum fraction of NMR signal decrease of compound upon binding saturation (‘Materials and methods’).
Table 7
BAFs reduce Aβ cyto-toxicity by targeting fibers rather than oligomers.
| Compound | Inhibition to the cyto-toxicity of Abeta oligomers (%) | Inhibition to the cyto-toxicity of Abeta fibers (%) |
|---|---|---|
| BAF1 | −4 ± 6 | 36 ± 9 |
| BAF11 | −9 ± 7 | 7 ± 7 |
| BAF26 | −6 ± 6 | 26 ± 7 |
| BAF31 | −17 ± 15 | 58 ± 7 |
-
The BAF inhibitions of toxicity from either Aβ oligomer or fibers are compared. Four BAFs, which reduce the toxicity of Aβ fibers, show no inhibitory effects to Aβ oligomer toxicity at the equal molar ratio of BAF to Aβ. The inhibition (%) are calculated using the same method defined in ‘Materials and methods’. The toxicity assay of Aβ oligomer is described in Figure 11—figure supplement 1. The toxicity assay of Aβ fiber is the same as that described in Figure 3.
Additional files
-
Supplementary file 1
Compound Library Set 1: Cambridge Structure Database (CSD) set.
- https://doi.org/10.7554/eLife.00857.037
-
Supplementary file 2
Compound Library Set 2: Flat Compound (FC) set.
- https://doi.org/10.7554/eLife.00857.038
Download links
A two-part list of links to download the article, or parts of the article, in various formats.
Downloads (link to download the article as PDF)
Open citations (links to open the citations from this article in various online reference manager services)
Cite this article (links to download the citations from this article in formats compatible with various reference manager tools)
Structure-based discovery of fiber-binding compounds that reduce the cytotoxicity of amyloid beta
eLife 2:e00857.
https://doi.org/10.7554/eLife.00857


