Epidemiological dynamics of Ebola outbreaks
- University of Warwick, United Kingdom
Figures
Figure 1

Analysis of rate of new outbreaks and case fatality ratio.
A shows empirical data and 95% CI (black lines) together with fitted distribution and 95% CI (red lines) for rate of new outbreaks. B shows empirical data and 95% CI (black lines) together with fitted distribution and 95% CI (red lines) for case fatality ratio. C shows the posterior density for rate of new outbreaks λ, while D and E show the posterior density for the beta distribution parameters α and β, respectively.
Figure 2

Analysis of transmission dynamics for completed outbreaks.
(A and B) Model (solid red line) and 95% CI (dash-dot red line) vs data (black circles) and 95% CI (solid black lines) for different axis scales. (C) Posterior for values of the reproductive ratio . (D) Posterior for the geometric parameter p.
Figure 3
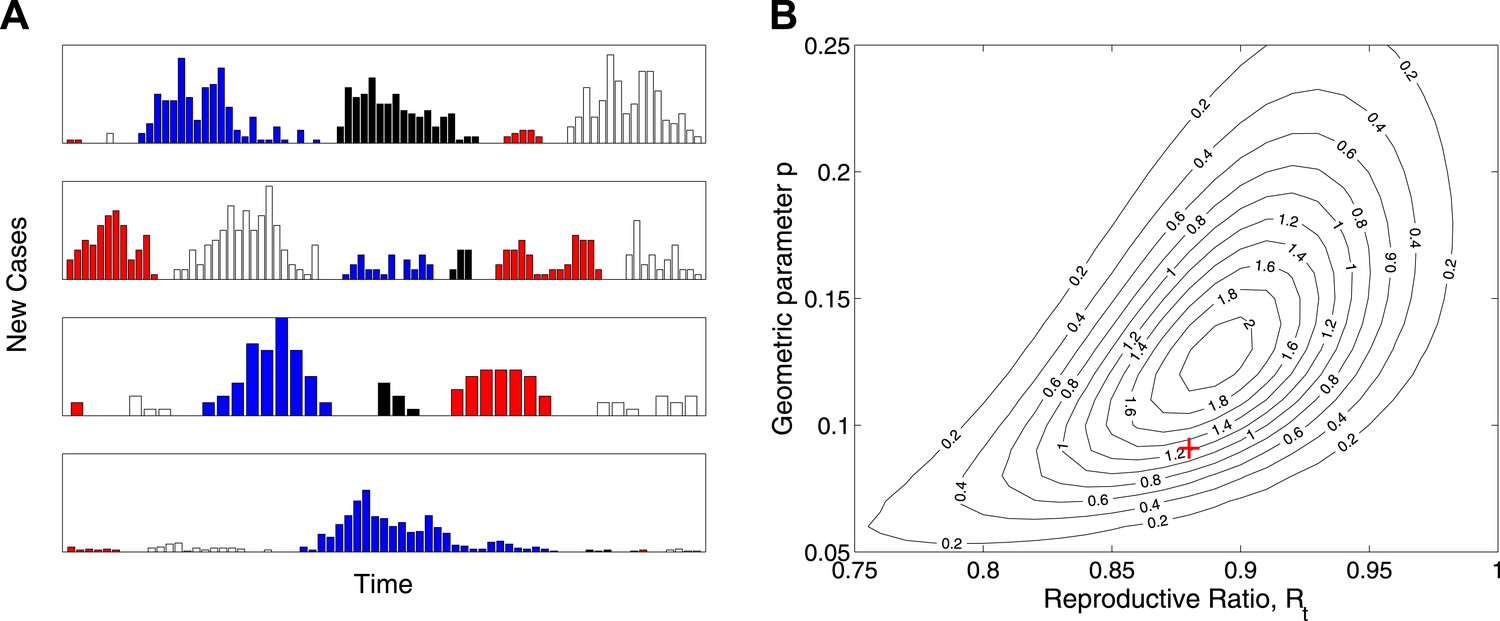
Simulation study.
(A) Real-time model simulations, with change in colour denoting a new outbreak. (B) Likelihood contours (black lines and values multiplied by an unimportant constant) together with parameters used to simulate (red cross), showing that the parameters are identifiable from such data.
Figure 4
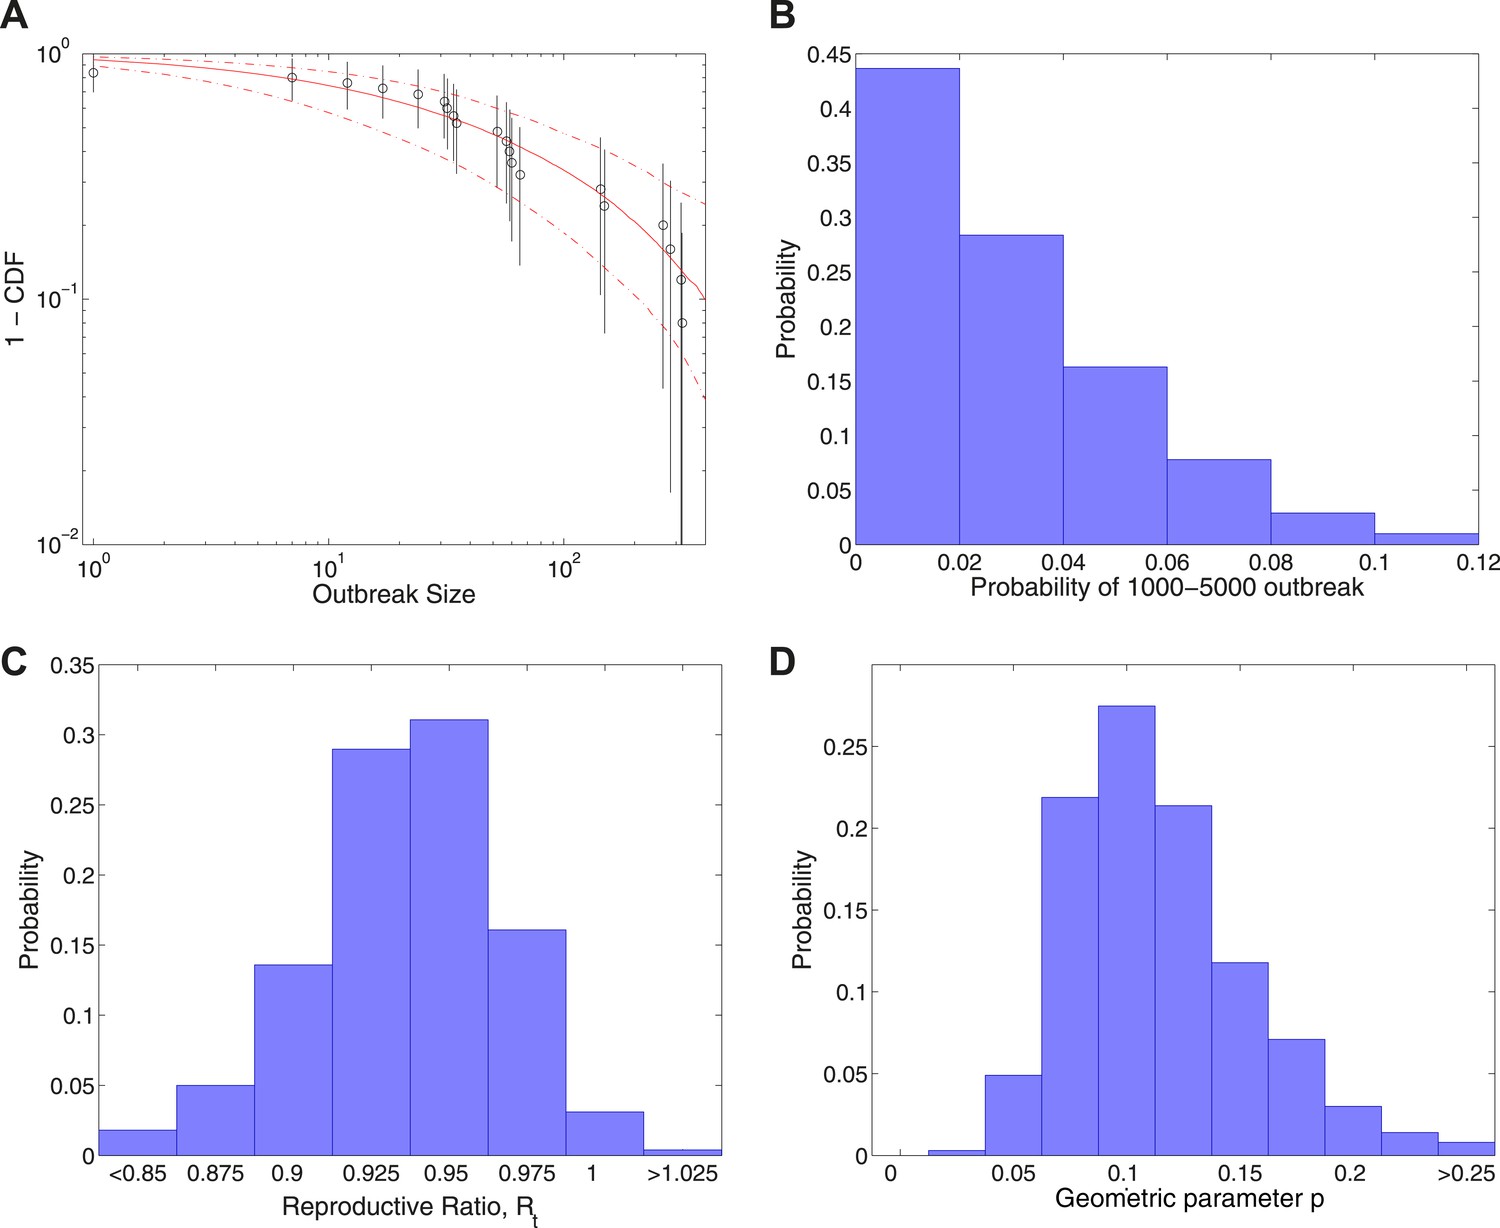
Analysis of transmission dynamics for completed outbreaks plus one outbreak of size 1000–5000.
(A) Model (solid red line) and 95% CI (dash-dot red line) vs data (black circles) and 95% CI (solid black lines). (B) Posterior for the probability of the large uncertain outbreak. (C) Posterior for values of the reproductive ratio . (D) Posterior for the geometric parameter p.
Download links
A two-part list of links to download the article, or parts of the article, in various formats.
Downloads (link to download the article as PDF)
Open citations (links to open the citations from this article in various online reference manager services)
Cite this article (links to download the citations from this article in formats compatible with various reference manager tools)
Epidemiological dynamics of Ebola outbreaks
eLife 3:e03908.
https://doi.org/10.7554/eLife.03908


