Distinct activation mechanisms of CXCR4 and ACKR3 revealed by single-molecule analysis of their conformational landscapes
- Skaggs School of Pharmacy and Pharmaceutical Sciences, Department of Pharmacology, University of California San Diego, United States
- Department of Integrative Structural and Computational Biology, The Scripps Research Institute, United States
Figures
Figure 1 with 2 supplements
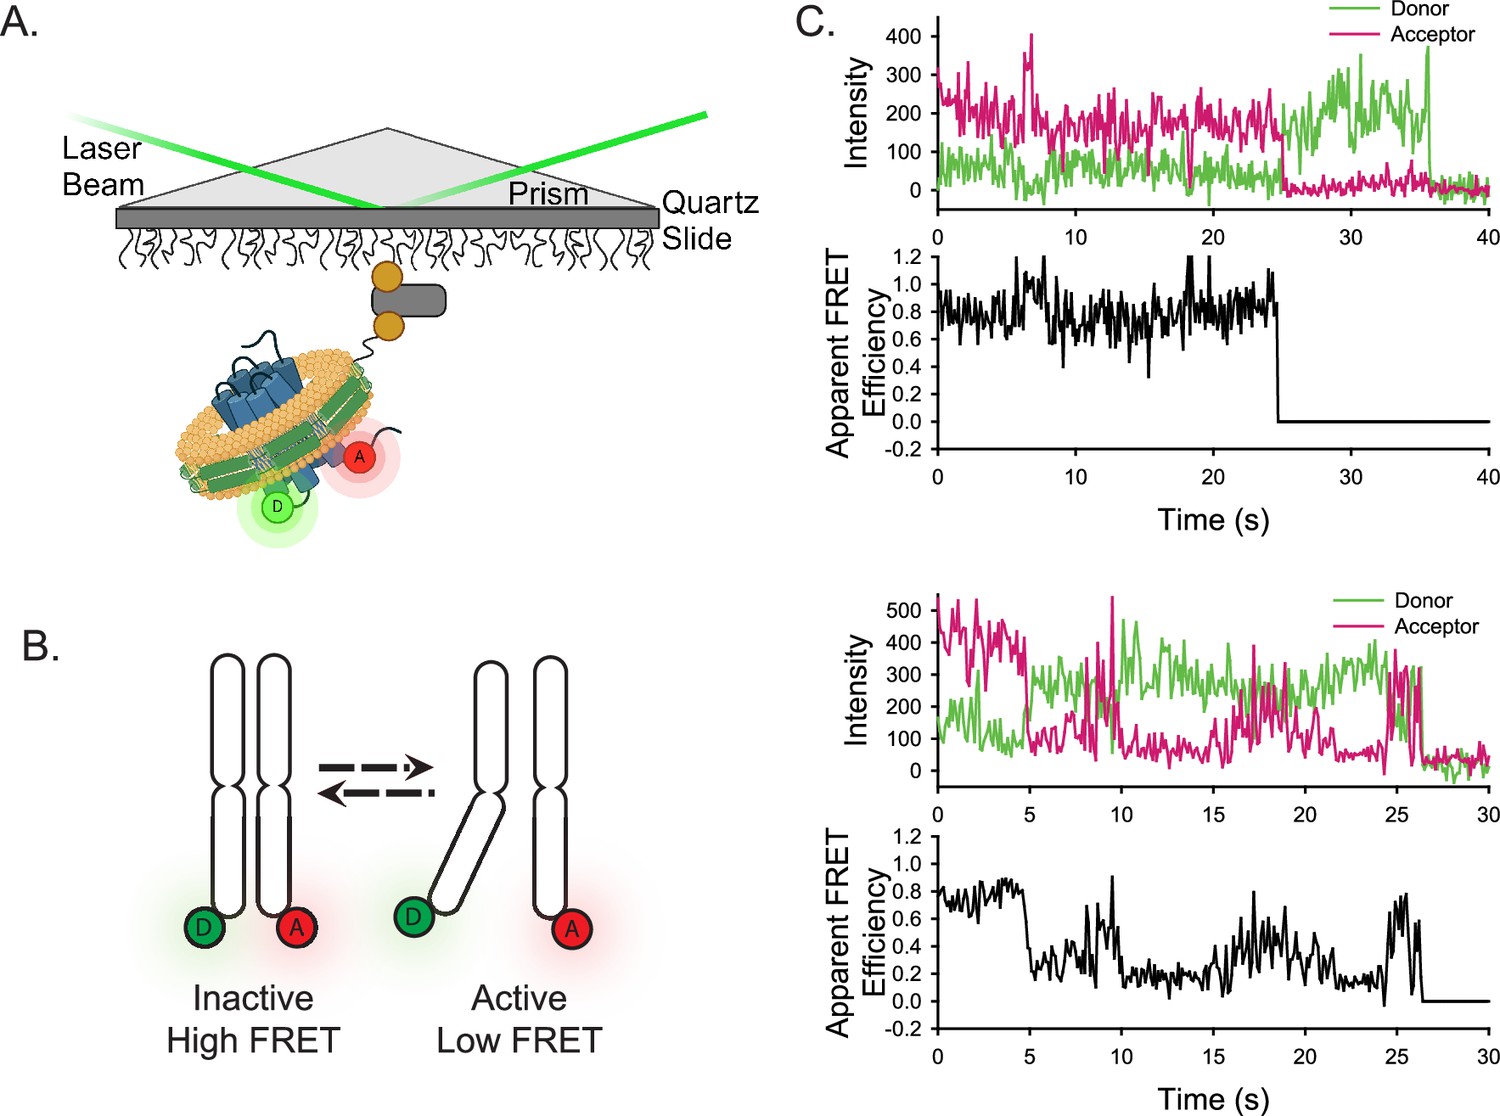
Experimental design of the smFRET system.
(A) A single receptor molecule (blue) was labeled with donor (D) and acceptor (A) fluorophores, inserted into a phospholipid (yellow) nanodisc (green), and immobilized on a quartz slide via biotin (tan circle)-neutravidin (grey rectangle) attachment. A prism facilitates total internal reflection of the excitation laser to excite only donor fluorophores close to the surface. Created in BioRender.com. (B) Cartoon depicting inactive (left) and active (right) receptor conformations. (C) Two representative single-molecule time traces for apo-ACKR3. In both examples, the donor (green) and acceptor (red) intensities are shown in the top panel and the corresponding apparent FRET efficiency (black) is shown in the bottom panel.
Figure 1—figure supplement 1
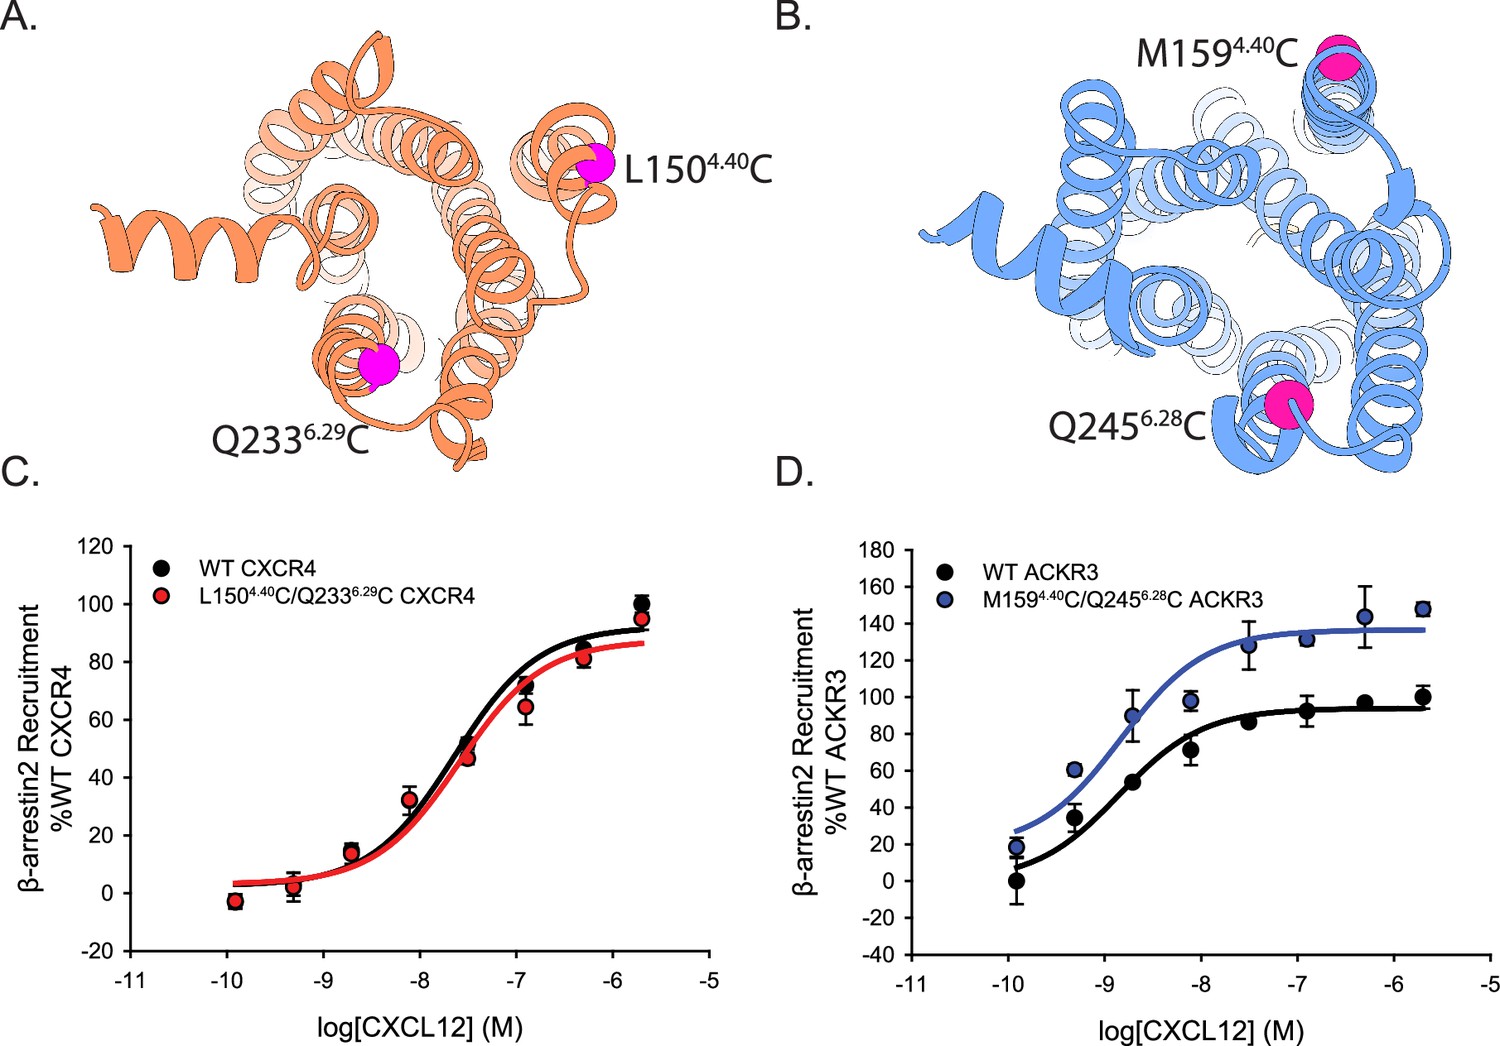
Cysteine mutations on TM4 and TM6 of CXCR4 and ACKR3 do not impair CXCL12 mediated β-arrestin2 recruitment observed by BRET.
(A, B) Locations of the cysteines (magenta spheres) on CXCR4 (A) and ACKR3 (B). (C, D) Dose-response BRET-based arrestin recruitment to WT receptors and Cys-containing (C) CXCR4 and (D) ACKR3. Data represents averages of three independent experiments normalized to the WT receptor recruitment measured on the same experimental plate as the mutants.
-
Figure 1—figure supplement 1—source data 1
Arrestin recruitment to WT and Cys-engineered CXCR4 and ACKR3 across CXCL12 concentrations.
- https://cdn.elifesciences.org/articles/100098/elife-100098-fig1-figsupp1-data1-v1.xlsx
Figure 1—figure supplement 2

Example single-molecule traces of apo-ACKR3 and apo-CXCR4.
Donor intensity, acceptor intensity and apparent FRET efficiency time traces are colored green, magenta, and black, respectively.
Figure 2 with 5 supplements
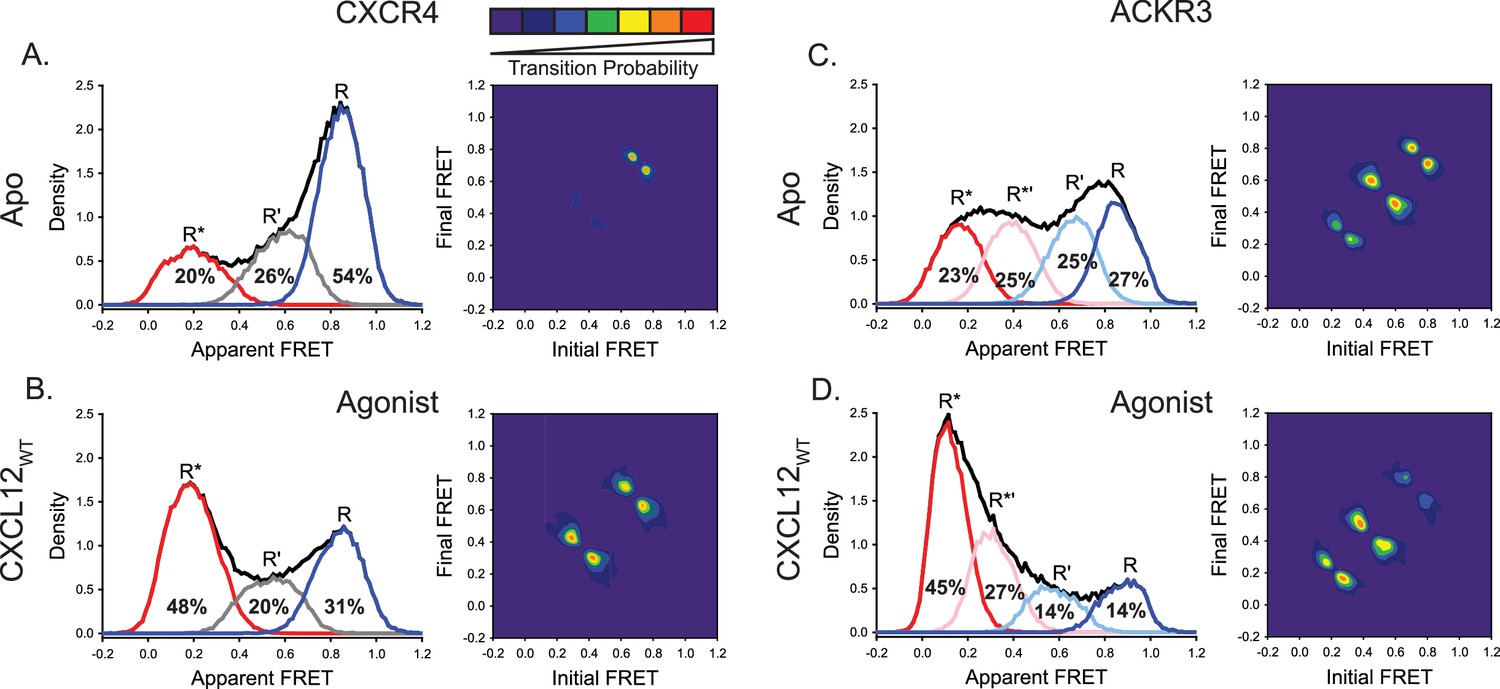
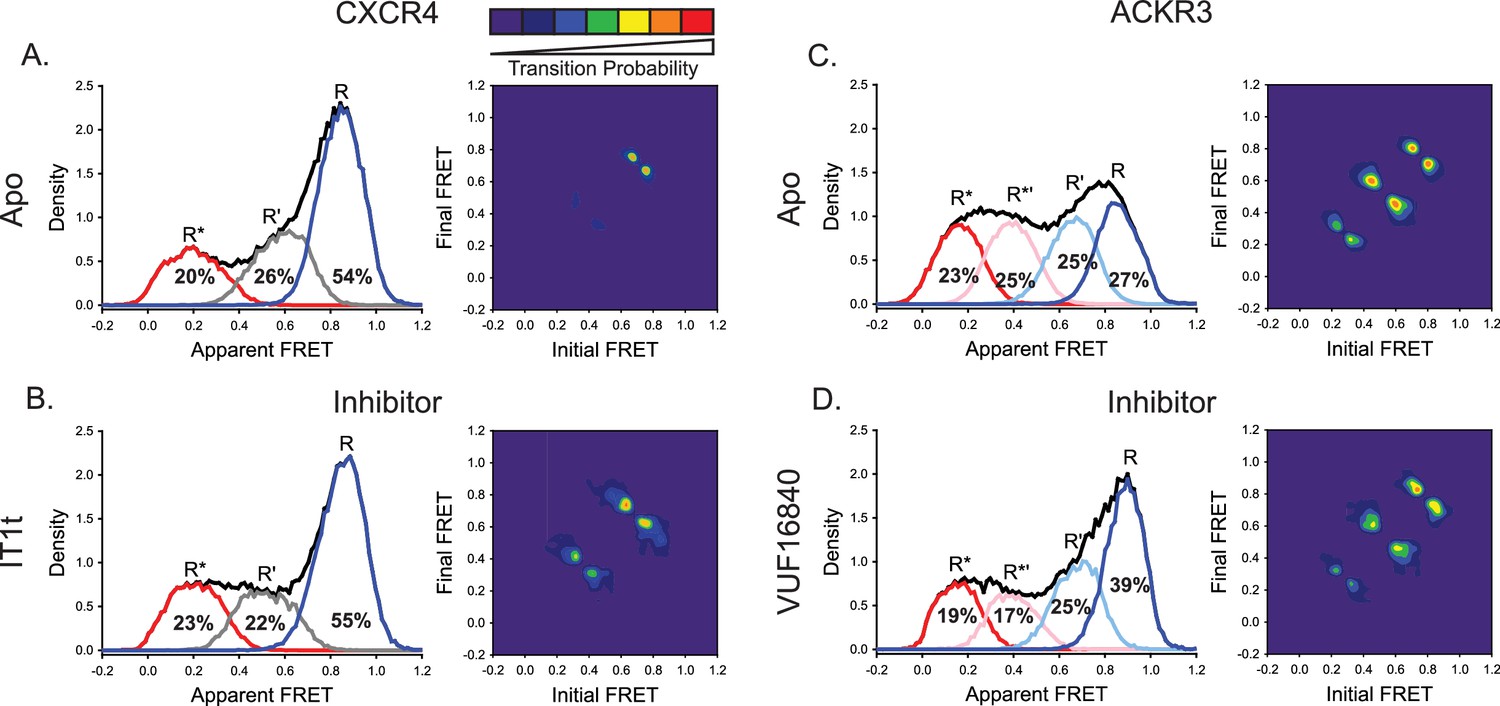
ACKR3 exhibits greater conformational flexibility compared to CXCR4.
(A) Apparent FRET efficiency histogram of apo-CXCR4 (left, black trace) resolved into three distinct conformational states: a high-FRET state corresponding to the inactive receptor conformation (R, blue), a low-FRET active receptor conformation (R*, red) and an intermediate conformation (R’, gray). The fractional populations of each state obtained from global analysis are indicated. The receptor is mostly in the inactive conformation. A transition density probability (TDP) plot (right) displays the relative probabilities of transitions from an initial FRET state (x-axis) to a final FRET state (y-axis). For apo-CXCR4, transitions between R and R’ states are observed most frequently. (B) Addition of CXCL12WT to CXCR4 shifted the conformational distribution to the low-FRET R* state and resulted in more transitions between all three FRET states. (C) The broad apparent FRET efficiency histogram of apo-ACKR3 (left, black trace) is resolved into four distinct conformational states: inactive R (blue), active R* (red), inactive-like R’ (light blue), and active-like R*’ (pink). Little conformational preference is observed among these states. Moreover, all possible sequential state-to-state transitions are observed (right). (D) Addition of CXCL12WT to ACKR3 shifted the conformational distribution to the low-FRET R* state, which was also reflected in the transition probabilities. In all cases, data sets represent the analysis of at least three independent experiments.
-
Figure 2—source data 1
Histograms for Apo CXCR4 FRET states.
- https://cdn.elifesciences.org/articles/100098/elife-100098-fig2-data1-v1.csv
-
Figure 2—source data 2
Contour map for Apo CXCR4 TDP.
- https://cdn.elifesciences.org/articles/100098/elife-100098-fig2-data2-v1.csv
-
Figure 2—source data 3
Histograms for CXCL12 CXCR4 FRET states.
- https://cdn.elifesciences.org/articles/100098/elife-100098-fig2-data3-v1.csv
-
Figure 2—source data 4
Contour map for CXCL12 CXCR4 TDP.
- https://cdn.elifesciences.org/articles/100098/elife-100098-fig2-data4-v1.csv
-
Figure 2—source data 5
Histograms for Apo ACKR3 FRET states.
- https://cdn.elifesciences.org/articles/100098/elife-100098-fig2-data5-v1.csv
-
Figure 2—source data 6
Contour map for Apo ACKR3 TDP.
- https://cdn.elifesciences.org/articles/100098/elife-100098-fig2-data6-v1.csv
-
Figure 2—source data 7
Histograms for CXCL12 ACKR3 FRET states.
- https://cdn.elifesciences.org/articles/100098/elife-100098-fig2-data7-v1.csv
-
Figure 2—source data 8
Contour map for CXCL12 ACKR3 TDP.
- https://cdn.elifesciences.org/articles/100098/elife-100098-fig2-data8-v1.csv
Figure 2—figure supplement 1
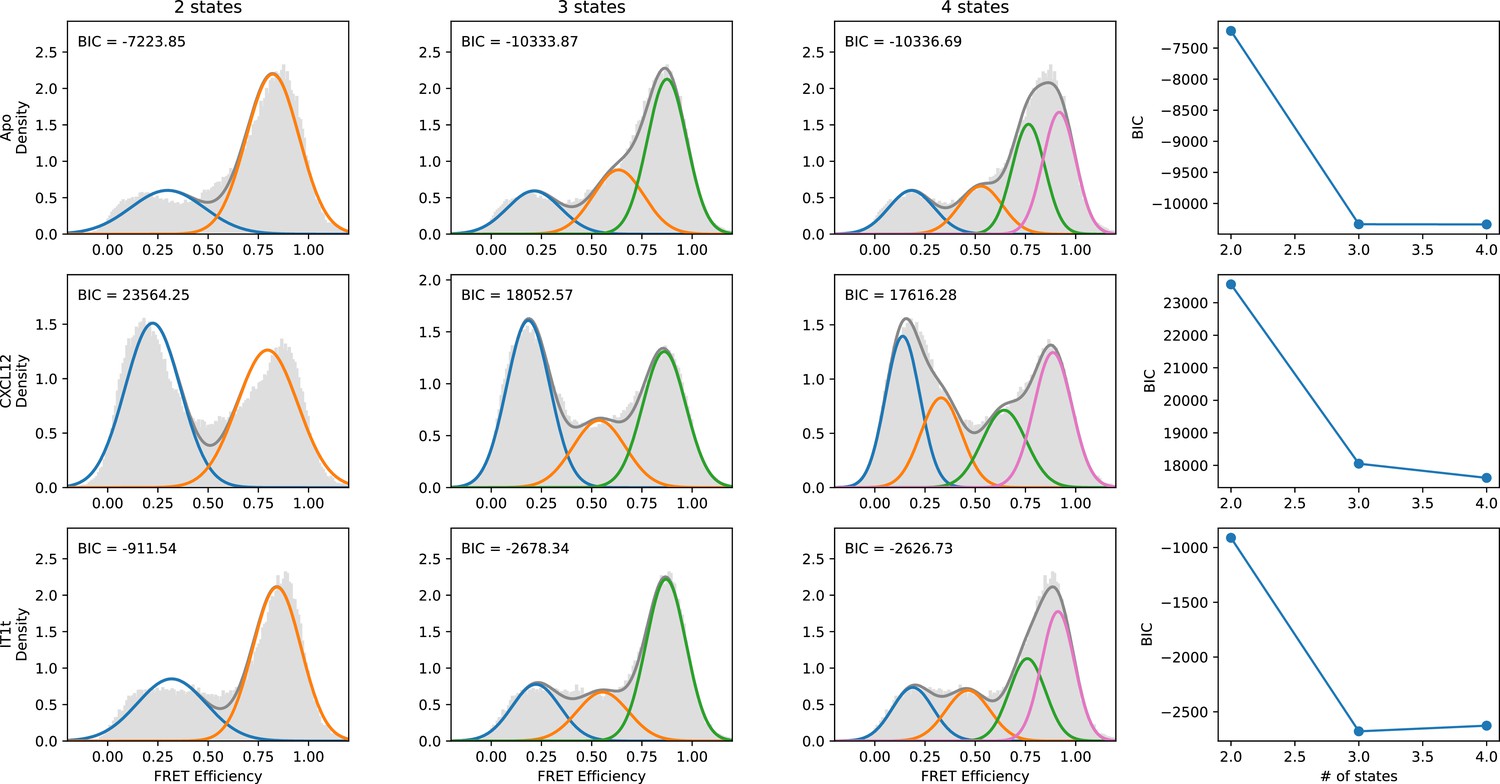
Quantitative evaluation of the appropriate number of FRET states required to model the CXCR4 smFRET distributions.
SmFRET data for CXCR4 recorded in the apo-state (first row), and in the presence of agonist CXCL12WT (second row) and small-molecule ligand IT1t (third row) were globally analyzed by Hidden Markov analysis assuming the presence of two, three, or four FRET states. For each condition, the overall apparent FRET efficiency histogram is shown in gray. Each distribution was fit to a Gaussian Mixture Model (GMM) using the Python package scikit-learn, and the Bayesian Information Criterion (BIC) was calculated. Individual gaussian components are shown as colored lines and the total fitted envelopes are shown as dark gray lines. The values of the BICs were used to evaluate the appropriate model complexity as described in the text. The results indicate that a three-state model is sufficient to describe the data.
Figure 2—figure supplement 2
Comparison of the CXCR4 intermediate states for the conditions detailed in Figure 2—figure supplement 1 using three-state and four-state models revealed over fitting artifacts using four states.
(Top) With the three-state model, the R’ states for apo-CXCR4 and for CXCL12- and IT1t-bound receptor overlapped well with similar apparent FRET values across all of the tested conditions. In the case of the four-state model, the R*’ (Middle) and R’ (Bottom) states were substantially different across the ligand treatments. In particular, the R*’ state with CXCL12 treatment appears to arise from a splitting of the R* conformation, indicating that the model was overfitting the data.
Figure 2—figure supplement 3
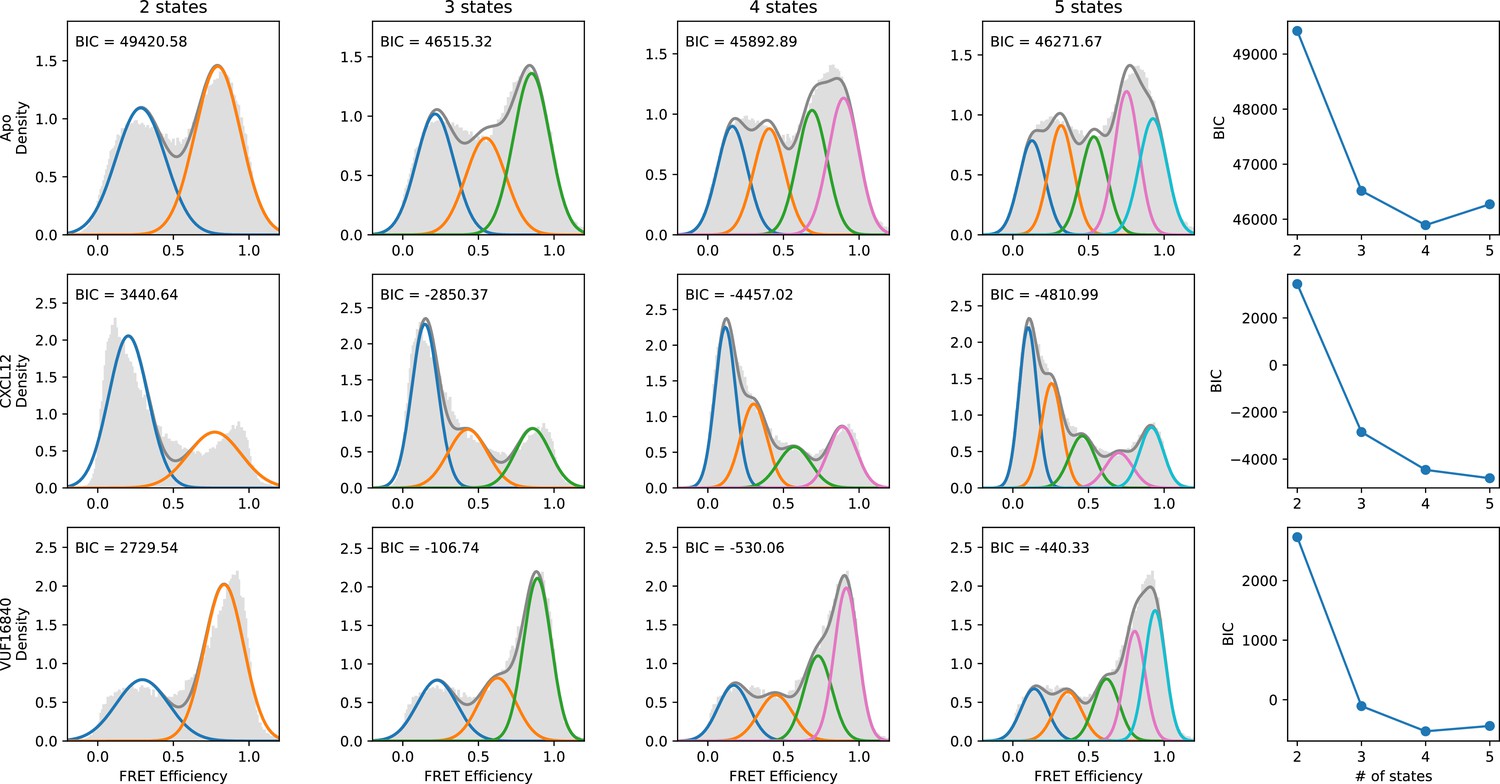
Evaluation of the number of discrete FRET states present in ACKR3 under various conditions.
SmFRET data for ACKR3 recorded in the apo-state (first row), and in the presence of agonist CXCL12WT (second row) and inverse agonist VUF16840 (third row) were globally analyzed by Hidden Markov analysis assuming the presence of two, three, four, or five FRET states. For each condition, the overall apparent FRET efficiency histogram is shown in gray. Analysis was performed as described in Figure 2—figure supplement 1. The results indicate that four FRET states are required to reproduce the experimental distributions.
Figure 2—figure supplement 4
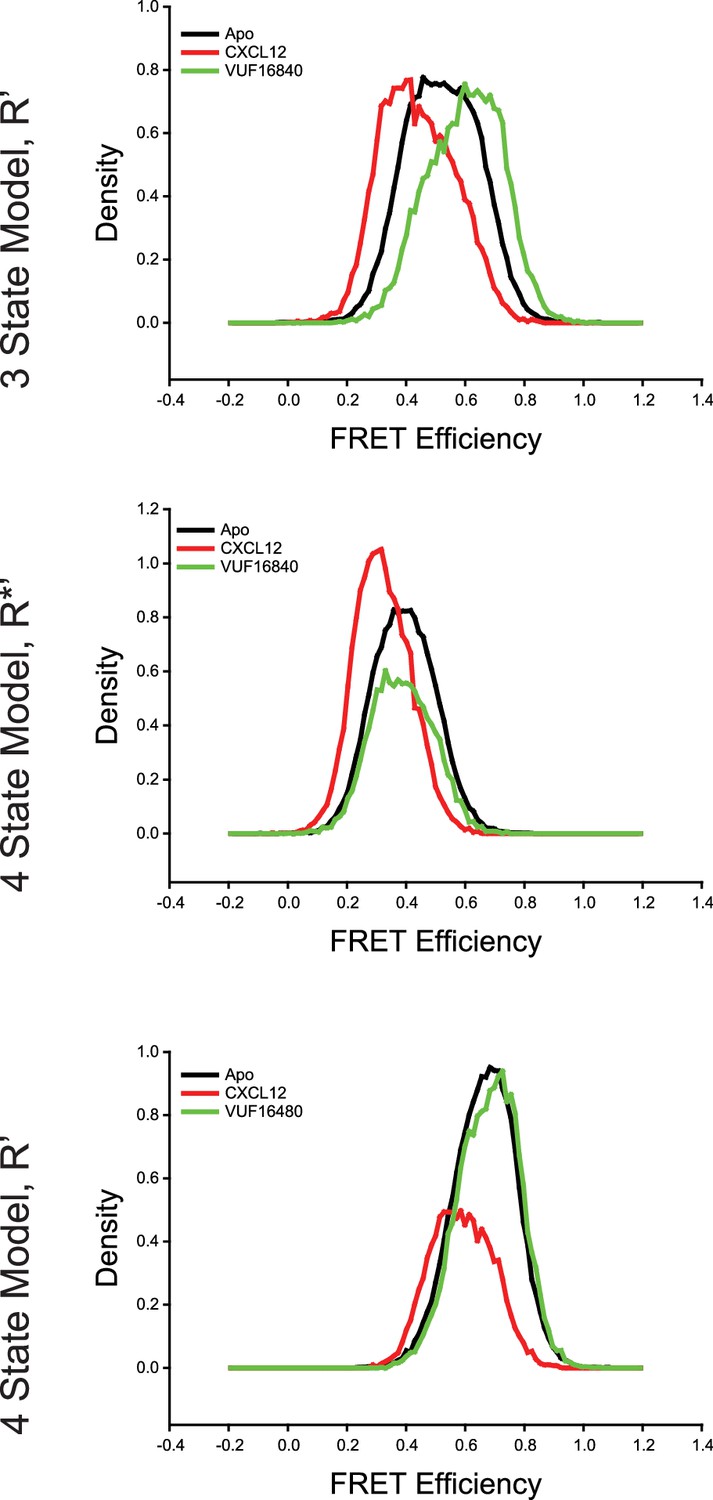
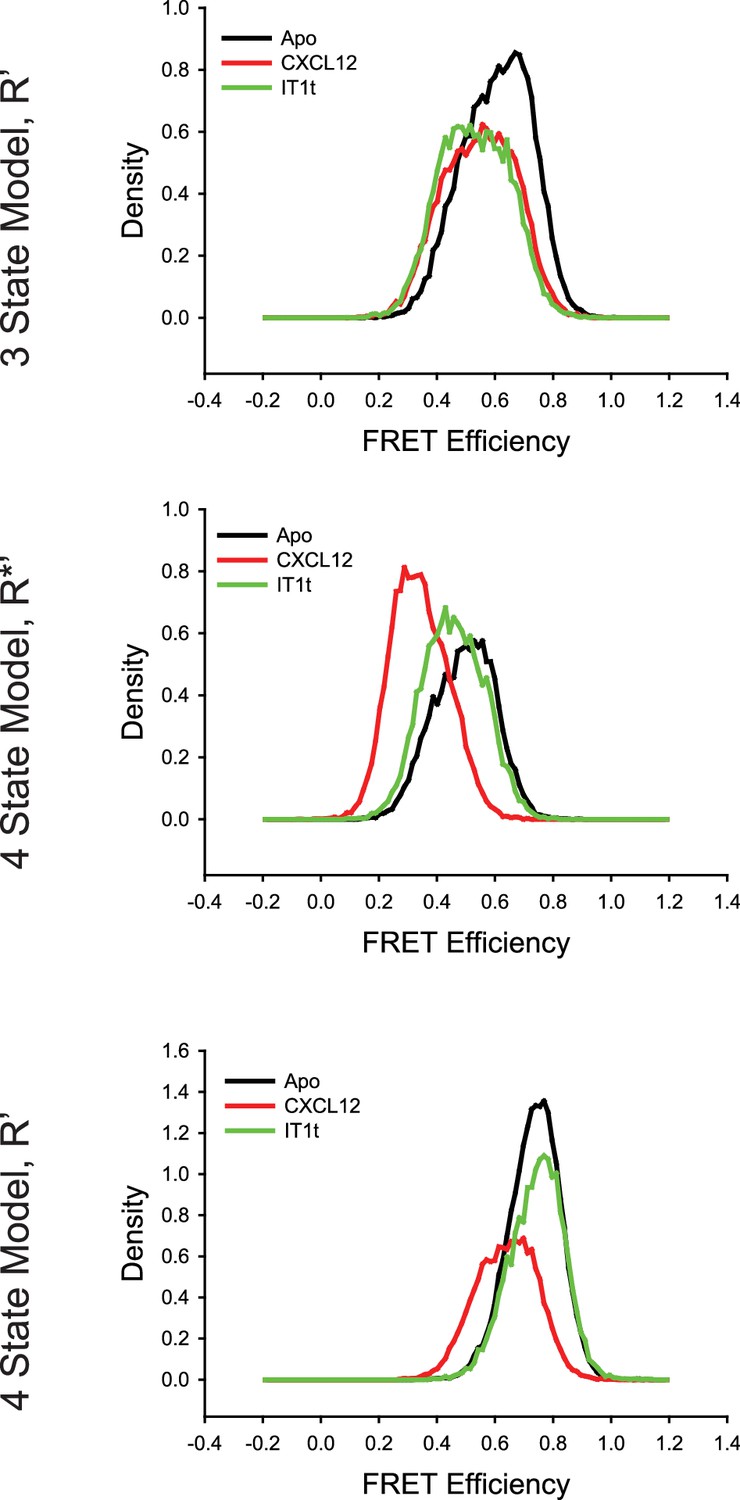
Comparison of intermediate state FRET histograms of ACKR3 from the three- and four-state models shown in Figure 2—figure supplement 3.
(Top) The R’ state histogram from the three-state model for apo-ACKR3, and CXCL12WT- and VUF16840-treated ACKR3 showed a spread across intermediate FRET values. The R’ distribution of the apo-receptor was directly between the R’ states for the agonist and inverse agonist samples. Splitting the single intermediate into two separate active-like (R*’, Middle) and inactive-like (R’, Bottom) with a four-state model showed consistent state assignments across the intermediates, which indicated that the same conformations were being observed in each treatment. Therefore, four states were required to fully capture the observed conformational landscape of ACKR3.
Figure 2—figure supplement 5
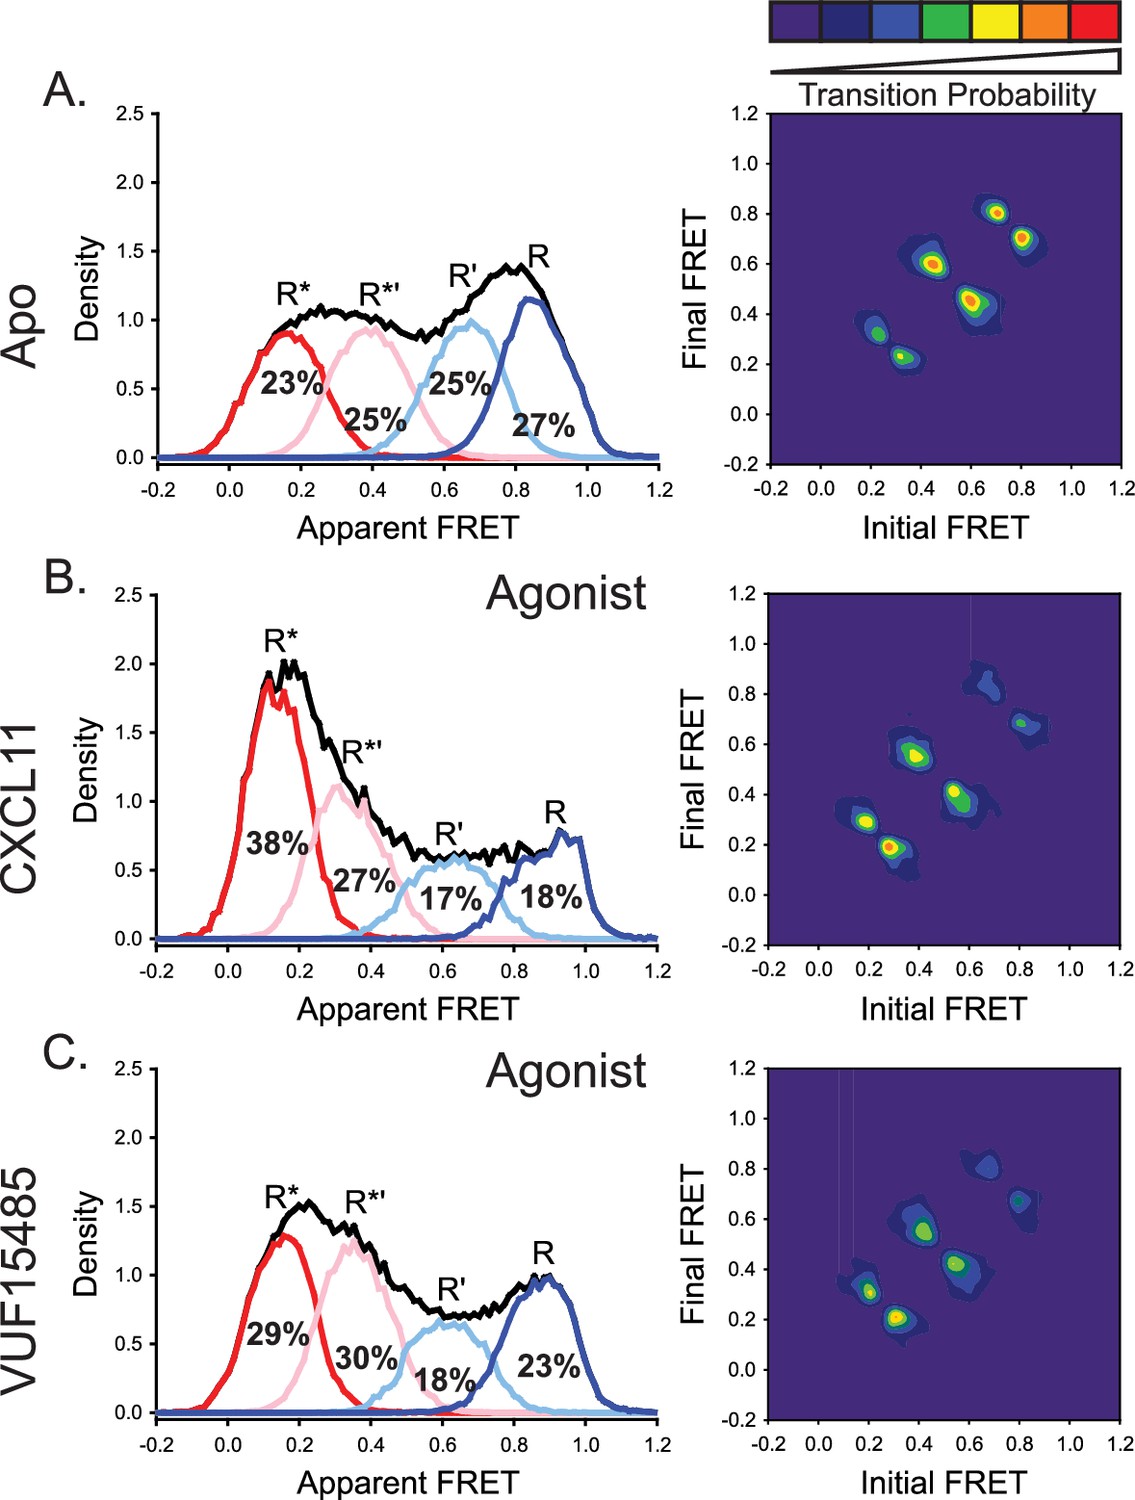
The natural and engineered agonists CXCL11 and VUF15485, respectively, both promoted low-FRET, active-like ACKR3 conformations.
(A) Repeated results of apo-ACKR3 from Figure 2B for comparison of the apparent FRET envelope and modeled states and the TDP. (B) Treatment with CXCL11 leads to a predicted shift in population and transitions to low-FRET states. (C) The small molecule agonist VUF15485 (Zarca et al., 2024) also showed shifts of the population and transitions to low-FRET R* and R*’ conformations. Results shown are the combined data sets of three independent experiments. The total apparent FRET envelopes for the samples are represented by black traces.
-
Figure 2—figure supplement 5—source data 1
Histograms for CXCL11 ACKR3 FRET states.
- https://cdn.elifesciences.org/articles/100098/elife-100098-fig2-figsupp5-data1-v1.csv
-
Figure 2—figure supplement 5—source data 2
Contour map for CXCL11 ACKR3 TDP.
- https://cdn.elifesciences.org/articles/100098/elife-100098-fig2-figsupp5-data2-v1.csv
-
Figure 2—figure supplement 5—source data 3
Histograms for VUF15485 ACKR3 FRET states.
- https://cdn.elifesciences.org/articles/100098/elife-100098-fig2-figsupp5-data3-v1.csv
-
Figure 2—figure supplement 5—source data 4
Contour map for VUF15485 ACKR3 TDP.
- https://cdn.elifesciences.org/articles/100098/elife-100098-fig2-figsupp5-data4-v1.csv
Figure 3 with 1 supplement
A small molecule inhibitor shifts the ACKR3 conformational population to the inactive FRET state, while CXCR4 is largely unaffected.
(A) FRET distributions and TDP of apo-CXCR4 repeated from Figure 2A for comparison. (B) Treatment of CXCR4 with the inhibitor IT1t had little impact on the FRET distribution, but increased transition probabilities compared to the apo-receptor. (C) FRET distributions and TDP of apo-ACKR3 repeated from Figure 2C for comparison. (D) Treatment of ACKR3 with VUF16480, an inverse agonist, shifted the conformational distribution and TDP to the high-FRET inactive R conformation. Data sets represent the analysis of at least three independent experiments. The overall apparent FRET efficiency envelopes for the samples are represented by the black traces.
-
Figure 3—source data 1
Histograms for IT1t CXCR4 FRET states.
- https://cdn.elifesciences.org/articles/100098/elife-100098-fig3-data1-v1.csv
-
Figure 3—source data 2
Contour map for IT1t CXCR4 TDP.
- https://cdn.elifesciences.org/articles/100098/elife-100098-fig3-data2-v1.csv
-
Figure 3—source data 3
Histograms for VUF16840 ACKR3 FRET states.
- https://cdn.elifesciences.org/articles/100098/elife-100098-fig3-data3-v1.csv
-
Figure 3—source data 4
Contour map for VUF16840 ACKR3 TDP.
- https://cdn.elifesciences.org/articles/100098/elife-100098-fig3-data4-v1.csv
Figure 3—figure supplement 1
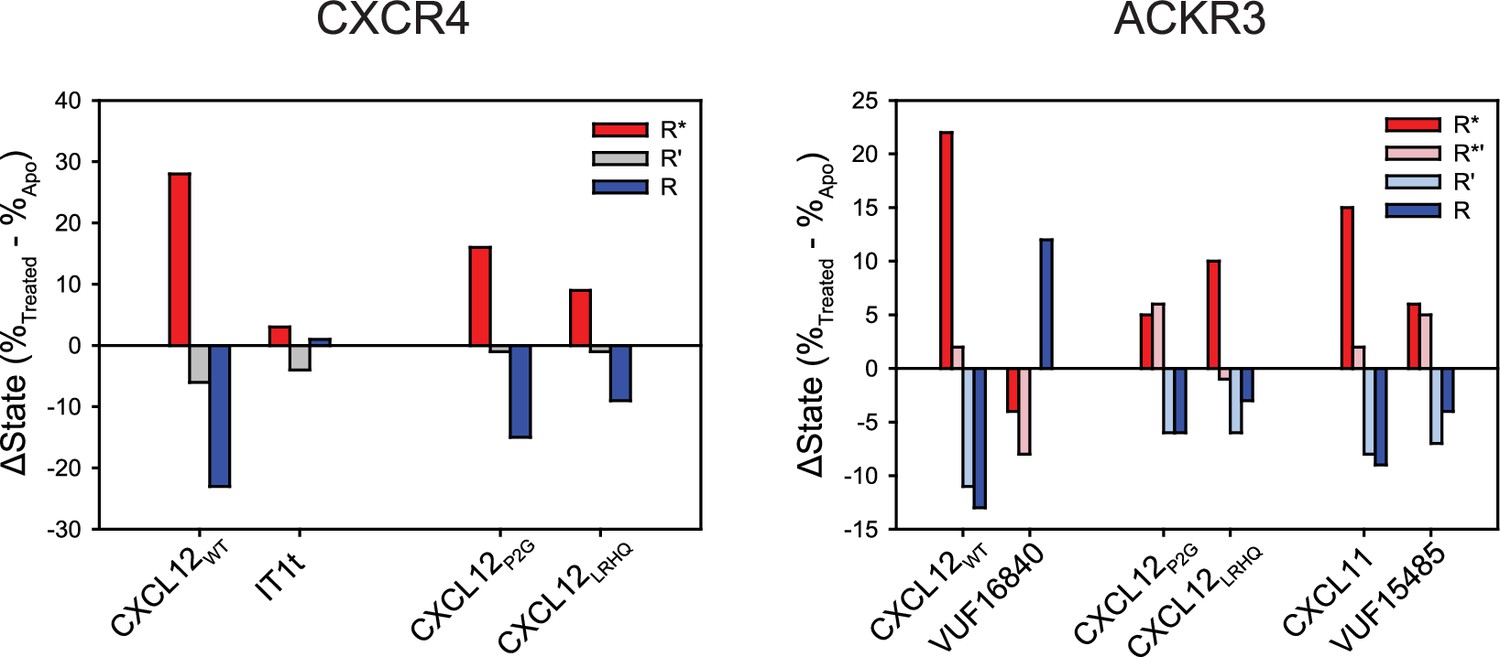
Change in the population percentages of individual FRET states due to ligand treatment of CXCR4 and ACKR3.
Data used for this analysis are presented as full apparent FRET distributions in Figures 2—4, Figure 2—figure supplement 5.
-
Figure 3—figure supplement 1—source data 1
Change in proportion of CXCR4 and ACKR3 FRET populations with ligand treatments.
- https://cdn.elifesciences.org/articles/100098/elife-100098-fig3-figsupp1-data1-v1.csv
Figure 4
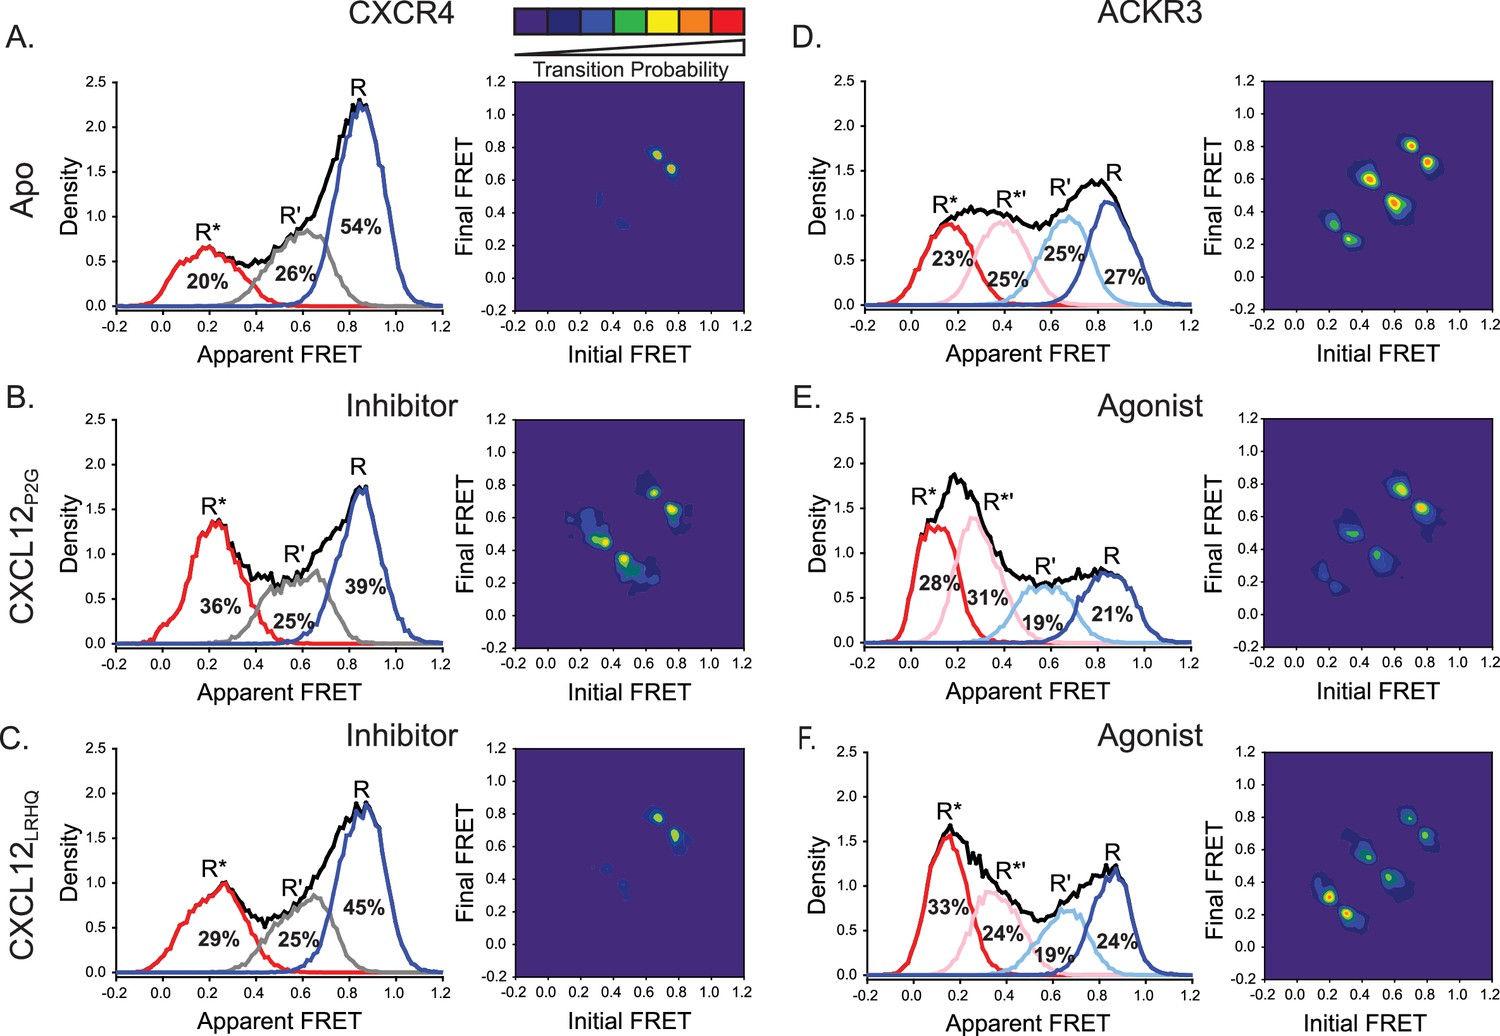
CXCL12 variants containing mutations to the N-terminus promoted active receptor conformations in both CXCR4 and ACKR3.
(A) FRET distributions and TDP for apo-CXCR4 repeated from Figure 2A for reference. (B) Addition of CXCL12P2G to CXCR4 promoted a shift to the low-FRET active (R*) conformation and an increase in state-to-state transition probabilities. (C) CXCL12LRHQ led to a more subtle shift to the R* conformation of CXCR4 without affecting the transition probabilities. (D) FRET distributions and TDP for apo-ACKR3 repeated from Figure 2C. (E) Treatment of ACKR3 with CXCL12P2G displayed a shift to low-FRET, R*’ and R* states, while reducing the transition probabilities for R’ ↔ R*’ and R*’ ↔ R* transitions relative to the apo-receptor. (F) CXCL12LRHQ treatment of ACKR3 shifted the FRET distribution to the low-FRET R* active state and promoted R*’ ↔ R* transitions relative to the apo-receptor. In all cases, the data sets represent the analysis of at least three independent experiments. The overall apparent FRET efficiency envelopes for the samples are represented by the black traces.
-
Figure 4—source data 1
Histograms for P2G CXCL12 CXCR4 FRET states.
- https://cdn.elifesciences.org/articles/100098/elife-100098-fig4-data1-v1.csv
-
Figure 4—source data 2
Contour map for P2G CXCL12 CXCR4 TDP.
- https://cdn.elifesciences.org/articles/100098/elife-100098-fig4-data2-v1.csv
-
Figure 4—source data 3
Histograms for LRHQ CXCL12 CXCR4 FRET states.
- https://cdn.elifesciences.org/articles/100098/elife-100098-fig4-data3-v1.csv
-
Figure 4—source data 4
Contour map for LRHQ CXCL12 CXCR4 TDP.
- https://cdn.elifesciences.org/articles/100098/elife-100098-fig4-data4-v1.csv
-
Figure 4—source data 5
Histograms for P2G CXCL12 ACKR3 FRET states.
- https://cdn.elifesciences.org/articles/100098/elife-100098-fig4-data5-v1.csv
-
Figure 4—source data 6
Contour map for P2G CXCL12 ACKR3 TDP.
- https://cdn.elifesciences.org/articles/100098/elife-100098-fig4-data6-v1.csv
-
Figure 4—source data 7
Histograms for LRHQ CXCL12 ACKR3 FRET states.
- https://cdn.elifesciences.org/articles/100098/elife-100098-fig4-data7-v1.csv
-
Figure 4—source data 8
Contour map for LRHQ CXCL12 ACKR3 TDP.
- https://cdn.elifesciences.org/articles/100098/elife-100098-fig4-data8-v1.csv
Figure 5 with 1 supplement
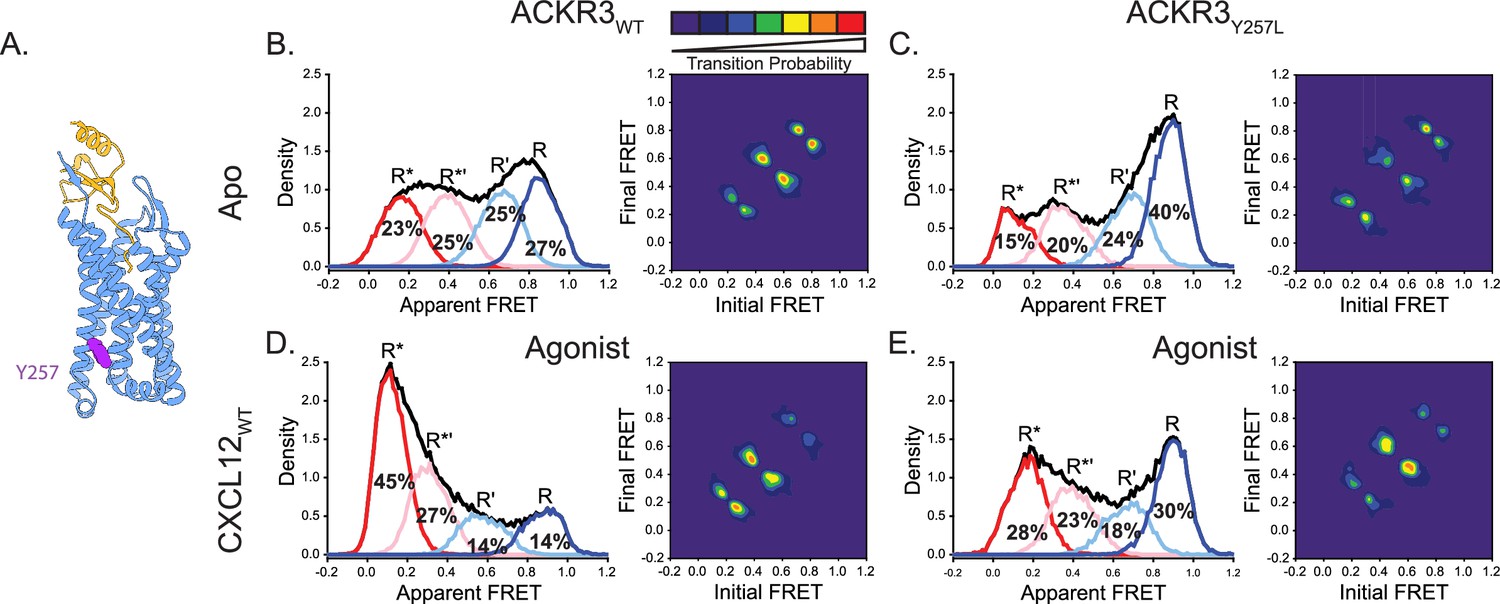
Replacement of Y2576.40 with the corresponding residue in CXCR4 (leucine) reduces conformational heterogeneity of ACKR3.
(A) Structure of ACKR3 bound with CXCL12WT (PDBID: 7SK3) highlighting the location of Y2576.40 (purple; Yen et al., 2022). (B) Apparent FRET efficiency distributions and TDP of WT ACKR3 in the apo-state, repeated from Figure 2C. (C) The mutation Y2576.40L shifted the conformational landscape of the apo-receptor to the high-FRET inactive R conformation at the expense of active R* and active-like R*’ conformations, and also reduced the probability of state-to-state transitions. (D) Apparent FRET efficiency distributions and TDP of WT ACKR3 treated with CXCL12WT, repeated from Figure 2D. (E) Treatment of Y2576.40L ACKR3 with CXCL12WT promoted more low-FRET active R* and active-like R*’ states. Data sets represent the analysis of at least three independent experiments. The overall apparent FRET efficiency envelopes for the samples are represented by the black traces.
-
Figure 5—source data 1
Histograms for Apo Y257L ACKR3 FRET states.
- https://cdn.elifesciences.org/articles/100098/elife-100098-fig5-data1-v1.csv
-
Figure 5—source data 2
Contour map for Apo Y257L ACKR3 TDP.
- https://cdn.elifesciences.org/articles/100098/elife-100098-fig5-data2-v1.csv
-
Figure 5—source data 3
Histograms for CXCL12 Y257L ACKR3 FRET states.
- https://cdn.elifesciences.org/articles/100098/elife-100098-fig5-data3-v1.csv
-
Figure 5—source data 4
Contour map for CXCL12 Y257L ACKR3 TDP.
- https://cdn.elifesciences.org/articles/100098/elife-100098-fig5-data4-v1.csv
Figure 5—figure supplement 1
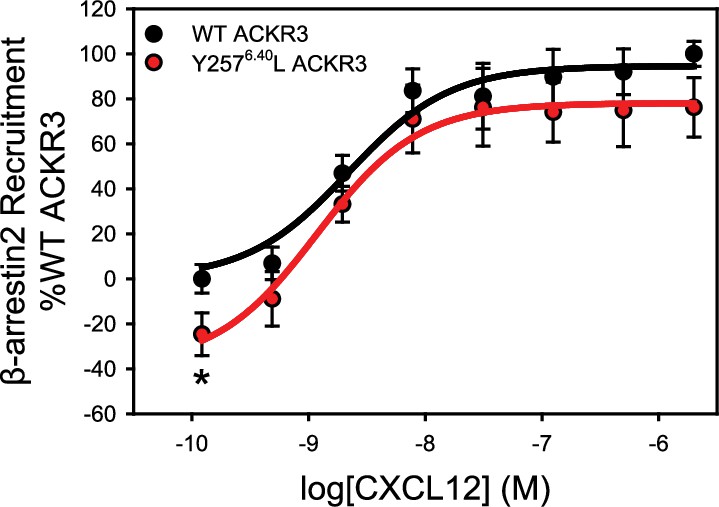
The mutation Y2576.40L reduces the constitutive activity of ACKR3.
β-arrestin2 recruitment to ACKR3 was detected by BRET between the rluc-tagged receptor and GFP10-tagged arrestin. The data represent the mean of three independent experiments measured in triplicate with error bars reflecting the standard deviation. Statistical significance determined by unpaired t-test, *p<0.05. The plot recapitulates similar data presented previously in Yen et al., 2022 and is included here for reference.
-
Figure 5—figure supplement 1—source data 1
Arrestin recruitment measurements to WT and Y257L ACKR3 across CXCL12 concentrations.
- https://cdn.elifesciences.org/articles/100098/elife-100098-fig5-figsupp1-data1-v1.xlsx
Figure 6 with 1 supplement
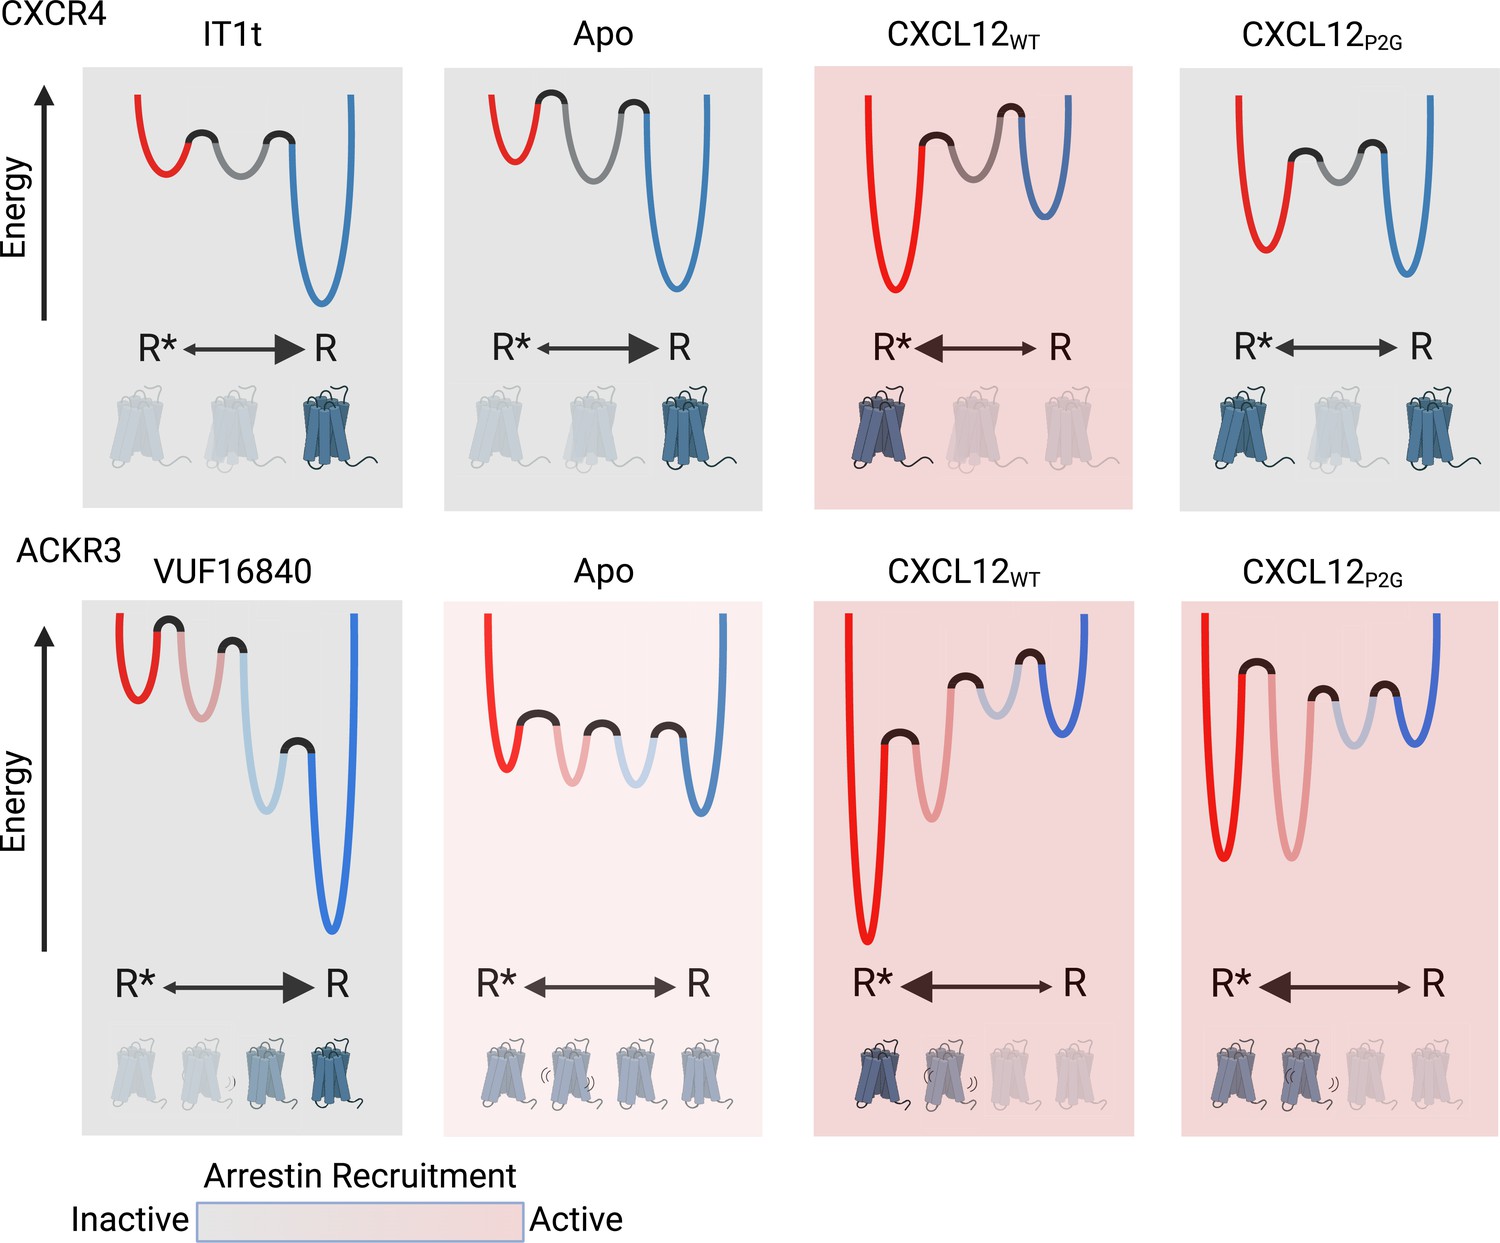
Schematic illustration of the conformational energy landscapes for CXCR4 and ACKR3, highlighting the differences in the responsiveness of the two receptors to ligands.
CXCR4 populates three distinct conformations, shown here as wells on the energy landscape. Apo-CXCR4 is predominantly in the inactive R state. The receptor is converted incompletely to R* with CXCL12WT treatment, while the small molecule inhibitor IT1t has little impact on the conformational distribution. Though CXCL12P2G is an antagonist of CXCR4, the ligand promoted a detectable shift to the active R* state, suggesting TM6 movement is not sufficient for CXCR4 activation. In contrast, ACKR3 populates four distinct conformations and shows little preference among them in the apo-form. The inverse agonist, VUF16840, shifts the population to the inactive R conformation, while the agonists CXCL12WT and CXCL12P2G promote the R* and R*’ populations of ACKR3. Despite stabilizing different levels of the active R* state and active-like intermediate R*’ state, both CXCL12WT and CXCL12P2G are agonists of ACKR3. The flexibility of ACKR3 may contribute to the ligand-promiscuity of this atypical receptor. Figure created with BioRender.com.
Figure 6—figure supplement 1
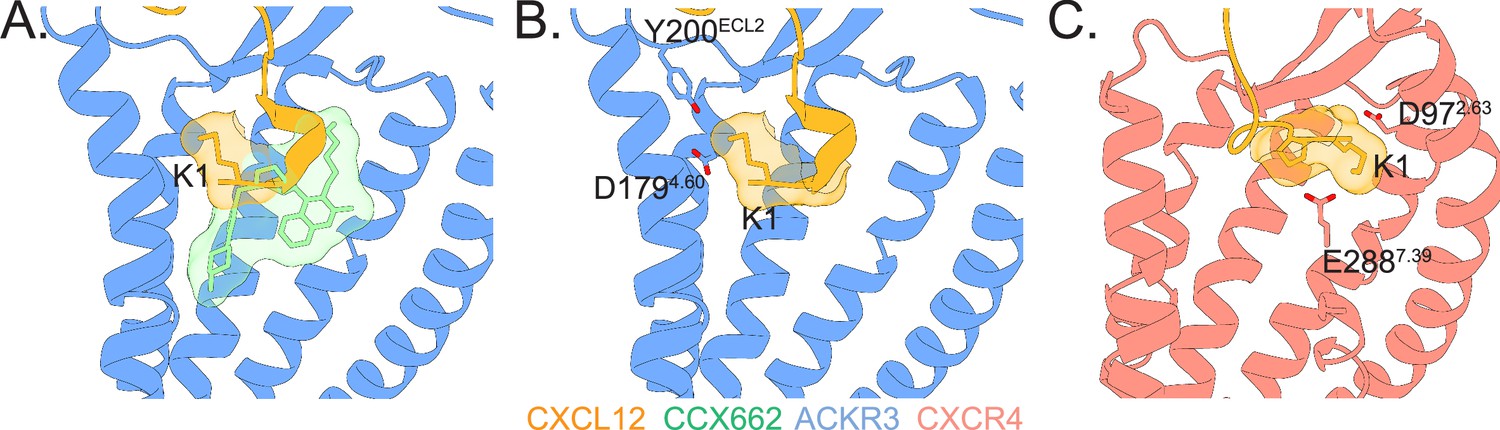
Agonist-receptor interaction networks in ACKR3 and CXCR4.
(A) Structures of ACKR3 (blue) bound to CXCL12 (gold, PDB ID 7SK3) or the small molecule agonist CCX662 (green, PDB ID 7SK8) reveal multiple modes of receptor activation (Yen et al., 2022). (B) When CXCL12 binds ACKR3, the chemokine N-terminus is oriented to position CXCL12-K1 towards ACKR3-D1794.60 and ACKR3-Y200ECL2 near where the chemokine backbone enters the orthosteric binding pocket. (C) In contrast, when bound to CXCR4, the N-terminus of CXCL12 is predicted to be in an extended conformation and positions CXCL12-K1 to interact with CXCR4-D972.63 and CXCR4-E2887.39. The precise positioning of K1 appears critical, as mutation of P2 of CXCL12, which is surmised to orient K1, converts the agonist into an antagonist (Ngo et al., 2020; Wescott et al., 2016). The model of CXCR4 was adapted from Ngo et al., 2020 and Stephens et al., 2020.
Additional files
Download links
A two-part list of links to download the article, or parts of the article, in various formats.
Downloads (link to download the article as PDF)
Open citations (links to open the citations from this article in various online reference manager services)
Cite this article (links to download the citations from this article in formats compatible with various reference manager tools)
Distinct activation mechanisms of CXCR4 and ACKR3 revealed by single-molecule analysis of their conformational landscapes
eLife 13:RP100098.
https://doi.org/10.7554/eLife.100098.3


