Targeting IRE1α improves insulin sensitivity and thermogenesis and suppresses metabolically active adipose tissue macrophages in male obese mice
- Department of Genetics, Heersink School of Medicine, UAB Comprehensive Diabetes Center, University of Alabama at Birmingham, United States
- Department of Medicine, Division of Endocrinology, The University of Oklahoma Health Sciences Center, United States
- Indian Springs School, United States
- Department of Physiology, Harold Hamm Diabetes Center, The University of Oklahoma Health Sciences Center, United States
Figures
Figure 1 with 1 supplement
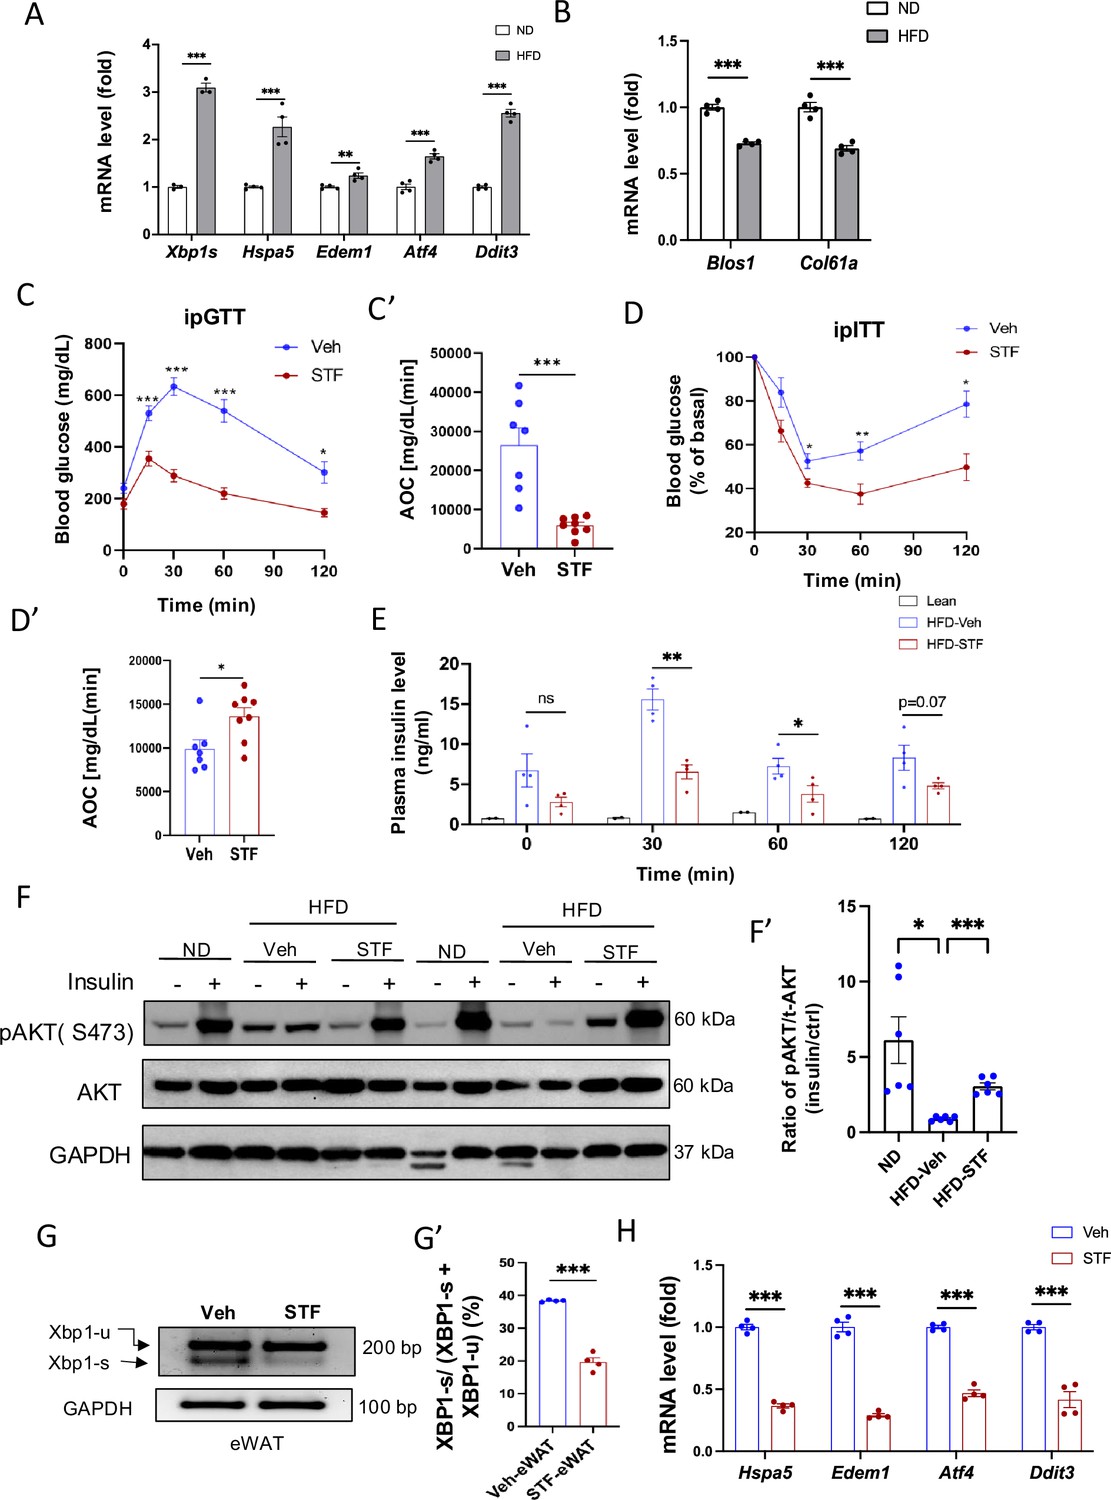
IRE1α inhibitor STF improves glucose tolerance and insulin sensitivity in DIO mice.
(A) mRNA levels of ER stress genes in the eWAT from mice fed ND (normal diet) and HFD for 14 weeks, assessed by qRT-PCR. The results are expressed as fold change and are representative of 3 independent experiments. (B) mRNA levels of IRE1α RIDD target genes in the eWAT from mice fed ND and HFD for 14 weeks, assessed by qRT-PCR. The results are expressed as fold change and are representative of 3 independent experiments. (C-C’) Glucose tolerance test on mice treated with vehicle (n=7) or STF (n=8) at two weeks of treatment. Blood glucose levels (C) measured at indicated time points after intraperitoneal injection of glucose (1.5 g/kg body weight) following 6 h fasting and AOC area of the curve, (C’). (D–D′) Insulin tolerance test on mice treated with vehicle (n=7) or STF (n=8) at three weeks of treatment. Blood glucose levels (C) normalized to basal level at indicated time points after intraperitoneal injection of insulin (1.2 IU/kg body weight) following 6 h fasting and the AOC (area of the curve, D′). (E) Plasma insulin levels at indicated time points after intraperitoneal injection of glucose (3 g/kg body weight) following 6 h fasting at 3.5 weeks of treatment. F-F’. Protein levels of pAKT (Ser473) and total AKT in eWAT of ND mice or DIO mice treated with vehicle or STF, analyzed with Western blotting (F). GAPDH as a loading control. Fasted mice were IP injected with either saline or insulin and scarified after 15 min and eWATs were collected. The data shown are representative of 3 independent experiments. Quantitative analysis of immunoblots was performed (F’). G-G’. Splicing of Xbp1 mRNA was analyzed from eWAT of DIO mice treated with vehicle or STF by RT-PCR and resolved by agarose gel electrophoresis. The full length (unspliced, XBP1-u) and spliced (XBP1-s) forms of Xbp1 mRNA were indicated (G) and quantified with t-XBP1 as the sum of XBP1-u and XBP1-s (G’). GAPDH mRNA was used as an internal control. The data shown are representative of 3 independent experiments. (H) mRNA levels for indicated genes were analyzed in eWAT of DIO mice treated with vehicle or STF by qRT-PCR. The results were expressed as fold change and were representative of 3 independent experiments. Data were expressed as mean ± SEM and analyzed using the unpaired two-tailed Student’s t-test between two samples or ANOVA with multiple comparisons. ∗P<0.05, ∗∗P<0.01, and ∗∗∗P<0.001.
-
Figure 1—source data 1
Western blot membrane images and Xbp1 splicing gel image in eWAT without labeling.
- https://cdn.elifesciences.org/articles/100581/elife-100581-fig1-data1-v1.zip
-
Figure 1—source data 2
Western blot membrane images and Xbp1 splicing gel image in eWAT with labeling.
- https://cdn.elifesciences.org/articles/100581/elife-100581-fig1-data2-v1.zip
Figure 1—figure supplement 1
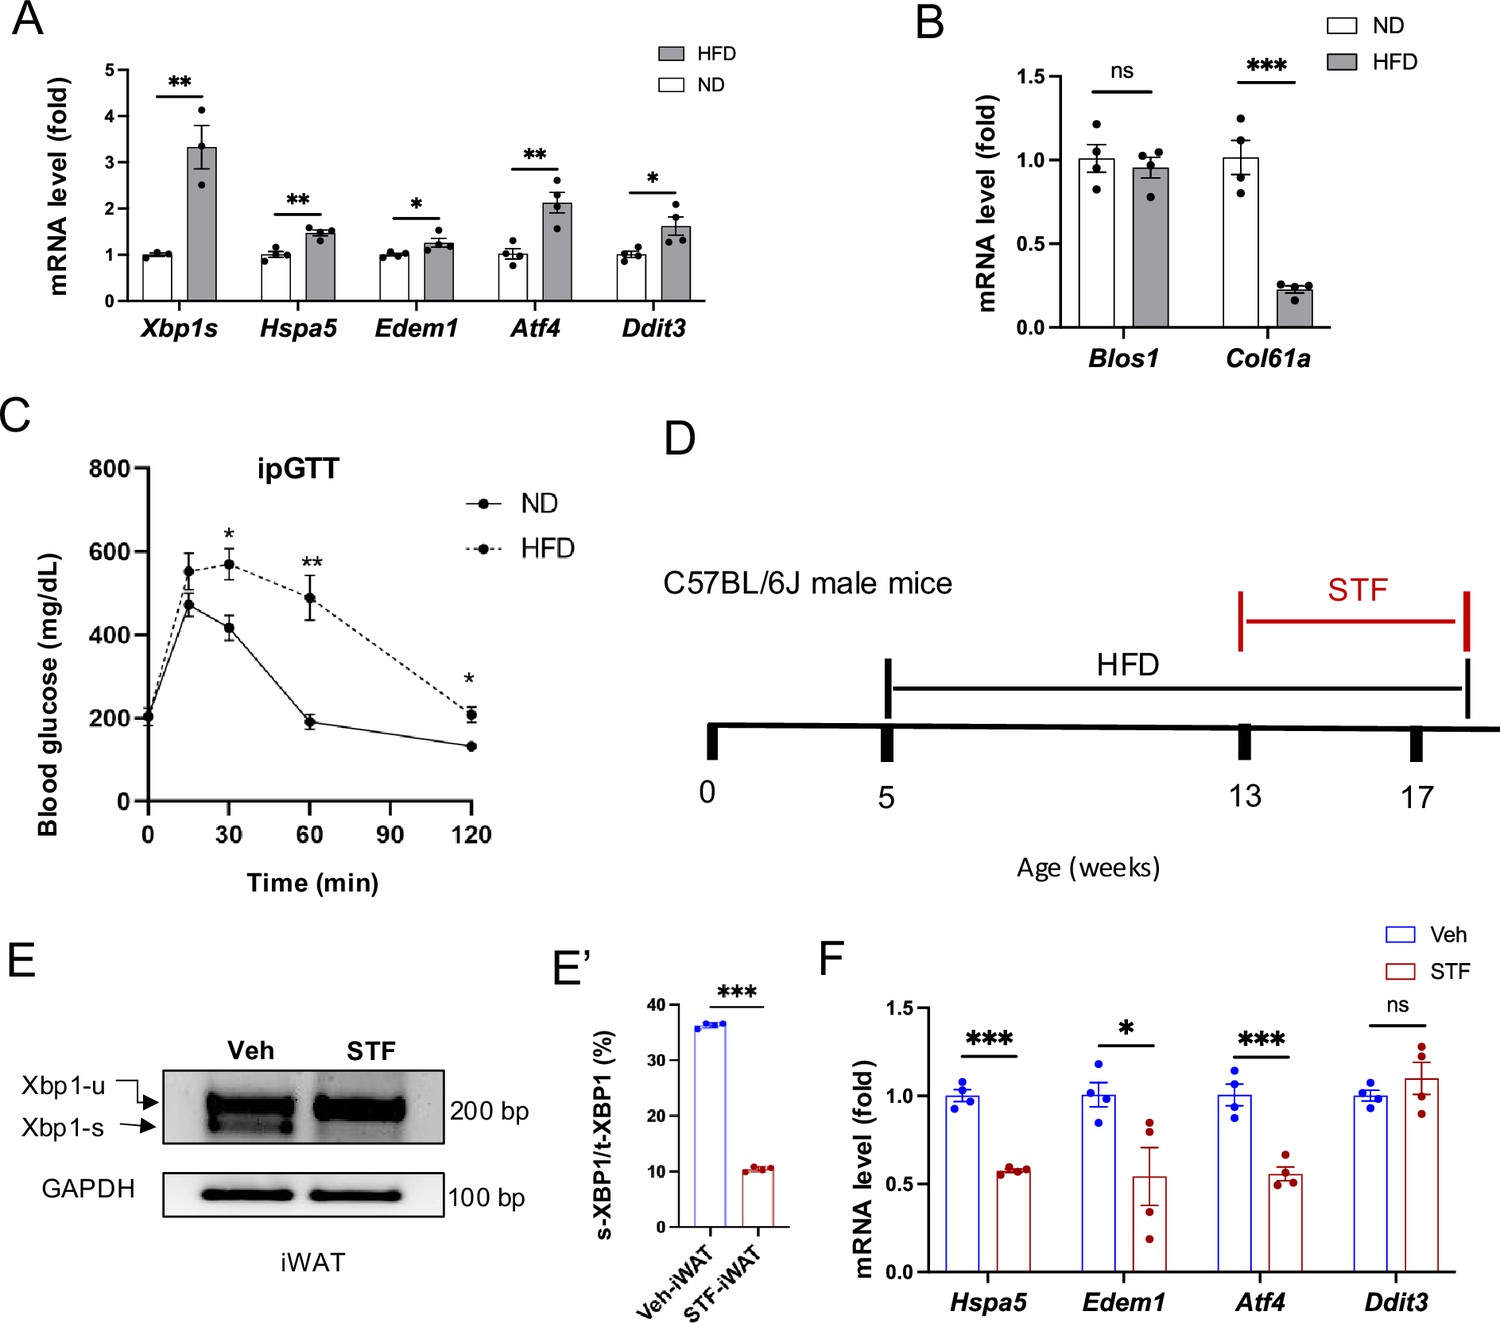
ER stress and IRE1α activation in adipose tissues in DIO mice.
(A–B) mRNA levels of ER stress genes (A) and of IRE1α RIDD target genes (B) in the eWAT from mice fed ND (normal diet) and HFD for 14 weeks, assessed by qRT-PCR. The results are expressed as fold change and are representative of 3 independent experiments. C. Glucose tolerance test performed on mice on ND and HFD for 8 weeks. Blood glucose levels measured at indicated time points after intraperitoneal injection of glucose (1.5 g/kg body weight) following 6 h fasting. (D) Timelines of HFD and drug treatments. (E-E’) XBP1 mRNA levels were analyzed from eWAT of DIO mice treated with vehicle or STF by RT-PCR and resolved by agarose gel electrophoresis. The full length (unspliced, XBP1-u) and spliced (XBP1-s) forms of XBP1 mRNA were indicated (E) and quantified (E’). GAPDH mRNA was used as an internal control. The data shown are representative of 3 independent experiments. (F) mRNA levels for indicated genes were analyzed in eWAT of DIO mice treated with vehicle or STF by qRT-PCR. The results are expressed as fold change and are representative of 3 independent experiments. Data are expressed as mean ± SEM. ∗P<0.05, ∗∗P<0.01, and ∗∗∗P<0.001.
-
Figure 1—figure supplement 1—source data 1
Xbp1 splicing gel image in iWAT without labeling.
- https://cdn.elifesciences.org/articles/100581/elife-100581-fig1-figsupp1-data1-v1.zip
-
Figure 1—figure supplement 1—source data 2
Xbp1 splicing gel image in iWAT with labeling.
- https://cdn.elifesciences.org/articles/100581/elife-100581-fig1-figsupp1-data2-v1.zip
Figure 2
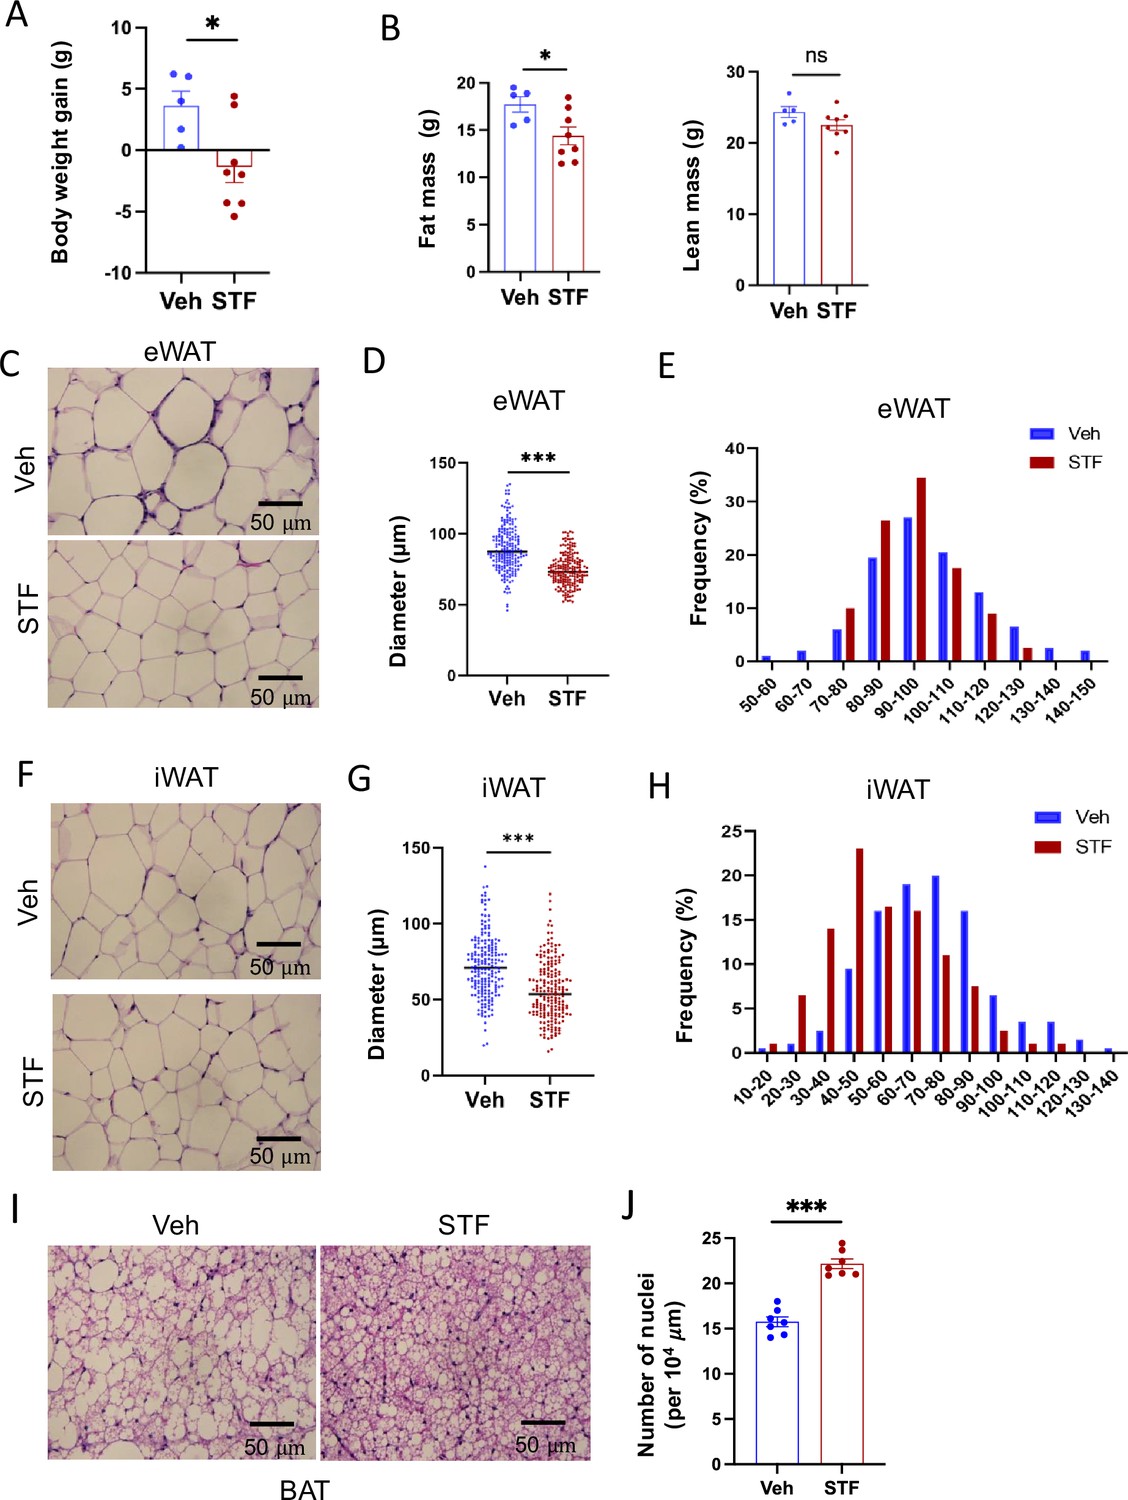
STF protects against diet-induced adiposity and obesity.
(A) Body weight gain of DIO mice treated with vehicle (n=5) or STF (n=8) for 4 weeks. (B) Fat mass and lean mass of DIO mice treated with vehicle or STF, assessed at the end of 4-week treatment by EchoMRI. (C–E) eWAT adipocytes. Representative images of H&E staining of eWAT sections (C). Average diameter of adipocytes (μM)/field (D) and size distribution (E) in eWAT. (F–H) iWAT adipocytes. Representative images of H&E staining of iWAT sections (F). Average diameter of adipocytes (μM)/field (G) and size distribution (H) in iWAT. (I) Representative images of H&E staining of BAT. (J) Measurement of number of BAT nuclei. Data were expressed as mean ± SEM and analyzed using the unpaired two-tailed Student’s t-test between two samples or ANOVA with multiple comparisons. ∗p<0.05, ∗∗p<0.01, and ∗∗∗p<0.001.
Figure 3
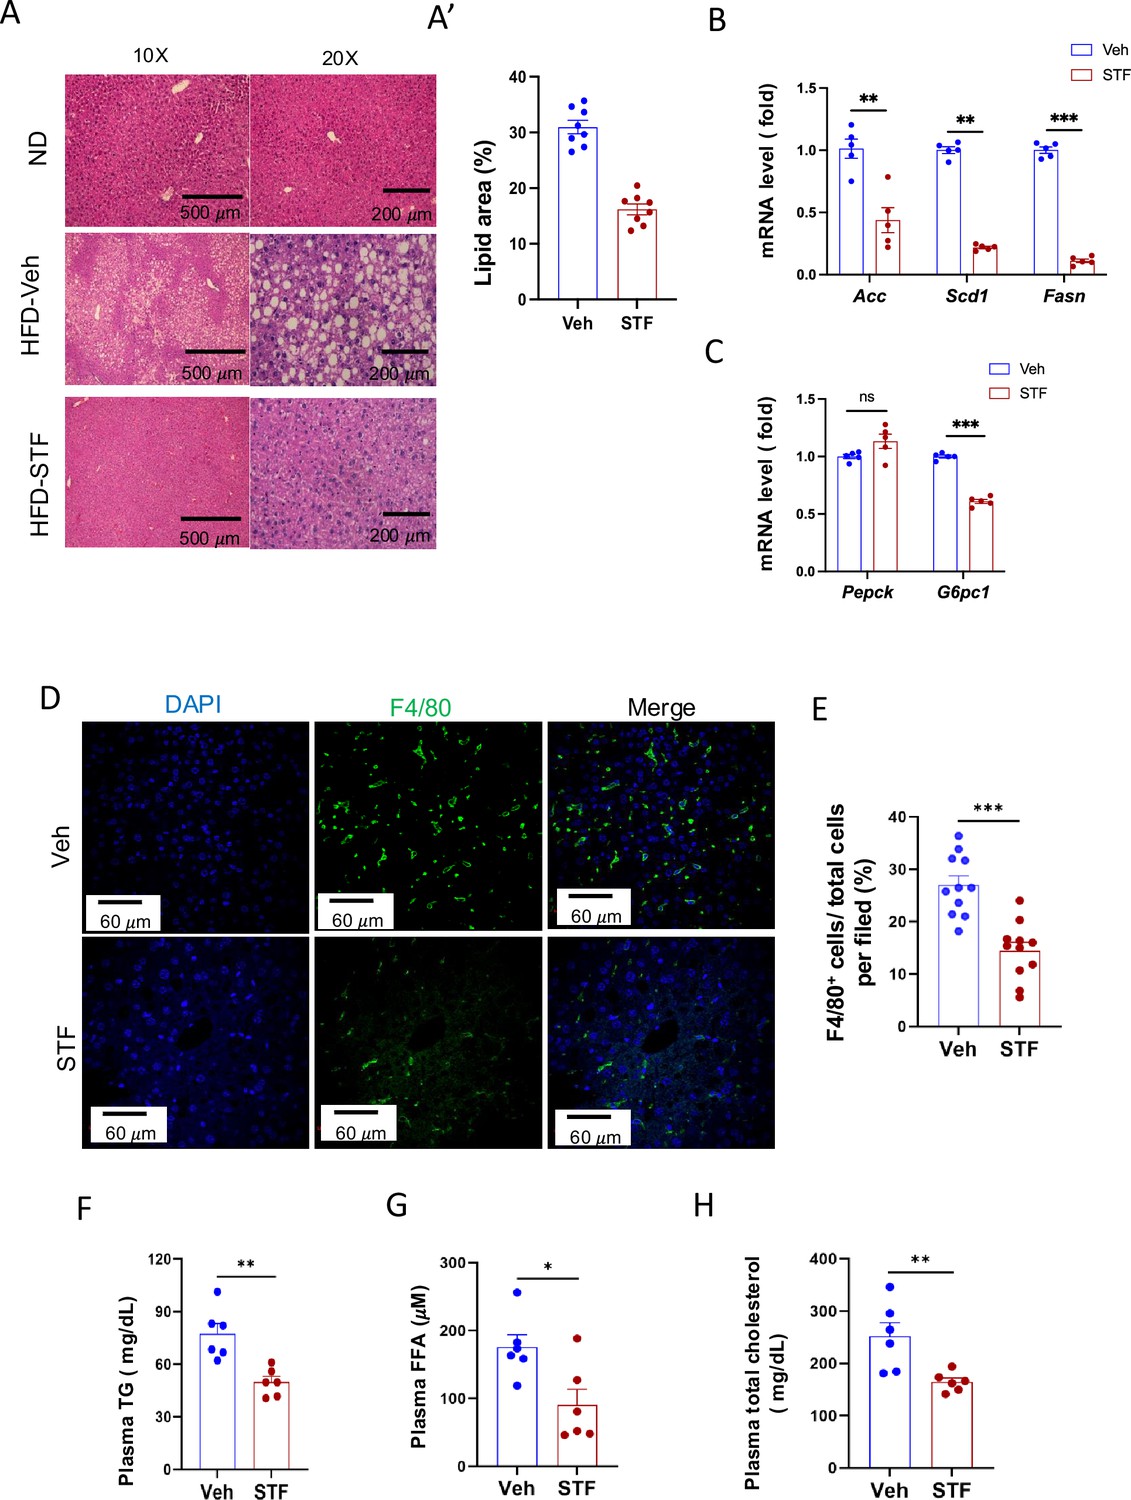
STF treatment improves liver steatosis and dyslipidemia in DIO mice.
(A-A’) Liver histology. Representative images of H&E of liver sections from mice of ND and HFD treated with vehicle or STF (A). The quantification of lipid area in liver samples (A’). (B) mRNA levels of lipogenic genes in livers from DIO mice treated with vehicle or STF, assessed by qRT-PCR. The results are expressed as fold change and are representative of three independent experiments. (C) mRNA levels of gluconeogenic genes in livers from DIO mice treated with vehicle or STF, assessed by qRT-PCR. The results are expressed as fold change and are representative of three independent experiments. (D–E) Immunofluorescent staining of F4/80 in liver. Representative images of staining (D) and percentage of number of F4/80-positive cells over total cells/field (E). (F–H) The levels of serum TG (F), FFA (G) and total cholesterol (H) were analyzed by respective ELISA kits. Blood samples were collected upon euthanization at the end of treatment. Data were expressed as mean ± SEM and analyzed using the unpaired two-tailed Student’s t-test between two samples or ANOVA with multiple comparisons. ∗p<0.05, ∗∗p<0.01, and ∗∗∗p<0.001.
Figure 4 with 2 supplements
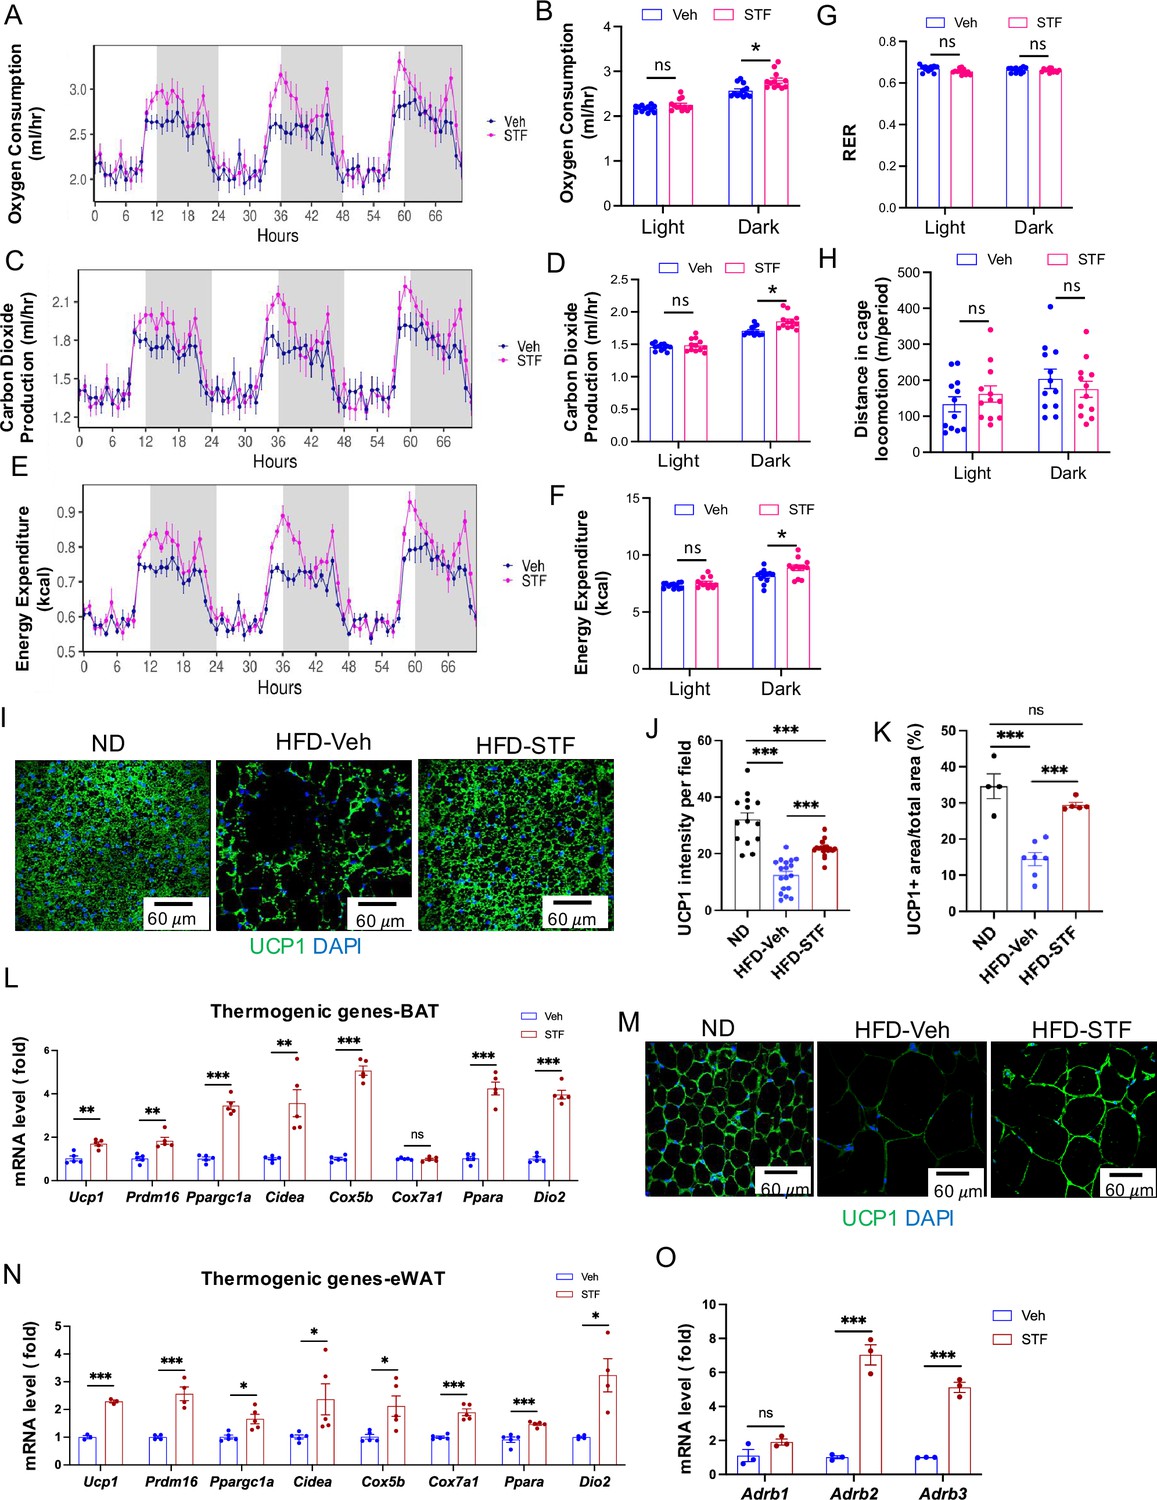
STF promotes energy expenditure and thermogenesis in DIO mice.
(A–B) Curves (A) and quantification (B) of oxygen consumption levels. (C-D). Curves (C) and quantification (D) of CO2 production levels. (E–F) Curves (E) and quantification (F) of energy expenditure levels calculated. For A-F, the data was analyzed for group effect (ANOVA) along with the mass and interaction effects as necessary (generalized linear model, GLM). (G) RER (respiratory exchange ratio) level. (H) Daily activity (m of running distance/mouse). (I–K) UCP1 immunofluorescence staining of BAT sections from ND-fed mice and DIO mice treated with vehicle or STF. Representative images of UCP1 immunofluorescence staining of BAT (I), quantification of immune-signal intensity of UCP1 (J), and quantification of UCP1-positive area (K). (L) mRNA levels of thermogenic genes in BAT from DIO mice treated with vehicle or STF, assessed by qRT-PCR. The results are expressed as fold change and are representative of three independent experiments. (M) Representative images of UCP1 immunofluorescence staining of eWAT sections from ND-fed mice and DIO mice treated with vehicle or STF. (N) mRNA levels of thermogenic genes in eWAT from DIO mice treated with vehicle or STF, assessed by qRT-PCR. The results are expressed as fold change and are representative of three independent experiments. (O) mRNA levels of β-adrenoceptor genes in BAT from DIO mice treated with vehicle or STF, assessed by qRT-PCR. The results were expressed as fold change and are representative of three independent experiments. Data for G-O were expressed as mean ± SEM and analyzed using the unpaired two-tailed Student’s t-test between two samples or ANOVA with multiple comparisons. ∗p<0.05, ∗∗p<0.01, and ∗∗∗p<0.001.
Figure 4—figure supplement 1
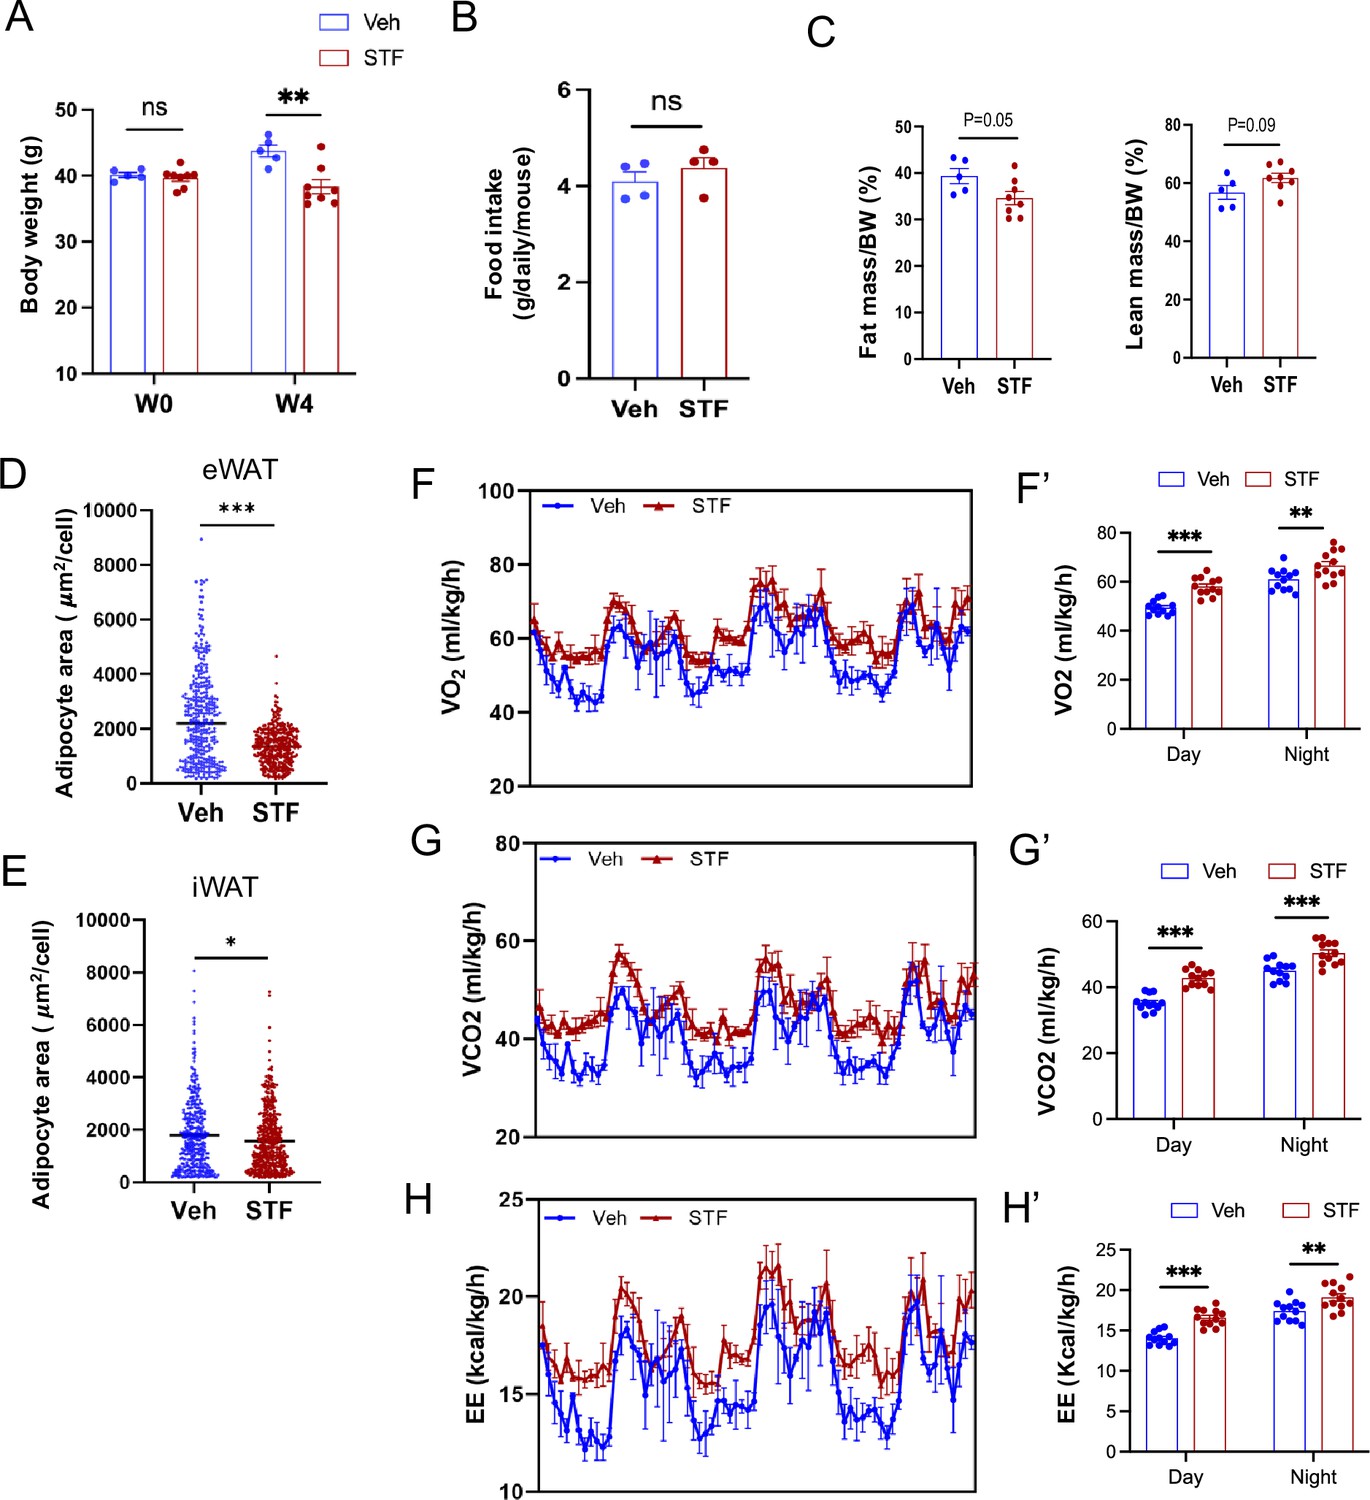
STF protects against diet-induced obesity and promotes energy expenditure.
(A) Body weight of DIO mice treated with vehicle (n=5) or STF (n=8) before and after treatment for 4weeks. (B) Daily food intake from DIO mice treated with vehicle or STF, measured for 3 consecutive days. (C) Percentages of fat mass and lean mass over body weight. D-E. Adipocyte area per cell in the sections of eWAT (D) and iWAT (E). (F-F’) Curves (F) and quantification (F’) of oxygen consumption levels. (G-G’) Curves (G) and quantification (G’) of CO2 production levels. H-H’. Curves (H) and quantification (H’) of energy expenditure levels calculated. For (F-H’), the data was normalized by body weight for analysis for group effect. Data were represented as mean ± SEM and analyzed using the unpaired two-tailed Student’s t-test between two samples or ANOVA with multiple comparisons. ∗p<0.05, ∗∗p<0.01, and ∗∗∗p<0.001.
Figure 4—figure supplement 2
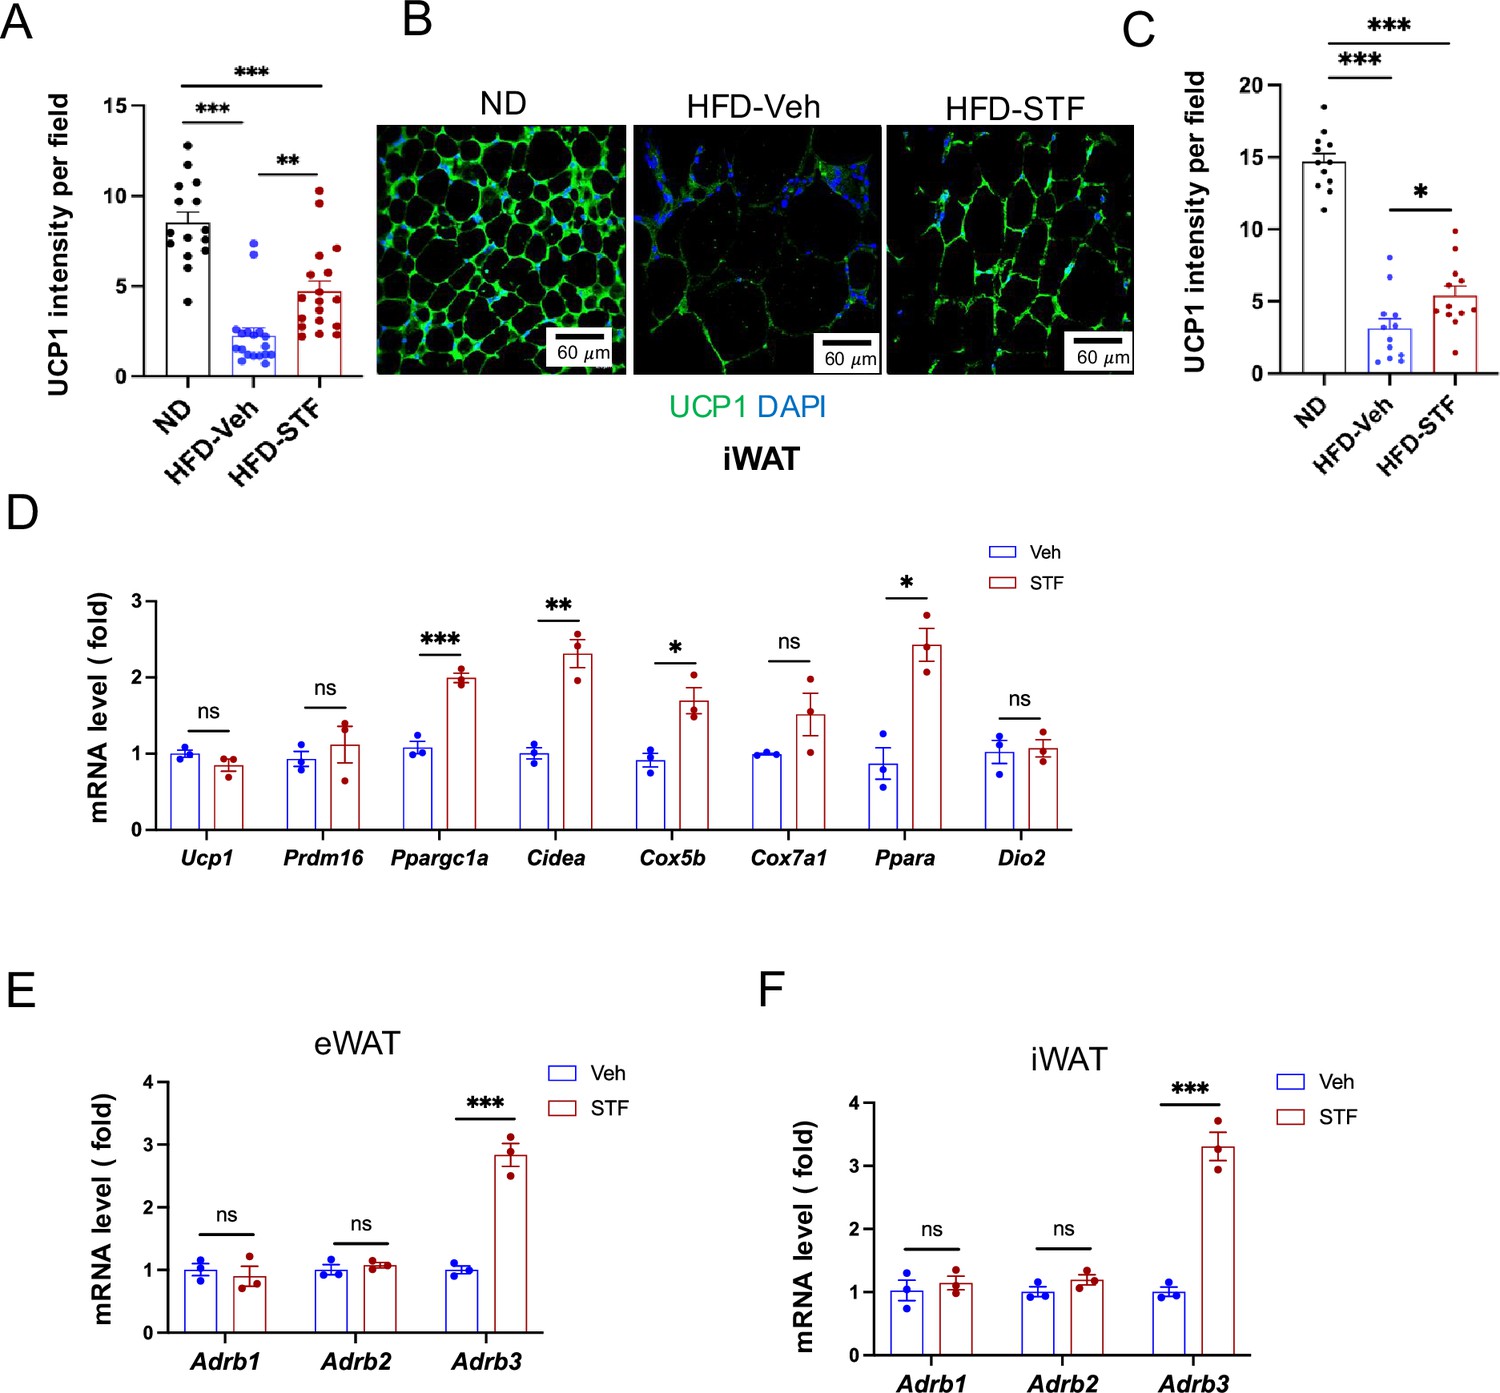
STF promotes thermogenesis in WAT of DIO mice.
(A) Quantification of immune-signal intensity of UCP1 in eWAT sections from ND mice and DIO mice treated with vehicle or STF. (B–C) UCP1 immunofluorescence staining of iWAT sections from ND-fed mice and DIO mice treated with vehicle or STF. Representative images of UCP1 immunofluorescence staining of iWAT (B) and quantification of immune-signal intensity of UCP1 (C). (D) mRNA levels of thermogenic genes in iWAT from DIO mice treated with vehicle or STF, assessed by qRT-PCR. The results are expressed as fold change and are representative of three independent experiments. (E–F) mRNA levels of β-adrenoceptor genes in eWAT (E) and iWAT (F) from DIO mice treated with vehicle or STF, assessed by qRT-PCR. The results are expressed as fold change and are representative of three independent experiments. Data are the mean ± SEM. ∗p<0.05, ∗∗p<0.01, and ∗∗∗p<0.001.
Figure 5 with 2 supplements

STF treatment suppresses ATM accumulation and adipose inflammation in DIO mice.
(A) Percentage of CLS area in eWAT sections from DIO mice treated with vehicle or STF. (B–C) Immunofluorescent staining of F4/80 in the eWAT sections of DIO mice treated with vehicle or STF. Representative images of F4/80 in eWAT (B) and percentage of the number of F4/80-positive cells over total cells/field (C). (D) mRNA levels of total macrophage marker genes in the SVF of eWAT from DIO mice treated with vehicle or STF, assessed by qRT-PCR. The results are expressed as fold change and are representative of three independent experiments. (E) Flow cytometry of total ATMs from eWAT SVFs of ND mice (n=4) and DIO mice treated with vehicle (n=4) or STF(n=4), gated against CD11b and F4/80 antibodies. Complete gating path was shown in Figure 5—figure supplement 2A. (F) Flow cytometry analysis of CD11C-positive/negative ATMs (F4/80+CD11b+CD11C+/-) from eWAT SVFs of mice with an overlay of gated CD11C marker for ND (yellow), HFD-Veh (blue) and HFD-STF (pink) shown. Data in Y-axis was presented as ‘Normalized to mode’ for percentages. Complete gating path was shown in Figure 5—figure supplement 2A. (G) Flow cytometry of ‘M1-like’ and ‘M2-like’ subsets of ATMs from eWAT SVFs of ND, HFD-Veh and HFD-STF mice, gated against CD11c and CD206 antibodies. Complete gating path was shown in Figure 5—figure supplement 2A. (H) mRNA levels of indicated proinflammatory cytokine/chemokine genes in the SVF of eWAT of DIO mice treated with vehicle or STF, assessed by qRT-PCR. The results are expressed as fold change and are representative of three independent experiments. (I) mRNA levels of indicated proinflammatory cytokine/chemokine genes in the indicated sorted cells from SVFs of eWAT of DIO mice, assessed by qRT-PCR. The results are expressed as fold change and are representative of three independent experiments. (J) mRNA levels of indicated proinflammatory cytokine/chemokine genes in the CD11C+ ATMs (F4/80+CD11b+CD11C+) sorted from SVFs of eWAT of DIO mice treated with vehicle or STF, assessed by qRT-PCR. The results were expressed as fold change and were representative of three independent experiments. Data were expressed as mean ± SEM and analyzed using the unpaired two-tailed Student’s t-test between two samples or ANOVA with multiple comparisons. ∗p<0.05, ∗∗p<0.01, and ∗∗∗p<0.001.
Figure 5—figure supplement 1
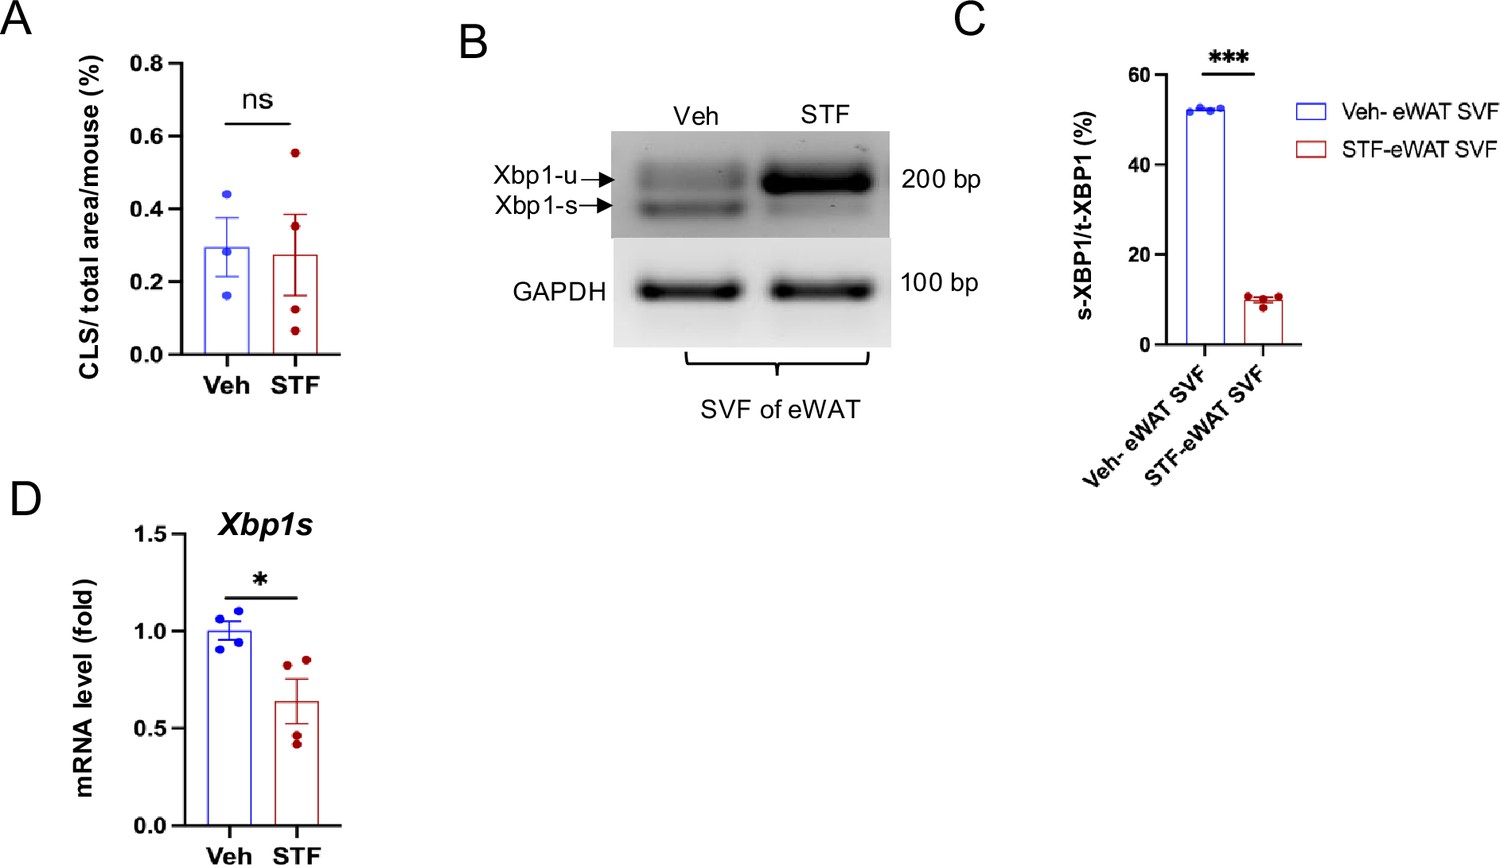
STF inhibits IRE1αactivity in the SVF of obese eWAT.
-
Figure 5—figure supplement 1—source data 1
Xbp1 splicing gel image in SVF of eWAT without labeling.
- https://cdn.elifesciences.org/articles/100581/elife-100581-fig5-figsupp1-data1-v1.zip
-
Figure 5—figure supplement 1—source data 2
Xbp1 splicing gel image in SVF of eWAT with labeling.
- https://cdn.elifesciences.org/articles/100581/elife-100581-fig5-figsupp1-data2-v1.zip
Figure 5—figure supplement 2

STF suppresses obesity-driven ATM accumulation and adipose inflammation.
(A) Representative pseudocolor cell density flow cytometry plots showing the gating strategy used for analysis of macrophage subsets (F4/80+ CD11b+) of SVFs of eWAT from ND-fed mice and DIO mice treated vehicle or STF, for figures shown in Figure 5E. For Figures 5F, G, I, J, 6H–N and Figure 7G, markers were further gated immediately following the steps shown here. Numbers indicate percentage of gated cells. (B) Flow cytometry analysis of CD206 signal in CD11c+ ATMs (F4/80+CD11b+CD11C+) from eWAT SVFs of mice with an overlay of gated CD206 marker for ND and HFD. Data in Y-axis was presented as ‘Normalized to mode’ for percentages. Complete gating path follows the strategy shown in A. (C) mRNA levels of indicated proinflammatory cytokine/chemokine genes in the SVFs of iWAT of DIO mice treated with vehicle or STF, assessed by qRT-PCR. The results are expressed as fold change and are representative of three independent experiments. (D) mRNA levels of splice Xbp1 in the CD11C+ ATMs (F4/80+CD11b+CD11C+) sorted from SVFs of eWAT of DIO mice treated with vehicle or STF, assessed by qRT-PCR. The results are expressed as fold change and are representative of three independent experiments. Data are the mean ± SEM. ∗p<0.05, ∗∗p<0.01, and ∗∗∗p<0.001.
Figure 6 with 2 supplements
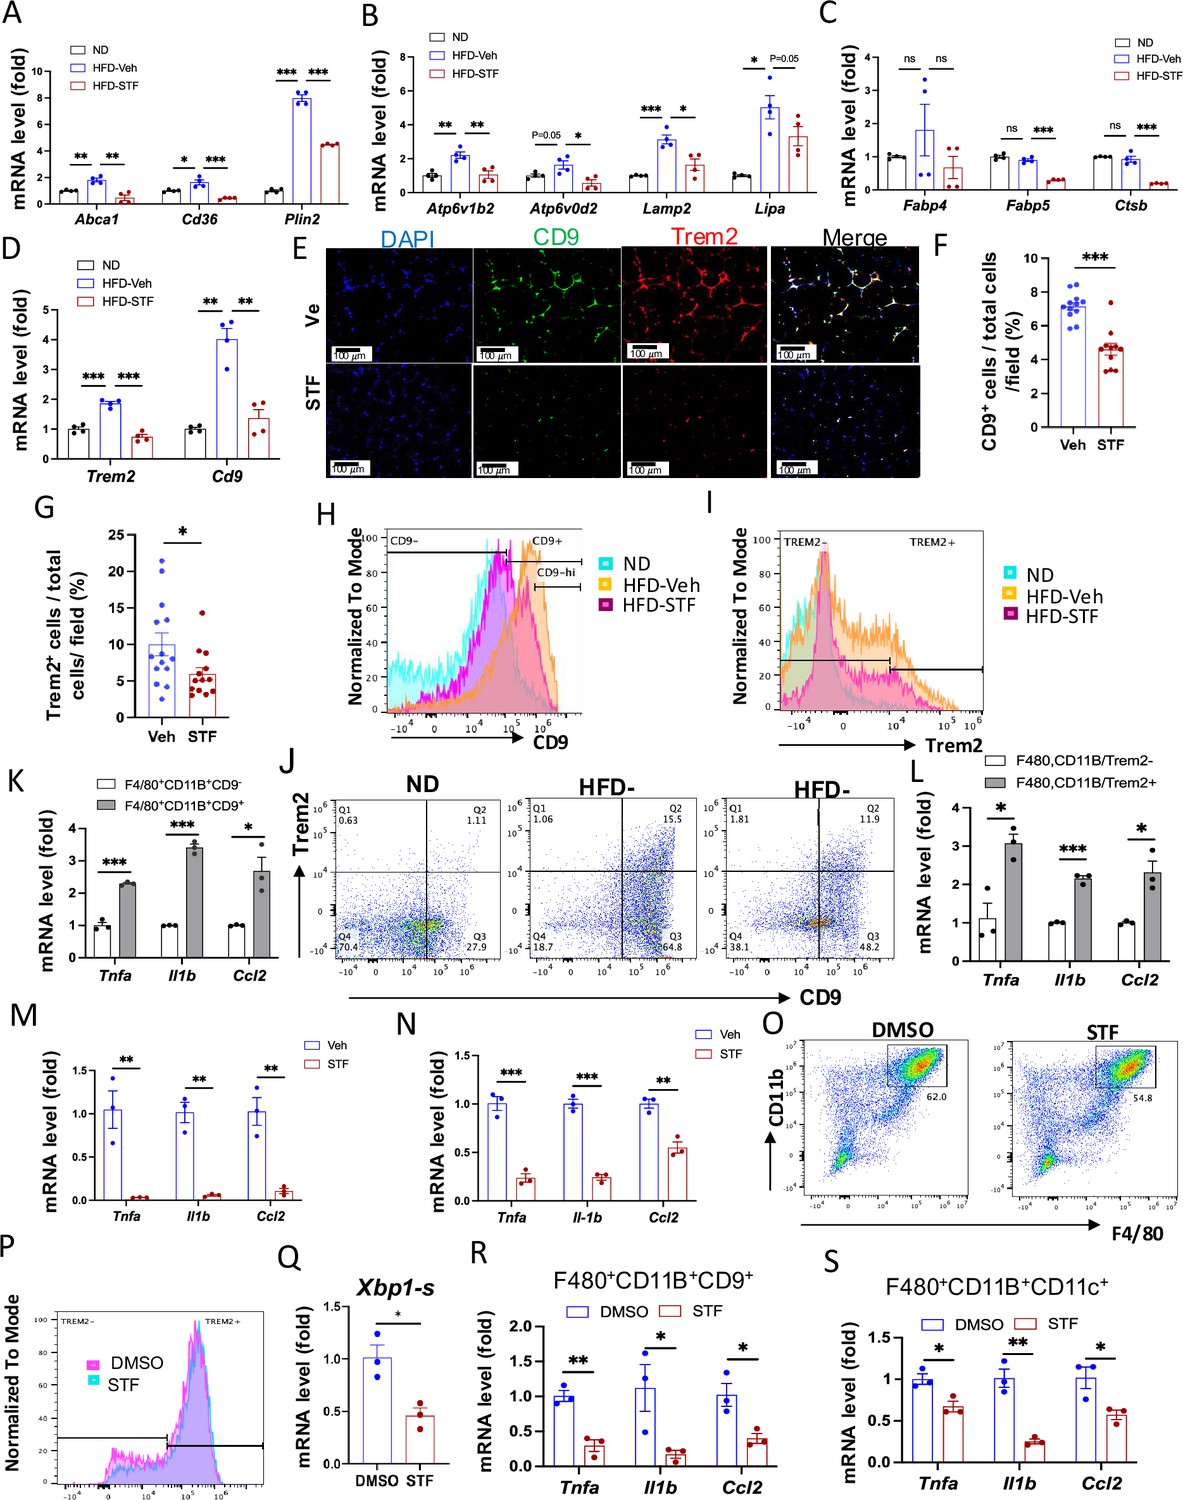
STF suppresses the accumulation of metabolically active CD9 or Trem2-expressing ATMs in obesity.
(A–D) mRNA levels of indicated genes in the SVFs of eWAT from ND, HFD-veh and HFD-STF mice, assessed by qRT-PCR. The results are expressed as fold change and are representative of three independent experiments. (E–G) Immunofluorescent staining of CD9 and Trem2 in the eWAT sections of DIO mice treated with vehicle or STF. Representative images shown (E) and percentages of the numbers of CD9-positive cells (F) and Trem2-positive cells (G) over total cells/field. (H) Analysis of CD9-positive ATMs (F4/80+CD11b+CD9+) from eWAT SVFs of mice with an overlay of gated CD9 marker for ND (blue), HFD-Veh (yellow) and HFD-STF (pink) shown. Data in Y-axis was presented as ‘Normalized to mode’ for percentages. Complete gating path was shown in Figure 5—figure supplement 2A. (I) Analysis of Trem2-positive ATMs (F4/80+CD11b+Trem2+) from eWAT SVFs of mice with an overlay of gated Trem2 marker for ND (blue), HFD-Veh (yellow) and HFD-STF (pink) shown. Data in Y-axis was presented as ‘Normalized to mode’ for percentages. Complete gating path was shown in Figure 5—figure supplement 2A. (J) Flow cytometry analysis of CD9+ and Trem2+ ATMs from eWAT SVFs of ND, HFD-Veh and HFD-STF mice, gated against CD9 and Trem2 antibodies. Complete gating path was shown in Figure 5—figure supplement 2A. (K–L) mRNA levels of indicated proinflammatory genes in the indicated cells sorted from SVFs of eWAT of DIO mice, assessed by qRT-PCR: for CD9+ vs CD9- ATMs (K) and for Trem2+ vs Trem2- ATMs (L). The results are expressed as fold change and are representative of three independent experiments. M-N. mRNA levels of indicated proinflammatory cytokine/chemokine genes in the CD9+ ATMs (F4/80+CD11b+CD9+) (M) and the Trem2+ ATMs (F4/80+CD11b+Trem2+) (N) sorted from SVFs of eWAT of DIO mice treated with vehicle or STF, assessed by qRT-PCR. The results were expressed as fold change and are representative of three independent experiments. O-P. Flow cytometry analysis of ATMs from SVFs of the eWAT from 20-week HFD-fed mice. SVFs were cultured and treated with 0.01% DMSO control or STF (30 μM) for 20 hr followed by staining and flow analysis, gated against F4/80 and CD11b antibodies (O) and further gated against Trem2 antibody (P). Data in Y-axis in P was presented as ‘Normalized to mode’ for percentages. The gating path followed the one as Figure 5—figure supplement 2A. Q-S. mRNA levels of indicated genes in CD9+ ATMs (Q and R) and in CD11C+ ATMs (S) sorted from SVFs cultured and treated with DMSO or STF as in O-P, assessed by qRT-PCR. Data were expressed as mean ± SEM and analyzed using the unpaired two-tailed Student’s t-test between two samples or ANOVA with multiple comparisons. ∗p<0.05, ∗∗p<0.01, and ∗∗∗p<0.001.
Figure 6—figure supplement 1
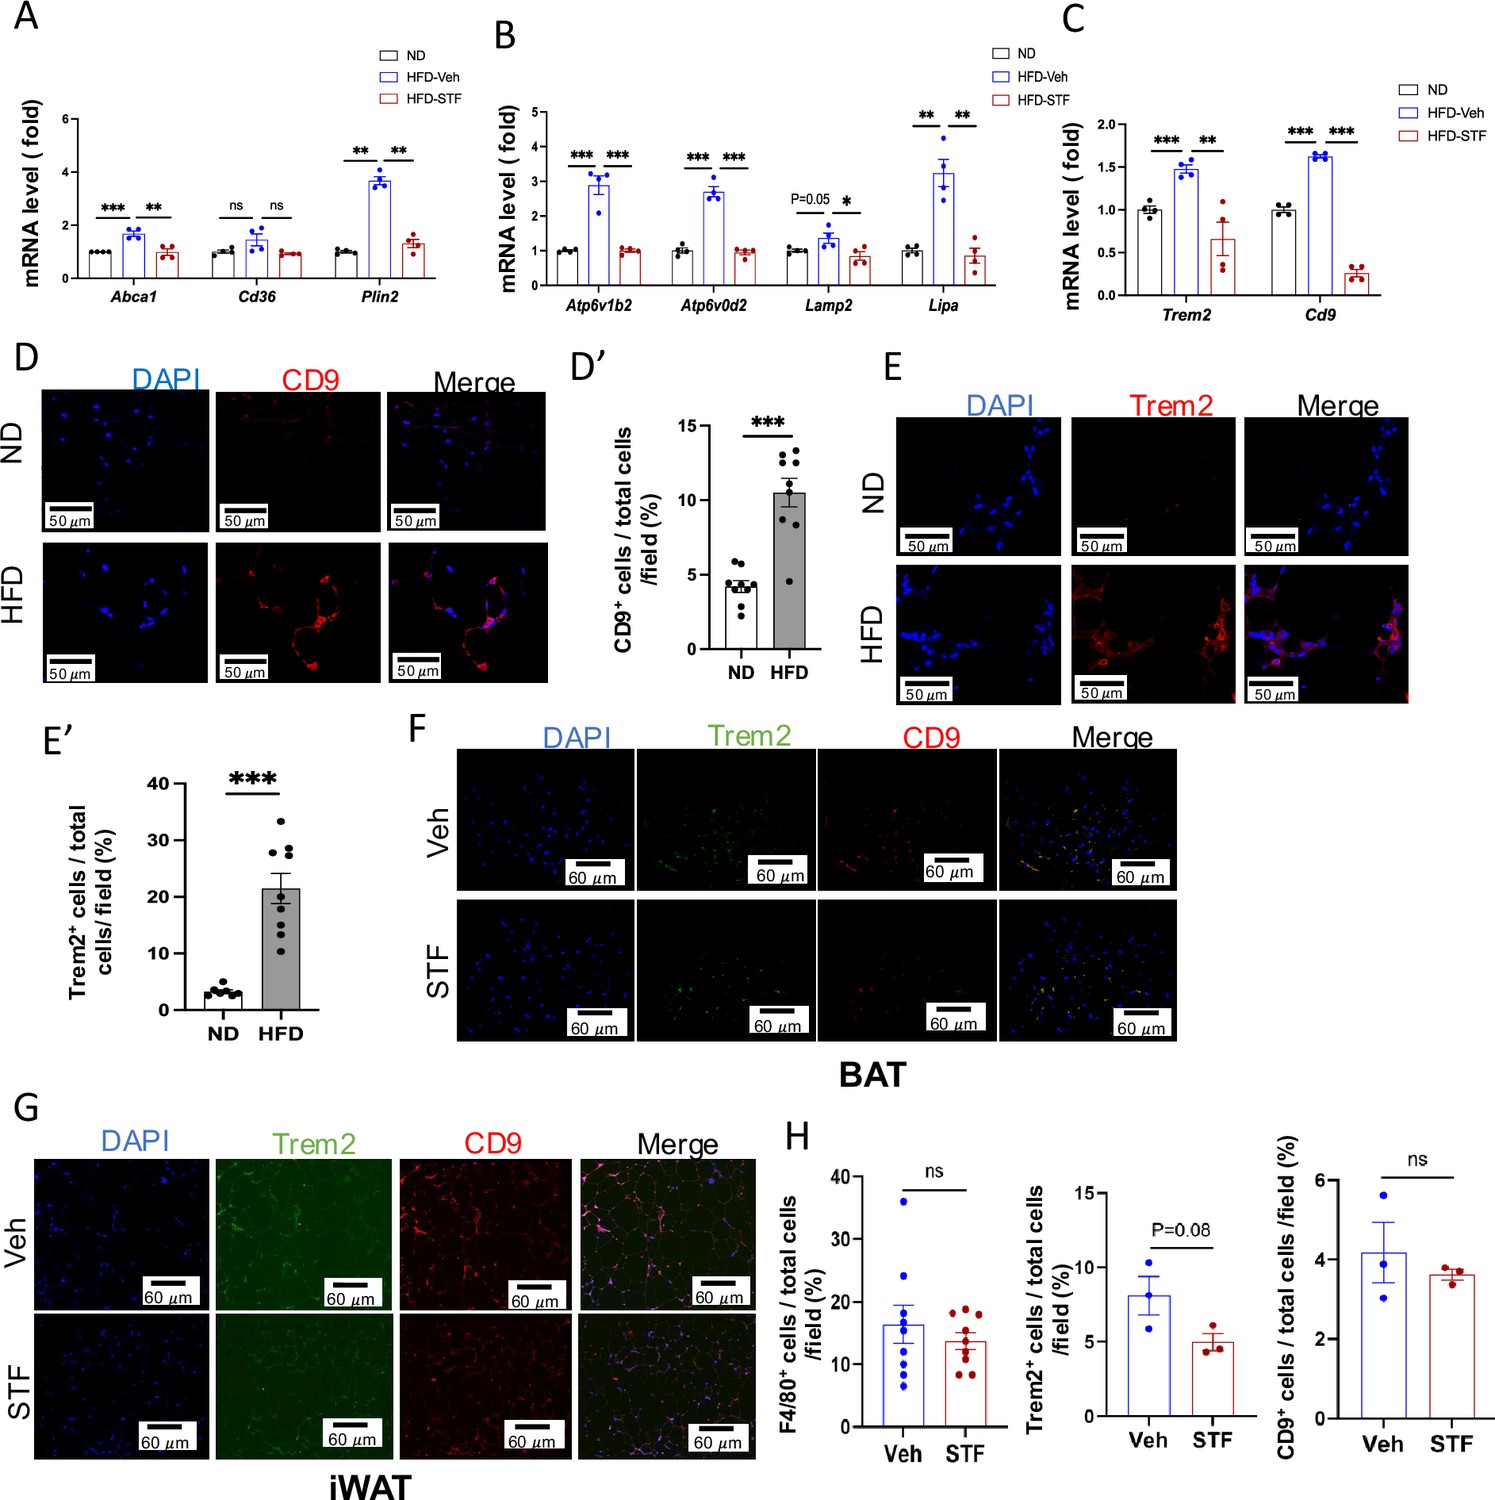
STF suppresses metabolically active ATMs in DIO mice.
(A–C) mRNA levels of indicated genes in the SVFs of iWAT from ND, HFD-veh and HFD-STF mice, assessed by qRT-PCR. The results are expressed as fold change and are representative of three independent experiments. (D-D’) Representative images (D) of immunofluorescent staining of CD9 (red) in the eWAT sections of ND- and HFD-fed mice and quantification (D’). DAPI (blue) for nuclear staining. (E-E’) Representative images (E) of immunofluorescent staining of Trem2 (red) in the eWAT sections of ND- and HFD-fed mice and quantification (E’). DAPI (blue) for nuclear staining. (F) Representative images of immunofluorescent staining of CD9 (red) and Trem2 (green) in the BAT sections of HFD-fed mice treated with Veh or STF. DAPI (blue) for nuclear staining. (G–H) Representative images of immunofluorescent staining in the iWAT sections of HFD-fed mice treated with Veh or STF (G) and quantification (H). CD9 (red), Trem2 (green), and DAPI for nuclear staining (blue). Data are the mean ± SEM. ∗p<0.05, ∗∗p<0.01, and ∗∗∗p<0.001.
Figure 6—figure supplement 2
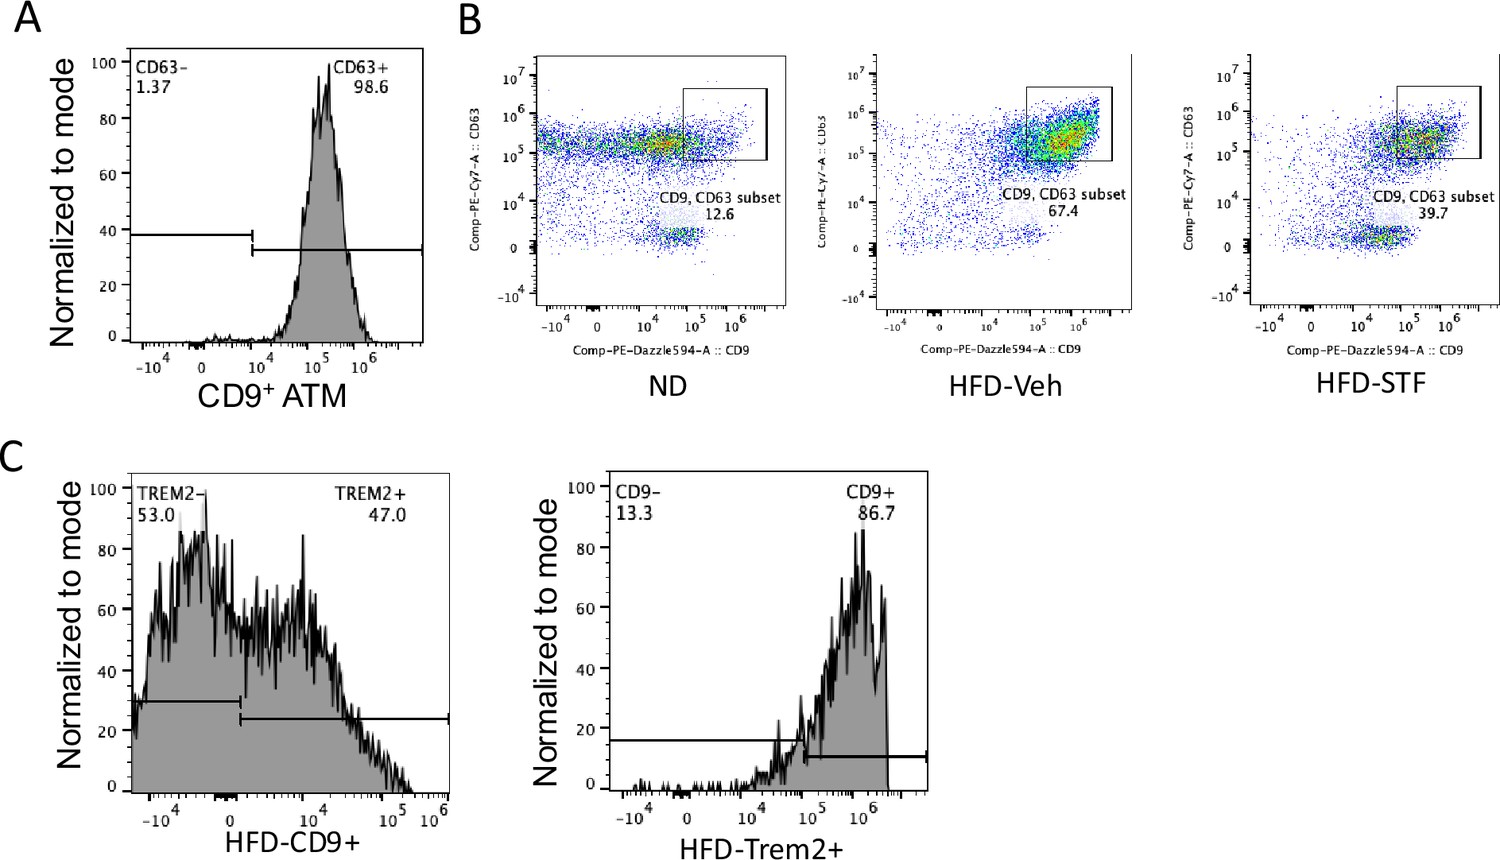
STF suppresses CD9 + and Trem2 + ATMs in DIO mice.
(A) Flow cytometry analysis of CD63 signal in CD9+ ATMs from eWAT SVFs of DIO mice, gated against CD9 and CD63 antibodies sequentially following the gating strategy shown in Figure 5—figure supplement 2A. Data in Y-axis was presented as ‘Normalized to mode’” for percentages. (B) Flow cytometry analysis of CD9+ and CD63+ ATMs from eWAT SVFs of ND, HFD-Veh and HFD-STF mice, gated against CD9 and Trem2 antibodies simultaneously following the gating strategy shown in Figure 5—figure supplement 2A. (C) Flow cytometry analyses of Trem2 signal in CD9+ ATMs (left panel) and of CD9 signal in Trem2+ ATMs (right panel) from eWAT SVFs of DIO mice, gated against CD9 and Trem2 antibodies sequentially (left panel) or against Trem2 and CD9 sequentially (right panel) following the gating strategy shown in Figure 5—figure supplement 2A. Data in Y-axis was presented as ‘Normalized to mode’ for percentages. Data are the mean ± SEM. ∗p<0.05, ∗∗p<0.01, and ∗∗∗p<0.001.
Figure 7 with 2 supplements
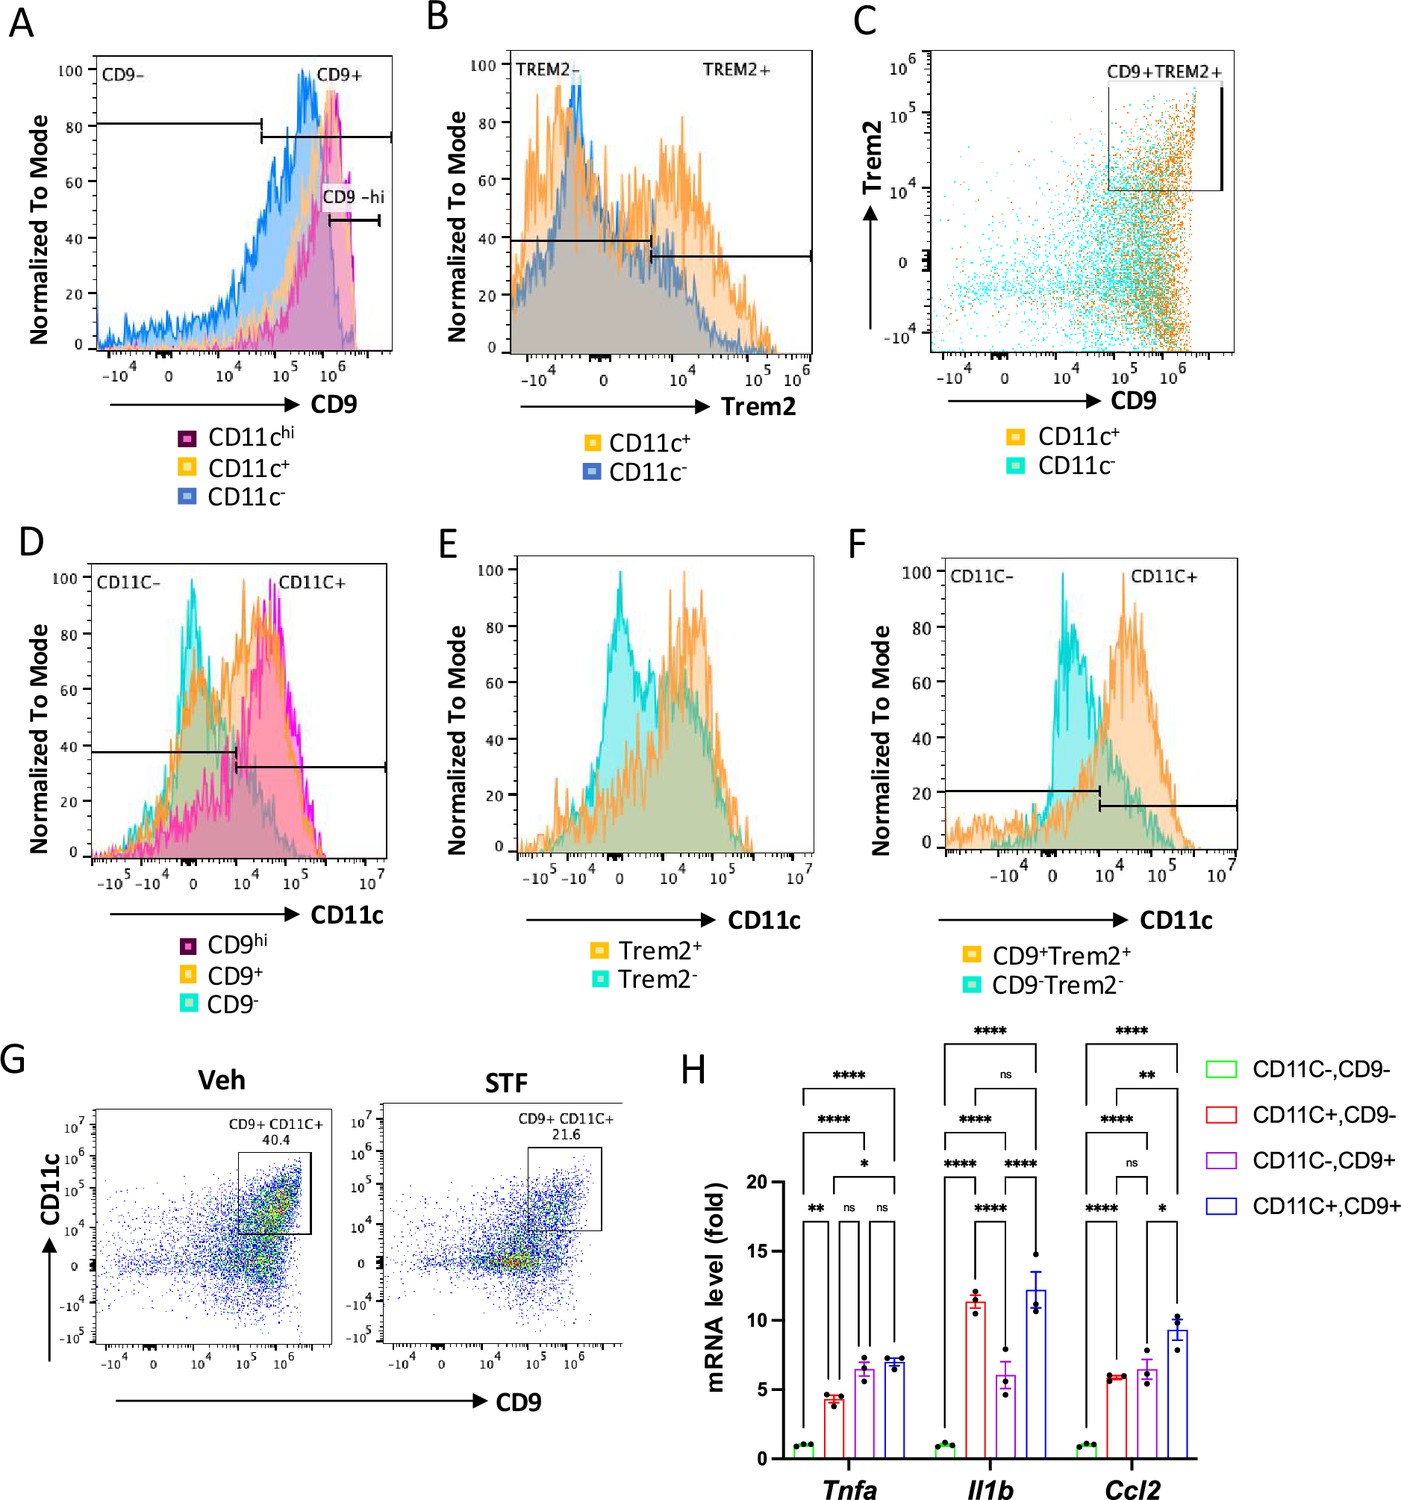
The relationship of CD11c+ ATMs with metabolically active CD9+ or Trem2+ ATMs in DIO mice.
(A) Overlay of the flow cytometric analysis of percentages of CD9-positive signals among CD11C-hi (pink), CD11C+ (yellow), and CD11C- (blue) ATMs from eWAT SVFs of DIO mice. Data in Y-axis was presented as ‘Normalized to mode’ for percentages. (B–C) Overlay of the flow cytometric analysis of percentages of CD9-positive (B) and CD9-and Trem2-doubly positive (C) signals among CD11C+ (yellow) and CD11C- (blue/green) ATMs from eWAT SVFs of DIO mice. (D–F) Overlay of the flow cytometric analysis of percentages of CD11-positive signals among CD9hi, +, and – ATMs (D), Trem2+ and – ATMs (E), and CD9/Trem2+ and – ATMs (F) from eWAT SVFs of DIO mice. Data in Y-axis was presented as ‘Normalized to mode’ for percentages. The gating strategies for A-F were shown in Figure 7—figure supplement 2. (G) Flow cytometry of CD9+ and CD11C+ ATMs from eWAT SVFs of DIO mice treated with vehicle or STF, gated against CD9 and CD11C antibodies. Complete gating path was shown in Figure 5—figure supplement 2A. (H) mRNA levels of indicated proinflammatory cytokine/chemokine genes in the indicated ATM subpopulations sorted from SVFs of eWAT of DIO, assessed by qRT-PCR. The results were expressed as fold change and were representative of three independent experiments. Data were expressed as mean ± SEM and analyzed using the unpaired two-tailed Student’s t-test between two samples or ANOVA with multiple comparisons. ∗p<0.05, ∗∗p<0.01, and ∗∗∗p<0.001.
Figure 7—figure supplement 1
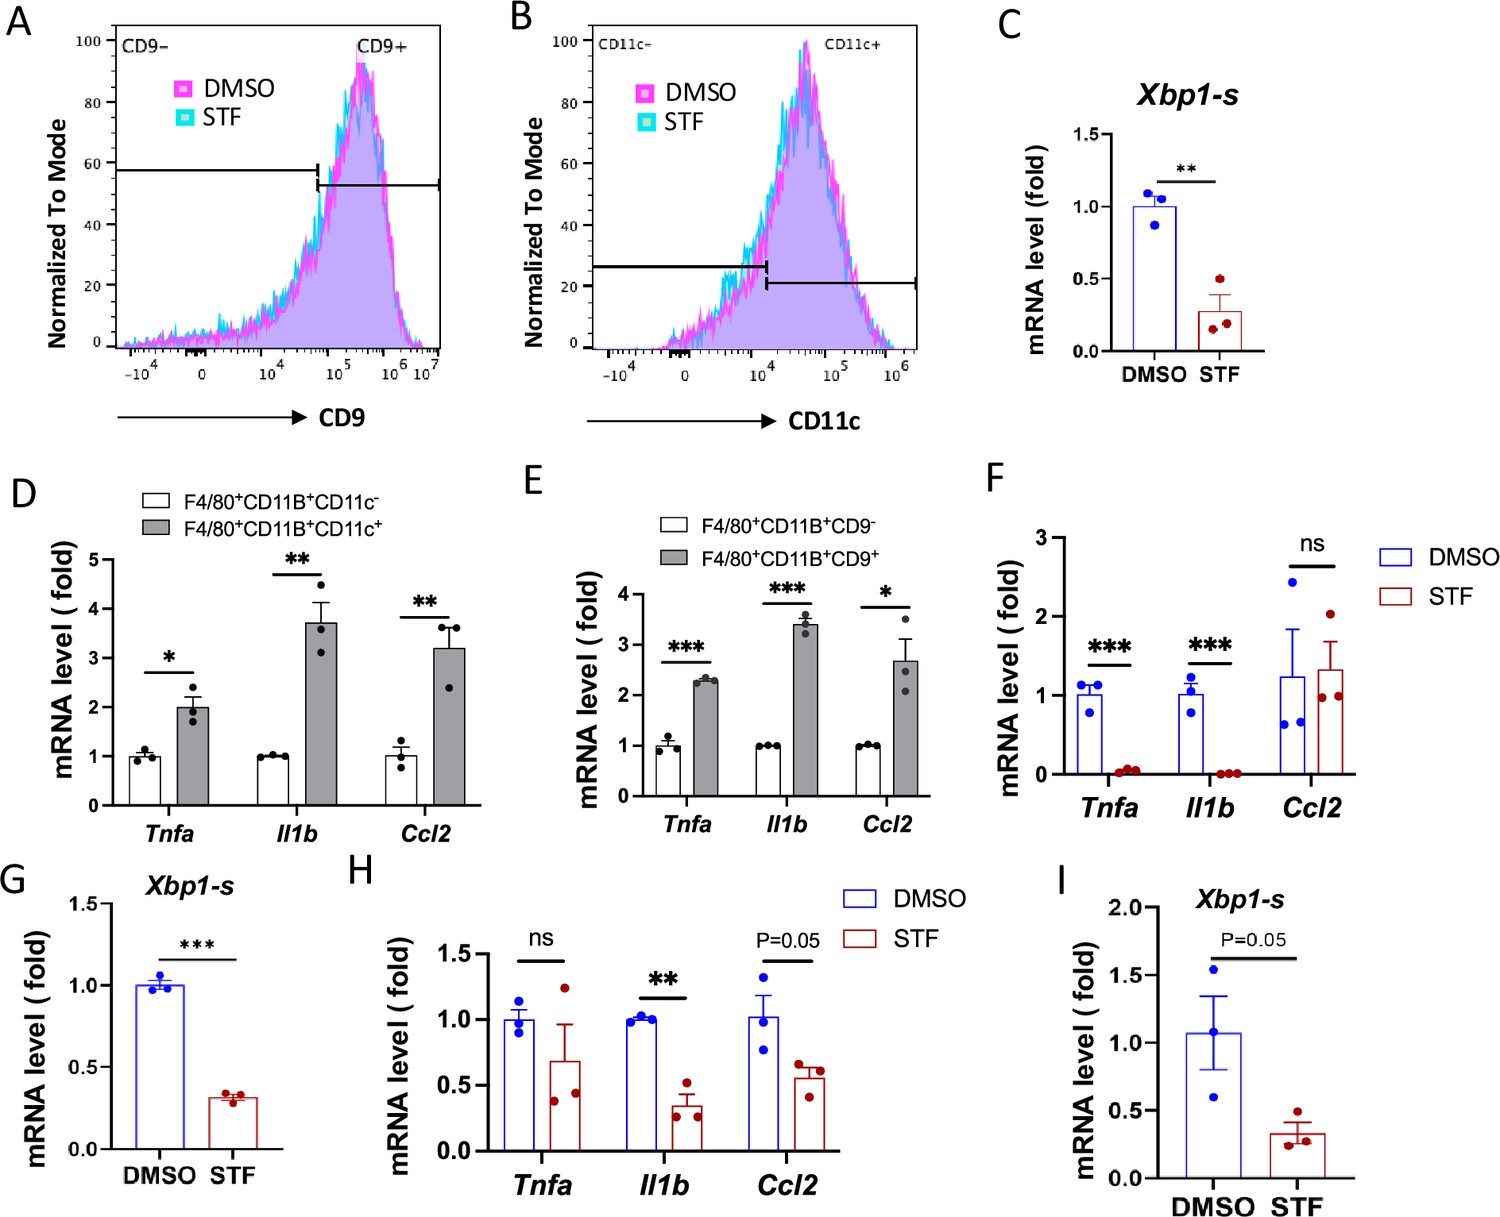
STF suppresses pro-inflammatory cytokines genes expression in ATM in vitro.
(A–B) Flow cytometry analysis of ATMs from SVFs of the eWAT from 20-week HFD-fed mice. SVFs were cultured and treated with 0.01% DMSO control or STF (30 μM) for 20 hr followed by staining and flow analysis, gated against CD9 antibody (A) or CD11C antibody (B). Data in Y-axis was presented as ‘Normalized to mode’ for percentages. The gating path followed the one as Figure S5. (C) mRNA levels of indicated genes in CD11C+ ATMs sorted from SVFs cultured and treated with DMSO or STF, assessed by qRT-PCR. (D–E) Comparison of mRNA levels of indicated proinflammatory genes between CD11C+ and CD11C- ATMs (D) and between CD9+ and CD9- ATMs (E), sorted from SVFs, assessed by qRT-PCR. (F–G) mRNA levels of indicated proinflammatory genes (F) and spliced-XBP1 (G) in CD9- ATMs sorted from SVFs cultured and treated with DMSO or STF, assessed by qRT-PCR. (F–G) mRNA levels of indicated proinflammatory genes (F) and spliced-XBP1 (G) in CD11C- ATMs sorted from SVFs cultured and treated with DMSO or STF, assessed by qRT-PCR. Data were expressed as mean ± SEM and analyzed using the unpaired two-tailed Student’s t-test between two samples or ANOVA with multiple comparisons. ∗p<0.05, ∗∗p<0.01, and ∗∗∗p<0.001.
Figure 7—figure supplement 2
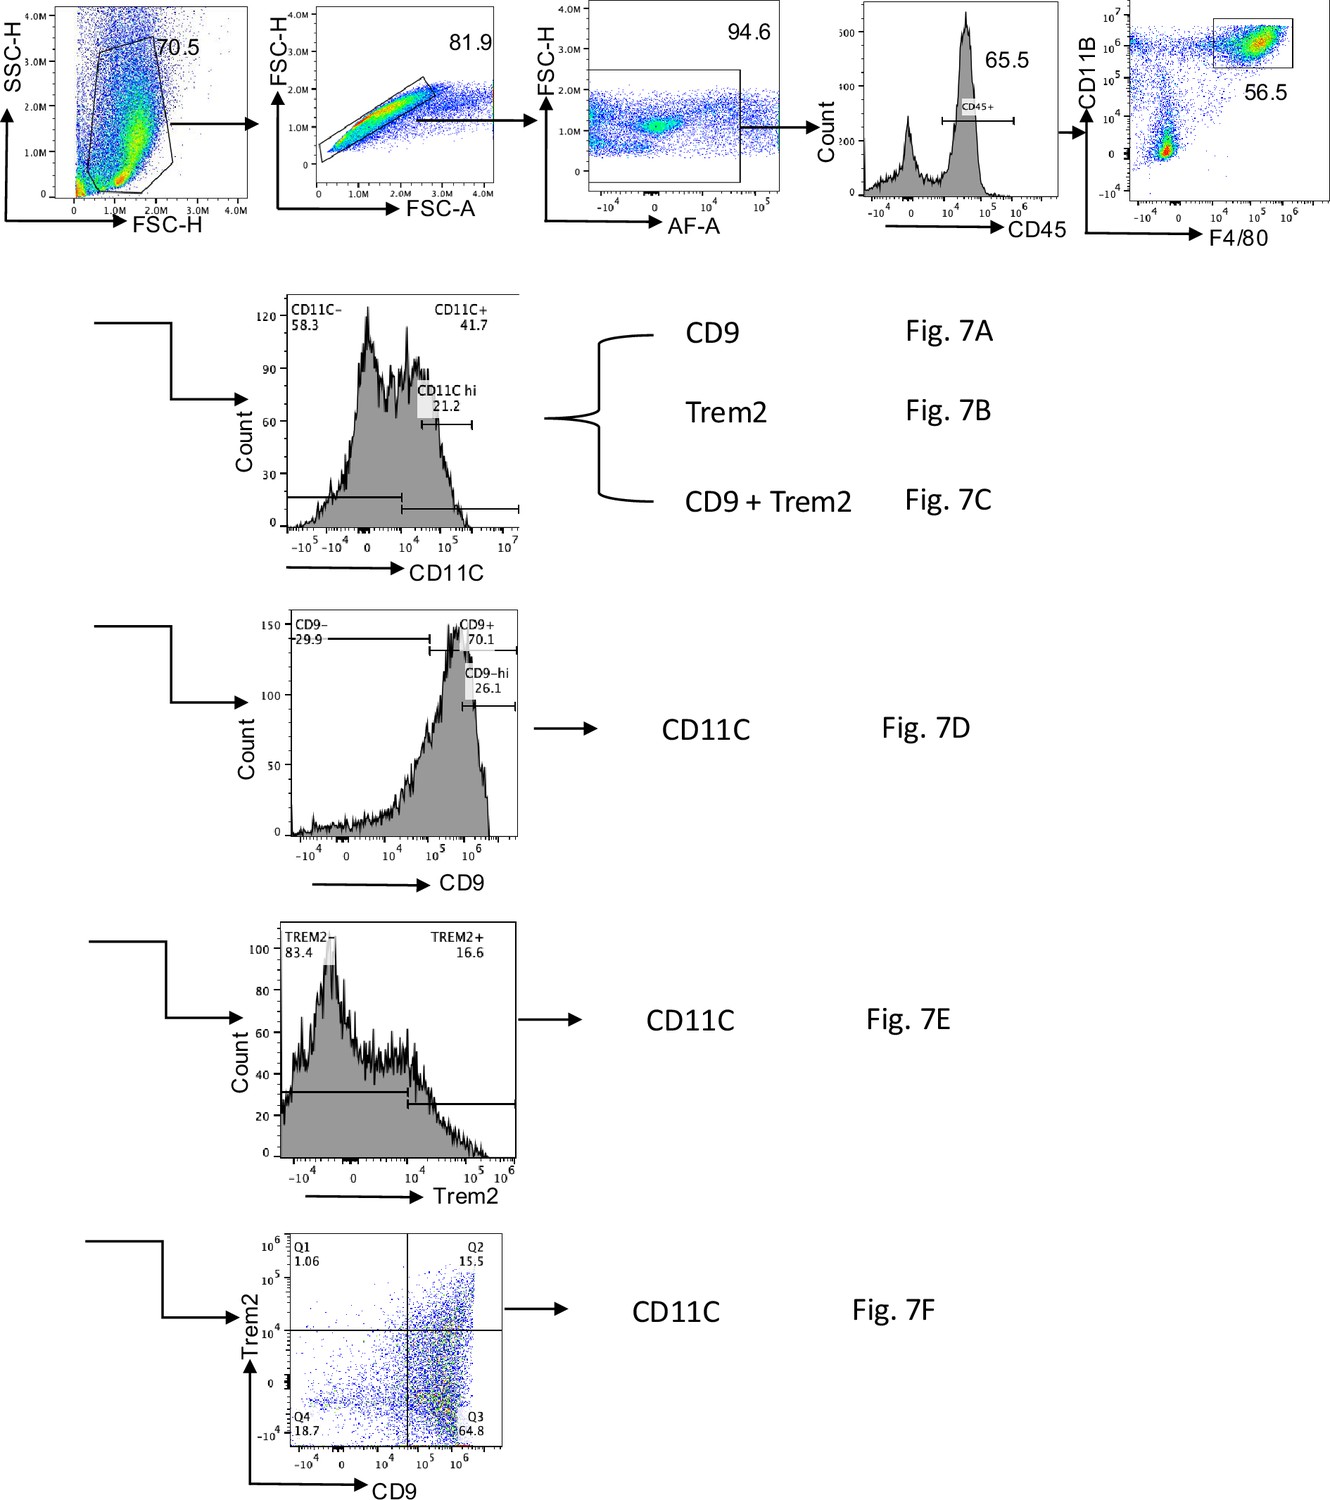
Flow cytometry analysis strategy related to Figure 7.
Representative pseudocolor cell density flow cytometry plots showing the gating strategy used for analysis of subsets of ATMs in the eWATs from DIO mice with the total F4/80+ CD11b+ at the top row, followed by the steps specifically for Figure 7A–F. Numbers indicate percentage of gated cells.
Tables
Table 1
Effect of STF treatment on ‘M1-like’ and ‘M2-like’ ATMs in obesity.
(A) The total number and density of ATMs (F4/80+CD11B+) in eWAT in mice with ND, HFD-Veh, or HFD-STF. (B) The percentage, total cell number, and density of CD11C+ ATMs in eWAT in mice with ND, HFD-Veh, or HFD-STF. (C) The total cell number and density of C11DC+ CD206+ATMs in eWAT in mice with ND, HFD-Veh, or HFD-STF. (D) The total cell number and density of CD206+C11DC- ATMs in eWAT in mice with ND, HFD-Veh, or HFD-STF. Data in a-d were obtained from two batches of four mice each and were expressed as mean ± SEM and analyzed using the unpaired two-tailed Student’s t-test between two samples or ANOVA with multiple comparisons. ∗p<0.05, ∗∗p<0.01, and ∗∗∗p<0.001.
| A | |||
|---|---|---|---|
| F4/80+CD11B+ | |||
| Total cell#/eWAT/mouse | Cell#/g of eWAT/mouse | ||
| ND | 0.29±0.25 x 10⁵ | 0.62±0.45 x 10⁵ | |
| HFD-Veh | 1.43±0.086 x 10⁶ | 0.77±0.015 x 10⁶ | |
| HFD-STF | 0.76±0.13 x 10⁶ | 0.36±0.018 x 10⁶ | |
| HFD-Veh/ND: Fold (P value) | 49.63 (0.0041) | 12.54 (0.0045) | |
| HFD-STF/HFD-Veh: Fold (P value) | 0.54 (0.053) | 0.46 (0.0033) | |
| B | |||
| F4/80+CD11B+CD11C+ | |||
| Percentage | Total cell#/eWAT/mouse | Cell#/g of eWAT/mouse | |
| ND | 14.59±6.92 | 0.25±0.16 × 10⁴ | 0.59±0.23 × 10⁴ |
| HFD-Veh | 52.95±11.25 | 0.75±0.11 × 10⁶ | 4.11±0.96 × 10⁵ |
| HFD-STF | 37.65±12.65 | 0.27±0.05 × 10⁶ | 1.32±0.38 × 10⁵ |
| HFD-Veh/ND: Fold (P value) | 3.63 (0.007) | 299.58 (0.00036) | 70.06 (0.0018) |
| HFD-STF/HFD-Veh: Fold (P value) | 0.71 (0.19) | 0.36 (0.0027) | 0.32 (0.009) |
| C | |||
| F4/80+CD11B+CD11C+CD206+ | |||
| Percentage | Total cell#/eWAT/mouse | Cell#/g of eWAT/mouse | |
| ND | 13.46±7.15 | 0.21±0.13 × 10⁴ | 0.63±0.27 × 10⁴ |
| HFD-Veh | 50.45±8.25 | 7.13±0.74 × 10⁵ | 4.19±0.05 × 10⁵ |
| HFD-STF | 38.25±9.15 | 2.80±0.19 × 10⁵ | 1.35±0.07 × 10⁵ |
| HFD-Veh/ND: Fold (P value) | 3.75 (0.0042) | 337.56 (7.79E-05) | 75.0 (0.0008) |
| HFD-STF/HFD-Veh: Fold (P value) | 0.76 (0.16) | 0.39 (0.00062) | 0.35 (0.0049) |
| d | |||
| F4/80+CD11B+CD206+CD11C- | |||
| Percentage | Total cell#/eWAT/mouse | Cell#/g of eWAT/mouse | |
| ND | 72.35±2.25 | 2.03±1.72 × 10⁴ | 4.36±3.13 × 10⁴ |
| HFD-Veh | 23.35±3.55 | 3.37±0.71 × 10⁵ | 1.80±0.24 × 10⁵ |
| HFD-STF | 28.95±5.25 | 2.14±0.017 × 10⁵ | 1.02±0.13 × 10⁵ |
| HFD-Veh/ND: Fold (P value) | 0.32 (3.55E-05) | 16.61 (0.0017) | 4.13 (0.0038) |
| HFD-STF/HFD-Veh: Fold (P value) | 1.24 (0.20) | 0.64 (0.40) | 0.57 (0.0076) |
Table 2
Characterization of and the effect of STF treatment on CD9+ and Trem2+ ATMs in DIO mice.
The percentage, total cell number, and density of subpopulations of CD9+ ATMs (A), Trem2+ ATMs (B), and CD9+ Trem2+ ATMs(C) in eWAT from mice with ND, HFD-Veh, or HFD-STF. Data in a-c were obtained from two batches of four mice each and were expressed as mean ± SEM and analyzed using the unpaired two-tailed Student’s t-test between two samples or ANOVA with multiple comparisons. ∗p<0.05, ∗∗p<0.01, and ∗∗∗p<0.001.
| A | |||
|---|---|---|---|
| F4−80+CD11B+CD9+ | |||
| Percentage | Total cell#/eWAT/mouse | Cell#/g of eWAT/mouse | |
| ND | 23.25±8.75 | 0.45±0.32 × 10⁴ | 1.04±0.51 × 10⁴ |
| HFD-Veh | 72.70±2.60 | 1.04±0.026 × 10⁶ | 0.56±0.032 × 10⁶ |
| HFD-STF | 55.50±13.20 | 0.41±0.027 × 10⁶ | 0.20±0.037 × 10⁶ |
| HFD-Veh/ND: Fold (P value) | 3.13 (0.032) | 228.14 (0.00062) | 54.08 (0.0034) |
| HFD-STF/HFD-Veh: Fold (P value) | 0.77 (0.16) | 0.39 (0.0035) | 0.35 (0.017) |
| B | |||
| F4−80+CD11B+Trem2+ | |||
| Percentage | Total cell#/eWAT/mouse | Cell#/g of eWAT/mouse | |
| ND | 13.33±11.58 | 0.98±0.046 × 10³ | 2.99±1.12 × 10³ |
| HFD-Veh | 21.60±5.00 | 3.04±0.52 × 10⁵ | 1.68±0.42 × 10⁵ |
| HFD-STF | 16.70±2.80 | 1.24±0.06 × 10⁵ | 0.59±0.07 × 10⁵ |
| HFD-Veh/ND: Fold (P value) | 1.62 (0.32) | 309.97 (0.00056) | 56.13 (0.0024) |
| HFD-STF/HFD-Veh: Fold (P value) | 0.77 (0.21) | 0.41 (0.0040) | 0.35 (0.011) |
| C | |||
| F4−80+CD11B+CD9+Trem2+ | |||
| Percentage | Total cell#/eWAT/mouse | Cell#/g of eWAT/mouse | |
| ND | 7.56±6.45 | 0.59±0.0090 × 10³ | 1.75±0.56 × 10³ |
| HFD-Veh | 19.95±4.45 | 2.81±0.46 × 10⁵ | 1.55±0.37 × 10⁵ |
| HFD-STF | 14.45±2.55 | 1.07±0.0041 × 10⁵ | 0.51±0.065 × 10⁵ |
| HFD-Veh/ND: Fold (P value) | 2.64 (0.052) | 479.54 (0.00047) | 88.59 (0.0021) |
| HFD-STF/HFD-Veh: Fold (P value) | 0.72 (0.14) | 0.38 (0.0029) | 0.33 (0.0092) |
Table 3
Flow cytometry analysis of relationship between ‘M1-like’ ATMs and CD9+ /Trem2+ ATMs.
(A) The percentages of cells expressing CD9, Trem2 or both CD9 and Trem2 markers in CD11c+ or CD11c- ATMs from eWATs of DIO mice. (B) The percentages of cells expressing CD11C marker in CD9+, Trem2+, or CD9+ Trem2+ ATMs versus their negative counterparts from eWATs of DIO mice. (C) The percentage, total cell number, and density of CD9+ CD11c+ ATMs from eWATs of DIO mice treated with vehicle or STF. Data in a-c were obtained from two batches of four mice each and were expressed as mean ± SEM and analyzed using the unpaired two-tailed Student’s t-test between two samples or ANOVA with multiple comparisons. ∗p<0.05, ∗∗p<0.01, and ∗∗∗p<0.001.
| A | ||||||
|---|---|---|---|---|---|---|
| Percentage of cells expressing | CD9 | Trem2 | CD9, Trem2 | |||
| F4/80+CD11b+CD11c+ | 91.30±0.40 | 43.55±8.65 | 30.05±5.55 | |||
| F4/80+CD11b+CD11c- | 70.40±1.0 | 24.35±4.05 | 8.35±1.86 | |||
| P value | 0.0027 | 0.074 | 0.066 | |||
| B | ||||||
| CD9+ | CD9- | Trem2+ | Trem2- | CD9 +Trem2+ | CD9-Trem2- | |
| Percentage of CD11c+ | 63.25±10.85 | 29.90±9.1 | 78.25±12.35 | 49.55±9.85 | 78.65±13.05 | 24.60±5.90 |
| p value | 0.14 | 0.21 | 0.063 | |||
| C | ||||||
| F4−80+CD11B+CD9+CD11c+ | ||||||
| Percentage | Total cell #/mouse | Cell #/fat weight (g) | ||||
| ND | 8.16±3.24 | 0.16±0.11 × 10⁴ | 0.36±0.17 × 10⁴ | |||
| HFD-Veh | 45.45±5.05 | 6.45±0.33 × 10⁵ | 3.52±0.46 × 10⁵ | |||
| HFD-STF | 29.40±7.80 | 2.14±0.21 × 10⁵ | 1.03±0.23 × 10⁵ | |||
| HFD-Veh/ND: Fold (pvalue) | 5.57 (0.025) | 416.29 (0.0026) | 98.75 (0.017) | |||
| HFD-STF/HFD-Veh: Fold (p value) | 0.65 (0.23) | 0.33 (0.008) | 0.29 (0.040) | |||
Additional files
-
Supplementary file 1
Effect of STF treatment on “M1-like” and “M2-like” ATMs in obesity.
The total cell number and density of populations from CD11C+CD206- ATMs in the eWATs of mice with ND, HFD-Veh, or HFD-STF (a), CD11C-CD206- ATMs in the eWATs of mice with ND, HFD-Veh, or HFD-STF (b), and F4/80-CD11B- ATMs in the eWATs of DIO mice treated with Veh or STF (c). Data in a-c were obtained from 2 batches of 4 mice each and are the mean ± SEM. ∗P<0.05, ∗∗P<0.01, and ∗∗∗P<0.001.
- https://cdn.elifesciences.org/articles/100581/elife-100581-supp1-v1.docx
-
Supplementary file 2
Characterization of and the effect of STF treatment on CD9+ ATMs in DIO mice.
The percentage, total cell number, and density of populations from CD9+CD63+ ATMs in the eWATs of mice with ND, HFD-Veh, or HFD-STF. Data were obtained from 2 batches of 4 mice each and are the mean ± SEM. ∗P<0.05, ∗∗P<0.01, and ∗∗∗P<0.001.
- https://cdn.elifesciences.org/articles/100581/elife-100581-supp2-v1.docx
-
Supplementary file 3
Primers used in this work.
- https://cdn.elifesciences.org/articles/100581/elife-100581-supp3-v1.docx
-
MDAR checklist
- https://cdn.elifesciences.org/articles/100581/elife-100581-mdarchecklist1-v1.docx
Download links
A two-part list of links to download the article, or parts of the article, in various formats.
Downloads (link to download the article as PDF)
Open citations (links to open the citations from this article in various online reference manager services)
Cite this article (links to download the citations from this article in formats compatible with various reference manager tools)
Targeting IRE1α improves insulin sensitivity and thermogenesis and suppresses metabolically active adipose tissue macrophages in male obese mice
eLife 13:RP100581.
https://doi.org/10.7554/eLife.100581.4


