The asymmetric expression of HSPA2 in blastomeres governs the first embryonic cell-fate decision
- Institute of Women, Children and Reproductive Health, Shandong University, China
- State Key Laboratory of Reproductive Medicine and Offspring Health, Shandong University, China
- National Research Center for Assisted Reproductive Technology and Reproductive Genetics, Shandong University, China
- Key Laboratory of Reproductive Endocrinology (Shandong University), Ministry of Education, China
- Shandong Technology Innovation Center for Reproductive Health, China
- Shandong Provincial Clinical Research Center for Reproductive Health, China
- Shandong Key Laboratory of Reproductive Medicine, Shandong Provincial Hospital Affiliated to Shandong First Medical University, China
- Research Unit of Gametogenesis and Health of ART-Offspring, Chinese Academy of Medical Sciences, China
Figures
Figure 1 with 1 supplement
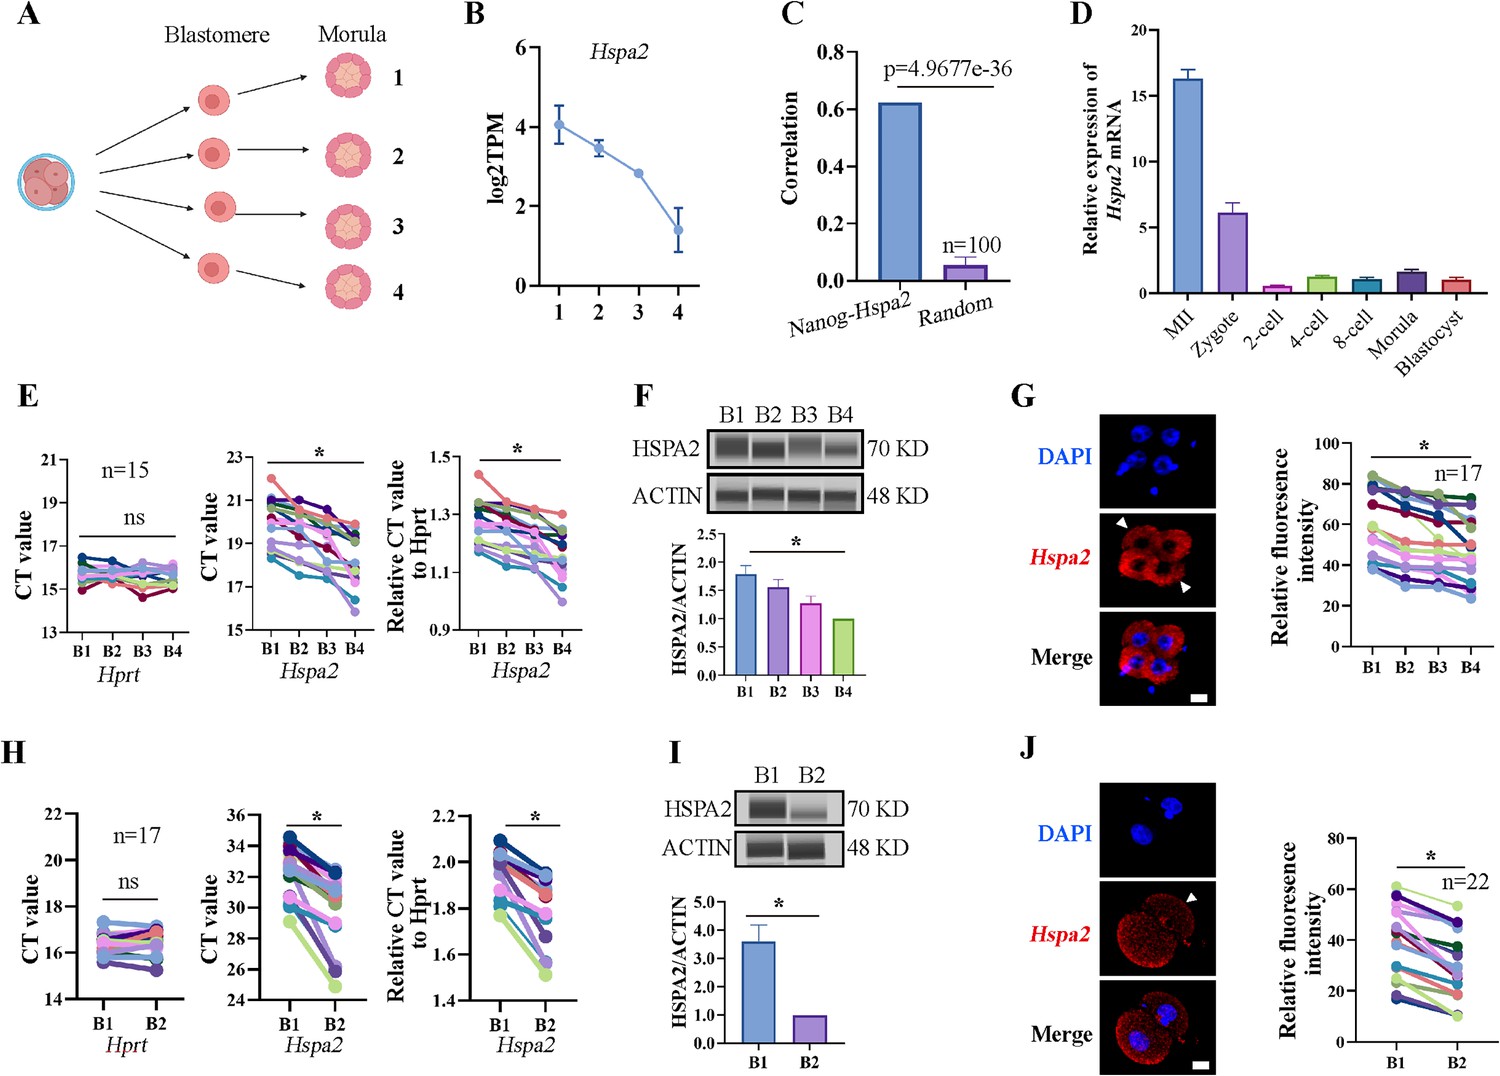
Hspa2 is asymmetrically expressed among mouse 2- and 4-cell blastomeres.
(A) Schematic overview. The 4-cell embryo divided into single blastomeres and cultured to the morula stage. Created in BioRender. (B) Hspa2 expression is heterogeneous in morula developed from 4-cell blastomeres. Three experimental replicates were performed. (C) Nanog and Hspa2 show stronger positive correlation (R=0.624) in gene expression than random gene pairs (n=100, n means the number of random gene pairs). (D) qPCR analysis of the relative expression of Hspa2 mRNA from the meiosis II to blastocyst stages. The error bars represent SEM. About 20 embryos of each stage were used and three experimental replicates were performed. (E, H) Single-cell qRT-PCR results showing Hspa2 distribution between 4- (E) (n=15), late 2- (H) (n=17) cell blastomere. Hprt as the housekeeping gene. CT values are used for level analysis. Two-tailed Student’s t tests were used for the statistical analysis. Blastomeres are named B1 to B4 (E) or B1 and B2 (H) according to increasing Hspa2 concentration. *P<0.05. (F, I) Automated western immunoblotting results showing HSPA2 distribution between 4- (F) and late 2- (I) cell blastomeres. Blastomeres are named B1 to B4 (E) or B1 and B2 (H) according to decreasing Hspa2 concentration. The band intensity was assessed. There experimental replicates were performed. *p<0.05. (G, J) FISH of Hspa2 mRNA in early 4- (G) (n=17), late 2- (J) (n=22) cell embryos. Blastomeres with low expression as white triangles. RNA-FISH fluorescence quantified and normalized to the nucleus with the strongest staining per individual 2- or 4-cell embryo. Blastomeres are named B1 to B4 (G) or B1 and B2 (J) according to decreasing Hspa2 concentration. Three experimental replicates were performed. Bar, 25 μm. *p<0.05.
-
Figure 1—source data 1
PDF file containing original western blots, indicating relevant band.
- https://cdn.elifesciences.org/articles/100730/elife-100730-fig1-data1-v1.zip
-
Figure 1—source data 2
Original files for western blot analysis.
- https://cdn.elifesciences.org/articles/100730/elife-100730-fig1-data2-v1.zip
Figure 1—figure supplement 1
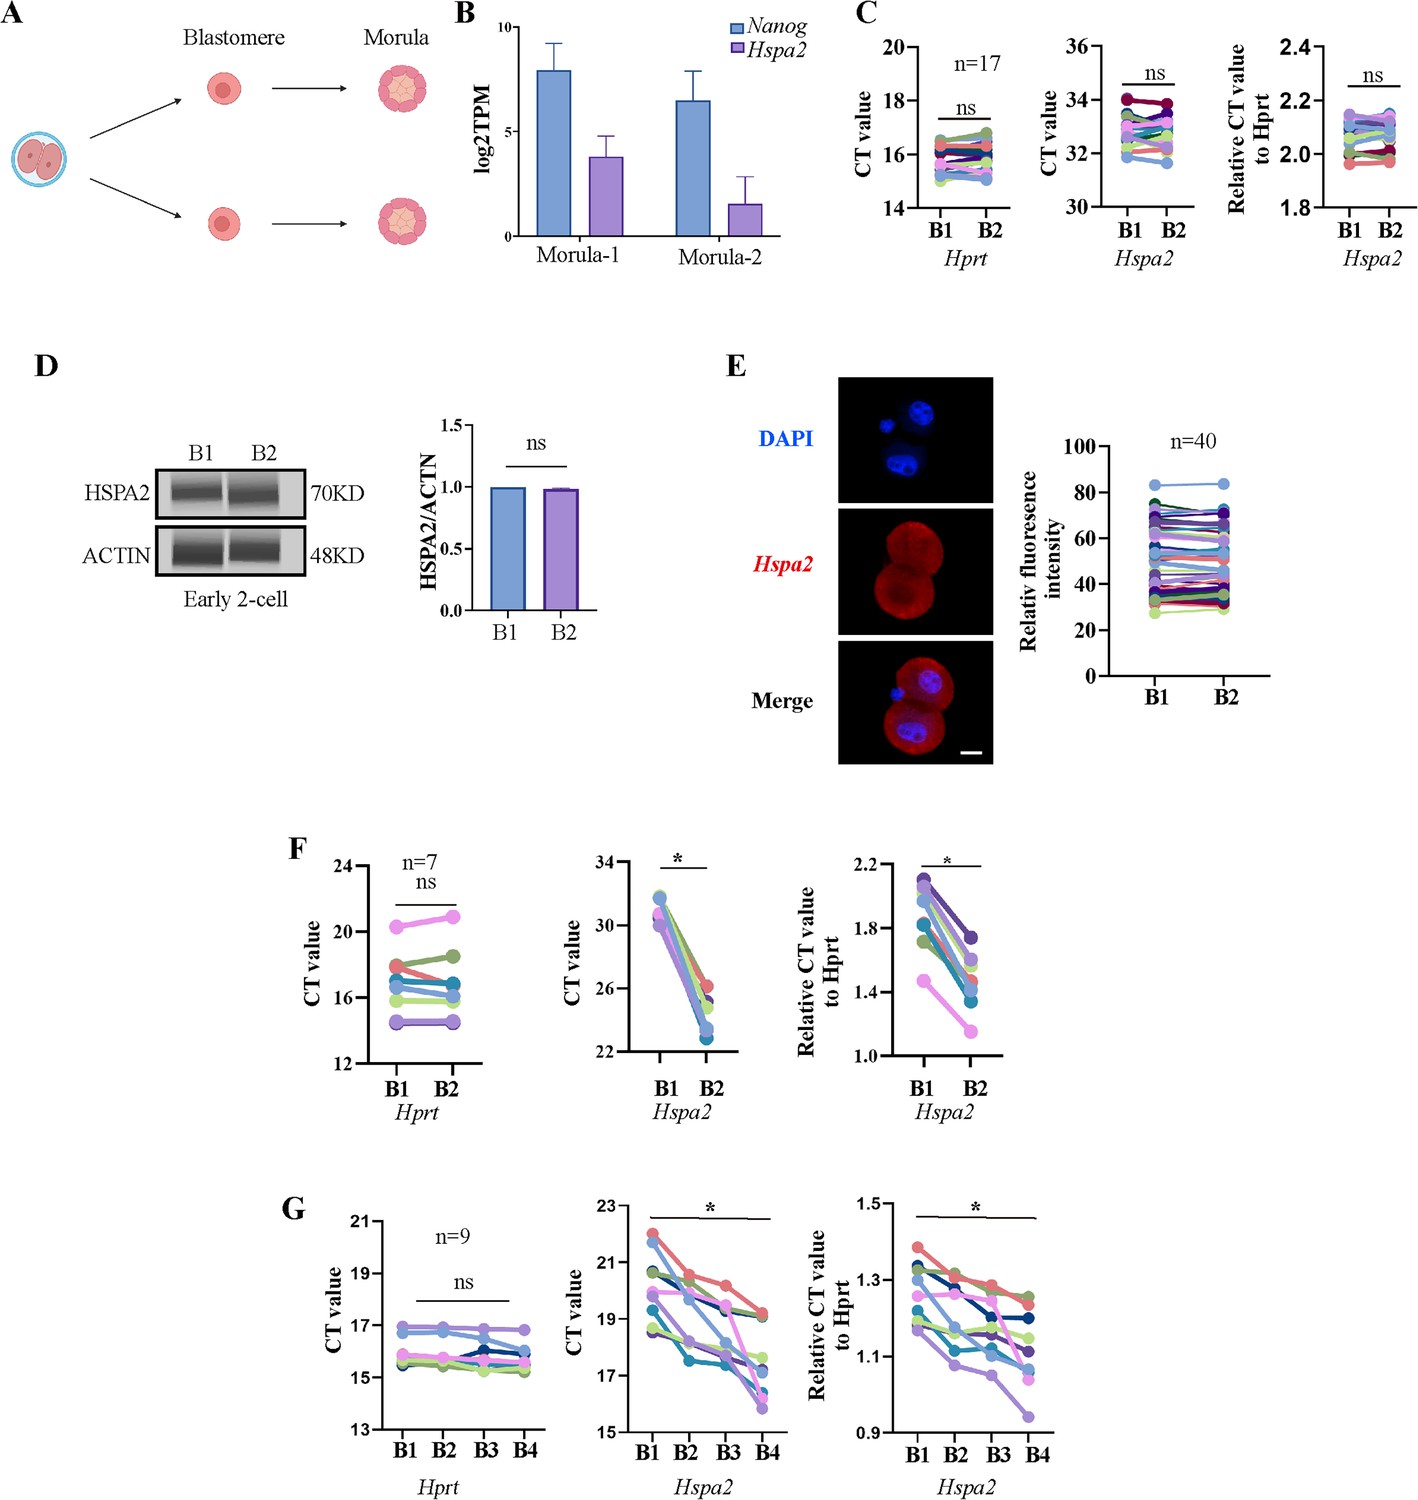
Hspa2 is asymmetrically expressed between mouse 2- and 4-cell blastomeres.
(A) Schematic overview. Late 2-cell divided into single blastomeres and cultured to the morula stage. Created in BioRender. (B) Hspa2 expression is heterogeneous and the level of Nanog is positively correlated with the expression of Hspa2 in morula developed from late 2-cell blastomeres. Three experimental replicates were performed. (C) Single-cell qRT-PCR results showing Hspa2 distribution between early 2-cell (n=17) blastomere. Hprt as the housekeeping gene. CT values are used for level analysis. Two-tailed Student’s t tests were used for the statistical analysis. Three experimental replicates were performed. (D) Automated western immunoblotting results showing HSPA2 distribution between early 2-cell blastomeres. Blastomeres are abbreviated named B. The protein level is normalized B1. Three experimental replicates were performed. (E) FISH of Hspa2 mRNA in early 2-cell embryos (n=40). RNA-FISH fluorescence quantified and normalized to the nucleus with the strongest staining per individual early 2-cell embryo. Three experimental replicates were performed. Bar, 25 μm. (F, G) Single-cell qRT-PCR results showing Hspa2 level in blastomeres at the late 2- (F) and 4-cell (G) stage after microinjection of siHspa2 in zygotes. Hprt as the housekeeping gene. CT values are used for level analysis. Two-tailed Student’s t tests were used for the statistical analysis. Blastomeres are named B1 to B4 (F) or B1 and B2 (G) according to increasing Hspa2 concentration. *p<0.05.
-
Figure 1—figure supplement 1—source data 1
PDF file containing original western blots, indicating relevant band.
- https://cdn.elifesciences.org/articles/100730/elife-100730-fig1-figsupp1-data1-v1.zip
-
Figure 1—figure supplement 1—source data 2
Original files for western blot analysis.
- https://cdn.elifesciences.org/articles/100730/elife-100730-fig1-figsupp1-data2-v1.zip
Figure 2
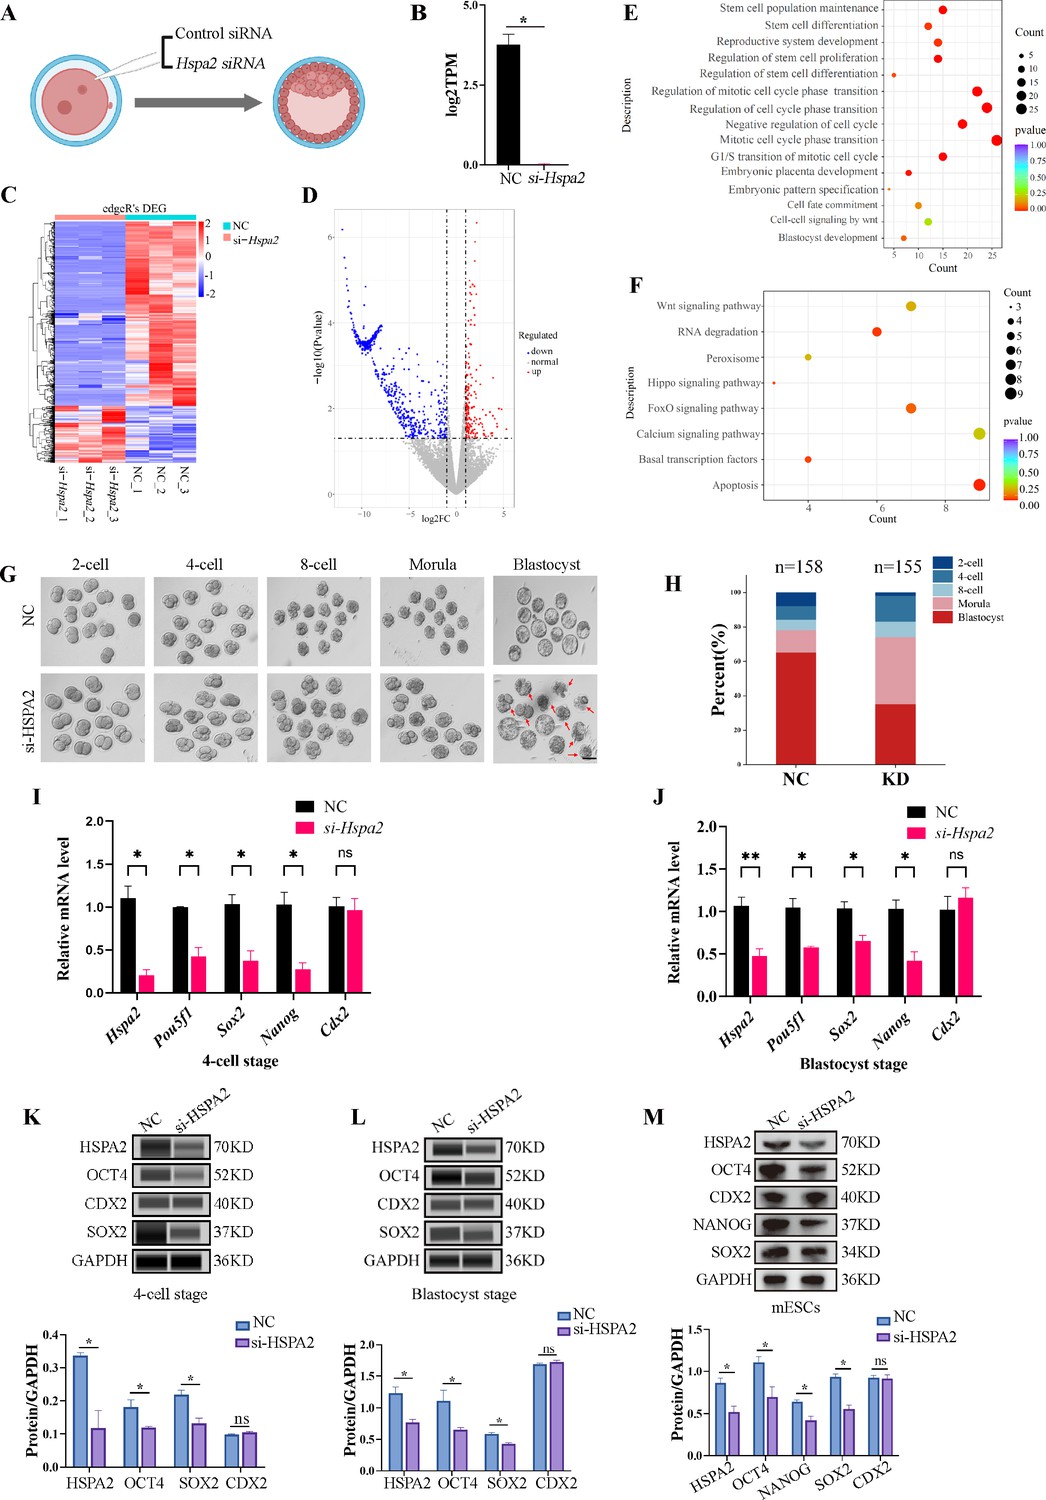
Knockdown of Hspa2 leads to decreased expression of ICM-mark at both mRNA and protein level.
(A) Schematic diagram of microinjection of zygotic embryos. Created in BioRender. (B) Bar charts showing the expression of Hspa2 in the negative control (NC) group (injected with negative control siRNA) and siRNA targeting group based on RNA-seq. The error bars denote the standard deviations of three experimental replicates of RNA-seq. *p<0.05. (C) Heat map of the hierarchical clustering analysis of the DEGs between NC and KD groups. (D) Volcano plots of significantly differentially expressed genes (DEGs). Red, up-regulated; Blue, down-regulated. (E) GO enrichment analysis from down-regulated DEGs between NC and KD groups. (F) Significantly down-regulated DEGs were analyzed by KEGG enrichment. (G) Representative images of preimplantation embryos in the NC and KD groups from 2-cell to blastocyst. Red arrowhead denotes degenerating blastocysts. Bar, 100 μm. (H) Bar plots showing the developmental rates of NC group and KD group at the blastocyst stage. Three experimental replicates were performed. (I, J) qRT-PCR of 4-cell embryo and blastocyst showed that ICM-marker gene (Pou5f1, Sox2, and Nanog) mRNA was significantly lower in the interference compared with the NC group. There were no significant differences in Cdx2 between the two groups. *p<0.05, **p<0.01. (K, L) Automated western blotting analysis of ICM-marker protein (OCT4, SOX2, and NANOG) expression in the interference and NC groups. Three experimental replicates were performed. *p<0.05. (M) Western blot analysis of ICM-marker protein (OCT4, SOX2, and NANOG) and TE-marker protein (CDX2) expression in mESCs. The band intensity was assessed with ImageJ. Three experimental replicates were performed. *p<0.05.
-
Figure 2—source data 1
PDF file containing original western blots, indicating relevant band.
- https://cdn.elifesciences.org/articles/100730/elife-100730-fig2-data1-v1.zip
-
Figure 2—source data 2
Original files for western blot analysis.
- https://cdn.elifesciences.org/articles/100730/elife-100730-fig2-data2-v1.zip
Figure 3 with 1 supplement
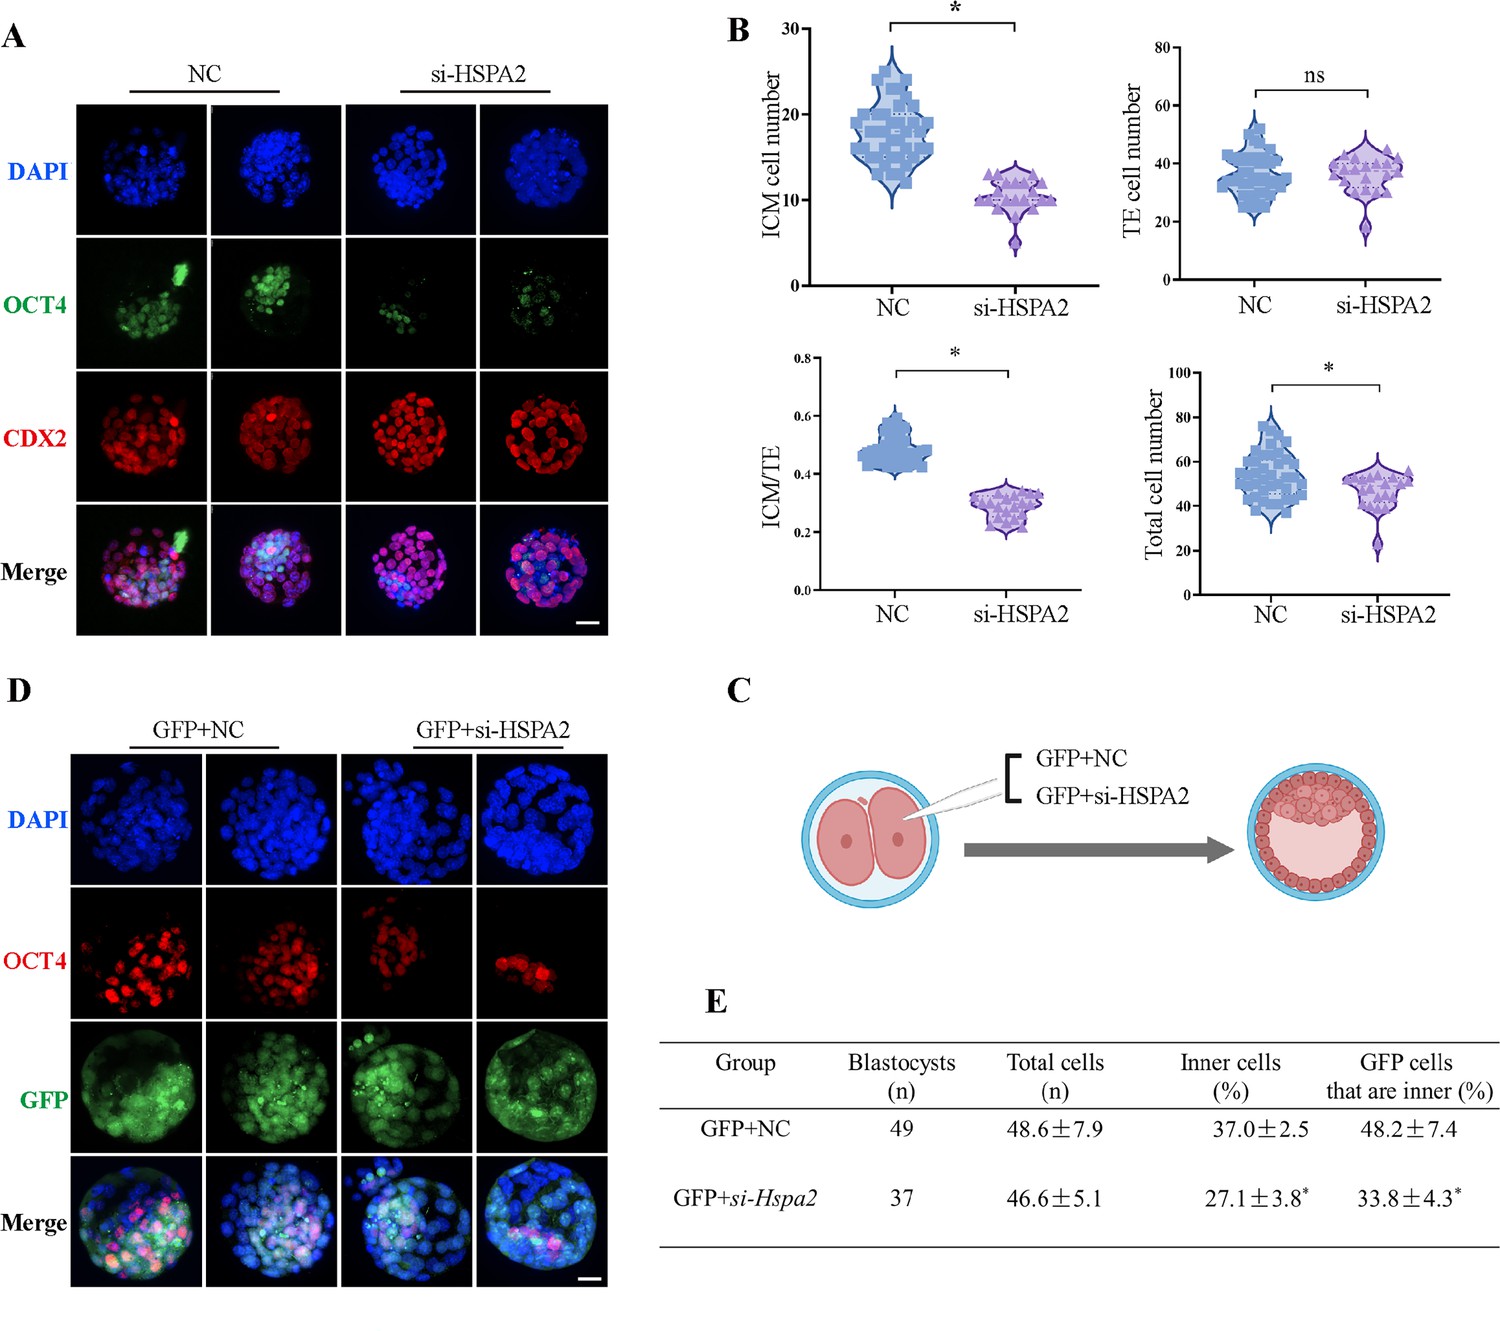
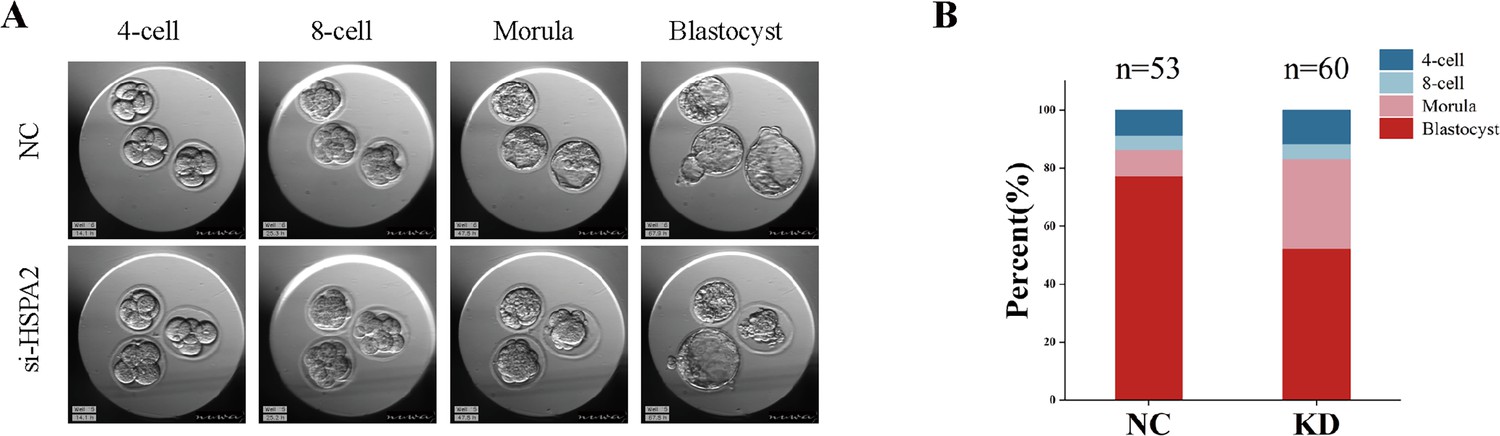
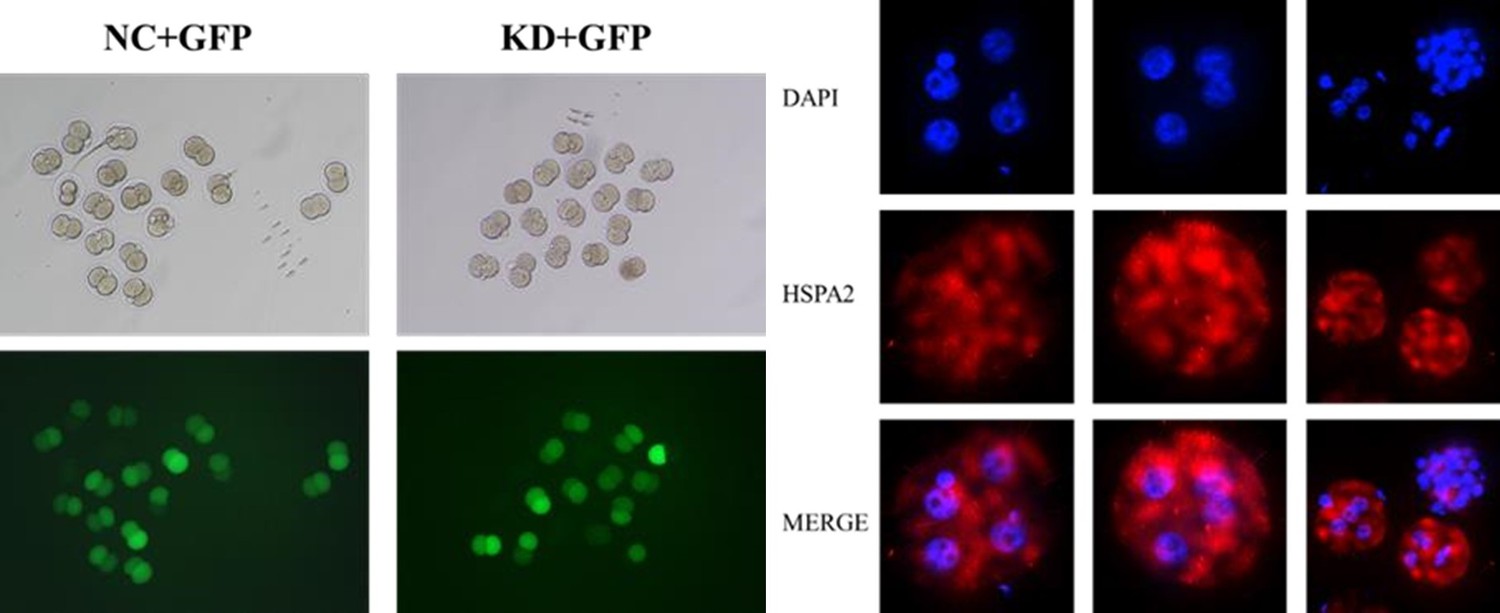
Knockdown of Hspa2 prevents blastomeres from undergoing an ICM fate.
(A) Immunofluorescence of OCT4 (green) and CDX2 (red) in NC (n=40) and si-Hspa2 (n=36) groups. OCT4 was used as an ICM marker. Nuclei were visualized with DAPI staining (blue). Bar, 50 μm. (B) The number of ICM and TE. OCT4 was used as an ICM marker and CDX2 was used as a TE marker. *p<0.05. (C) Schematic diagram of microinjection of early 2-cell embryo single blastomeres. Created in BioRender. (D) OCT4 and GFP fluorescent staining of blastocysts. OCT4 was used as an ICM marker. The results show that less OCT4-positive cells are GFP-positive in embryos injected with GFP and Hspa2 siRNA (GFP +si-Hspa2). Three experimental replicates were performed. Bar, 50 μm. (E) Analysis of the distribution of progeny of injected blastomere at the blastocyst stage based on fluorescence staining. Total cells (n) are the total number of cells in the blastocyst; inner cells (%) is the percentage of inner cells relative to the total number of cells in the blastocyst; GFP cells that are inner (%) is the percentage of GFP-positive inner cells relative to the total number of GFP-positive cells in the blastocyst. Data derived from three independent experiments and presented as mean ± standard deviation. Three experimental replicates were performed. *p<0.05.
Figure 3—figure supplement 1
Knockdown of Hspa2 prevents blastomeres from undergoing an ICM fate.
(A) Representative images of preimplantation embryos in the NC and KD groups from 2 cell to blastocyst. (B) Bar plots showing the developmental rates of NC group and KD group at the blastocyst stage.
Figure 4 with 1 supplement
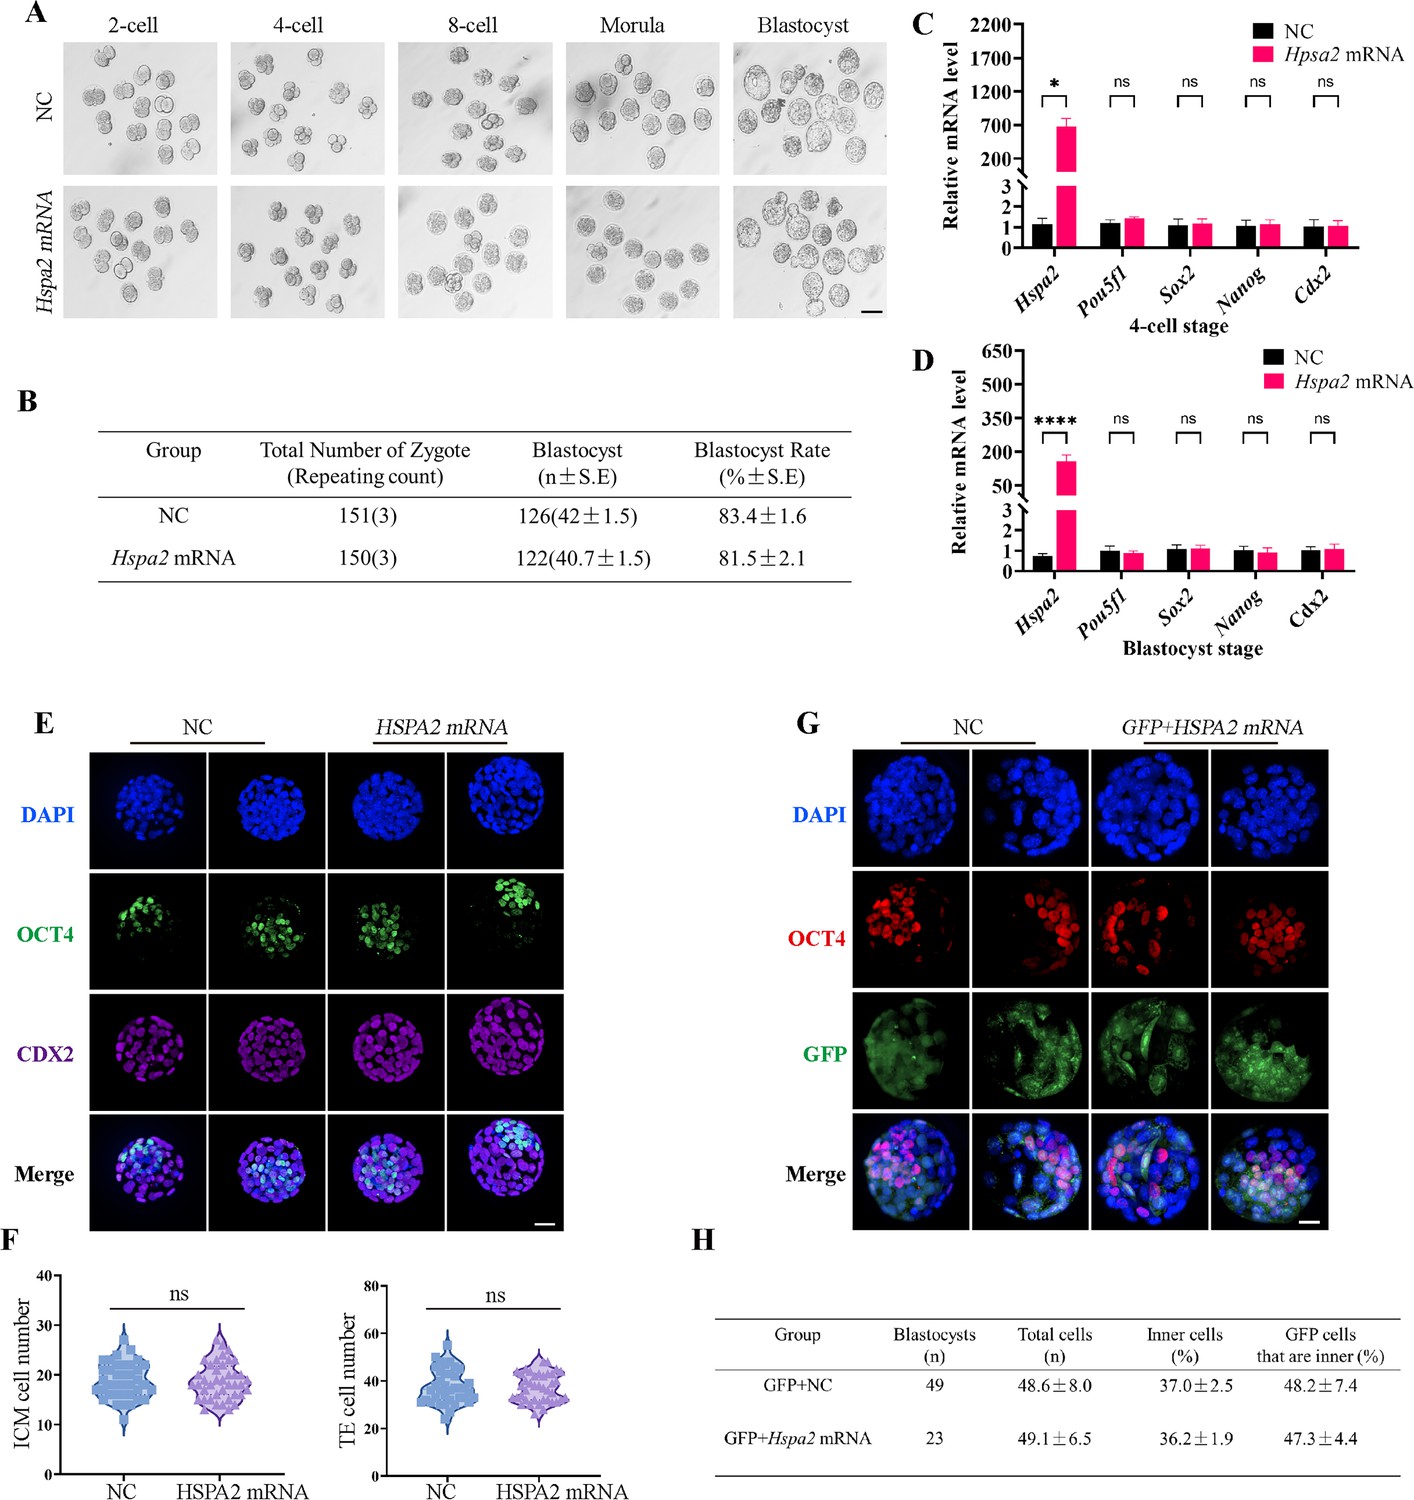
Overexpression of Hspa2 does not induce blastocyst bias towards ICM fate.
(A) Representative images of preimplantation embryos in the NC and Hspa2 mRNA groups from 2 cell to blastocyst. Bar, 100 μm. (B) The blastocyst rate between NC (n=151) and overexpression (n=150) groups. Three experimental replicates were performed. (C, D) qRT-PCR of 4-cell embryo and blastocyst showed that ICM-marker gene (Pou5f1, Sox2, and Nanog) and TE-marker gene (Cdx2) were not significantly different in the overexpression compared with the control group. Three experimental replicates were performed. *p<0.05, ****p<0.001. (E) Immunofluorescence of OCT4 (green) and CDX2 (purple) in NC (n=38) and overexpression (n=40) groups. OCT4 was used as an ICM marker. Nuclei were visualized with DAPI staining (blue). Bar, 50 μm. (F) The number of ICM and TE. OCT4 was used as an ICM marker and CDX2 was used as a TE marker. (G) OCT4 and GFP fluorescent staining of blastocysts. OCT4 was used as an ICM marker. The results show that the percentage of GFP cells that were present in the ICM was similar between the two groups. Three experimental replicates were performed. Bar, 50 μm. (H) Analysis of the distribution of progeny of injected blastomere at the blastocyst stage based on fluorescence staining. Total cells (n) are the total number of cells in the blastocyst; inner cells (%) are the percentage of inner cells relative to the total number of cells in the blastocyst; GFP cells that are inner (%) are the percentage of GFP-positive inner cells relative to the total number of GFP-positive cells in the blastocyst. Data derived from three independent experiments and presented as mean ± standard deviation. Three experimental replicates were performed.
Figure 4—figure supplement 1

Overexpression of Hspa2 not induces blastocyst bias towards ICM fate.
(A) Western blot results confirming the overexpression of HSPA2 protein in the blastocyst stages. Three experimental replicates were performed. OE, overexpression.
-
Figure 4—figure supplement 1—source data 1
PDF file containing original western blot, indicating relevant band.
- https://cdn.elifesciences.org/articles/100730/elife-100730-fig4-figsupp1-data1-v1.zip
-
Figure 4—figure supplement 1—source data 2
Original files for western blot analysis.
- https://cdn.elifesciences.org/articles/100730/elife-100730-fig4-figsupp1-data2-v1.zip
Figure 5 with 1 supplement
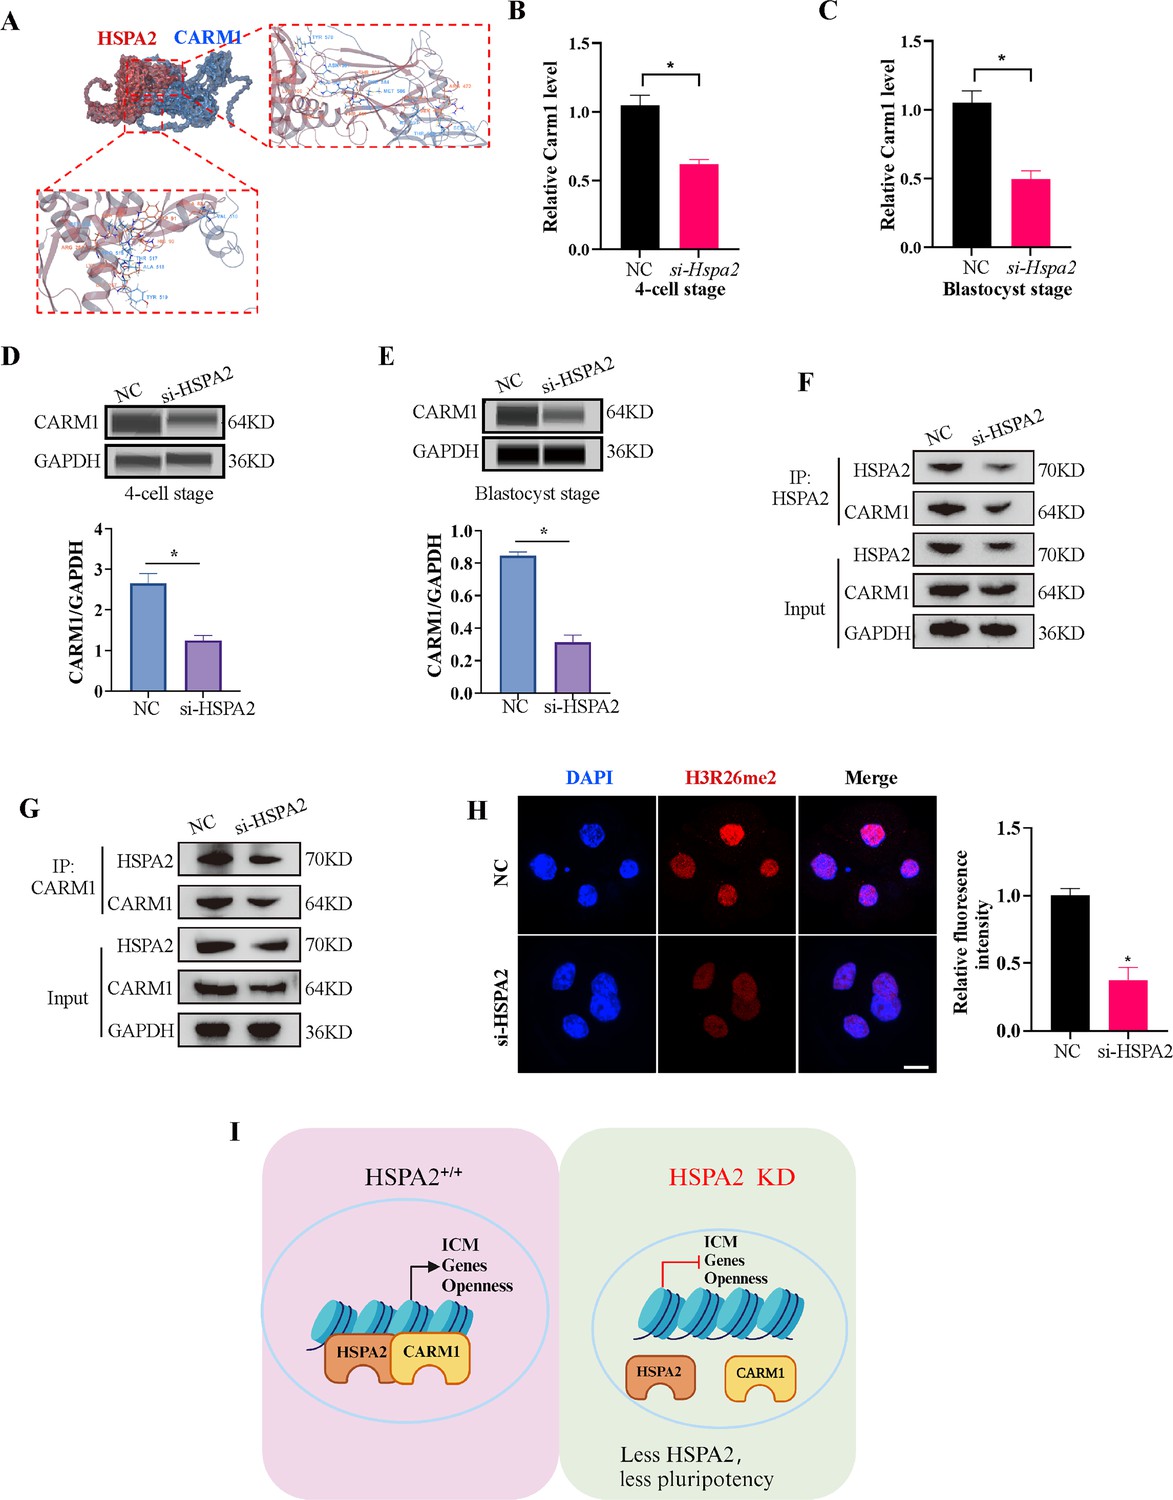
HSPA2 and CARM1 form a complex.
(A) Molecular docking analysis for HSPA2 binding to CARM1 proteins. (B, C) qRT-PCR of 4 cell embryo and blastocyst showed that Carm1 was significantly lower in the interference compared with the control group. Three experimental replicates were performed. *p<0.05. (D, E) Automated western blotting analysis of CARM1 expression in the interference and control groups. The band intensity was assessed. Three experimental replicates were performed. *p<0.05 (F, G) Co-IP analysis of HSPA2 and CARM1 in mESCs. (H) H3R26me2 staining of 4-cell embryo shows that HSPA2 knockdown led to a dramatic decrease in H3R26me2 modification. Intensity relative to DAPI signal was used. Three experimental replicates were performed. Bar, 50 μm. *p<0.05. (I) The model of HSPA2 physically binds to CARM1 to activate ICM-specific gene expression. Created in BioRender.
-
Figure 5—source data 1
PDF file containing original western blots, indicating relevant band.
- https://cdn.elifesciences.org/articles/100730/elife-100730-fig5-data1-v1.zip
-
Figure 5—source data 2
Original files for western blot analysis.
- https://cdn.elifesciences.org/articles/100730/elife-100730-fig5-data2-v1.zip
Figure 5—figure supplement 1
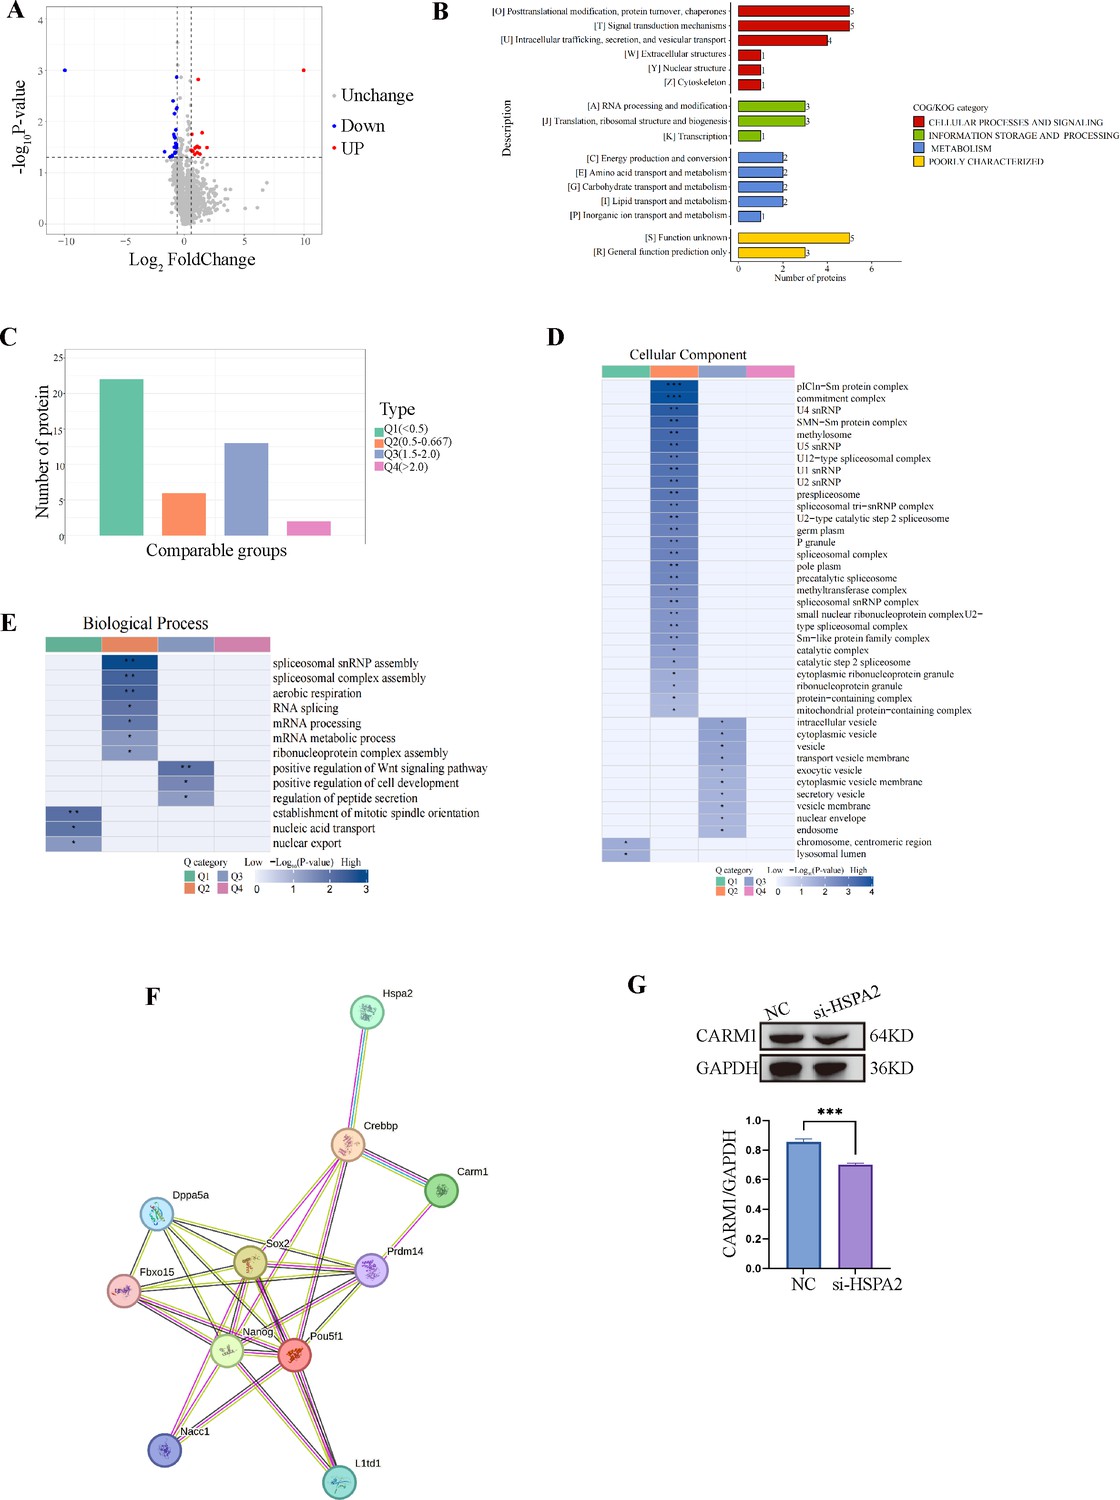
HSPA2 interacts with CARM1 and alters H3R26me2 levels.
(A) Volcano plot of the DEPs in Hspa2 siRNA and control groups at blastocyst stage. (B) COG/KOG enrichment analysis for DEPs. (C) Quantitative classification and numbers of DEPs in each quantified part. The DEPs were divided into four quantified parts according to their differential expression multiples: Q1 (<0.5), Q2 (0.5–0.667), Q3 (1.5–2.0), and Q4 (>2.0). (D, E) Clustering analysis including biological process analysis (D) and cellular component (E) of quantitative DEPs in each Q group. (F) The protein-protein interactions (PPIs) network was mapped by STRING database (https://version-12-0.string-db.org/cgi/network?networkId=bX85xFRgXlJ5). (G) Western blot analysis of CARM1 expression in the knockdown and control groups. The band intensity was assessed with ImageJ. Three experimental replicates were performed. ***p<0.001.
-
Figure 5—figure supplement 1—source data 1
PDF file containing original western blot, indicating relevant band.
- https://cdn.elifesciences.org/articles/100730/elife-100730-fig5-figsupp1-data1-v1.pdf
-
Figure 5—figure supplement 1—source data 2
Original files for western blot analysis displayed in.
- https://cdn.elifesciences.org/articles/100730/elife-100730-fig5-figsupp1-data2-v1.zip
Author response image 1
Author response image 2

Tables
Table 1
List of mouse primer pairs used for RT-qPCR analysis.
| Gene | Forward primer (5’–3’) | Reverse primer (5’–3’) |
|---|---|---|
| Hspa2 | AAGATTTCTTCAACGGCAAGGAG | GGGATCGTGGTGTTTCTCTTGAT |
| Pou5f1 | GGGTGATGGGTCAGCAG | TCCGCAGAACTCGTATGC |
| Sox2 | AACGCCTTCATGGTATGG | CTCGGTCTCGGACAAAAG |
| Nanog | CTGCTCCGCTCCATAACT | GGCTTTCCCTAGTGGCTT |
| Cdx2 | GAAGGGGTGGTGGGTTC | AGGTTGGCTCTGGCATTT |
| Hprt | GGCTTCCTCCTCAGACCGCTTT | CACTTTTTCCAAATCCTCGGCATAA |
Additional files
Download links
A two-part list of links to download the article, or parts of the article, in various formats.
Downloads (link to download the article as PDF)
Open citations (links to open the citations from this article in various online reference manager services)
Cite this article (links to download the citations from this article in formats compatible with various reference manager tools)
The asymmetric expression of HSPA2 in blastomeres governs the first embryonic cell-fate decision
eLife 13:RP100730.
https://doi.org/10.7554/eLife.100730.3


