Amidase and lysozyme dual functions in TseP reveal a new family of chimeric effectors in the type VI secretion system
- State Key Laboratory of Microbial Metabolism, Joint International Research Laboratory of Metabolic & Developmental Sciences, School of Life Sciences and Biotechnology, Shanghai Jiao Tong University, China
- Department of Immunology and Microbiology, School of Life Sciences, Guangming Advanced Research Institute, Southern University of Science and Technology, China
- National Facility for Protein Science in Shanghai, Shanghai Advanced Research Institute, Chinese Academy of Sciences, China
- School of Pharmaceutical Sciences, Wuhan University, China
- Department of Physiology, University of Toronto, Canada
Figures
Figure 1 with 1 supplement
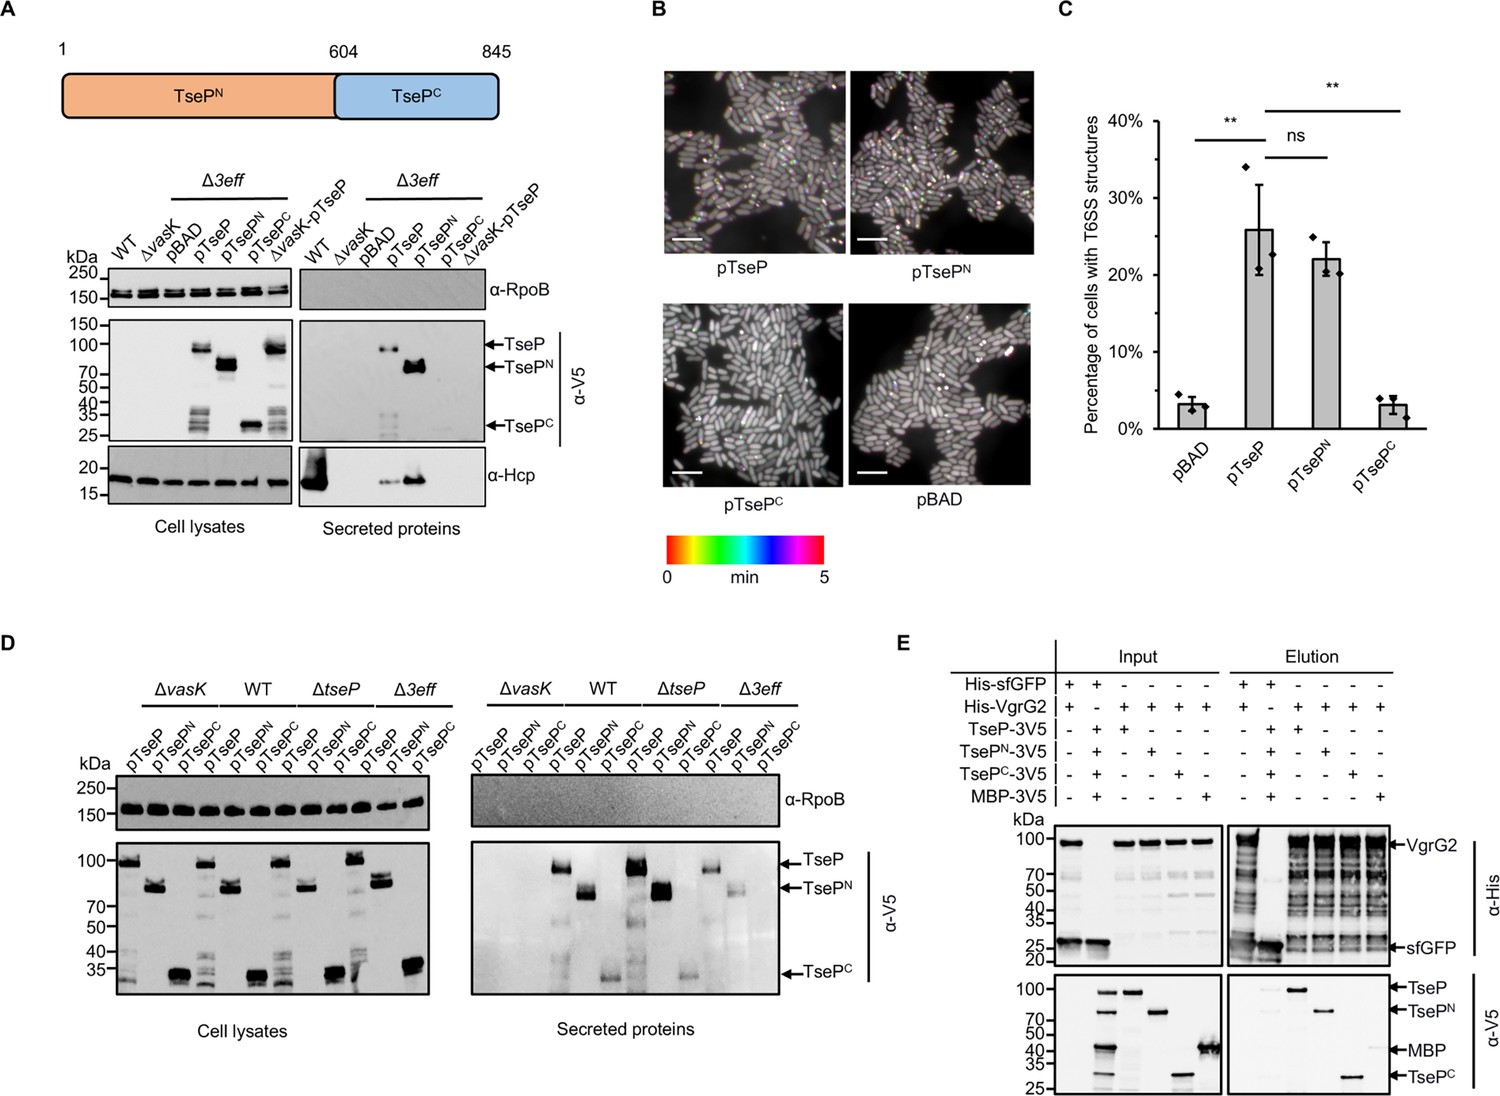
Structural roles and independent secretion of TseP domains.
(A) Secretion analysis of TseP, TsePN, and TsePC in the SSU triple effector deletion mutant (Δ3eff). A schematic of the TseP N-terminus (TsePN, 1–603aa) and C-terminus (TsePC, 604–845aa) is depicted at the top. Hcp serves as a positive control for type VI secretion system (T6SS) secretion. Hcp, RpoB, and 3V5-tagged TseP proteins were detected using specific antibodies. (B) Time-lapse imaging of VipA-sfGFP signals in the Δ3eff mutant complemented with different TseP variants. Each sample was captured every 10 s for 5 min and temporally color-coded. Color scale used to temporally color-code the VipA-sfGFP signals is shown at the bottom. A 30×30 μm2 representative field of cells is shown. Scale bars, 5 μm. (C) Statistical analysis of T6SS sheath assemblies in the Δ3eff mutant complemented with different TseP variants. Error bars indicate the mean ± standard deviation of three biological replicates, and statistical significance was calculated using a two-tailed Student’s t-test. ns, not significant; **, p<0.01. (D) Secretion analysis of TseP, TsePN, and TsePC in SSU wild-type, ΔvasK, ΔtseP, and Δ3eff mutants. For (B) and (D) TseP, TsePN, and TsePC were tagged with a 3V5 C-terminal tag and expressed on pBAD vectors. RpoB serves as an equal loading and autolysis control. (E) Pull-down analysis of VgrG2 with TseP, TsePN, and TsePC. His-tagged VgrG2 and 3V5-tagged TseP, TsePN, or TsePC were used. His-tagged sfGFP and 3V5-tagged MBP were used as controls.
-
Figure 1—source data 1
Original files for Western blot analysis displayed in Figure 1A, D, and E.
- https://cdn.elifesciences.org/articles/101125/elife-101125-fig1-data1-v1.zip
-
Figure 1—source data 2
PDF file containing original Western blots for Figure 1A, D, and E.
- https://cdn.elifesciences.org/articles/101125/elife-101125-fig1-data2-v1.zip
Figure 1—figure supplement 1
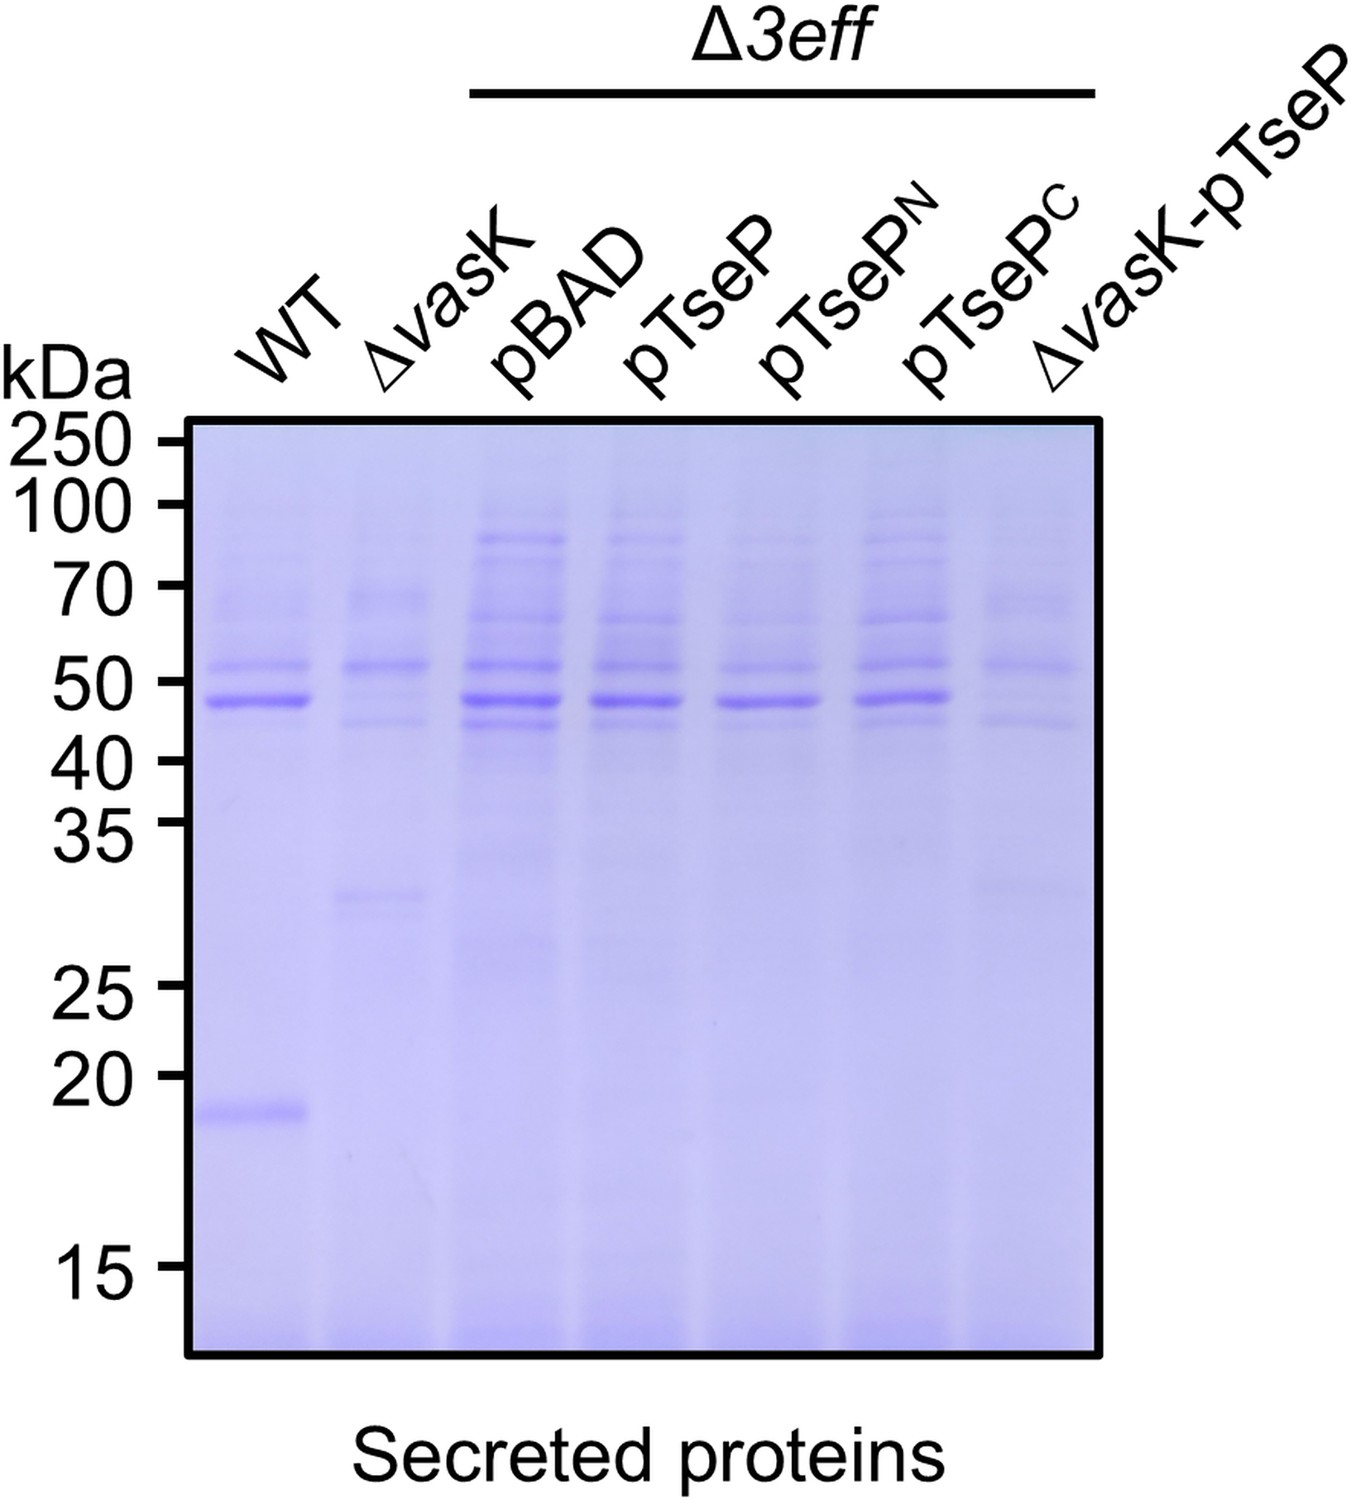
Staining SDS-PAGE of secretion of TseP, TsePN, and TsePC in the SSU triple effector deletion mutant (Δ3eff).
The secretion proteins were visualized by SDS-PAGE and stained with Coomassie brilliant blue dye.
-
Figure 1—figure supplement 1—source data 1
Original files for SDS-PAGE analysis displayed in Figure 1—figure supplement 1.
- https://cdn.elifesciences.org/articles/101125/elife-101125-fig1-figsupp1-data1-v1.zip
-
Figure 1—figure supplement 1—source data 2
PDF file containing original SDS-PAGE for Figure 1—figure supplement 1.
- https://cdn.elifesciences.org/articles/101125/elife-101125-fig1-figsupp1-data2-v1.zip
Figure 2 with 1 supplement
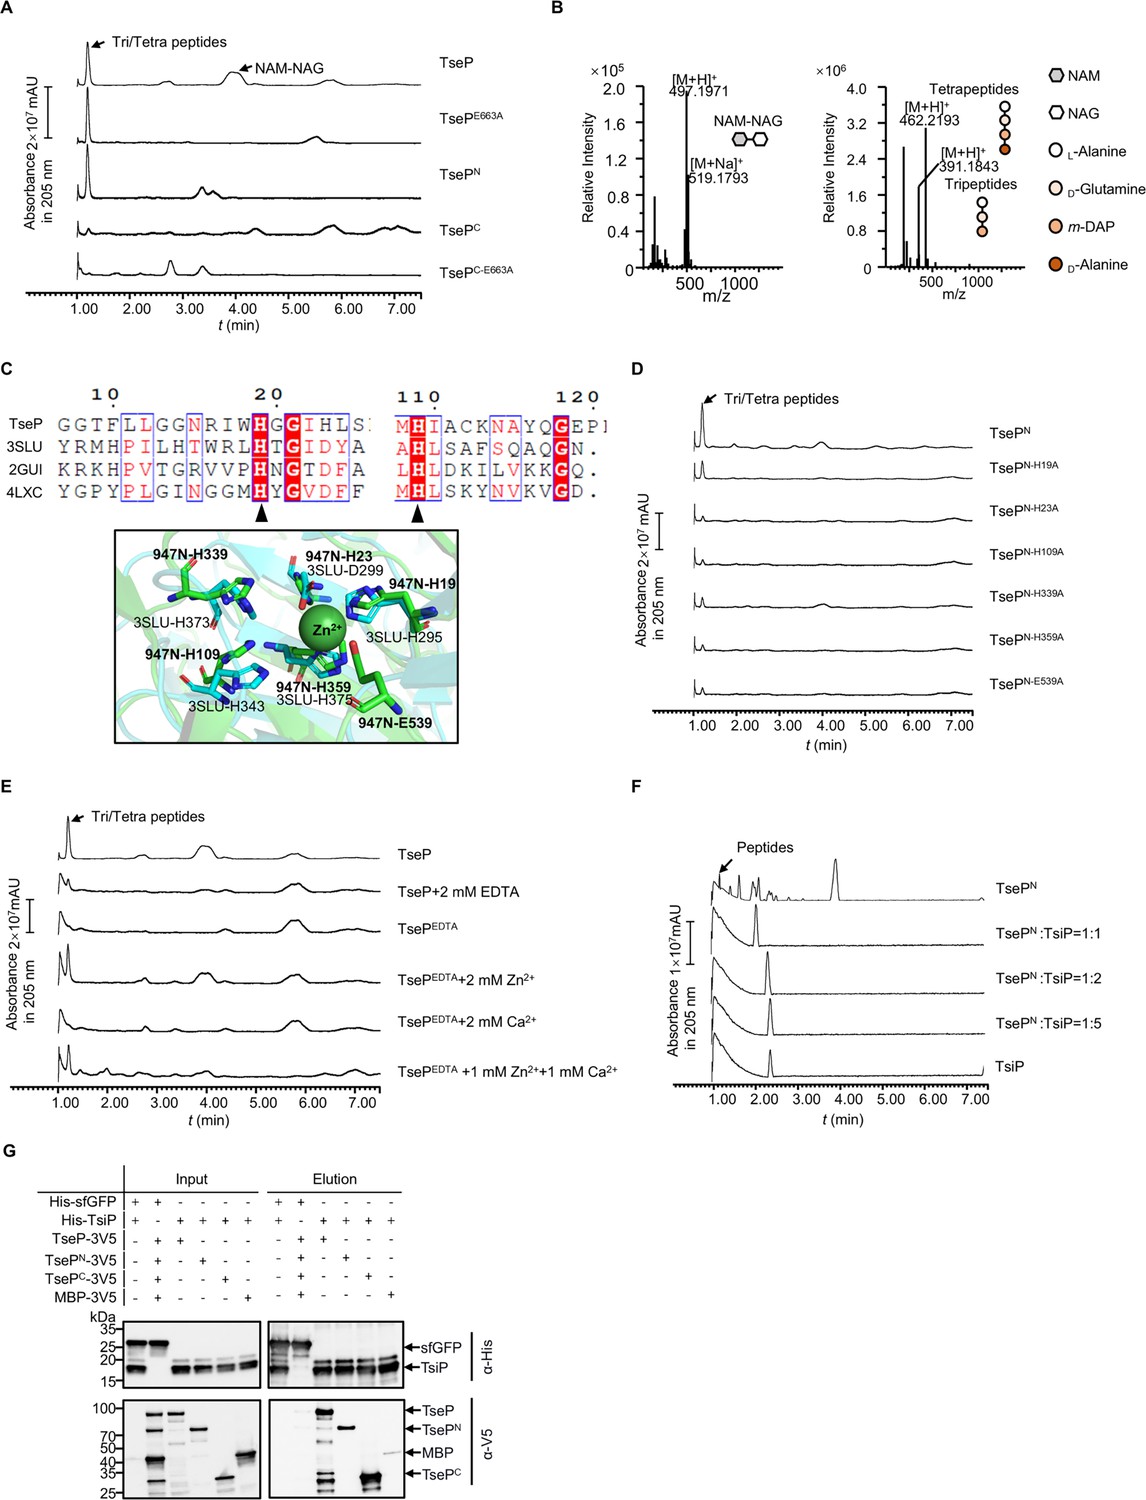
Functional analysis of TseP reveals an amidase activity.
(A) In vitro amidase activity of the TseP, TsePN, TsePC, and the lysozyme inactivated mutants TsePE663A and TsePC-E663A. Cell-wall digestion products after incubation with the TseP or its mutants were analyzed by the ultraperformance liquid chromatography coupled with mass spectrometry (UPLC/MS). (B) MS analysis of cell-wall digestion products (N-acetylmuramic acid [NAM]-NAC, tetrapeptides, and tripeptides) following treatment with TseP. (C) Protein sequence alignment of the TseP amidase domain with other amidase homologs (top), and the structural superimposition of the TseP amidase domain and 3SLU (bottom). Cartoon representations of TseP and 3SLU are shown in green and cyan, respectively. The key residues involved in Zn2+ binding are shown in a stick model, and the zinc ion is indicated by the green sphere. (D) In vitro amidase activity of TsePN and its amidase site mutated variants. (E) In vitro amidase activity of TseP under cationic conditions of 2 mM EDTA, Zn2+, Ca2+, or a combination of both cations. TseP represents protein purified without EDTA treatment while TsePEDTA refers to protein purified in the presence of EDTA. (F) Peptidoglycan (PG) digestion analysis of TsePN with or without TsiP. The immunity protein TsiP was incubated with TsePN on ice for 12 hr before being mixed with PG. Products in (D), (E), and (F) were analyzed by UPLC-quadrupole time of flight (QTOF) mass spectrometry. (G) Pull-down analysis of TsiP with TseP, TsePN, and TsePC. His-tagged TsiP and 3V5-tagged TseP, TsePN, or TsePC were used. His-tagged sfGFP and 3V5-tagged MBP were used as controls.
-
Figure 2—source data 1
Original files for Western blot analysis displayed in Figure 2G.
- https://cdn.elifesciences.org/articles/101125/elife-101125-fig2-data1-v1.zip
-
Figure 2—source data 2
PDF file containing original Western blots for Figure 2G.
- https://cdn.elifesciences.org/articles/101125/elife-101125-fig2-data2-v1.zip
Figure 2—figure supplement 1
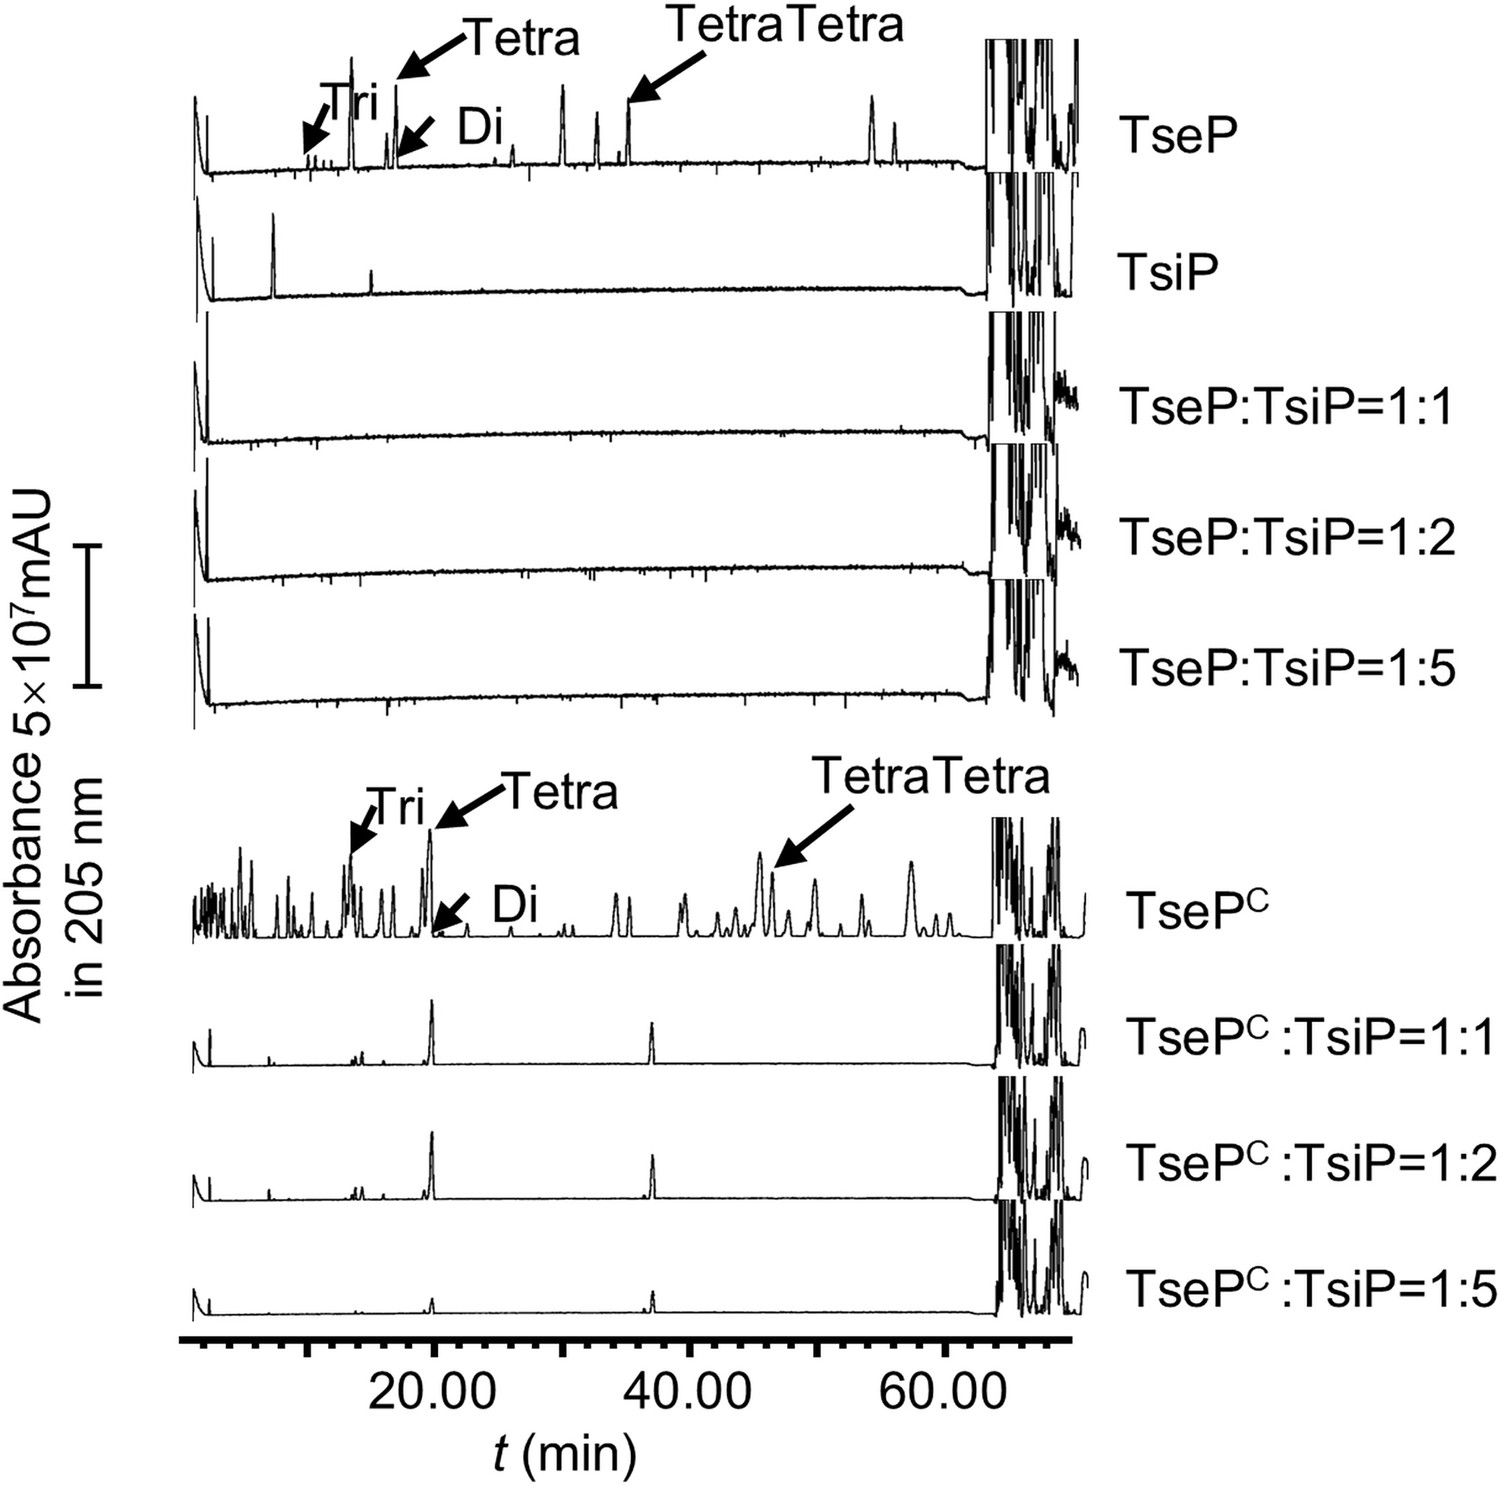
TsiP inhibits both the amidase and lysozyme activities of TseP.
The immunity protein TsiP was incubated with TseP or TsePC on ice for 12 hr before being mixed with peptidoglycan (PG). Products were analyzed by ultraperformance liquid chromatography-quadrupole time of flight (UPLC-QTOF) mass spectrometry.
Figure 3 with 1 supplement
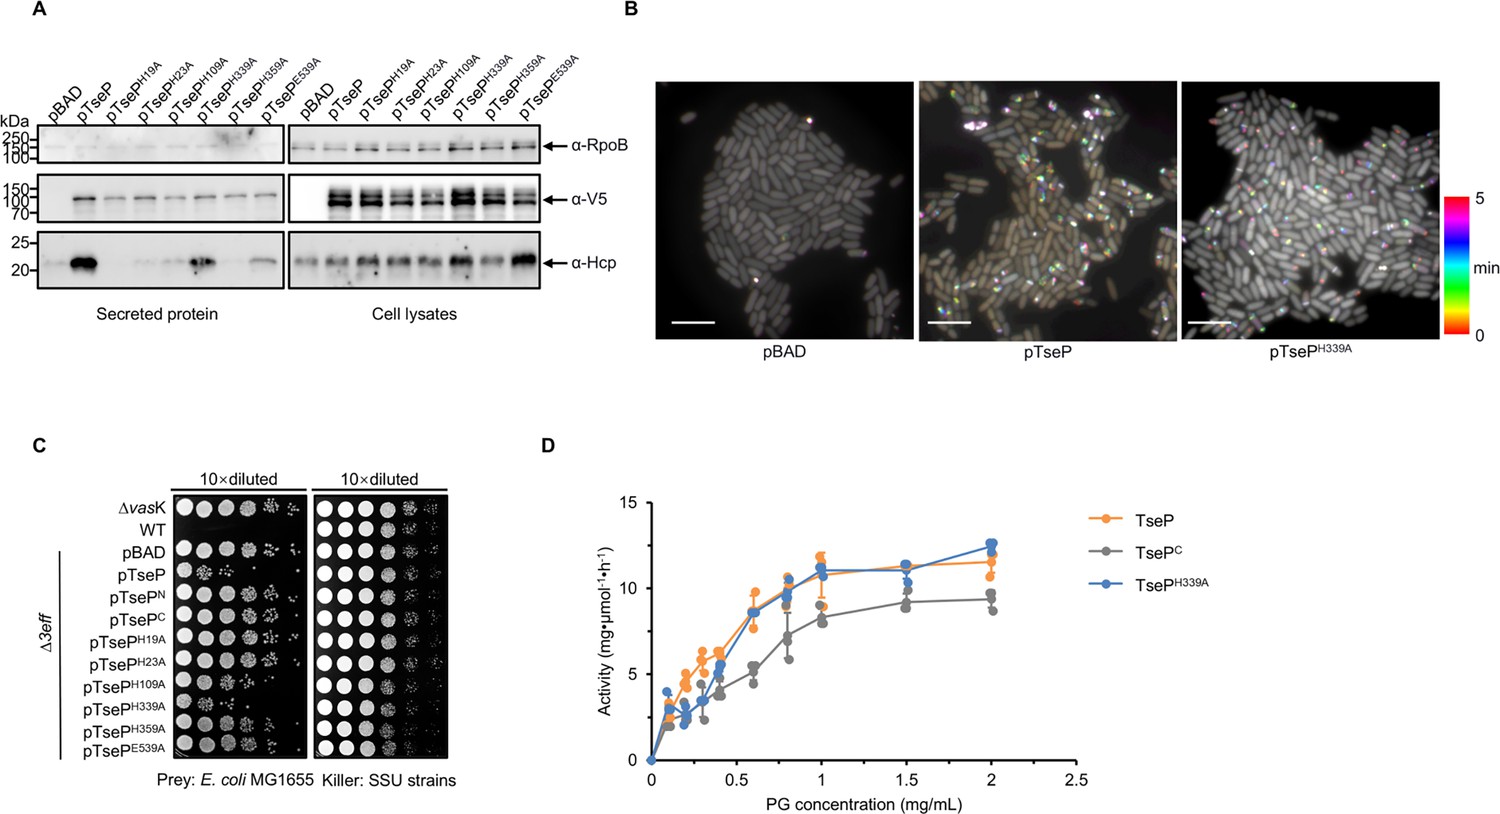
Amidase activity of TseP is not essential for type VI secretion system (T6SS) assembly or lysozyme function.
(A) Secretion analysis of Hcp in the Δ3eff mutant complemented with different TseP variants. RpoB serves as an equal loading and autolysis control. Hcp, RpoB, and 3V5-tagged TseP proteins were detected using specific antibodies. (B) Time-lapse imaging of VipA-sfGFP signals in the Δ3eff mutant complemented with TseP or its amidase-inactive mutant TsePH339A. Each sample was captured every 10 s for 5 min and temporally color-coded. Color scale used to temporally color-code the VipA-sfGFP signals is shown at the right. A 30×30 μm2 representative field of cells is shown. Scale bars, 5 μm. (C) Competition analysis of the Δ3eff mutant complemented with different TseP variants. Competition assays were repeated once. (D) Glycoside hydrolase activity of the TseP, TsePC, and amidase-inactive mutant TsePH339A. The error bars indicate the mean ± standard deviation of three biological replicates.
-
Figure 3—source data 1
Original files for Western blot analysis displayed in Figure 3A.
- https://cdn.elifesciences.org/articles/101125/elife-101125-fig3-data1-v1.zip
-
Figure 3—source data 2
PDF file containing original Western blots for Figure 3A.
- https://cdn.elifesciences.org/articles/101125/elife-101125-fig3-data2-v1.zip
Figure 3—figure supplement 1
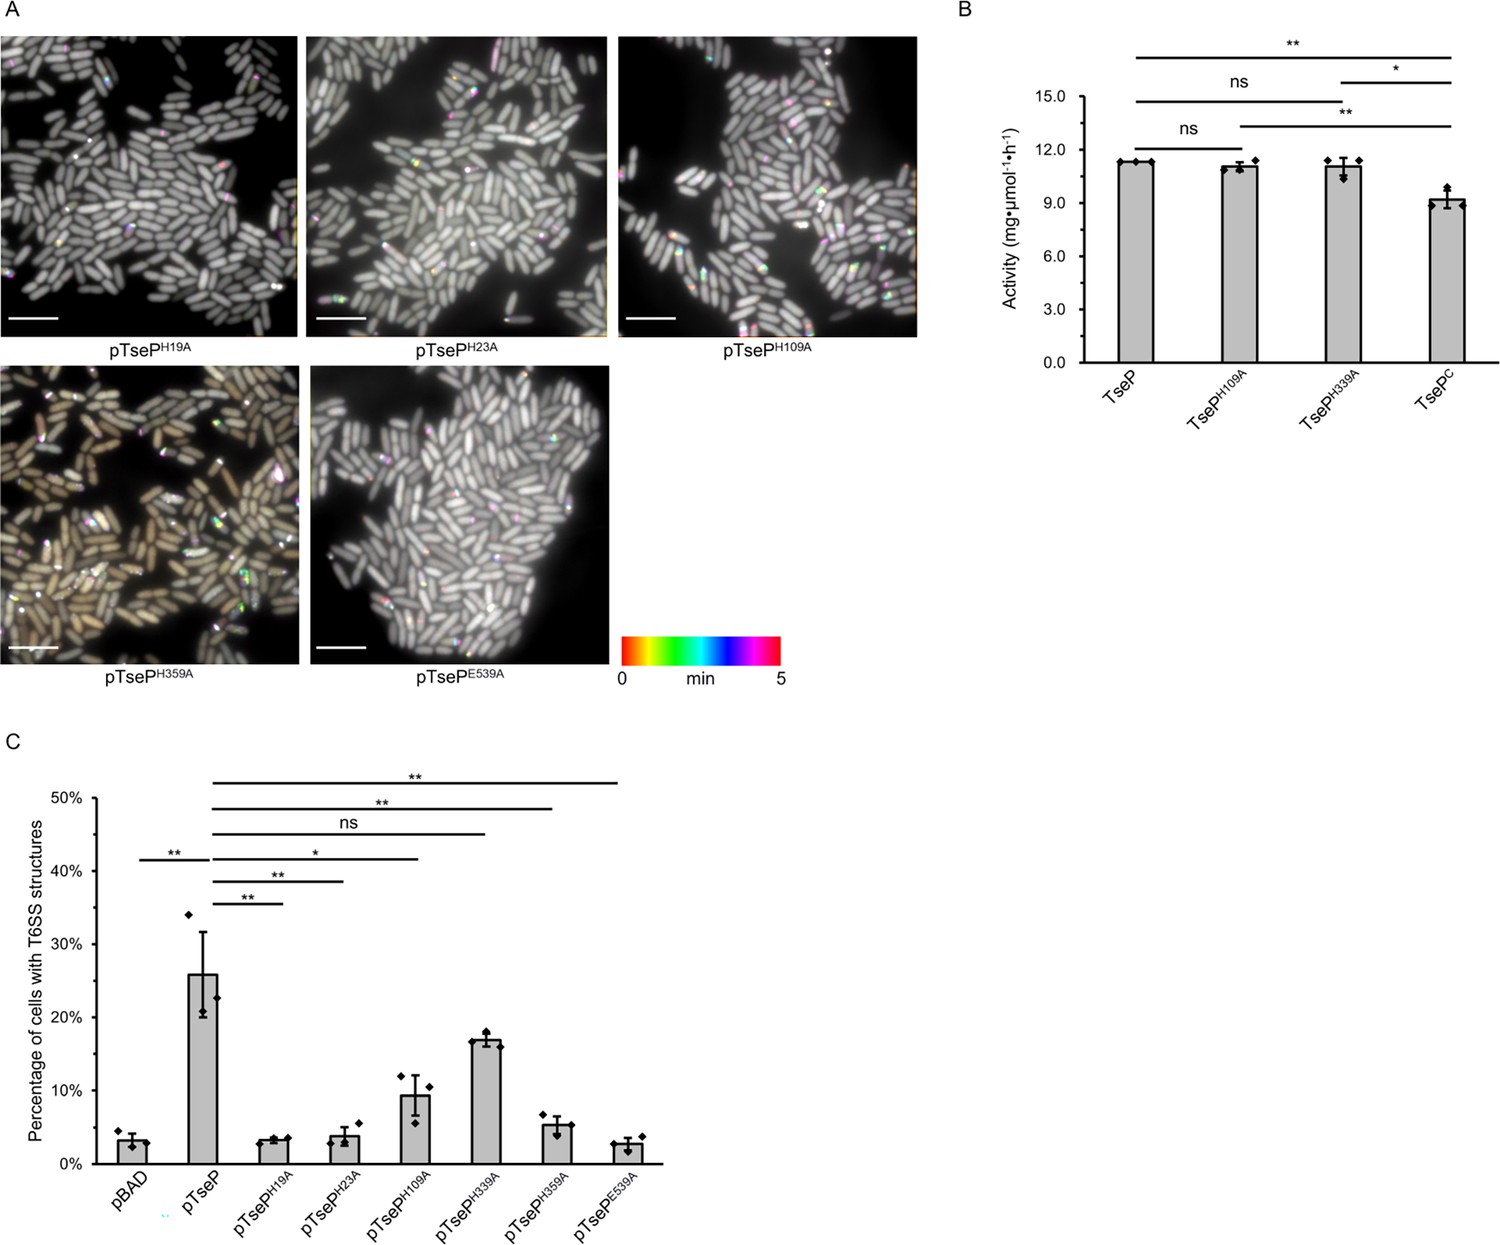
The amidase activity of TseP is not required for either type VI secretion system (T6SS) assembly or lysozyme function.
(A) Time-lapse imaging of VipA-sfGFP signals in the Δ3eff mutant complemented with different TseP amidase-inactive mutants. Each sample was captured every 10 s for 5 min and temporally color-coded. Color scale used to temporally color-code the VipA-sfGFP signals is shown at the bottom. A 30×30 μm2 representative field of cells is shown. Scale bars, 5 μm. (B) The maximum enzymatic activity of TseP and its variants. Peptidoglycan (PG) substrates (1.5 mg/ml) were treated with 10 nM TseP or its variants, respectively. (C) Statistical analysis of T6SS sheath assemblies in the Δ3eff mutant complemented with different TseP variants. For (B) and (C), error bars indicate the mean ± standard deviation of three biological replicates, and statistical significance was calculated using a two-tailed Student’s t-test. ns, not significant; *, p<0.05; **, p<0.01.
Figure 4 with 1 supplement
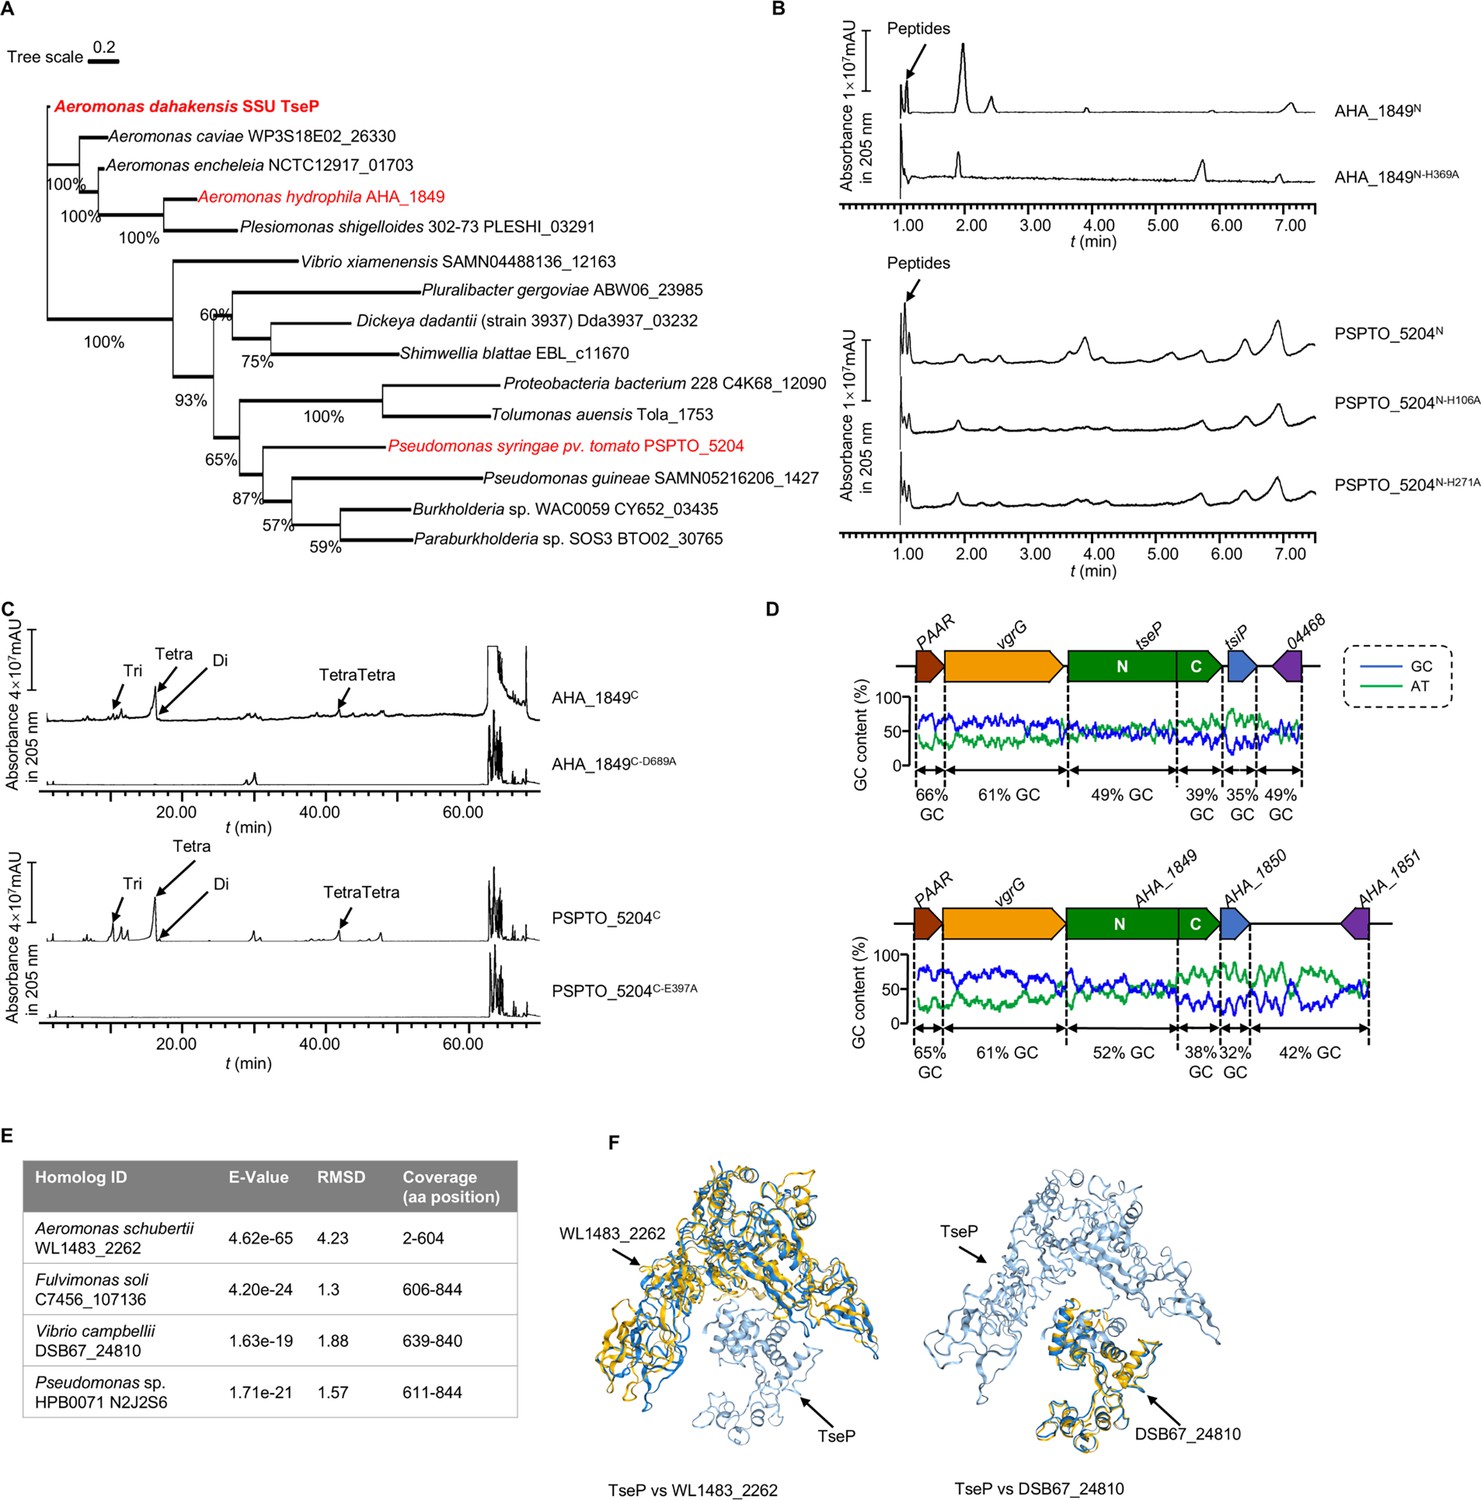
TseP homologs showed the same in vitro peptidoglycan (PG)-hydrolysis activity with the TseP.
(A) Maximum-likelihood phylogeny of TseP homologs. Phylogeny was constructed using the IQ-tree web server with bootstrap 1000 times. Proteins tested in this study are highlighted in red. (B) Amidase activity analysis of TseP homologs. (C) In vitro PG-hydrolysis activity of the TseP homologs. Products in (B) and (C) were analyzed through ultraperformance liquid chromatography-quadrupole time of flight (UPLC-QTOF) mass spectrometry. (D) GC contents of the tseP gene cluster and AHA_1849 gene cluster. (E) Summary of TsePN and TsePC homologs output by Foldseek Search server. (F) Structure alignments of TseP and homologs WL1483_2262 and DSB67_24810.
Figure 4—figure supplement 1
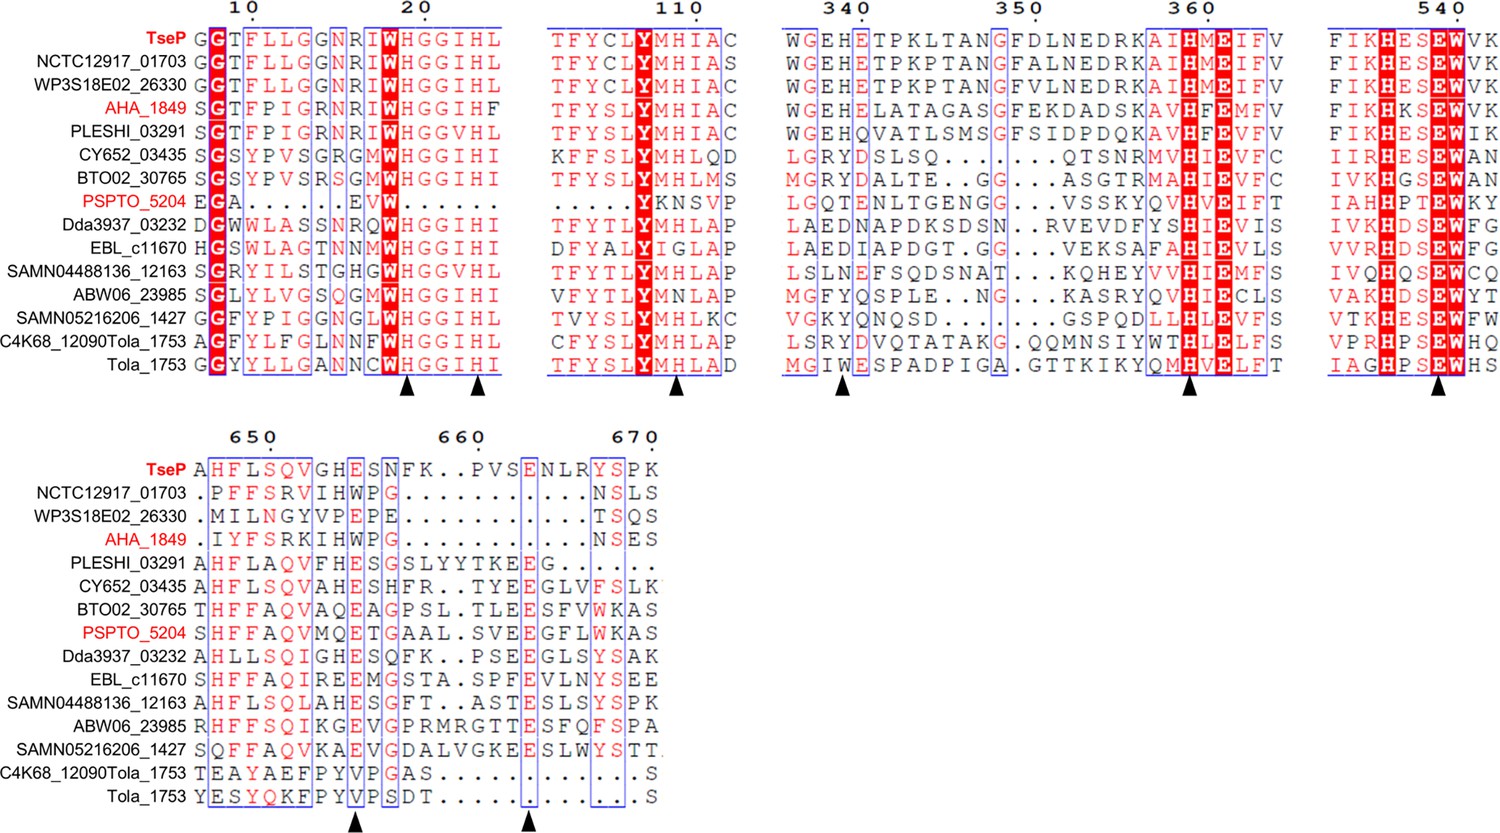
Protein sequence analysis of the TseP homologs.
Sequences were retrieved from UniProt and aligned using Jalview. Alignment view was generated using ESPript 3 with default settings. Proteins tested in this study are highlighted in red. The amidase active sites are marked with a black triangle at the bottom.
Figure 5 with 1 supplement
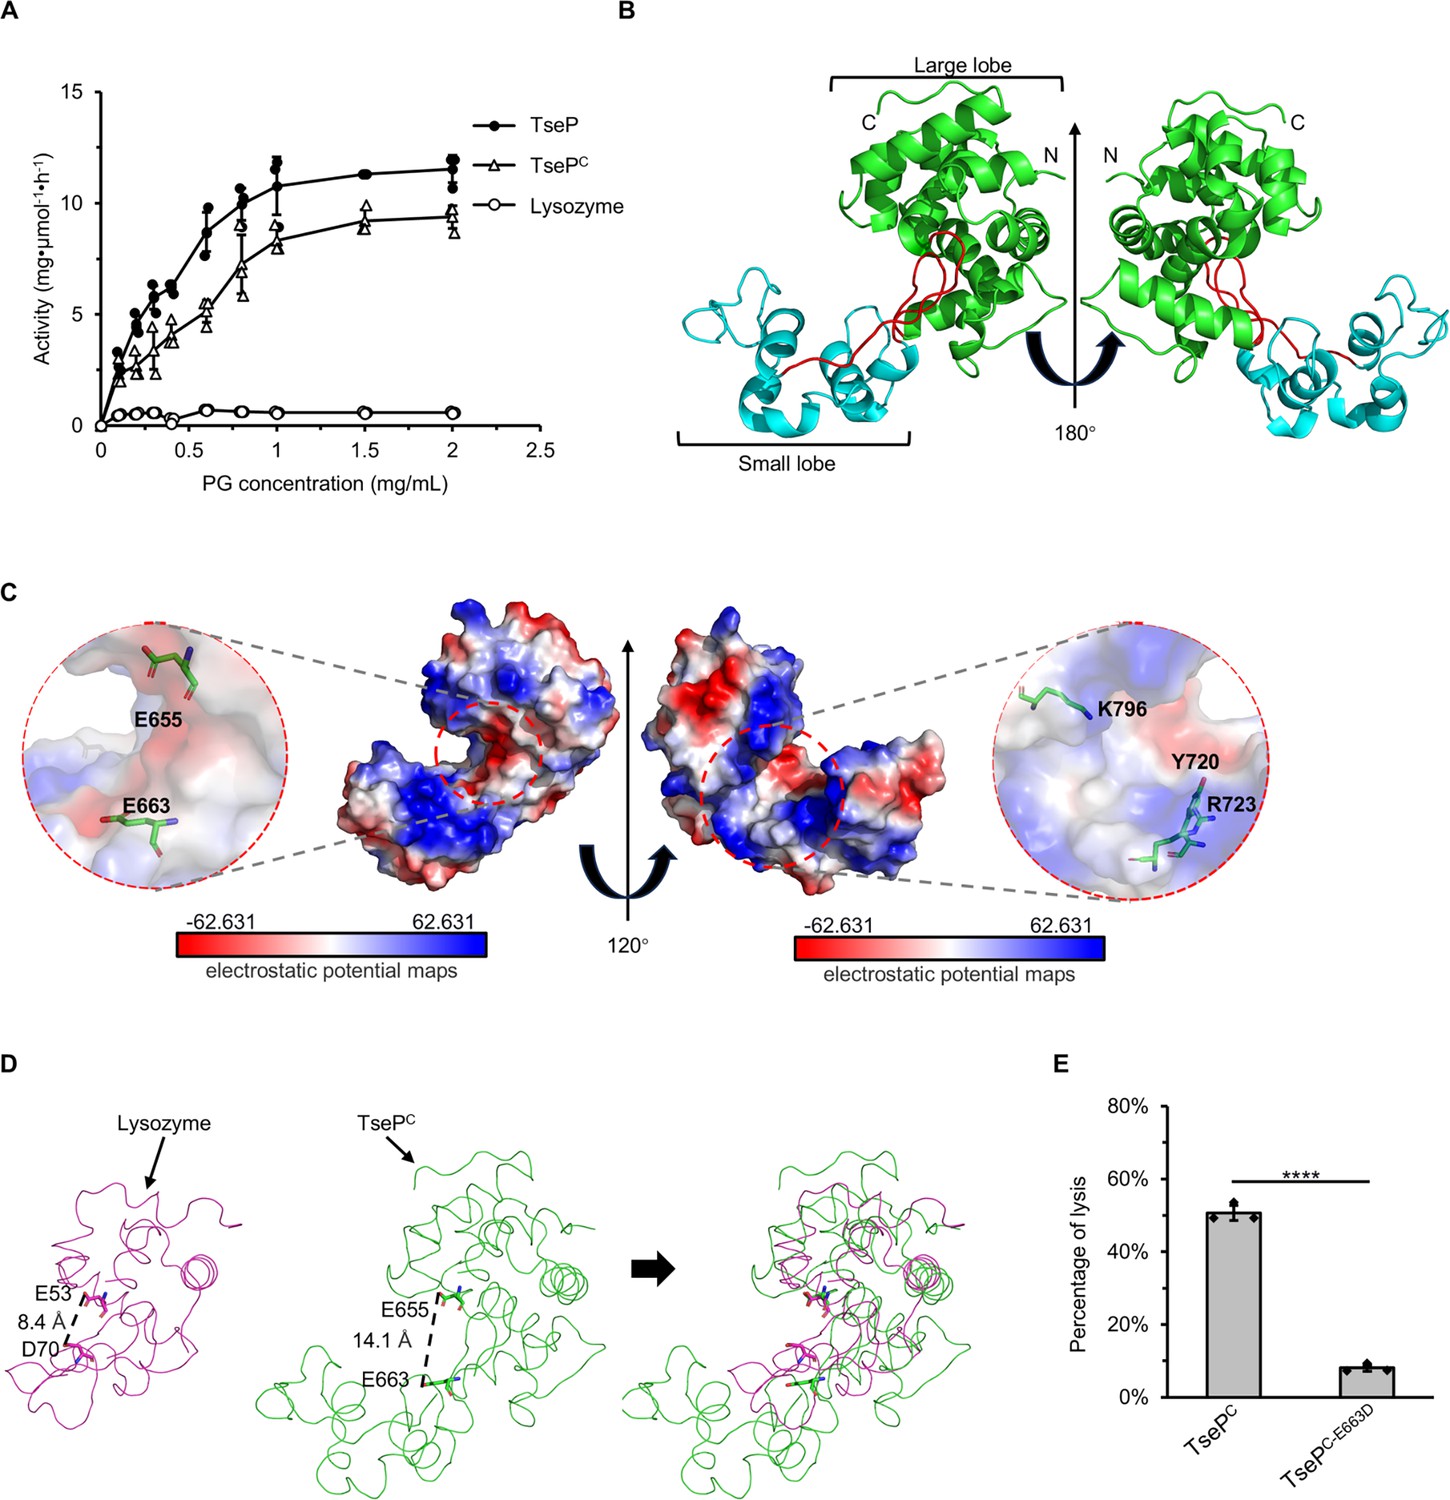
Crystal structure of TsePC.
(A) Enzymatic activity of TseP, TsePC, and lysozyme in hydrolyzing purified E. coli peptidoglycan (PG). The error bars indicate the mean standard deviation of three biological replicates. (B) The overall structure of the TsePC. The small lobe and large lobe are shown in cyan and green, respectively, with the connecting loop depicted in red. (C) Electrostatic potential maps of TsePC with the Y720, R723, and K796 shown as a stick model. The electrostatic surface potentials are colored red for negative charges, blue for positive charges, and white for neutral residues. (D) Structural comparison of TsePC and lysozyme (PDB ID: 1LZC). The catalytic sites are shown as a stick model. (E) E. coli PG-digestion analysis of TsePC and TsePC-E663D mutant. Error bars indicate the mean ± standard deviation of three biological replicates, and statistical significance was calculated using a two-tailed Student’s t-test. ****, p<0.0001.
Figure 5—figure supplement 1
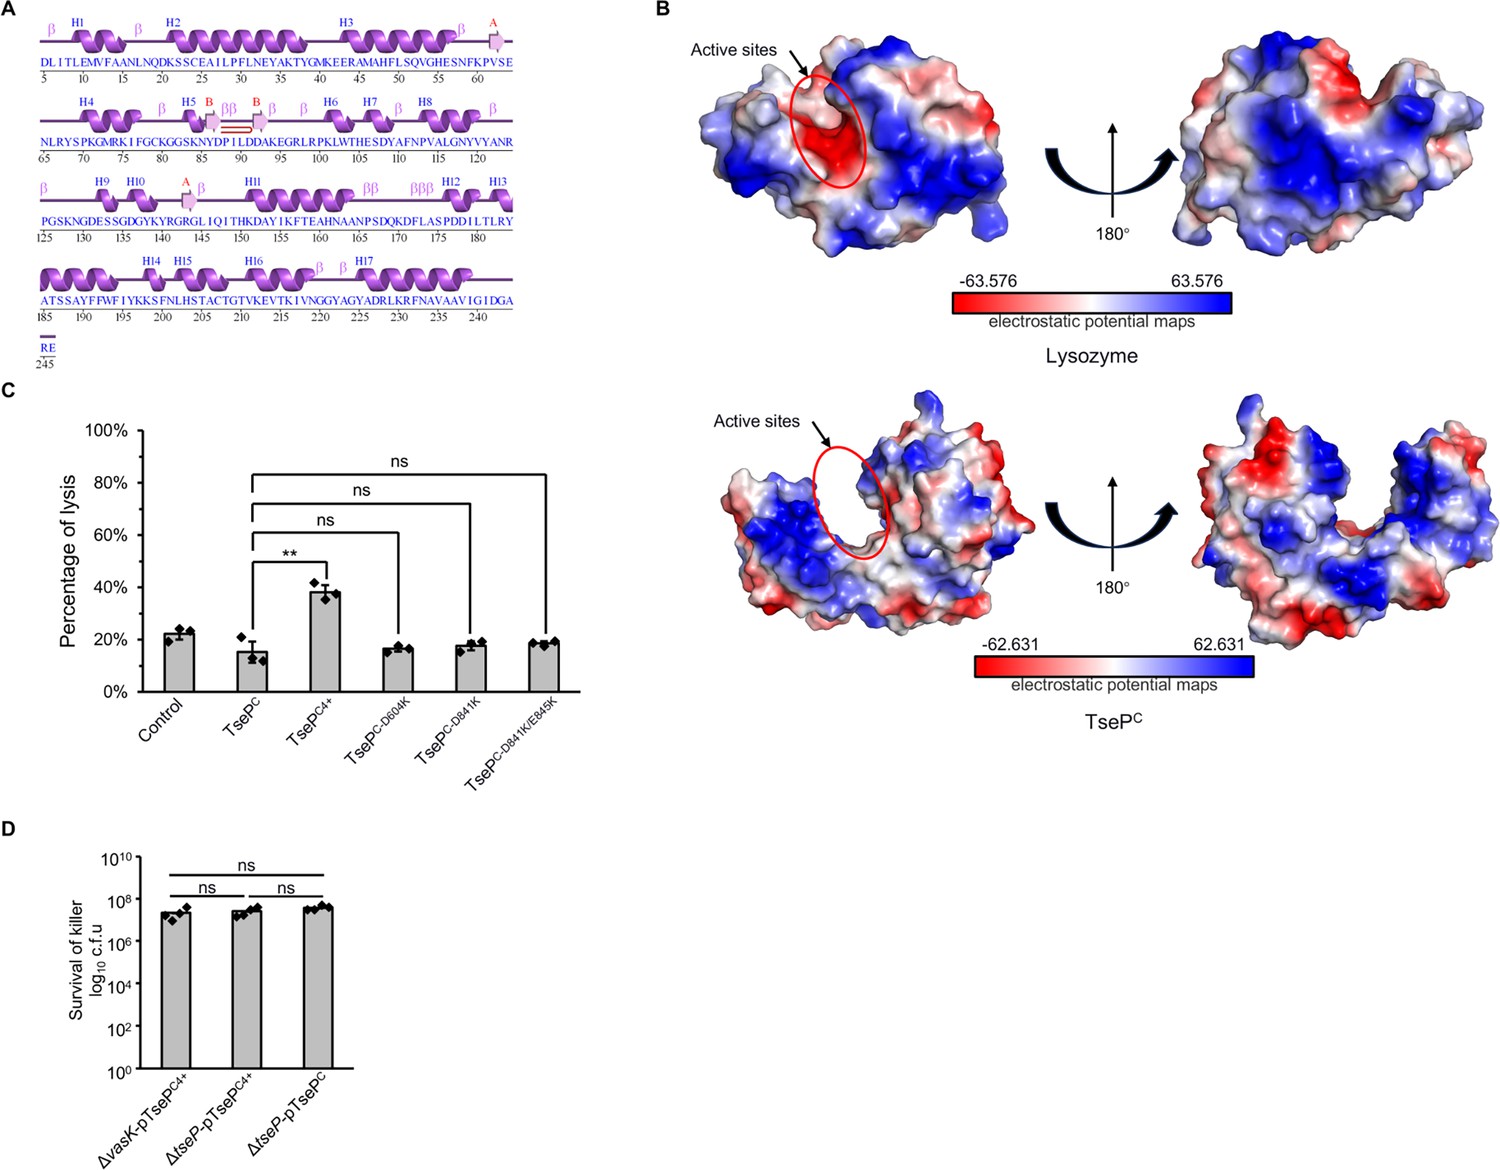
Structural and mutational analyses of the C-terminal domain.
(A) Secondary structure analysis of TsePC. Data was calculated using EMBL-EBI webs with PDBsum tool (https://www.ebi.ac.uk/thornton-srv/databases/pdbsum/). (B) Electrostatic potential maps of the TsePC and lysozyme. The electrostatic surface potentials were colored red for negative charges, blue for positive charges, and white for neutral residues. (C) Digestion of B. subtilis peptidoglycan (PG) with different TseP variants. Exponential phase B. subtilis cells (OD600~1.0) were used as substrates and the lysis percentage was calculated by detecting the changes in optical density at 600 nm. (D) Statistical analysis of killer cells during competition assays for which the survival of prey cells is shown in Figure 6F. For (C) and (D) error bars indicate the mean ± standard deviation of three biological replicates, and statistical significance was calculated using a two-tailed Student’s t-test. ns, not significant; **, p<0.01.
Figure 6 with 3 supplements
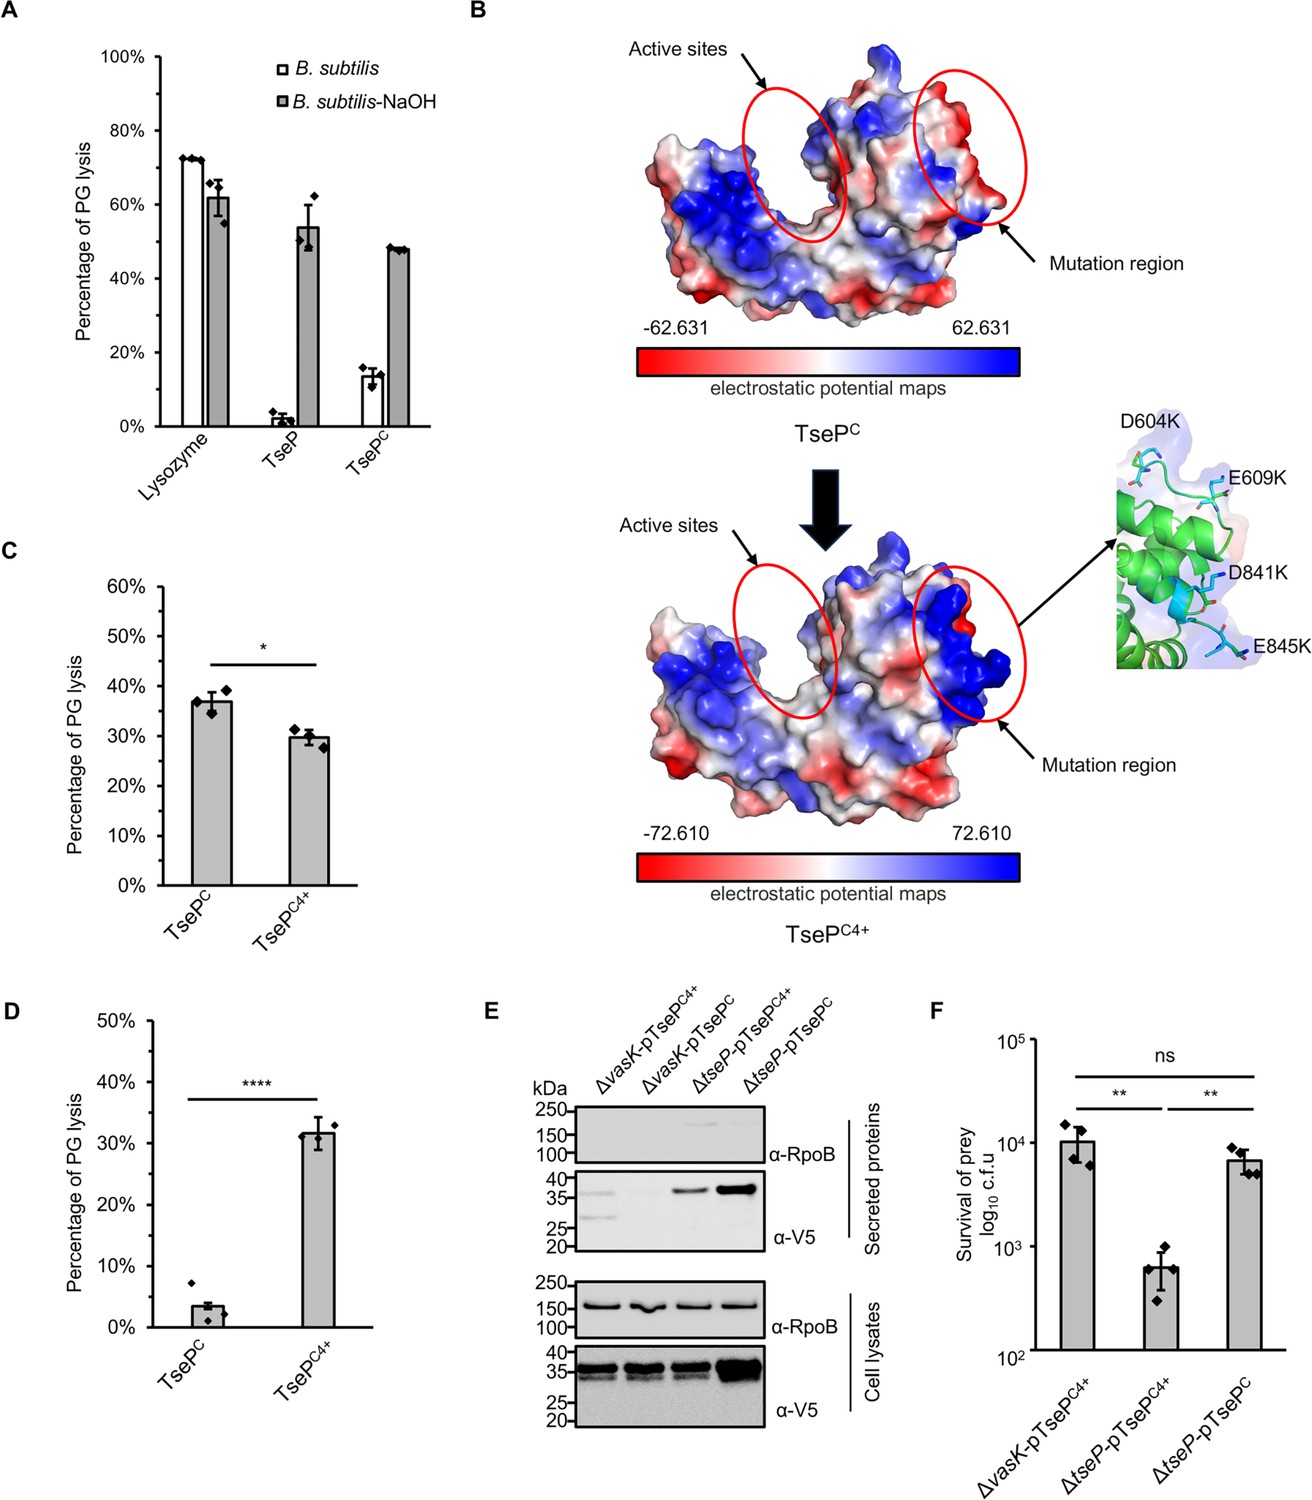
Modification of surface charge enables TsePC to kill Gram-positive bacteria.
(A) B. subtilis peptidoglycan (PG) digestion analysis of TseP and TsePC. PG was treated with 0.25 M NaOH for 12 hr at 37°C to remove cross-linked peptides and teichoic acid. The lysis percentage was calculated by detecting the changes of OD600 during 1 hr. The hen-egg lysozyme was used as a positive control. (B) Electrostatic potential maps of the TsePC and TsePC4+. The active sites and the mutation region are highlighted in red circles. The negatively charged residues D604, E609, D841, and E845 in the mutation region are shown as a stick model and colored in green, and lysines are colored in cyan. (C) In vitro PG-hydrolysis activity of the TsePC and TsePC4+. RBB-labeled E. coli PG was used as the substrate and the lysis percentage was detected by dye release. (D) B. subtilis PG-digestion analysis of TsePC and TsePC4+. Exponential phase B. subtilis cells (OD600~1.0) were used as substrate. The lysis percentage was calculated by detecting the changes of OD600 during 1 hr with the enzyme concentration at 100 nM. (E) Secretion analysis of TsePC and TsePC4+ in the ΔtseP mutant. RpoB serves as an equal loading and autolysis control. RpoB and 3V5-tagged TsePC proteins were detected using specific antibodies. (F) Statistical analysis of B. subtilis cells in the competition assays. Error bars of statistical analysis in (A), (C), (D), and (F) indicate the mean ± standard deviation of three biological replicates, and statistical significance was calculated using a two-tailed Student’s t-test. ns, not significant; *, p<0.05; **, p<0.01; ****, p<0.0001.
-
Figure 6—source data 1
Original files for Western blot analysis displayed in Figure 6E.
- https://cdn.elifesciences.org/articles/101125/elife-101125-fig6-data1-v1.zip
-
Figure 6—source data 2
PDF file containing original Western blots for Figure 6E.
- https://cdn.elifesciences.org/articles/101125/elife-101125-fig6-data2-v1.zip
Figure 6—figure supplement 1
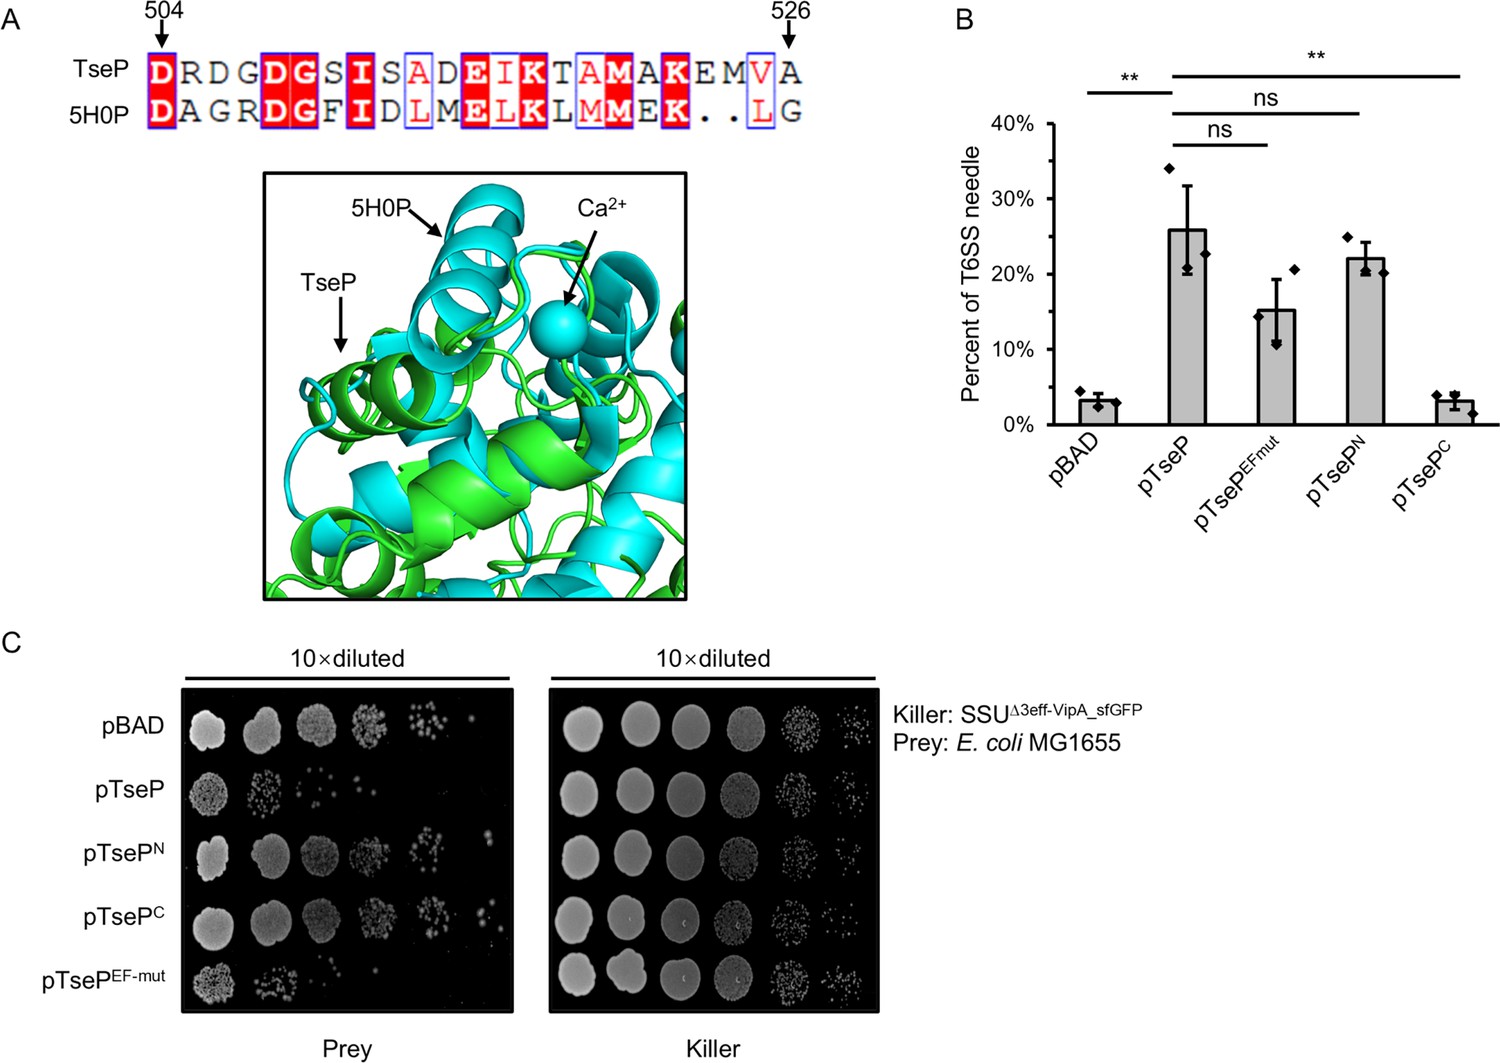
EF-hand domain has no effect on TseP activity.
(A) Protein sequence alignment (top) and structure alignment (bottom) of the EF-hand domain of TseP to the known EF-hand domain-containing protein CDEFhd2 (PDB ID: 5H0P) (Altschul et al., 1990). (B) Statistical analysis of type VI secretion system (T6SS) sheath assemblies in the Δ3eff mutant complemented with different TseP variants. Error bars indicate the mean ± standard deviation of three biological replicates, and statistical significance was calculated using a two-tailed Student’s t-test. ns, not significant; **, p<0.01. (C) Competition assays of the Δ3eff mutant complemented with different TseP variants against E. coli MG1655. Competition assays were repeated twice.
Figure 6—figure supplement 2
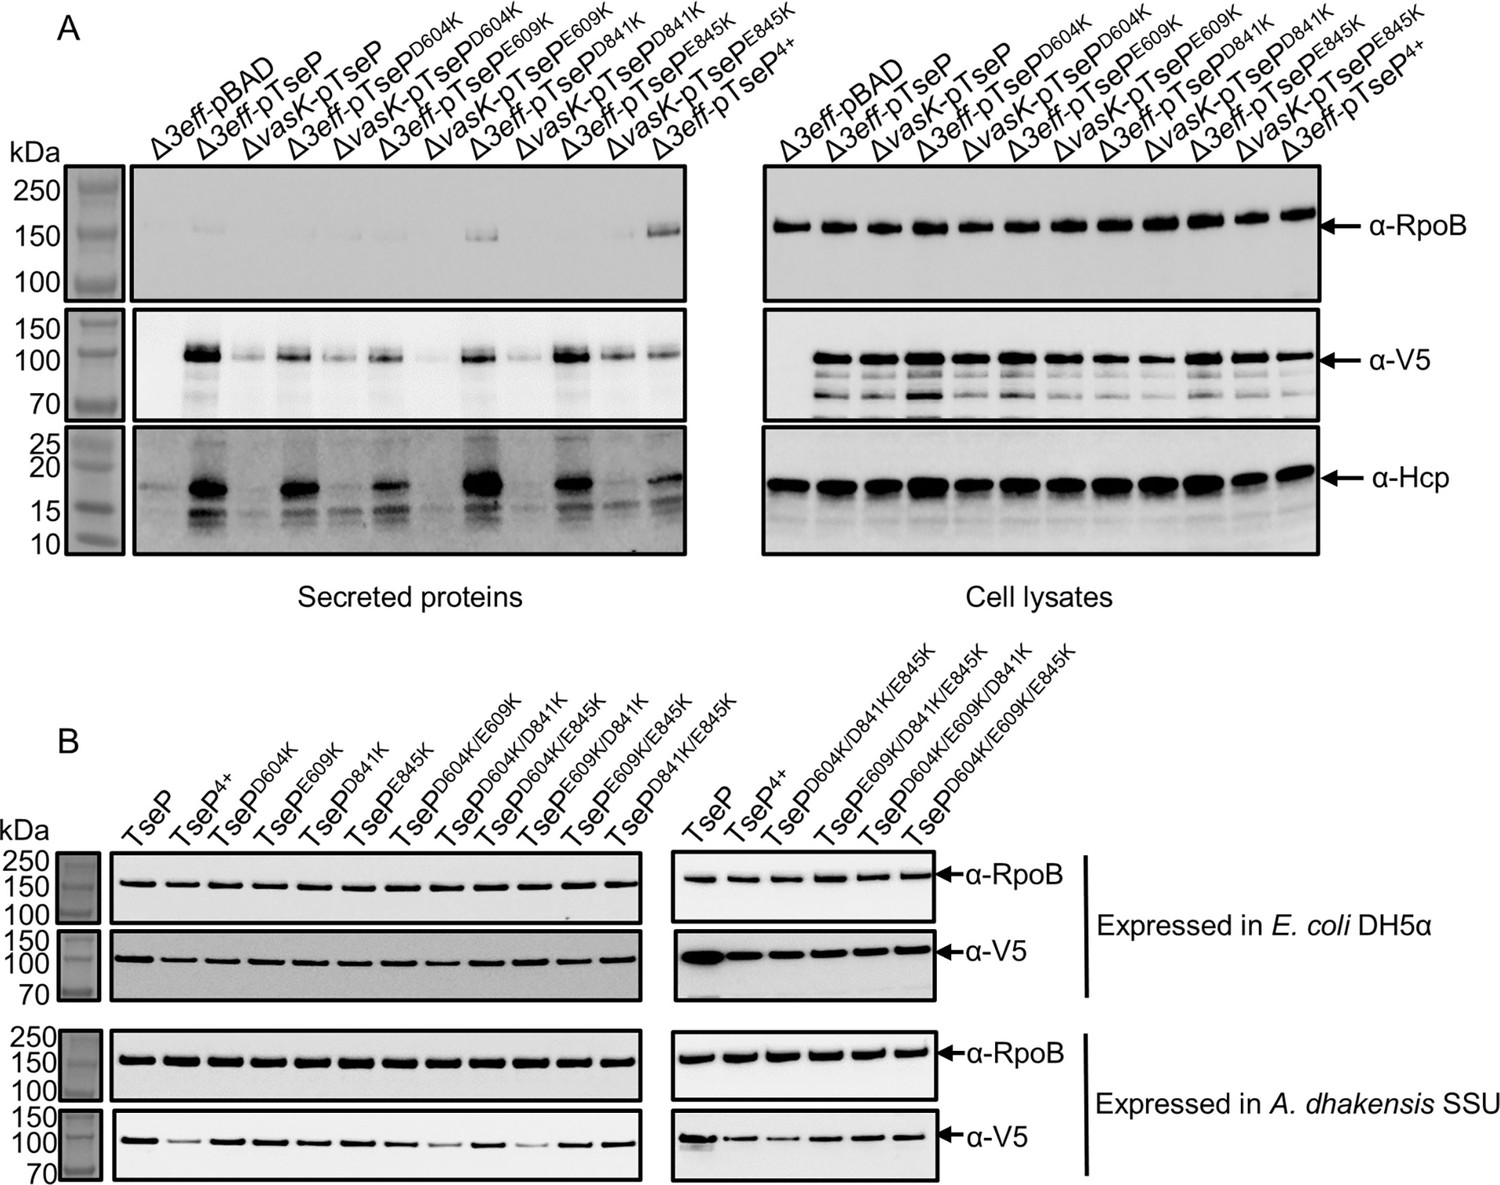
Expression and secretion of TseP variants.
(A) Secretion analysis of Hcp in the Δ3eff mutant complemented with different TseP variants. RpoB serves as an equal loading and autolysis control. Hcp, RpoB, and 3V5-tagged TseP proteins were detected using specific antibodies. (B) Protein expression of TseP and its variants in E. coli and SSU strains. RpoB serves as an equal loading control. RpoB and 3V5-tagged TseP proteins were detected using specific antibodies.
-
Figure 6—figure supplement 2—source data 1
Original files for Western blot analysis displayed in Figure 6—figure supplement 2.
- https://cdn.elifesciences.org/articles/101125/elife-101125-fig6-figsupp2-data1-v1.zip
-
Figure 6—figure supplement 2—source data 2
PDF file containing original Western blots for Figure 6—figure supplement 2.
- https://cdn.elifesciences.org/articles/101125/elife-101125-fig6-figsupp2-data2-v1.zip
Figure 6—figure supplement 3
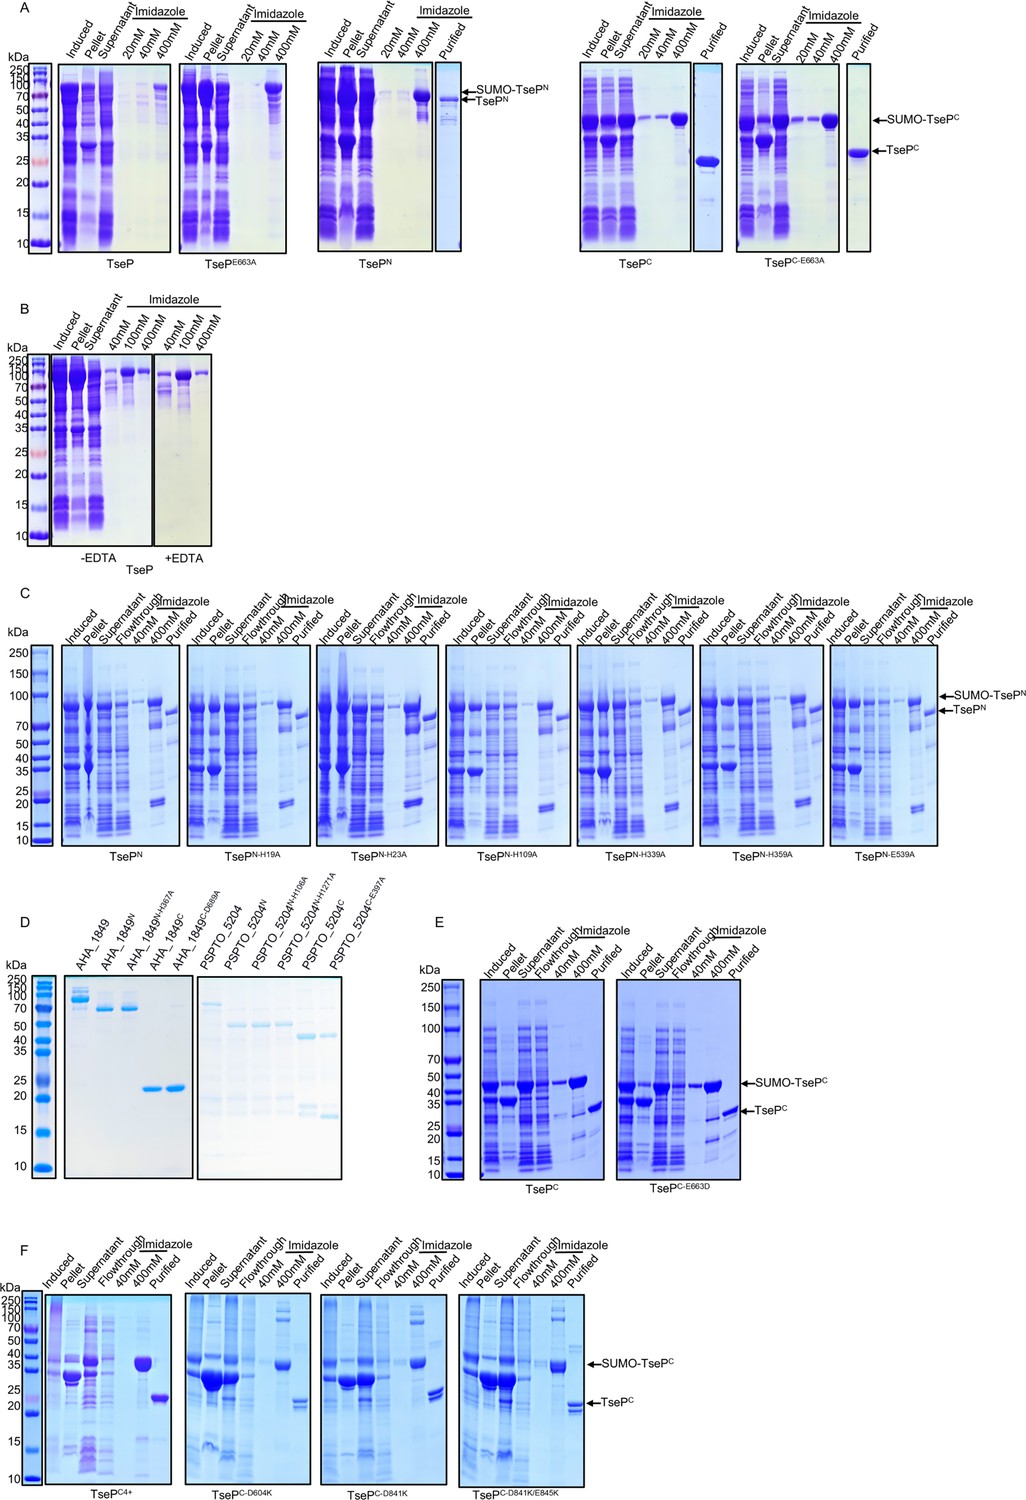
Purification of TseP variants and homologous proteins.
(A) Purification of His-TseP, His-TsePE663A, His-SUMO-TsePN, His-SUMO-TsePC, and His-SUMO-TsePC-E663A. The His-SUMO tag was removed by SUMO protease. Proteins were used for peptidoglycan (PG)-digestion analysis in Figure 2A, D, and E. (B) Purification of TseP proteins with or without EDTA. Proteins were used for PG-digestion analysis in Figure 2E. (C) Purification of TsePN variants with a His-SUMO tag. The His-SUMO tag was removed by SUMO protease. Proteins were used for PG-digestion analysis in Figure 2D. (D) Purification of AHA_1849, PSPTO_5204, and their mutants. Proteins were used for PG-digestion analysis in Figure 4B and C. (E) Purification of TsePC and TsePC-E663D with an His-SUMO tag. The His-SUMO tag was removed by SUMO protease. Proteins were used for PG-lysis in Figure 5E. (F) Purification of TsePC variants with an His-SUMO tag. The His-SUMO tag was removed by SUMO protease. Proteins were used for PG-lysis in Figure 4C and Figure 6C. All these proteins were purified with Ni-NTA affinity chromatography column, eluted using imidazole, and analyzed via SDS-PAGE.
-
Figure 6—figure supplement 3—source data 1
Original files for SDS-PAGE analysis displayed in Figure 6—figure supplement 3.
- https://cdn.elifesciences.org/articles/101125/elife-101125-fig6-figsupp3-data1-v1.zip
-
Figure 6—figure supplement 3—source data 2
PDF file containing original SDS-PAGE for Figure 6—figure supplement 3.
- https://cdn.elifesciences.org/articles/101125/elife-101125-fig6-figsupp3-data2-v1.zip
Figure 7
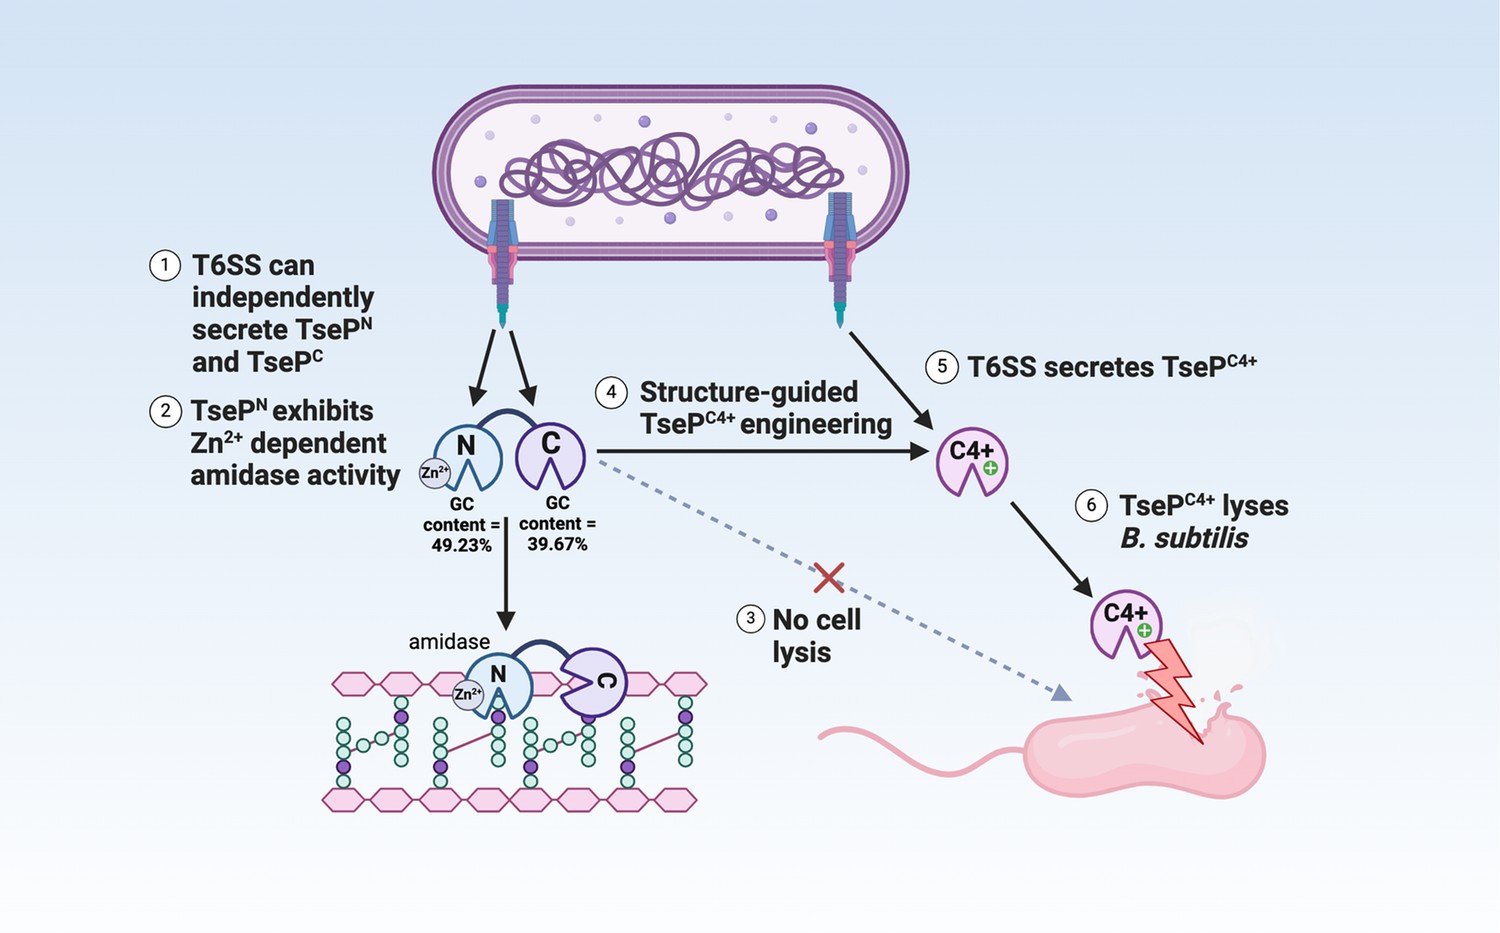
Model of TseP dual functions and engineering.
This schematic illustrates the dual amidase-lysozyme activities of TseP and demonstrates an effective engineering strategy to enhance type VI secretion system (T6SS) and its effector capabilities. The T6SS can independently secrete both the N- and C-terminal domains, with multiple evidence suggesting an evolutionary fusion event. These domains interact directly with the upstream-encoded carrier protein VgrG2 for secretion. TsePN, the N-terminal domain, functions as a Zn2+-dependent amidase, while the C-terminal domain, TsePC, exhibits lysozyme activities. However, in its native form, TsePC does not lyse Gram-positive B. subtilis cells. Through structural-guided design, TsePC was engineered to create TsePC4+ by altering its surface charge. This modification enables TsePC4+ to lyse B. subtilis cells without affecting its T6SS-dependent secretion. Consequently, the T6SS-equipped cell acquires the ability to lyse B. subtilis in a contact-independent manner. Given the diversity of TseP-like effectors and T6SS species, this approach holds significant potential for modulating interspecies competition and combating antimicrobial resistance.
Tables
Table 1
Data collection and refinement statistics of TsePC crystallization.
| TsePC- 8XCL | |
|---|---|
| Data collection | |
| Space group | C 2 2 21 |
| a, b, c (Å) | 44.48 138.80 95.83 |
| α, β, γ (°) | 90.00 90.00 90.00 |
| Wavelength (Å) | 0.97852 |
| Resolution (Å) | 47.91–2.27 (2.40–2.27) |
| CC1/2 | 0.984 (0.840) |
| Unique reflections | 25776 (4304) |
| Rmeas (%)* | 23.6 (83.6) |
| Mean I/σ (I)* | 6.1 (2.6) |
| Completeness (%)* | 95.9 (99.4) |
| Multiplicity* | 12.9 (12.0) |
| Refinement | |
| Resolution (Å) | 47.91–2.27 |
| Rwork/Rfree† | 0.189/0.227 |
| No. atoms | |
| Protein | 1910 |
| Water | 123 |
| Average B factors (Å2) | |
| Protein | 31.72 |
| Water | 37.40 |
| R.m.s. deviations | |
| Bond lengths (Å) | 0.007 |
| Bond angles (°) | 0.871 |
| Ramachandran plot | |
| Favored (%) | 97.50 |
| Allowed (%) | 2.50 |
| Outliers (%) | 0.00 |
-
where is the mean intensity of a set of equivalent reflections.
-
, where Fobs and Fcalc are observed and calculated structure factors, respectively.
-
*
The values in parentheses are for the outermost shell.
-
†
Rfree is the Rwork based on 5% of the data excluded from the refinement.
Additional files
-
Supplementary file 1
Strains and plasmids used in this study, and the sequence identity of the TseP and homologs.
(A) Strains and plasmids used in this study. (B) The sequence identity of the N-terminal of TseP and homologs. Sequence identity was calculated using ClustalW web server. Colors are assigned from blue to red, indicating low to high sequence similarity, respectively. (C) The sequence identity of the C-terminal of TseP and homologs. Sequence identity was calculated using ClustalW web server. Colors are assigned from blue to red, indicating low to high sequence similarity, respectively.
- https://cdn.elifesciences.org/articles/101125/elife-101125-supp1-v1.docx
-
Supplementary file 2
Homolog proteins with similar structures to TsePN in the Foldseek Search AFDB50 database.
- https://cdn.elifesciences.org/articles/101125/elife-101125-supp2-v1.xlsx
-
Supplementary file 3
Homolog proteins with similar structures to TsePC in the Foldseek Search AFDB50 database.
- https://cdn.elifesciences.org/articles/101125/elife-101125-supp3-v1.xlsx
-
MDAR checklist
- https://cdn.elifesciences.org/articles/101125/elife-101125-mdarchecklist1-v1.pdf
Download links
A two-part list of links to download the article, or parts of the article, in various formats.
Downloads (link to download the article as PDF)
Open citations (links to open the citations from this article in various online reference manager services)
Cite this article (links to download the citations from this article in formats compatible with various reference manager tools)
Amidase and lysozyme dual functions in TseP reveal a new family of chimeric effectors in the type VI secretion system
eLife 13:RP101125.
https://doi.org/10.7554/eLife.101125.3


