Targeted anticancer pre-vinylsulfone covalent inhibitors of carbonic anhydrase IX
- Department of Biothermodynamics and Drug Design, Institute of Biotechnology, Life Sciences Center, Vilnius University, Lithuania
- Latvian Biomedical Research and Study Centre, Latvia
- Department of Biological DNA Modification, Institute of Biotechnology, Life Sciences Center, Vilnius University, Lithuania
- Department of Protein - DNA Interactions, Institute of Biotechnology, Life Sciences Center, Vilnius University, Lithuania
- Sector of Biocatalysis, Institute of Biotechnology, Life Sciences Center, Vilnius University, Lithuania
- Proteomics Center, Institute of Biochemistry, Life Sciences Center, Vilnius University, Lithuania
- Functional Pharmacology and Neuroscience, Department of Surgical Sciences, Uppsala University, Sweden
- Latvian Institute of Organic Synthesis, Latvia
- Sector of Crystallography and Chemical Informatics, Institute of Biotechnology, Life Sciences Center, Vilnius University, Lithuania
- Department of Chemical Engineering and Biotechnology, University of Applied Sciences Darmstadt, Germany
Figures
Figure 1
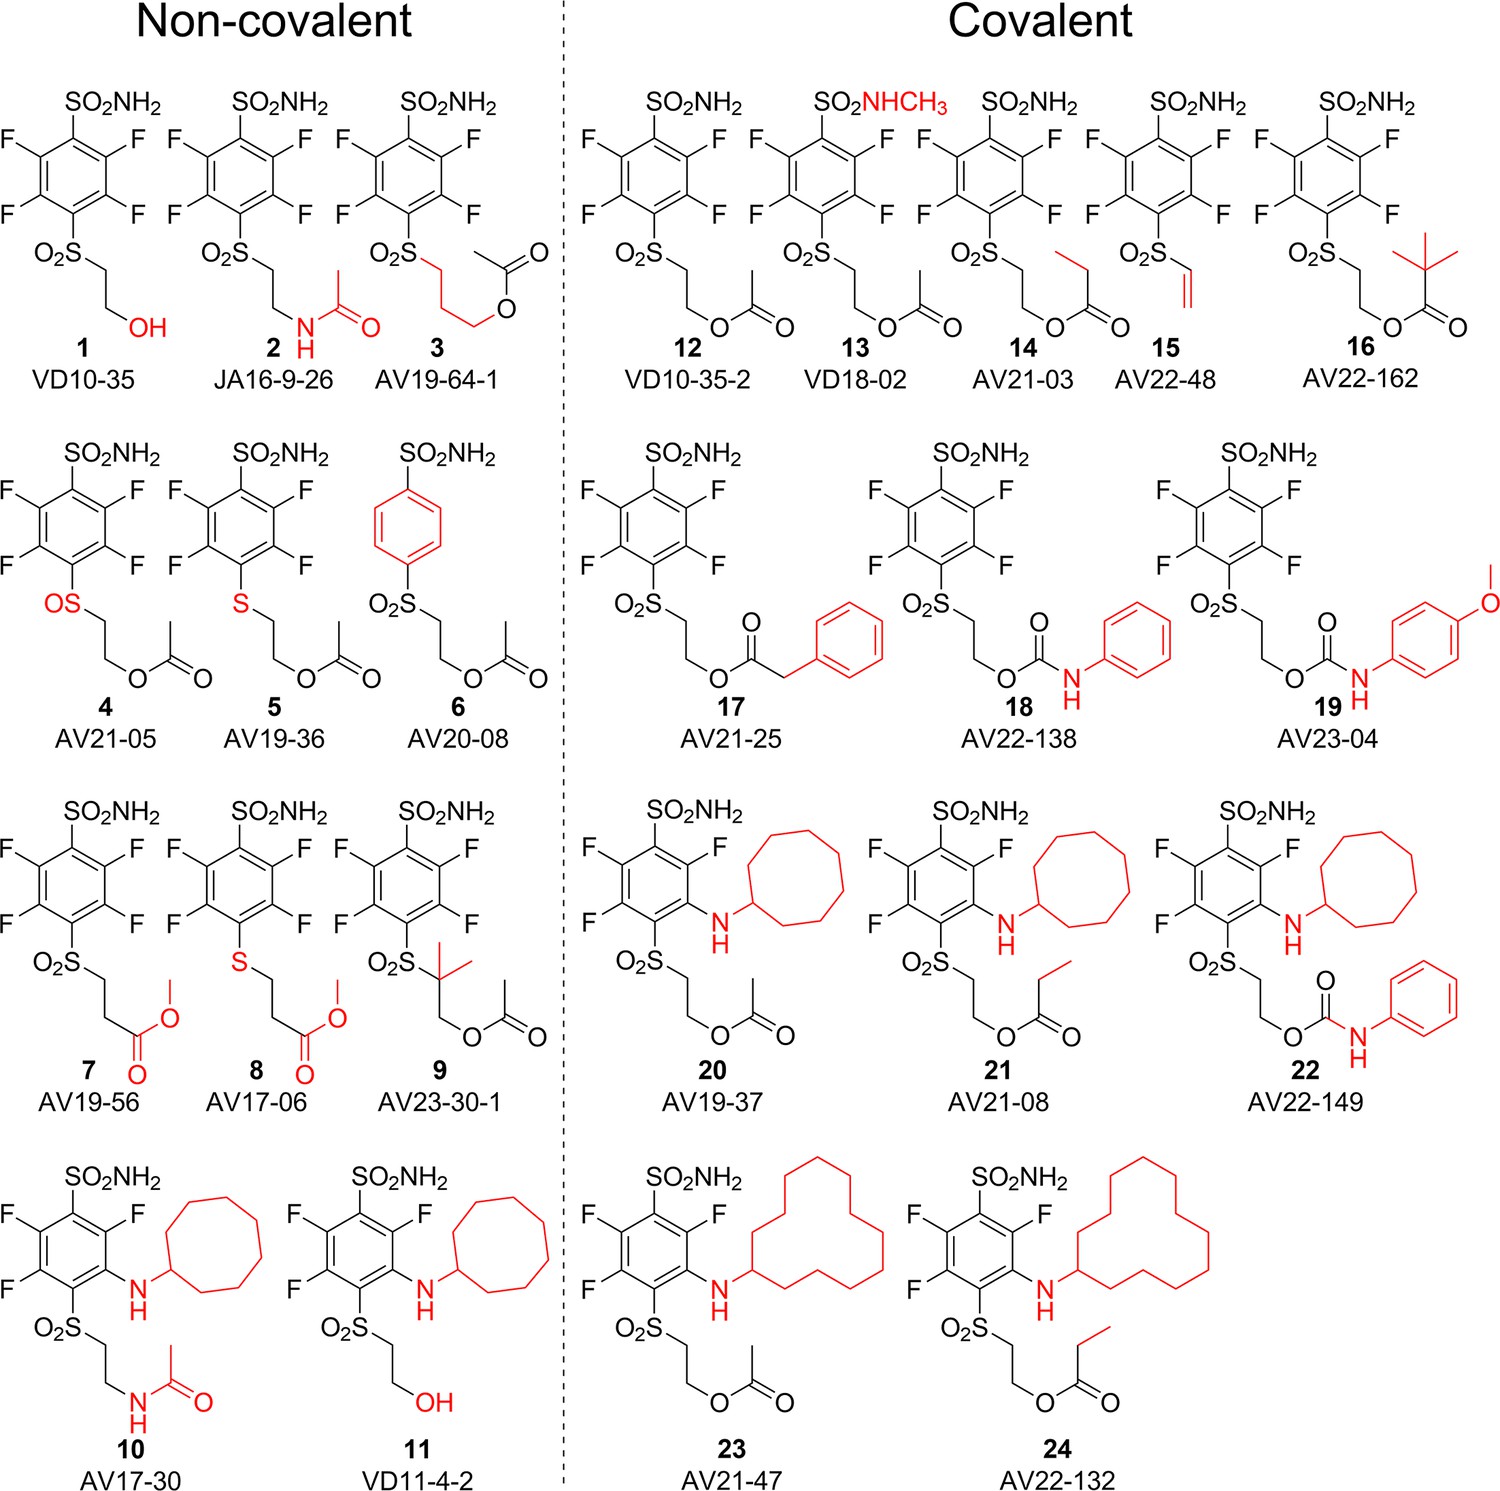
Chemical structures of compounds used in this study and designed to investigate the covalent binding capability to CA proteins.
Compounds on the left of the vertical dashed line do not form the covalent bond, while the ones on the right form the covalent bond with the protein molecule. Moieties shown in red are important for structural comparison to visualize the chemical groups that are responsible for covalent interaction, high affinity, or high selectivity for CAIX.
Figure 2
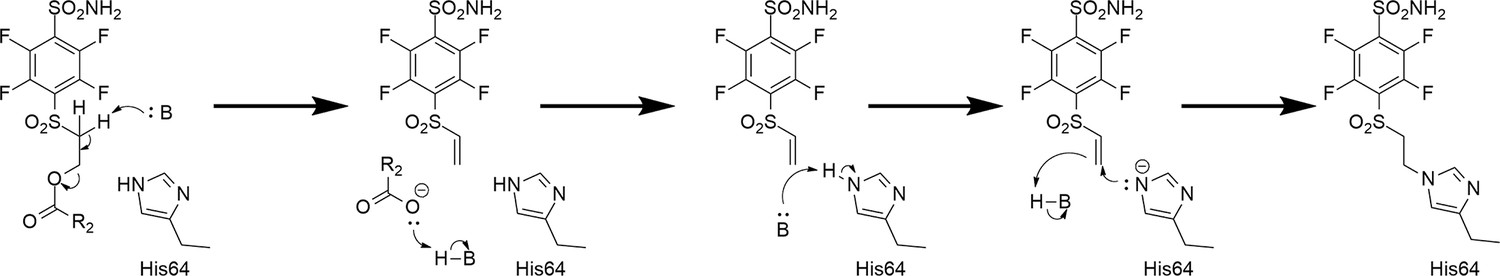
Proposed rearrangement mechanism (beta-elimination) of compounds bearing the -SO2CH2CH2OCOR fragment to vinyl-sulfone and the formation of a covalent bond with the histidine (His64) amino acid side chain of the CA protein.
Figure 3
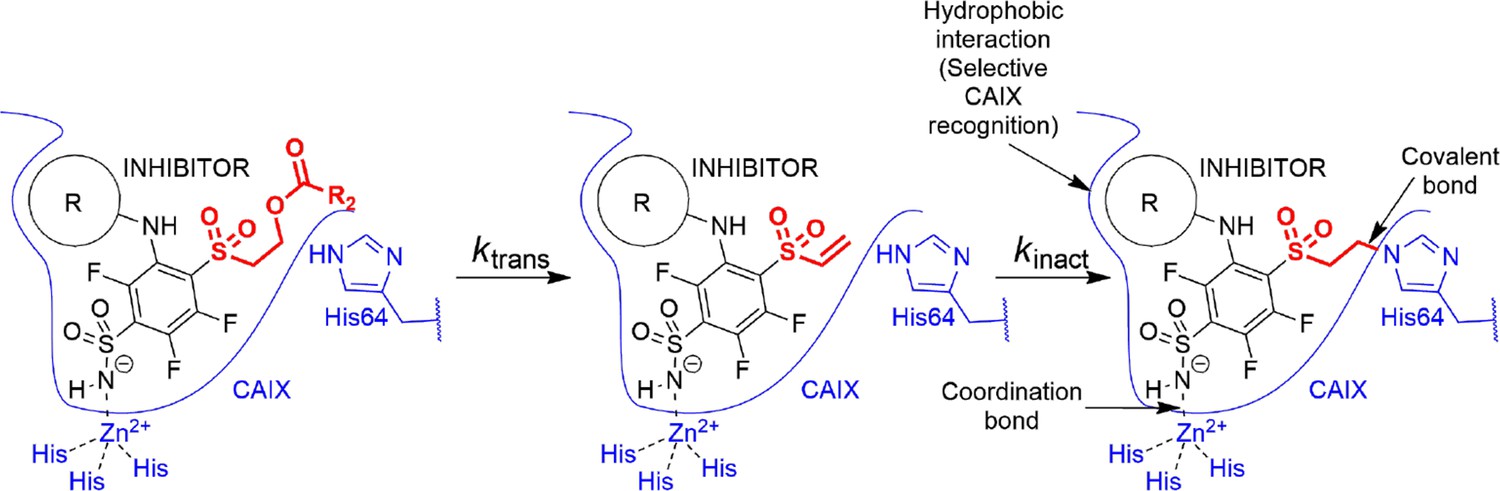
Transformation of pre-drug to the active vinyl sulfone and a three-way recognition of CA isozymes.
First, the negatively charged sulfonamide forms a coordination bond with the Zn(II). Second, the hydrophobic cyclooctyl ring fits into the hydrophobic pocket of the CAIX isozyme and provides substantial selectivity over other CA isozymes. Third, a covalent bond forms with the histidine providing irreversible inhibition of CAIX enzymatic activity.
Figure 4
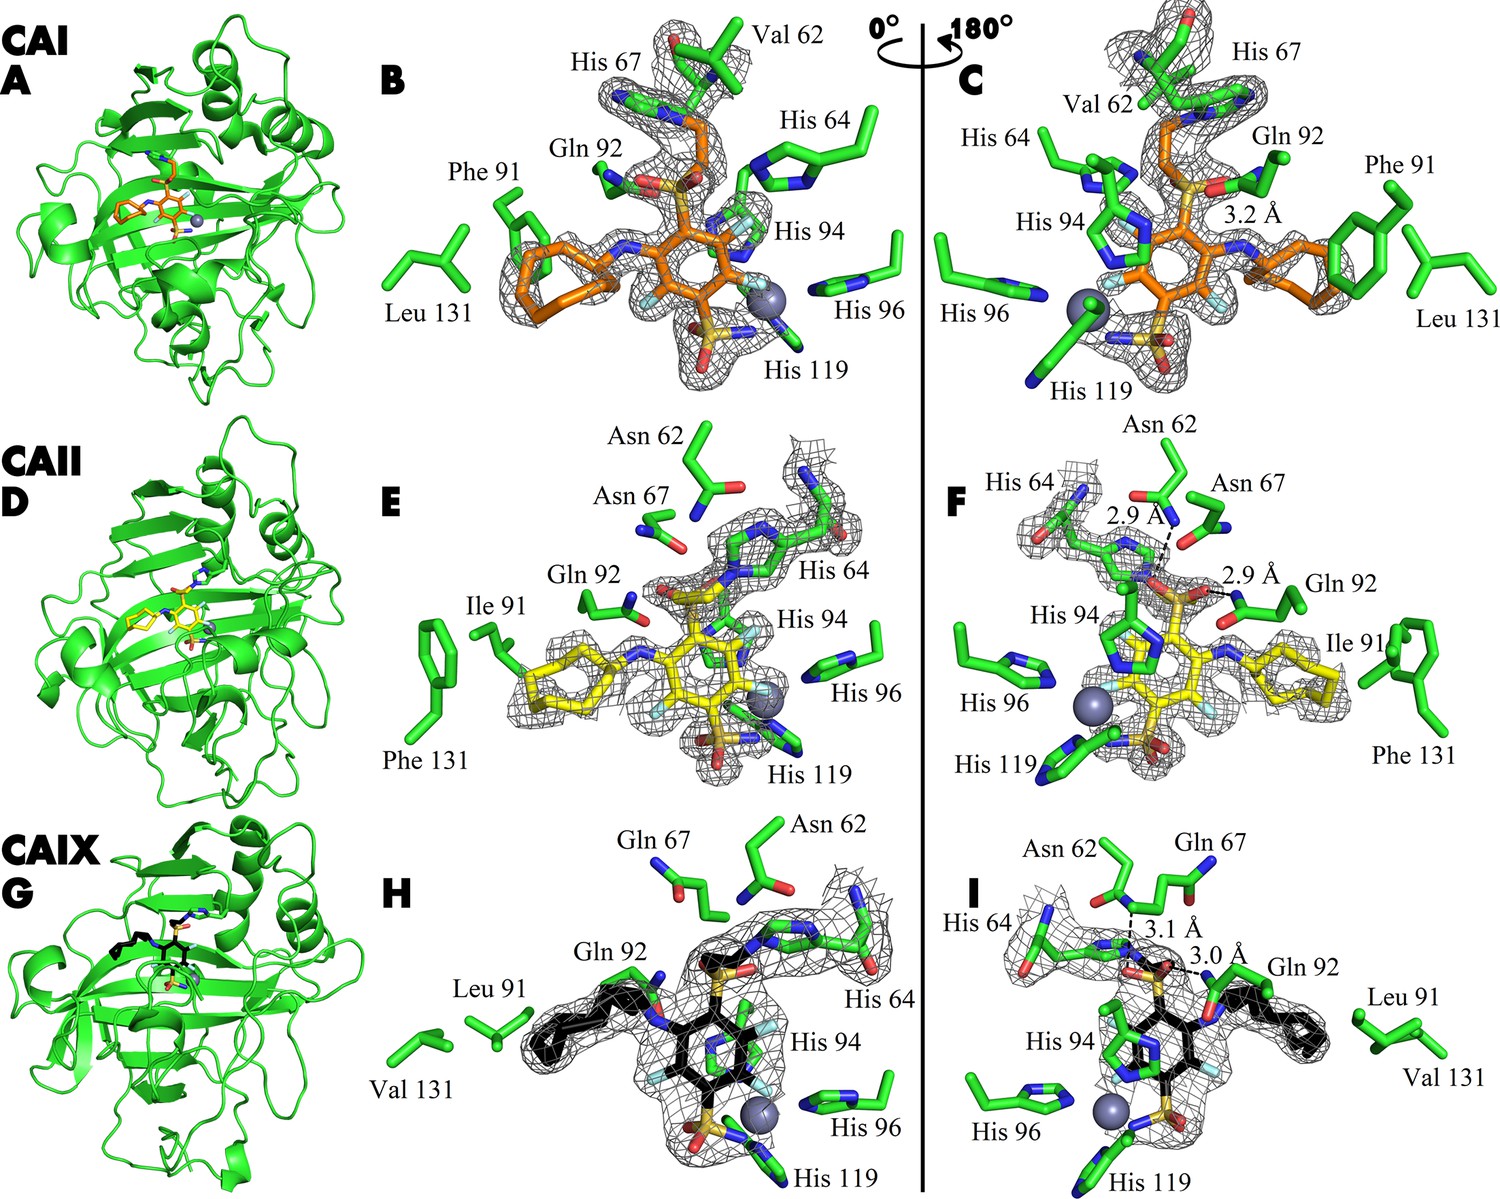
X-ray crystal structures of CAI (A–C), CAII (D–F), and CAIX (G–I) covalently bound with inhibitors 21, 20, and 23.
X-ray crystal structures of CAI (A–C), CAII (D–F), and CAIX (G–I) covalently bound with inhibitors 21, 20, and 23, respectively. The left panels show cartoon models of the entire protein molecule with the covalently bound compound and the His64 residue shown as a stick model, while the middle and right panels show close-up views of the inhibitor, shown as sticks, displayed with a 180° rotation between the images. The 2Fo-Fc map is shown only for the ligand and the histidine residue with which it forms a covalent bond, contoured at 1σ.
Figure 5 with 24 supplements
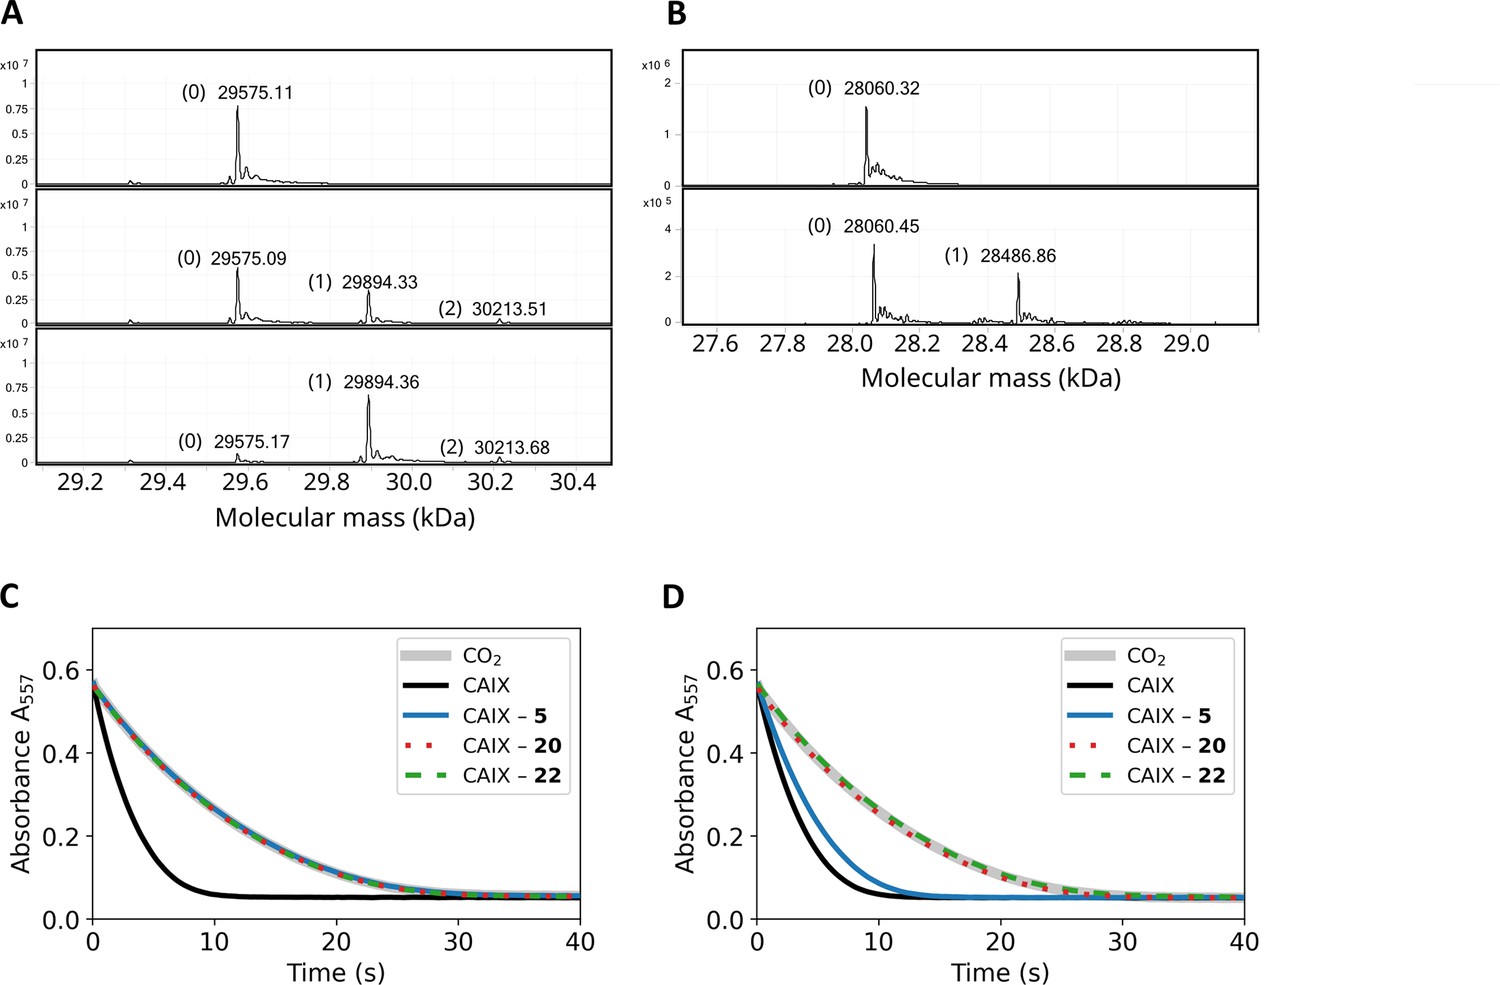
Covalent interaction shown by HRMS, and enzymatic activity recovery assay.
(A). MS spectra of CAXIII in the absence of compound (top panel), the presence of 1:1 molar ratio of compound 12 after 3-min incubation (middle panel) and 2 hr incubation (bottom panel). (B). MS spectra of CAIX in the absence of compound (top panel) and after the incubation of 1:1 molar ratio of compound 22 (carbamate) for 4 hours. (C). Enzymatic activity of CAIX before dialysis, while D) – after dialysis (32 hr, 4-times buffer change, black solid line – fully active CAIX, grey solid line – spontaneous CO2 hydration reaction (coincides with fully inhibited CAIX), blue solid line – CAIX with non-covalent 5, dotted red line – CAIX with covalent 20, and dashed green line – CAIX with covalent carbamate 22. The recombinant CAIX recovered almost full activity after dialyzing out the non-covalent compound, while the activity remained fully inhibited with the covalent compounds.
Figure 5—figure supplement 1
CA I mass spectra (A); CA I mass spectra after incubation with 12 (B); CA I mass spectra after incubation with 20 (C).
Figure 5—figure supplement 2
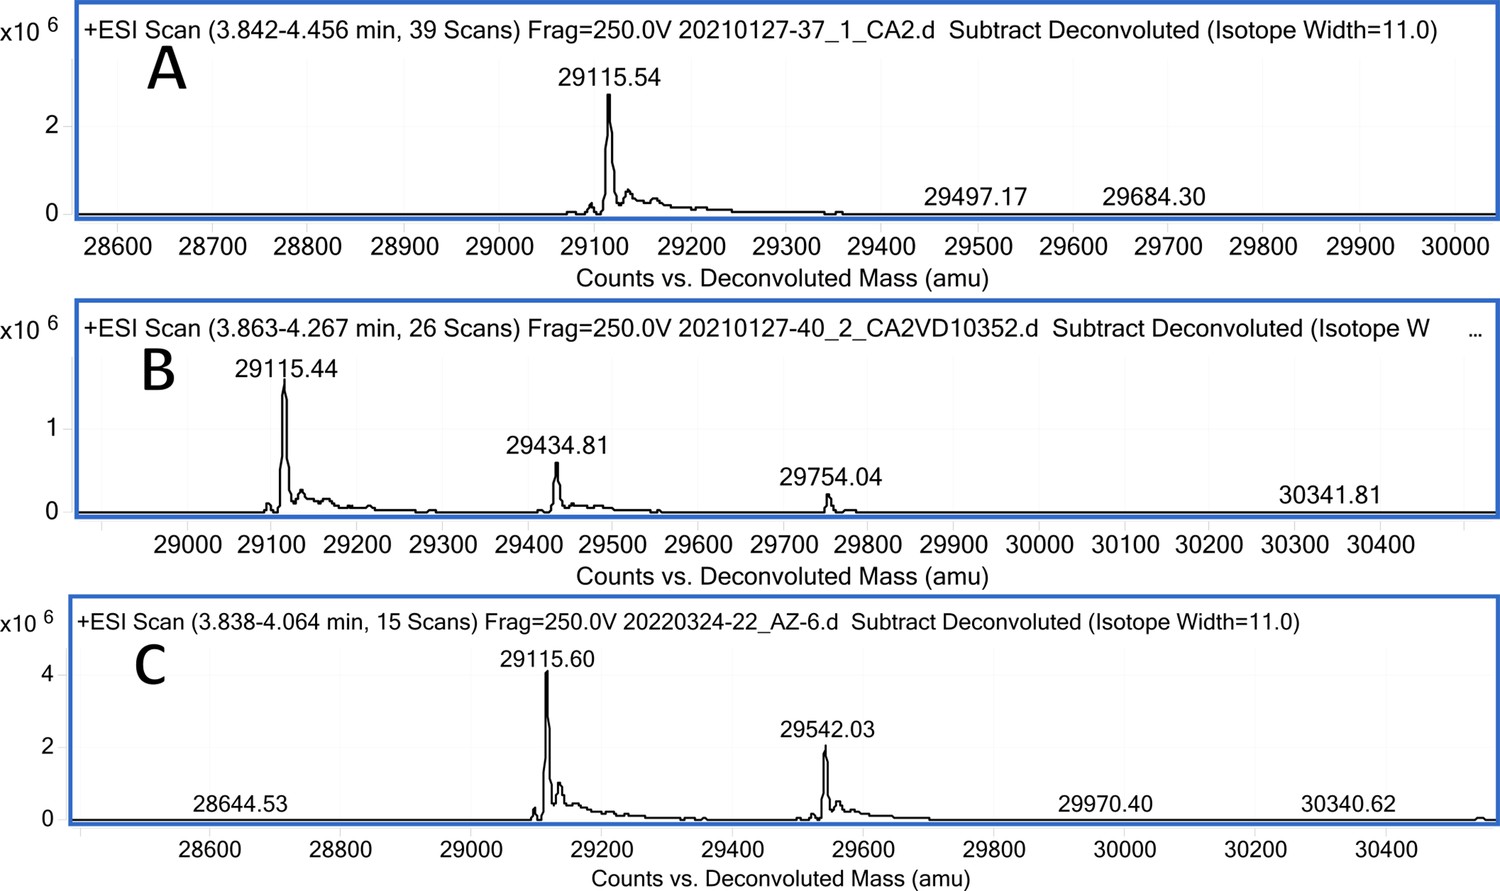
CA II mass spectra (A); CA II mass spectra after incubation with 12 (B); CA II mass spectra after incubation with 20 (C).
Figure 5—figure supplement 3
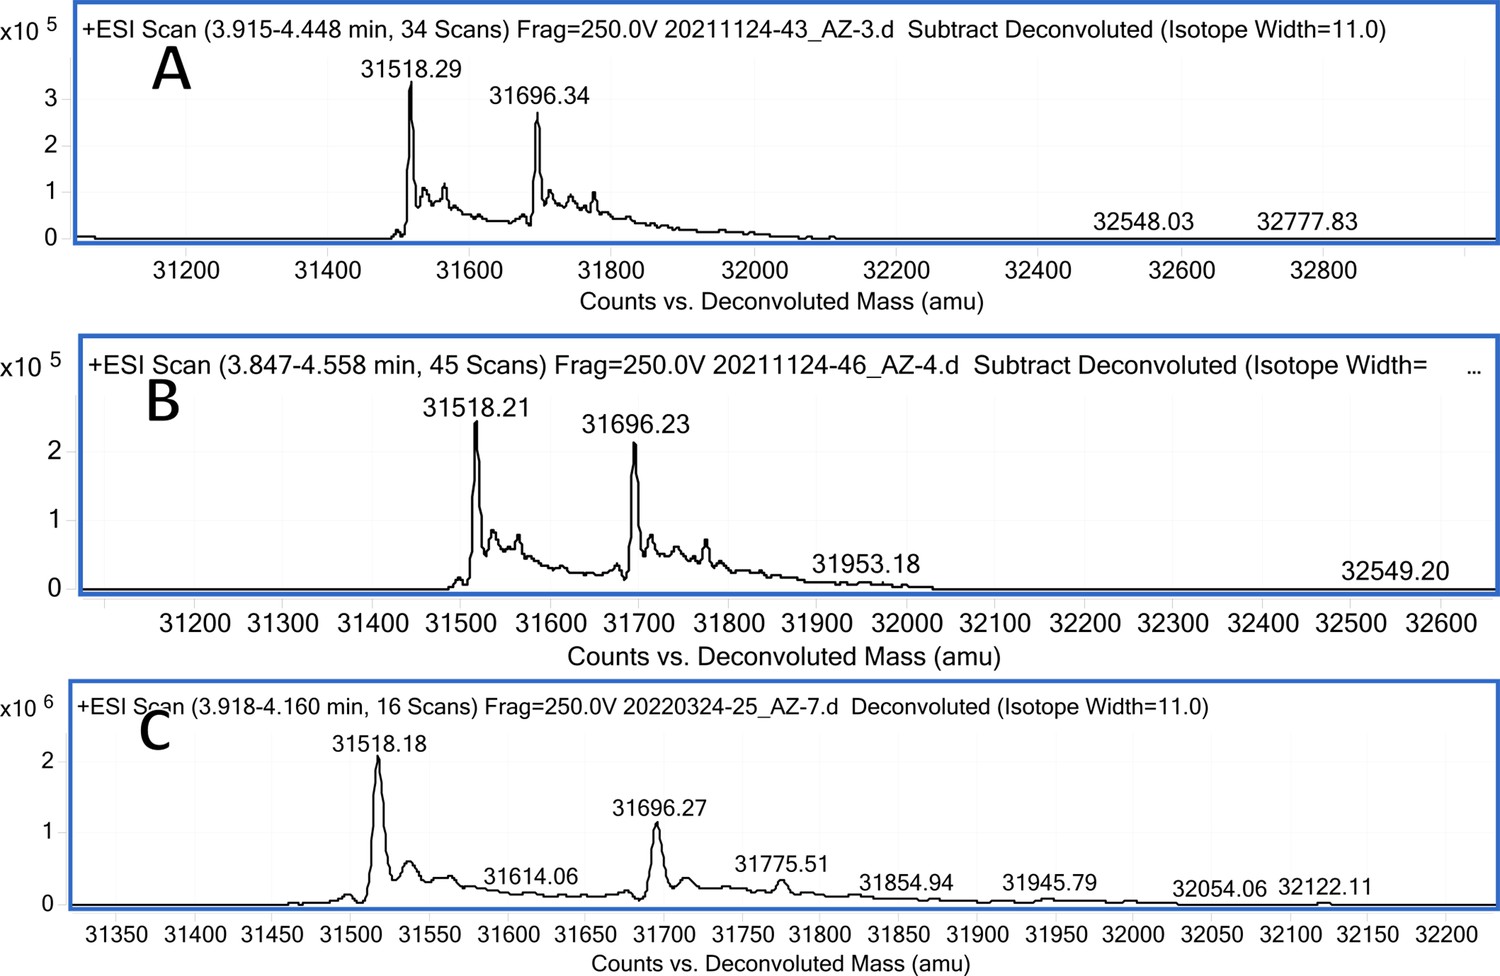
CA III mass spectra (A); CA III mass spectra after incubation with 12 (B); CA III mass spectra after incubation with 20 (C).
Figure 5—figure supplement 4
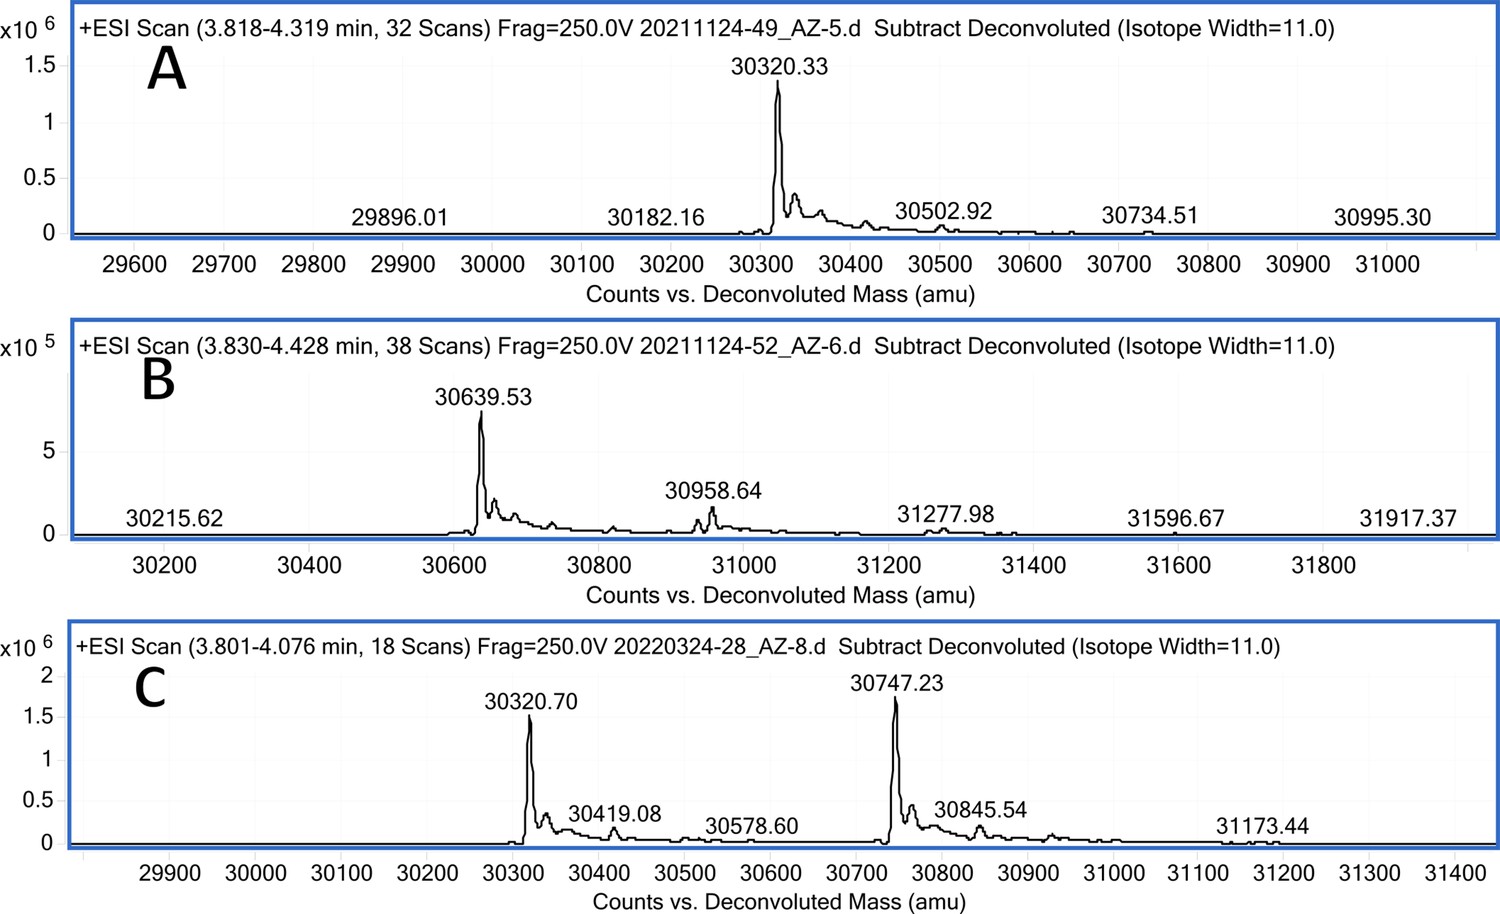
CA IV mass spectra (A); CA IV mass spectra after incubation with 12 (B); CA IV mass spectra after incubation with 20 (C).
Figure 5—figure supplement 5
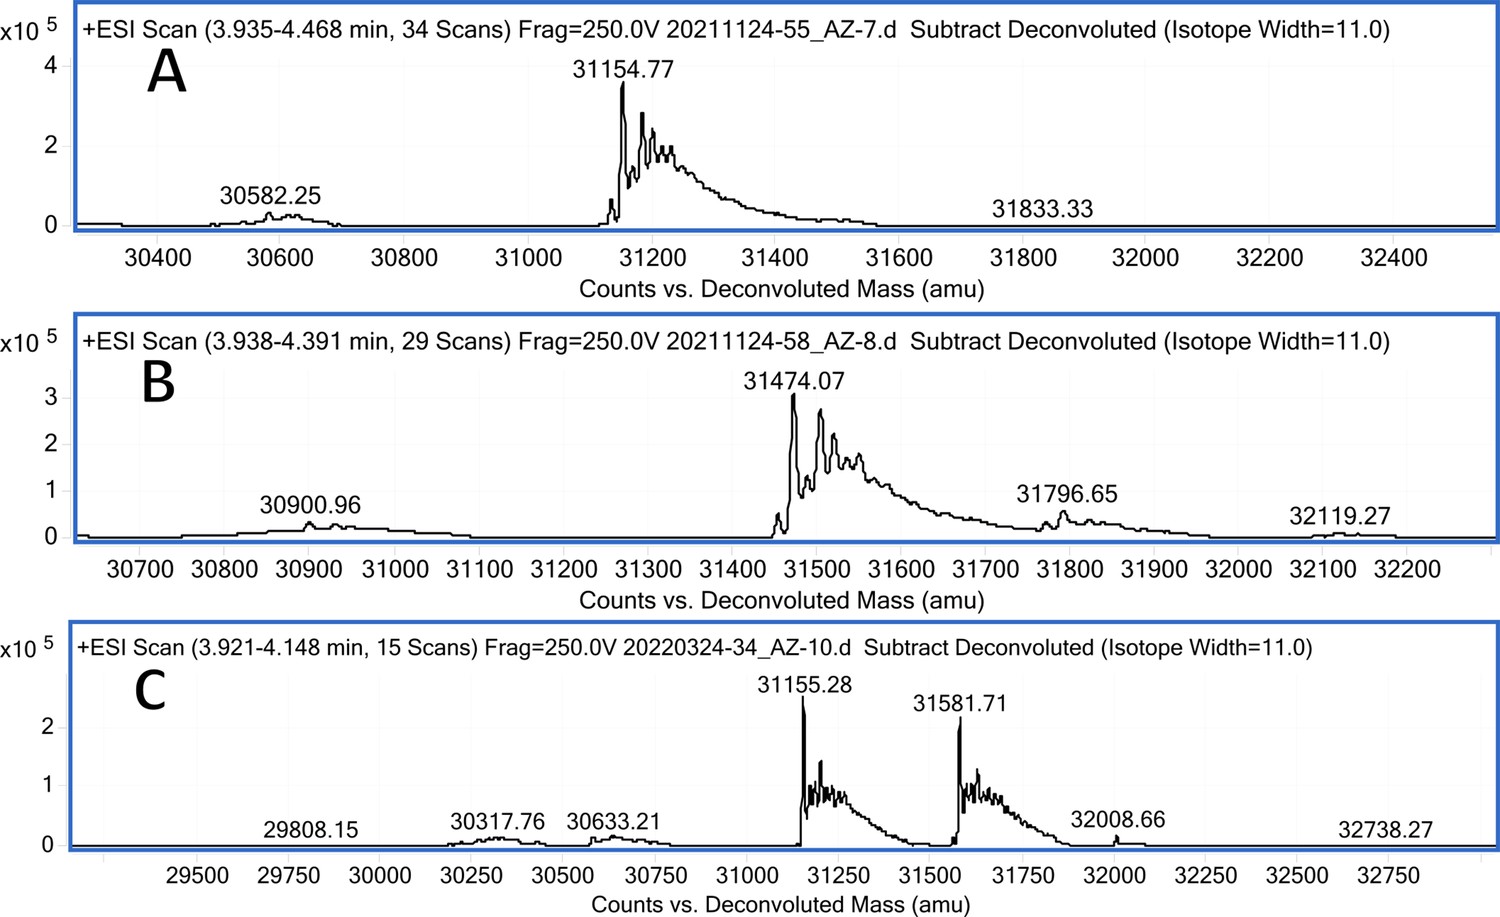
CA VA mass spectra (A); CA VA mass spectra after incubation with 12 (B); CA VA mass spectra after incubation with 20 (C).
Figure 5—figure supplement 6
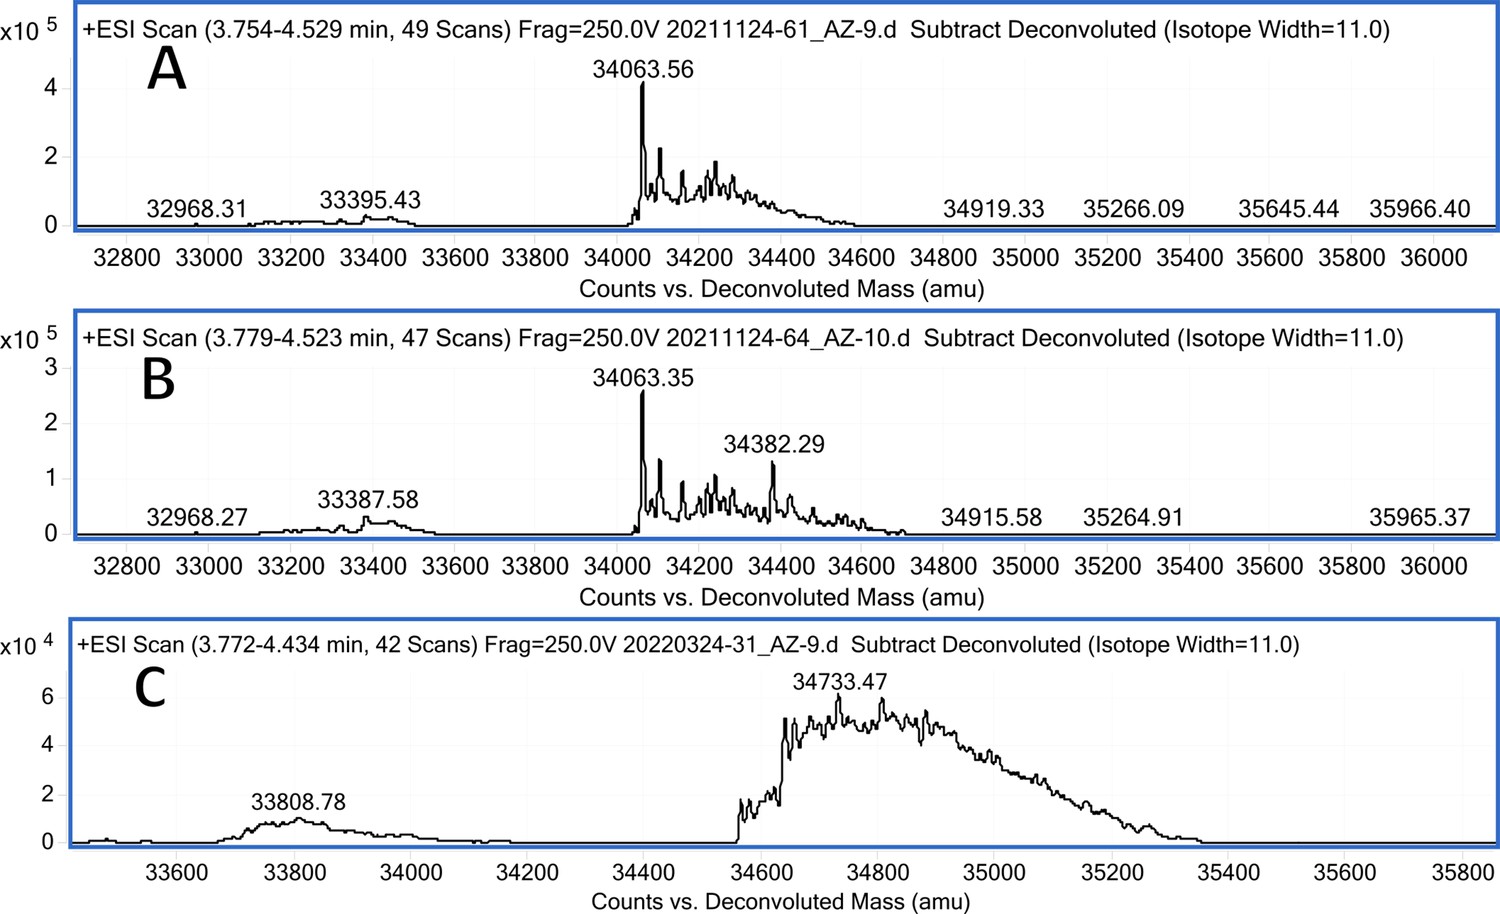
CA VB mass spectra (A); CA VB mass spectra after incubation with 12 (B); CA VB mass spectra after incubation with 20 (C).
Figure 5—figure supplement 7

CA VI mass spectra (A); CA VI mass spectra after incubation with 12 (B).
Figure 5—figure supplement 8
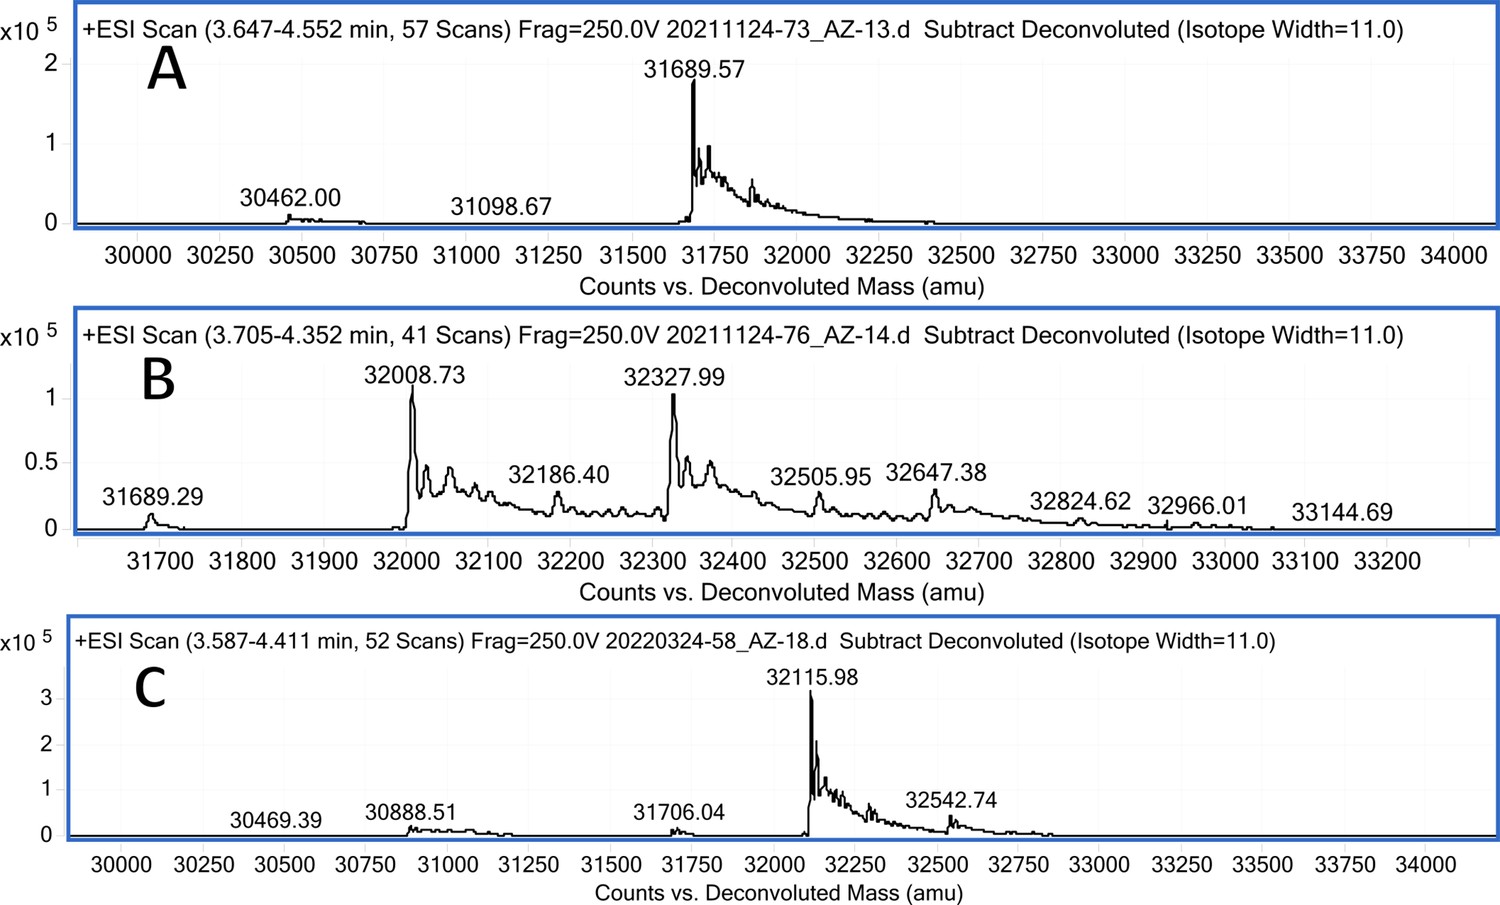
CA VII mass spectra (A); CA VII mass spectra after incubation with 12 (B); CA VII mass spectra after incubation with 20 (C).
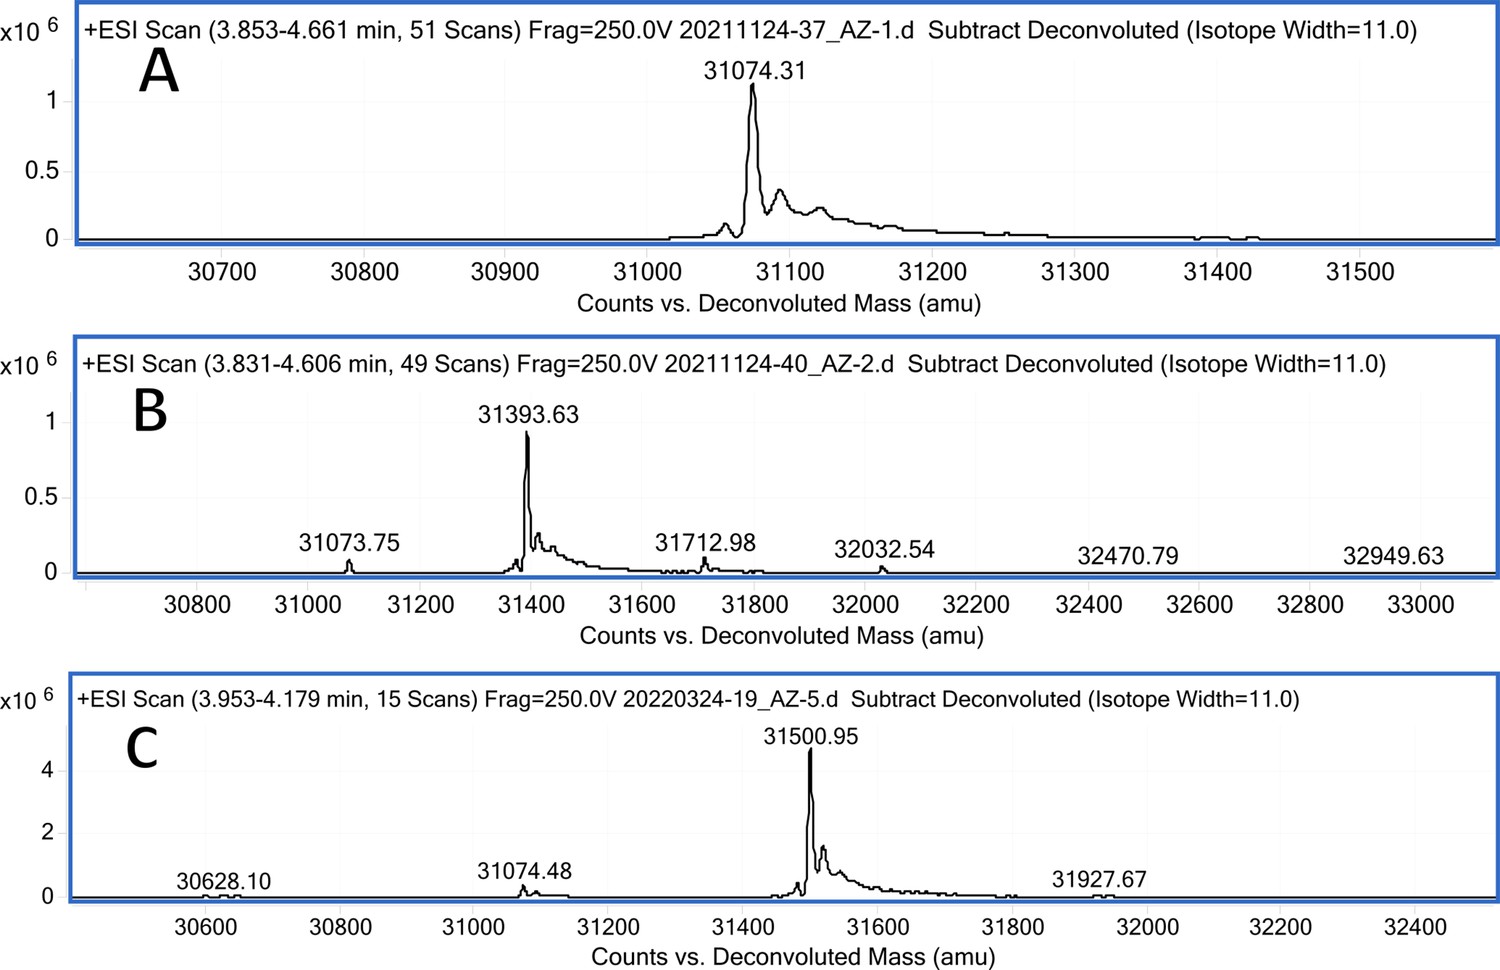
Figure 5—figure supplement 9
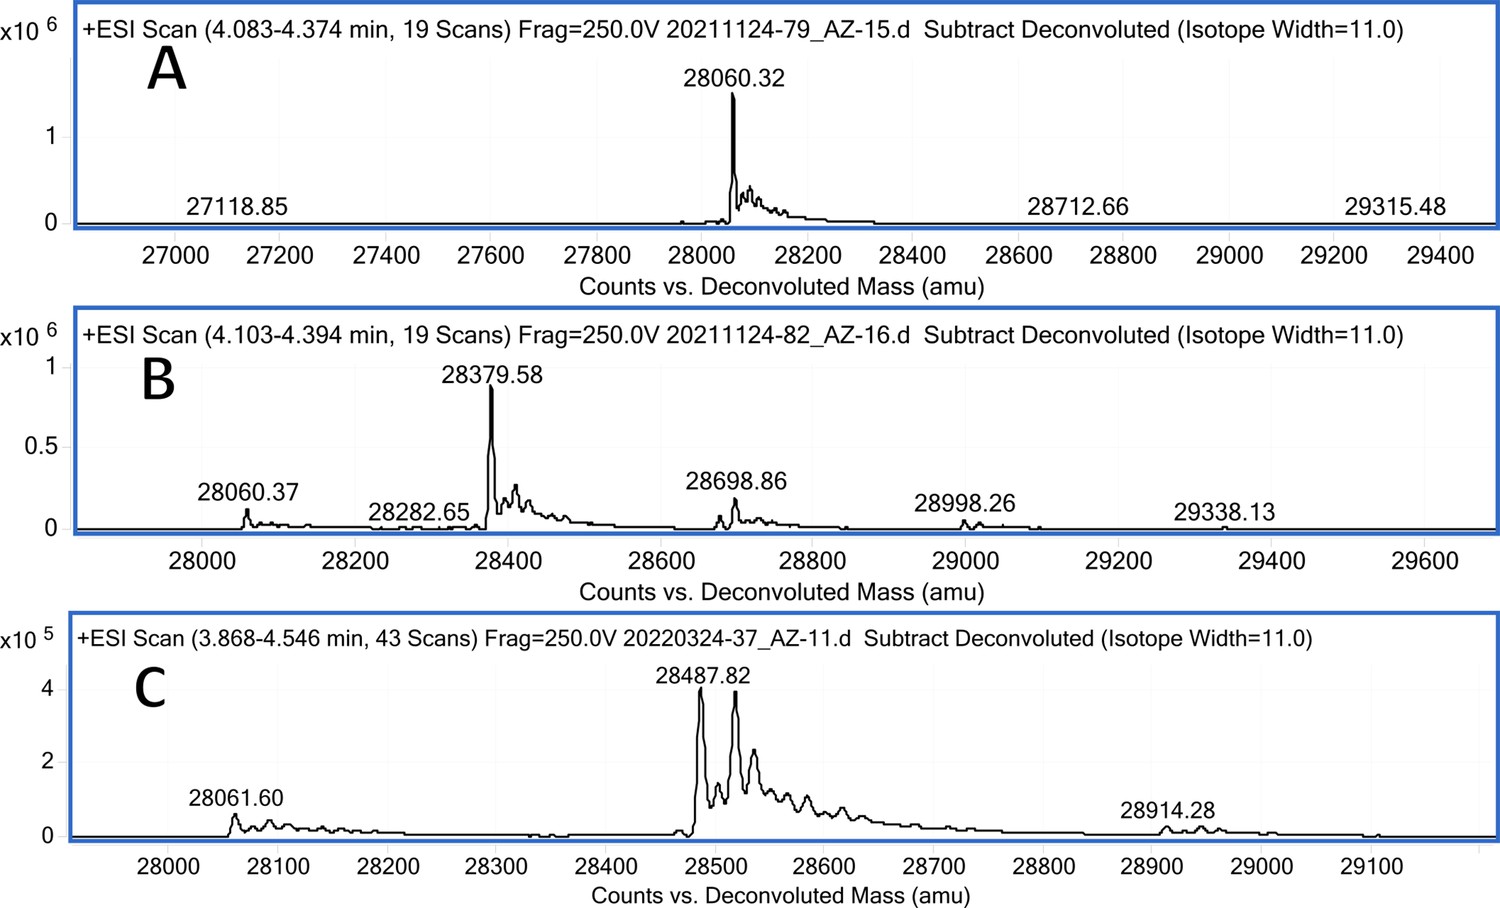
CA IX mass spectra (A); CA IX mass spectra after incubation with 12 (B); CA IX mass spectra after incubation with 20 (C).
Figure 5—figure supplement 10
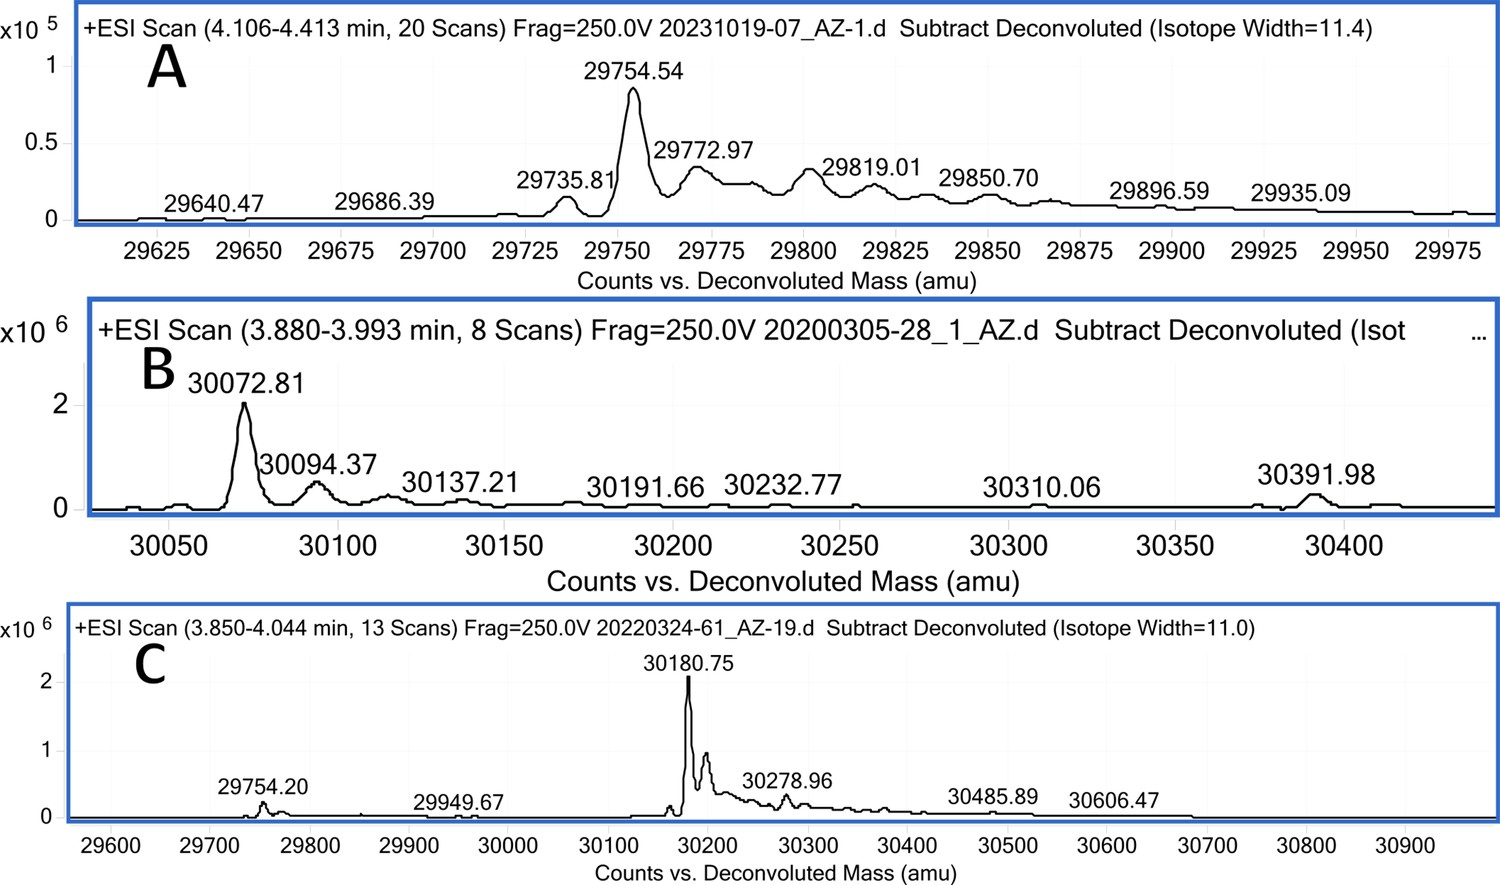
CA XII mass spectra (A); CA XII mass spectra after incubation with 12 (B); CA XII mass spectra after incubation with 20 (C).
Figure 5—figure supplement 11
CA XIII mass spectra (A); CA XIII mass spectra after incubation with 12 (B); CA XIII mass spectra after incubation with 20 (C).
Figure 5—figure supplement 12
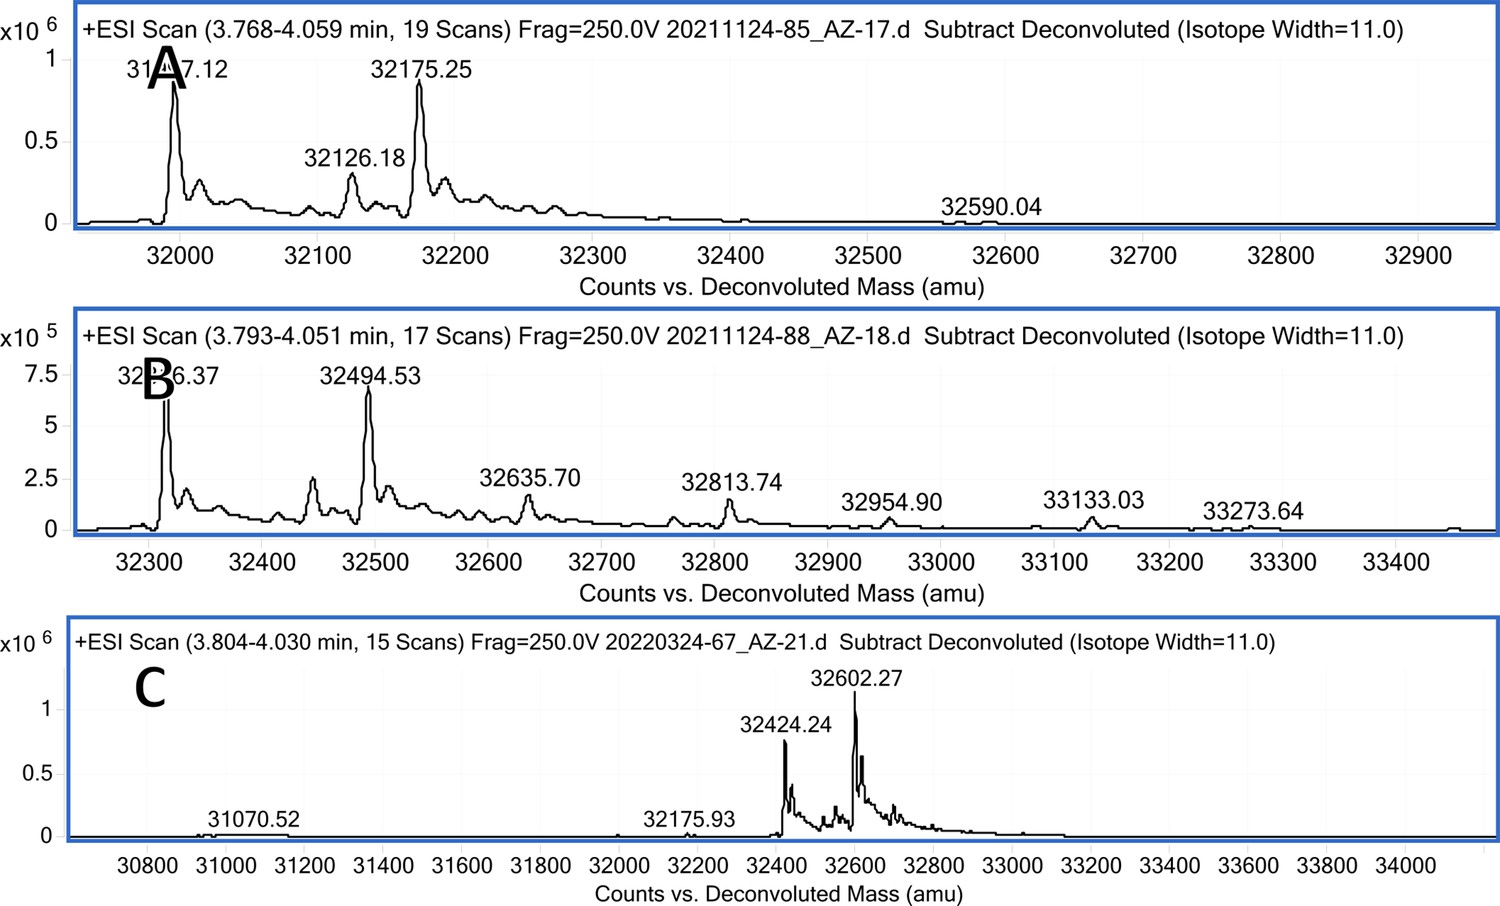
CA XIV mass spectra (A); CA XIV mass spectra after incubation with 12 (B); CA XII mass spectra after incubation with 20 (C).
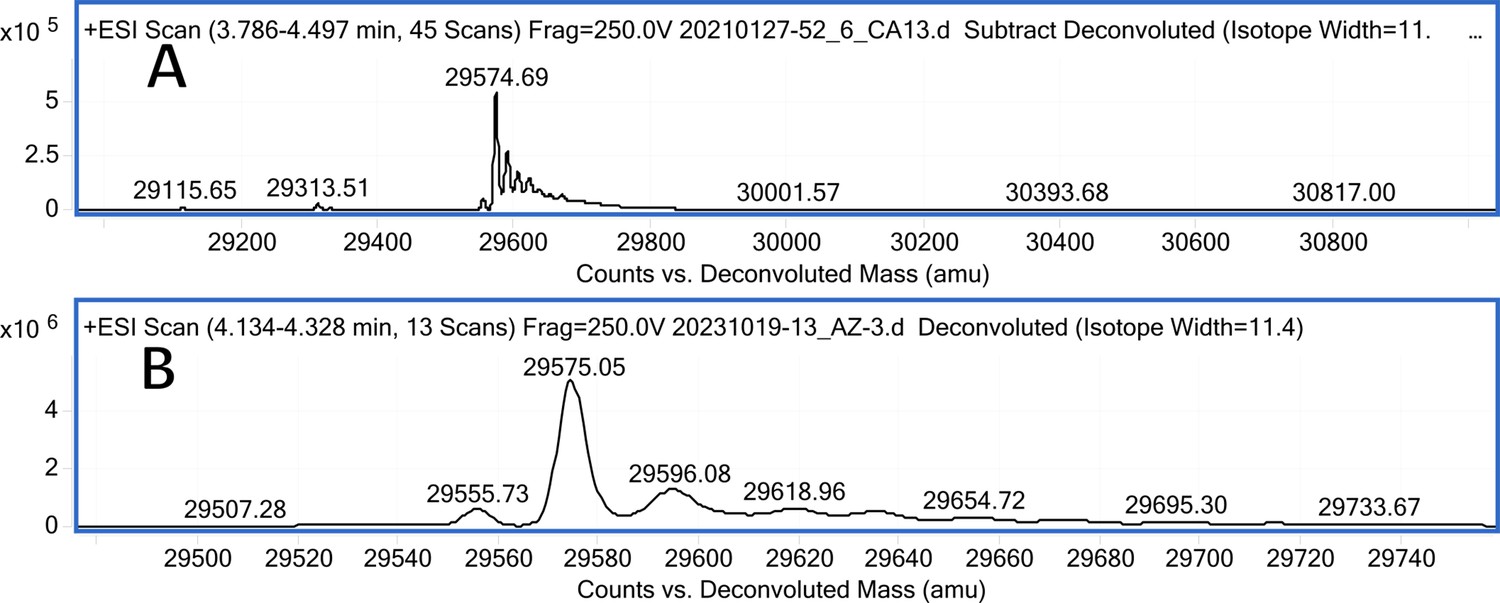
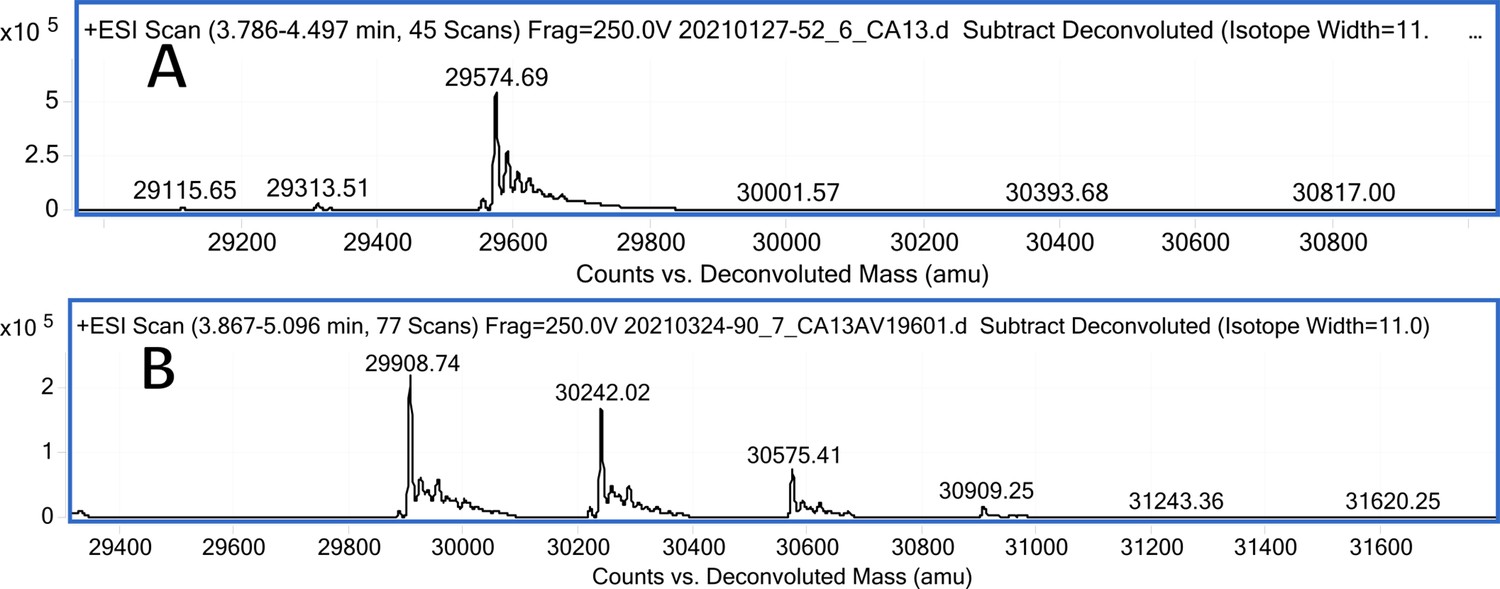
Figure 5—figure supplement 13
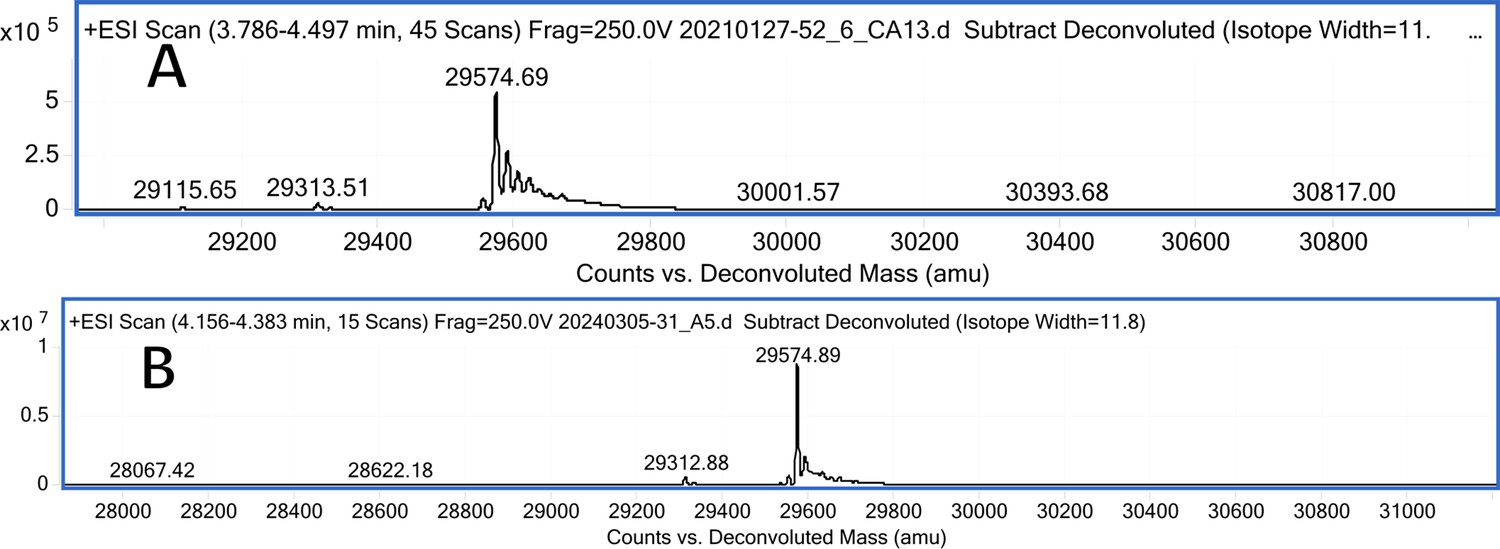
CA XIII mass spectra (A); CA XIII mass spectra after incubation with 5 eq. of compound 3 (B).
Figure 5—figure supplement 14
CA XIII mass spectra (A); CA XIII mass spectra after incubation with 5 eq. of compound 9 (B).
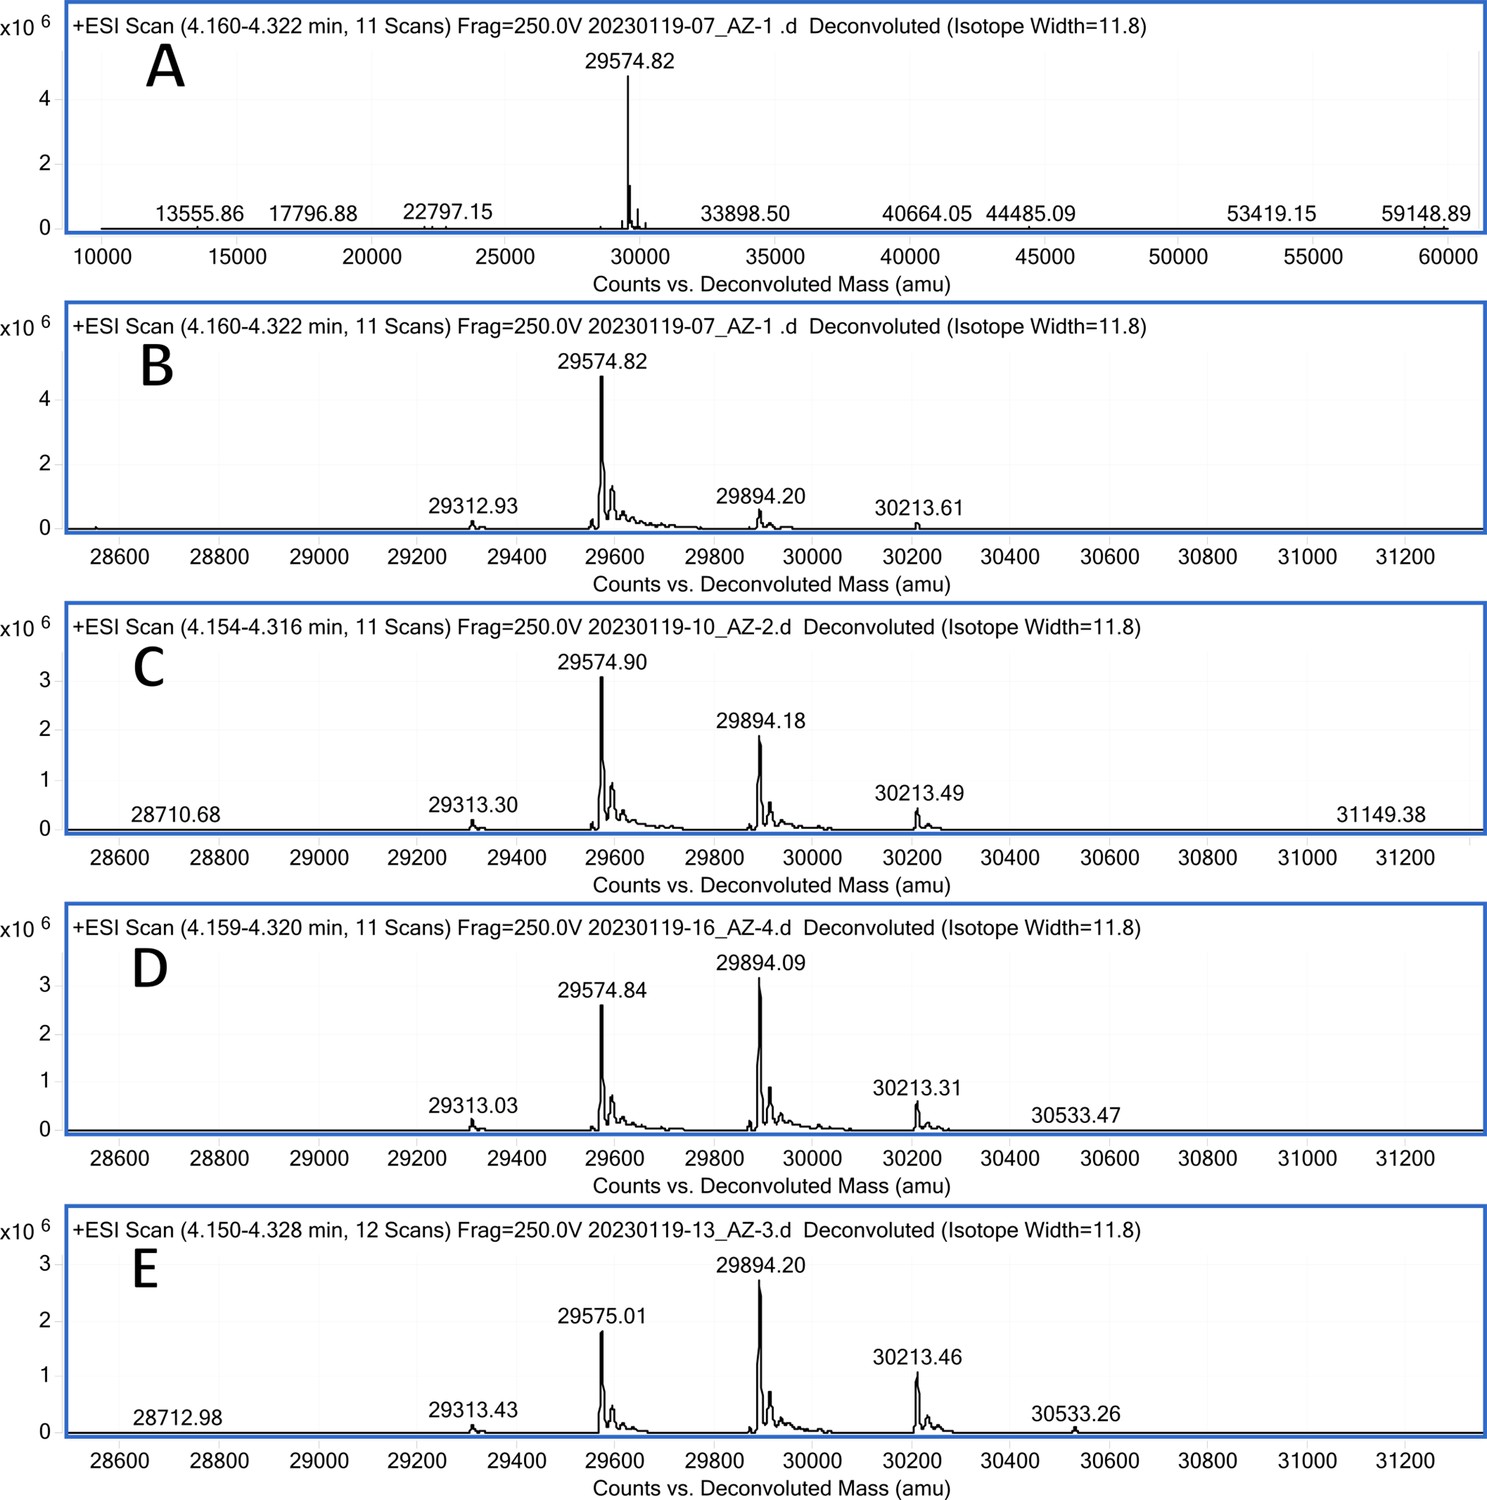
Figure 5—figure supplement 15

CA XIII mass spectra (A); CA XIII mass spectra after incubation with 2 eq. of compound 15 (B).
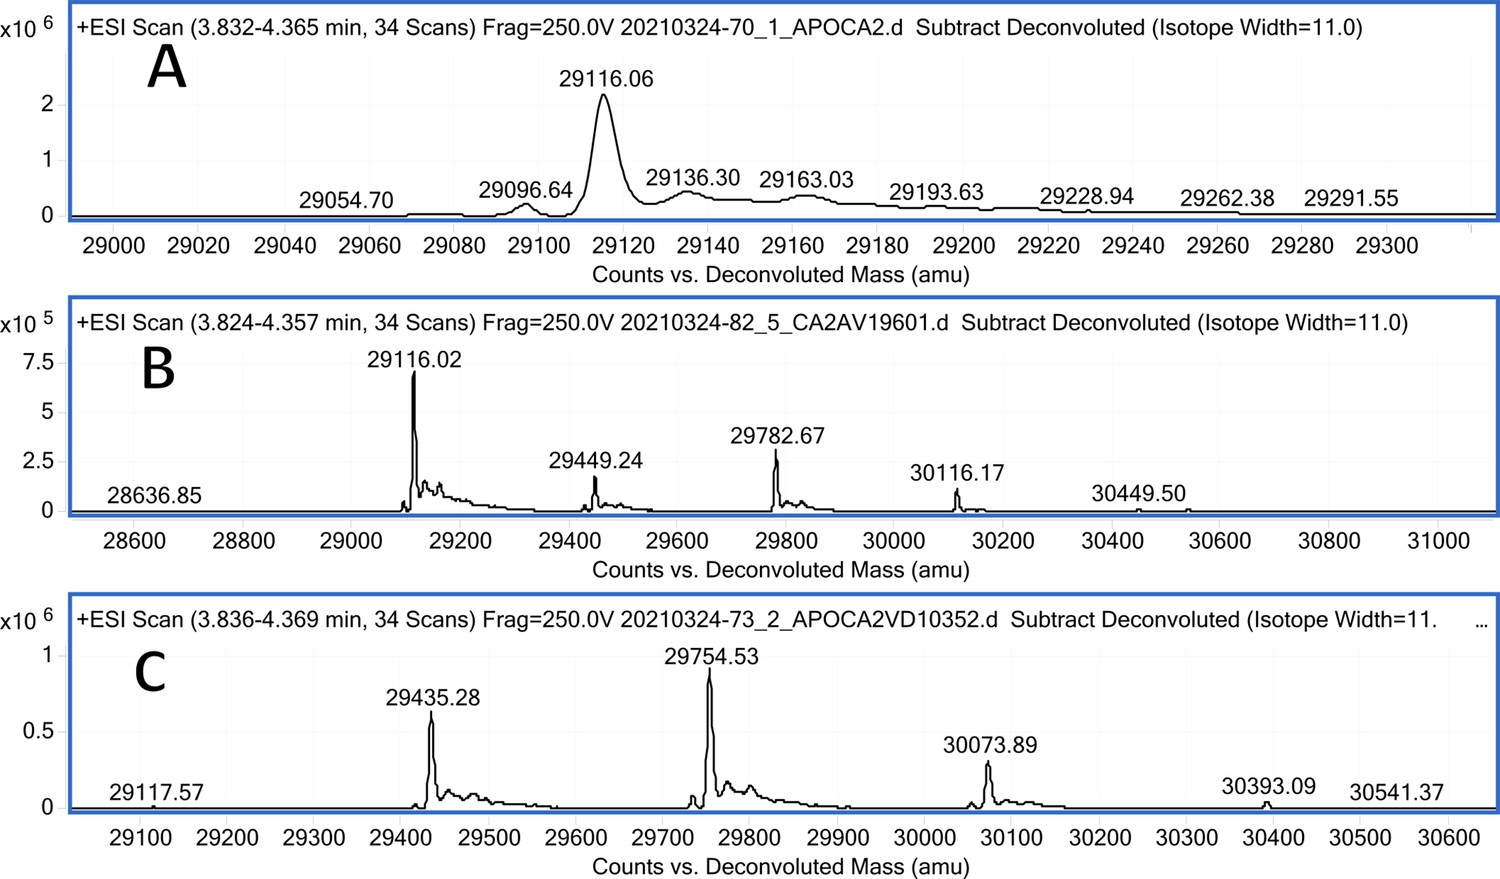
Figure 5—figure supplement 16
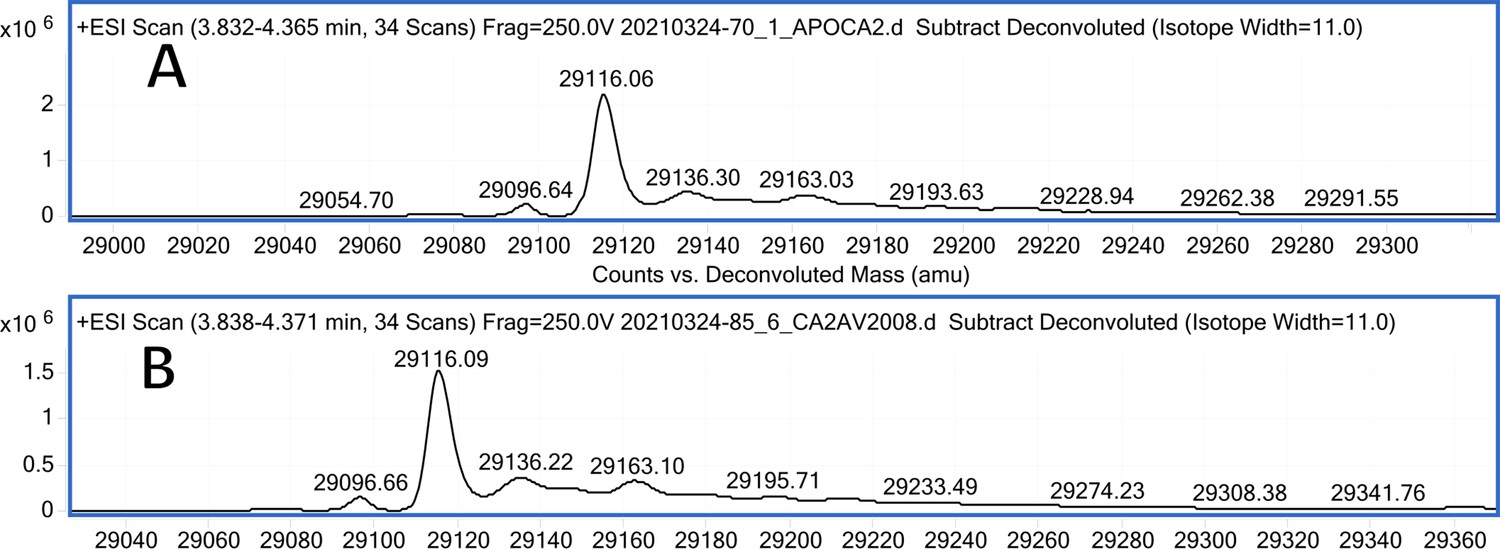
CA II mass spectra (A); CA II mass spectra after incubation with 10 eq. of compound 6 (B).
Figure 5—figure supplement 17
CA II mass spectra (A); CA II mass spectra after incubation with 10 eq. of compound 13 (B); CA II mass spectra after incubation with 10 eq. of compound 12 (C).
Figure 5—figure supplement 18
CA XIII mass spectra (A); CA XIII mass spectra after incubation with 10 eq. of compound 13 (B).
Figure 5—figure supplement 19
CA XIII Mass spectra (A); mass spectra ~3 min after addition of 1 eq. of 18 (B); mass spectra 40 min after addition of 1 eq. of 18 (C); mass spectra 2 hr after addition of 1 eq. of 18 (D); mass spectra 80 min after addition of 10 eq. of 18 (E).
Figure 5—figure supplement 20
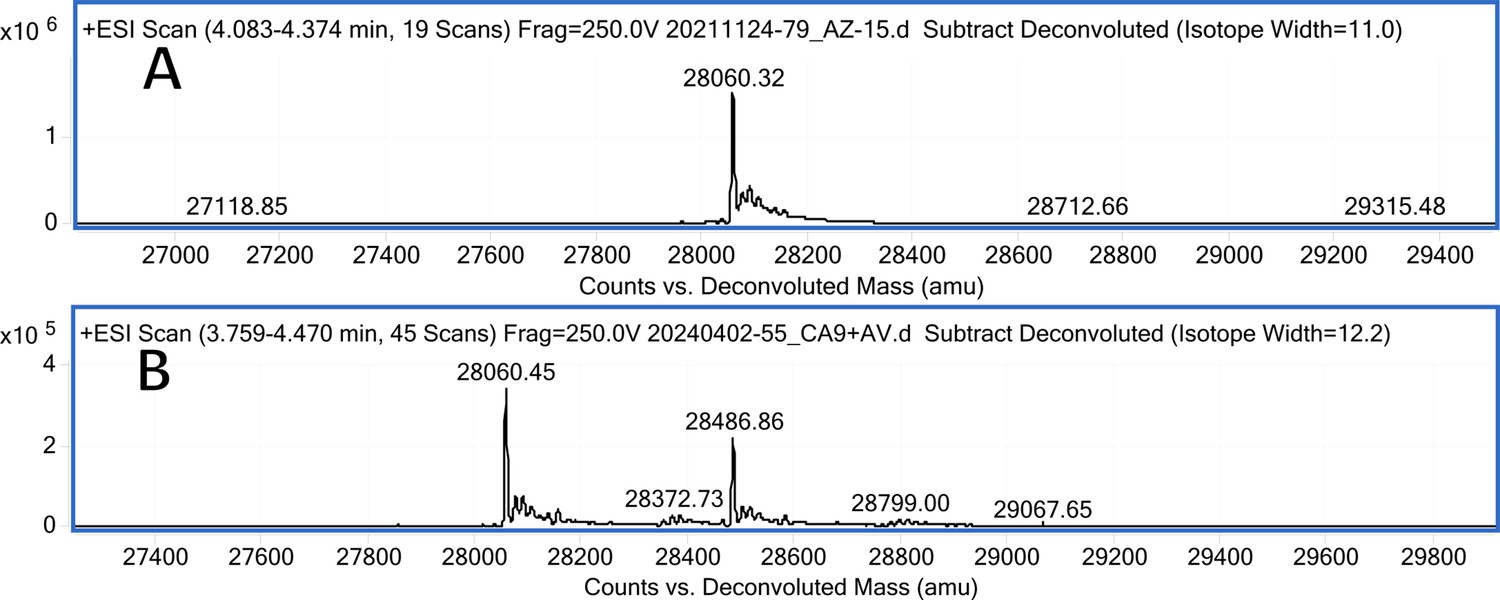
CA IX mass spectra (A); CA IX mass spectra after incubation with 2 eq. of compound 22 (B).
Figure 5—figure supplement 21
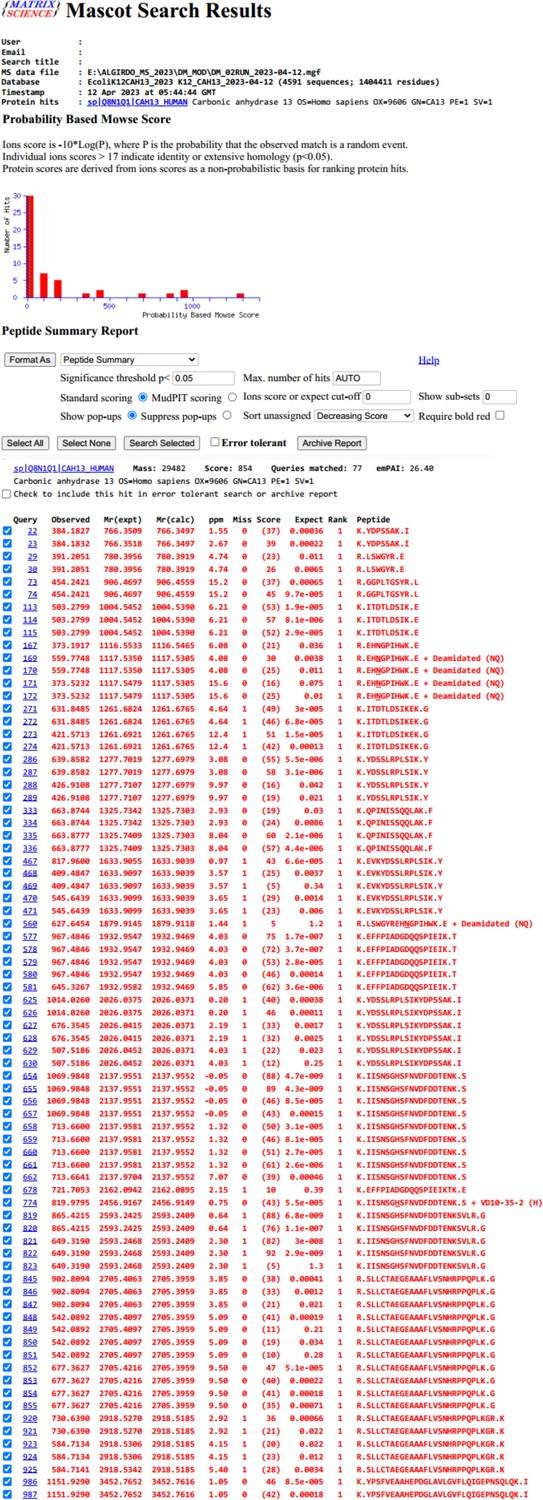
Identified peptides after trypsinization of CAXIII protein in the presence of compound 12 (VD10-35-2).
Proteomic data show only one binding site of compound 12 (VD10-35-2) in the peptide K.IISNSGHSFNVDFDDTENK.S +VD10-35-2 (H).
Figure 5—figure supplement 22
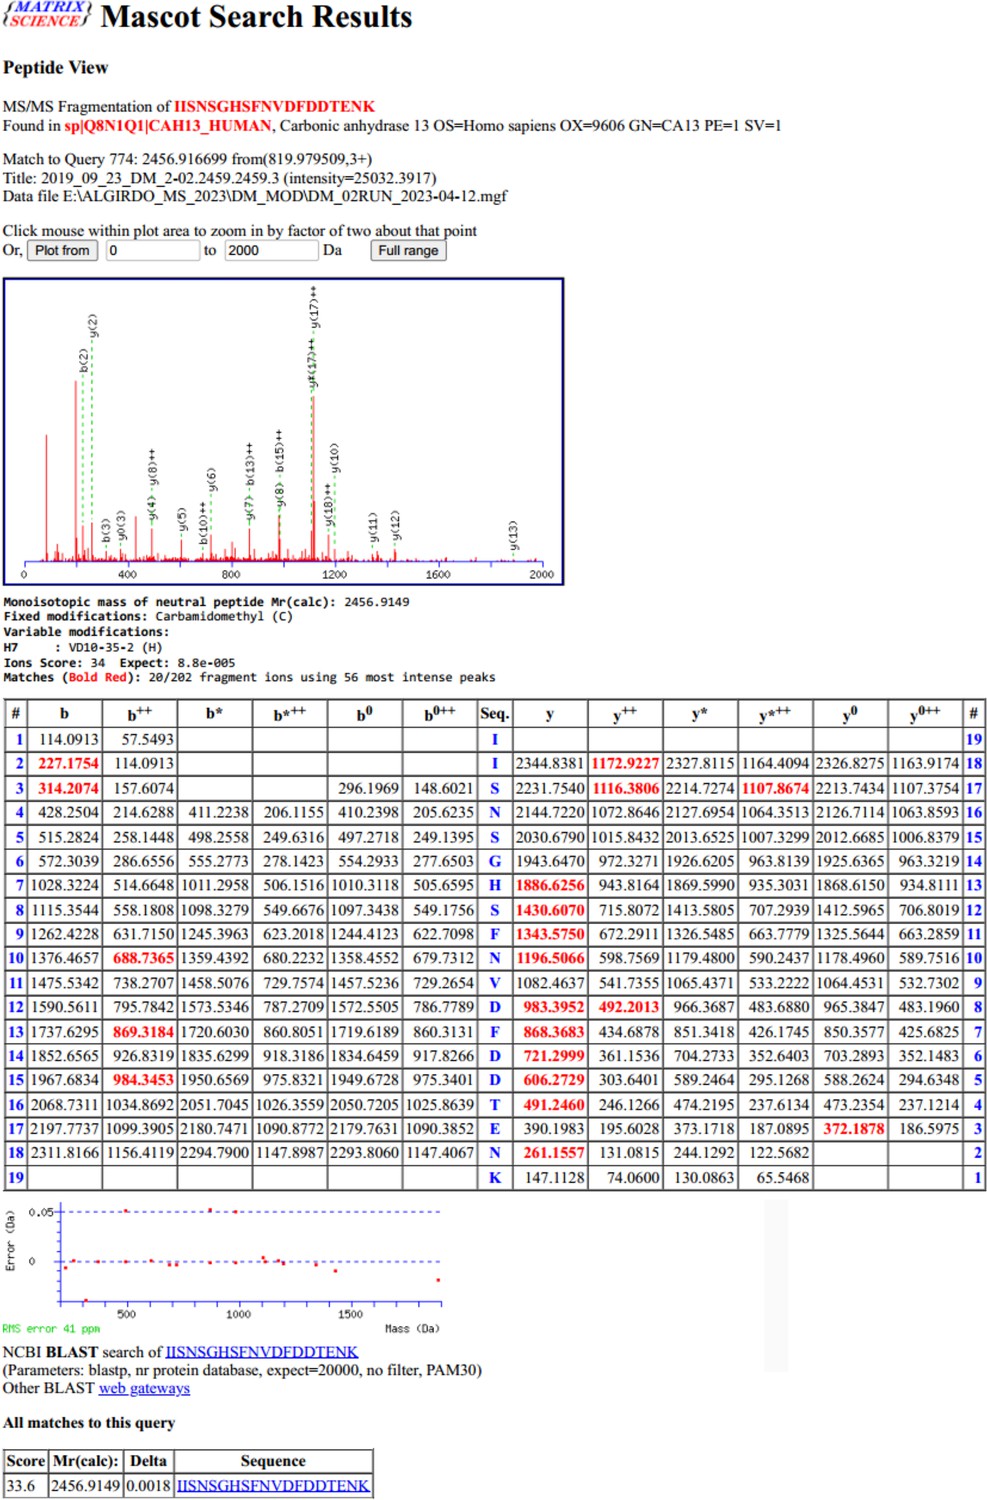
The peptide fragments that appear after fragmentation in the spectrometer.
The masses of the detected peptide fragments are marked in red.
Figure 5—figure supplement 23
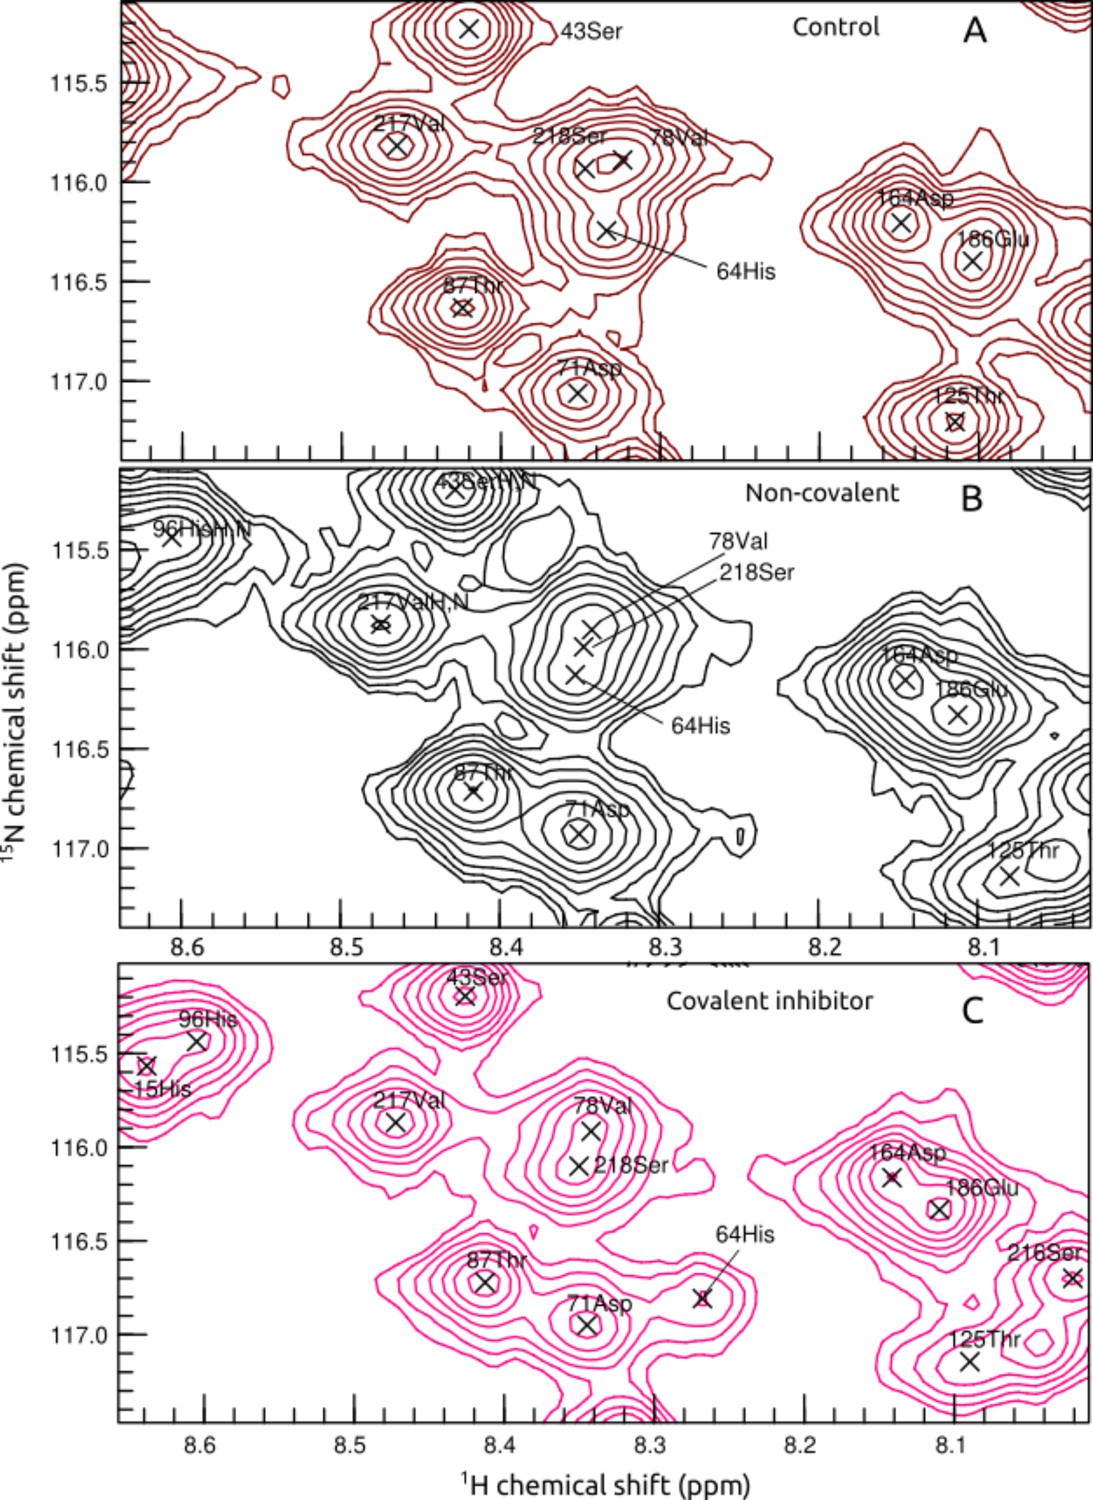
The change of His64 position of CAII in 1H-15N-HSQC spectrum: the control (A); after the addition of non-covalent sulfonamide 1 (B); after the addition of covalent (bottom panel) inhibitor 12 (C).
Figure 5—figure supplement 24
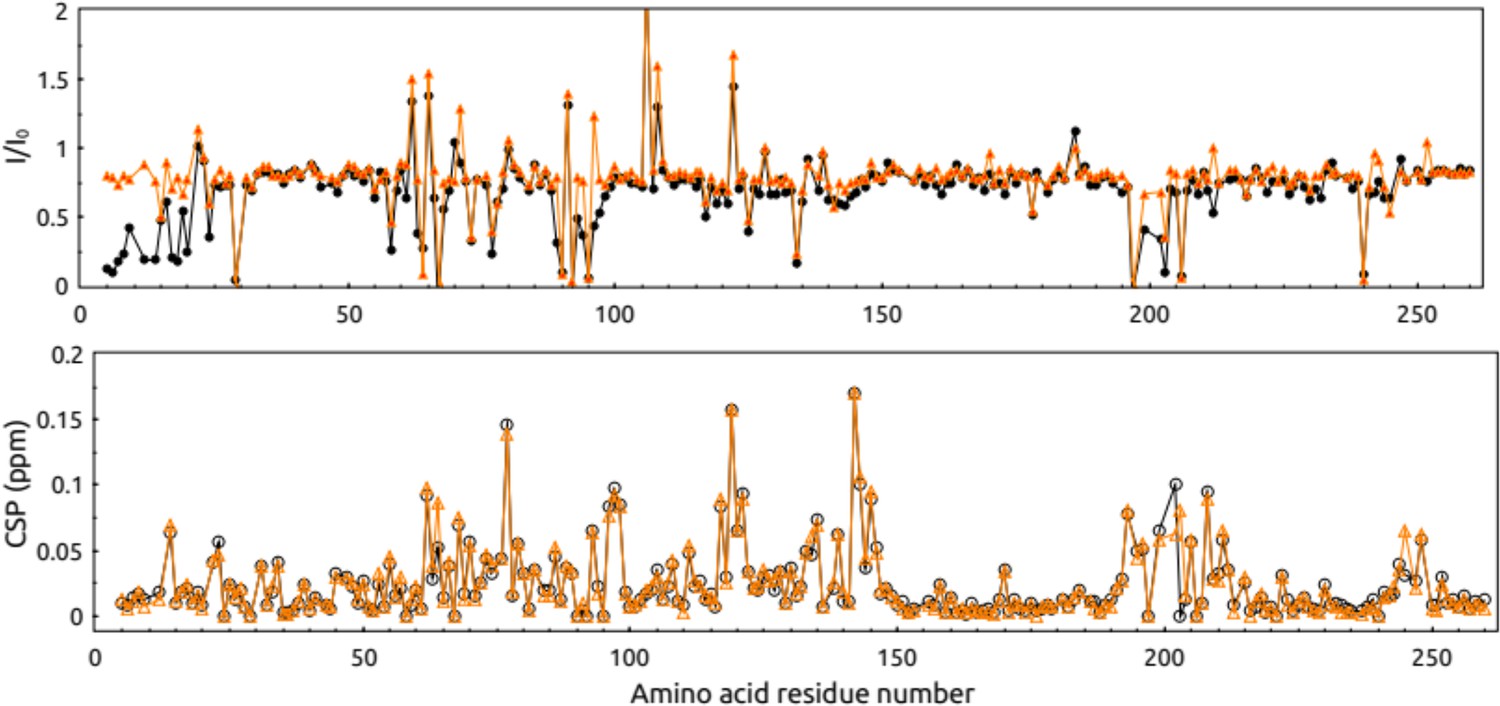
Intensity change and chemical shift perturbation (CSP) of recombinant human carbonic anhydrase peaks in the 1H-15N-HSQC spectrum after the addition of non-covalent (orange) or covalent (black) inhibitors.
Figure 6
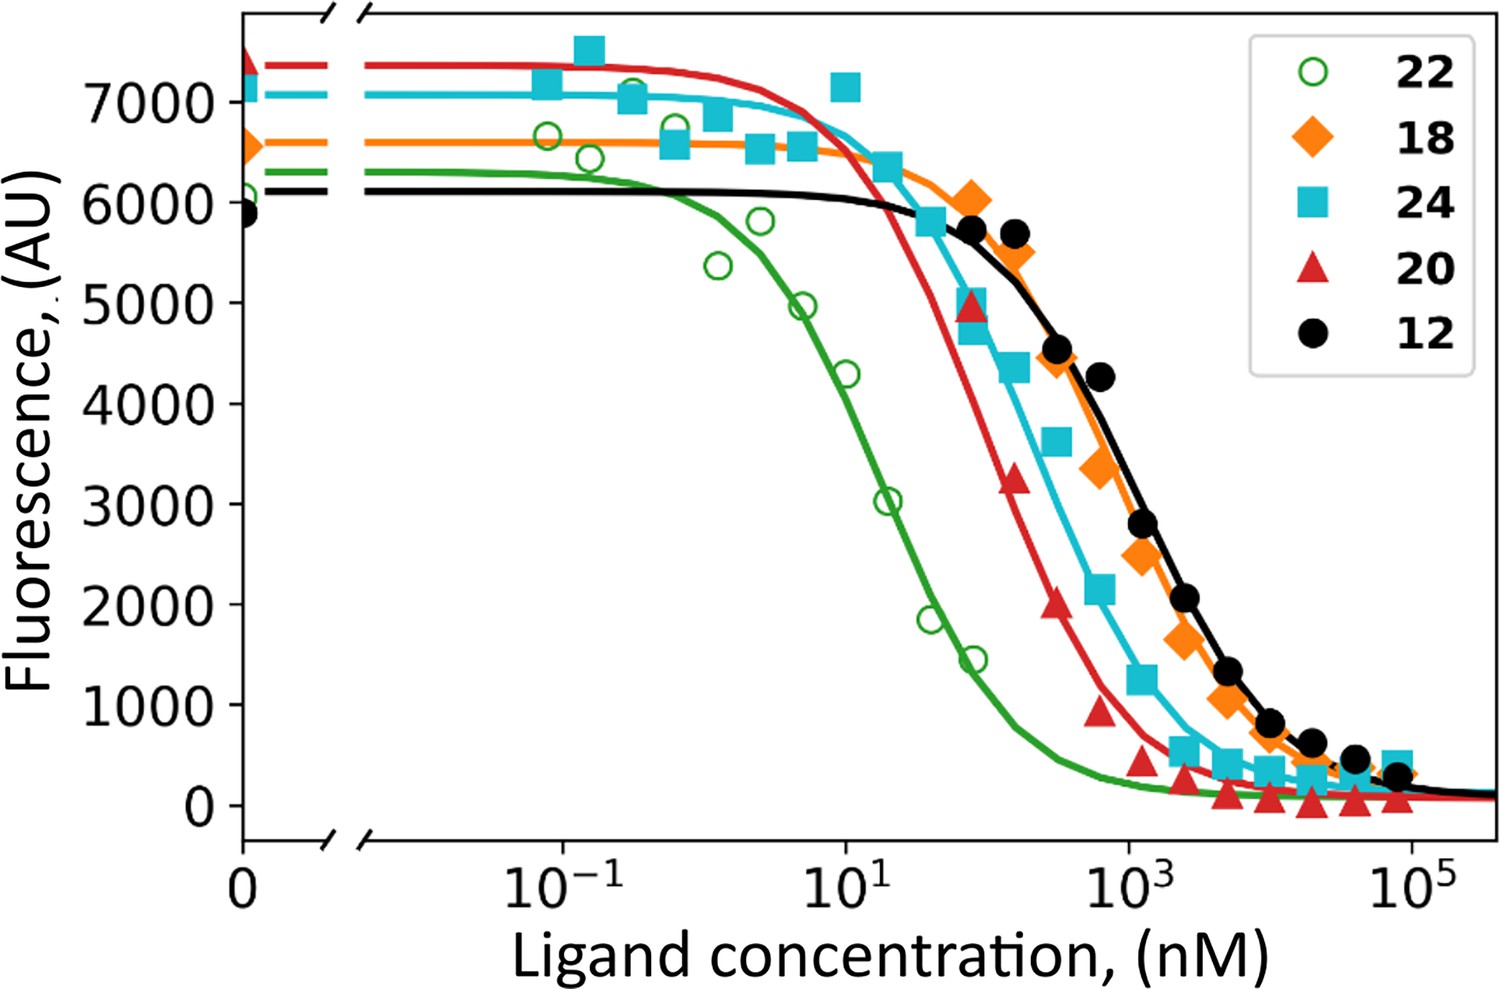
Dosing curves of covalent compounds applied to hypoxic live cell culture expressing CAIX: 22 – green; 18 - orange; 24 – cyan; 20 – red, and 12 – black.
The compounds competed with the fluorescein-labeled GZ19-32, added at 10 nM concentration to all samples. A competitive binding model was applied to obtain the affinities of tested compounds for cell-surface CAIX (Table 1).
Figure 7 with 15 supplements
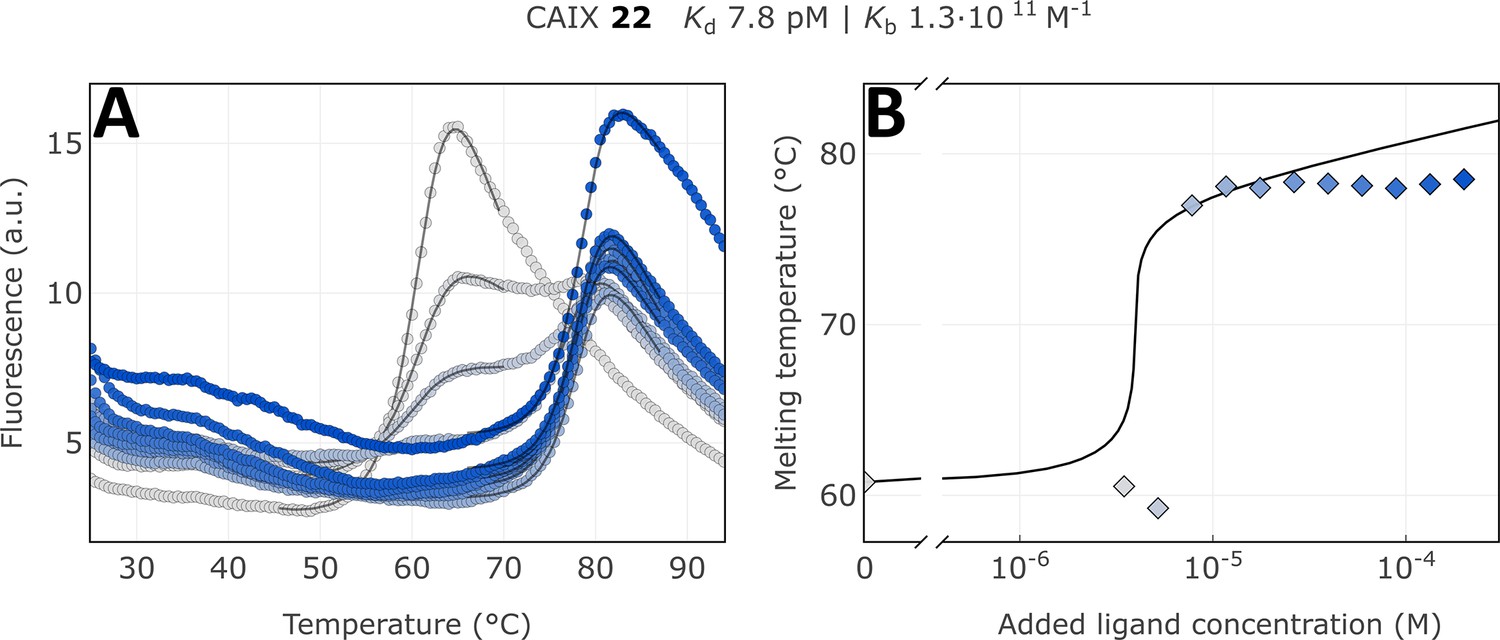
Apparent affinity determination of compound 22 by the thermal shift assay.
(A) Raw FTSA data of compound 22 binding to CAIX (pH 7.0 for 37 °C). (B) Enzyme melting temperature dependence on compound 22 concentration. Datapoints saturated due to the covalent nature of interaction and therefore did not fully fit into the model line.
Figure 7—figure supplement 1
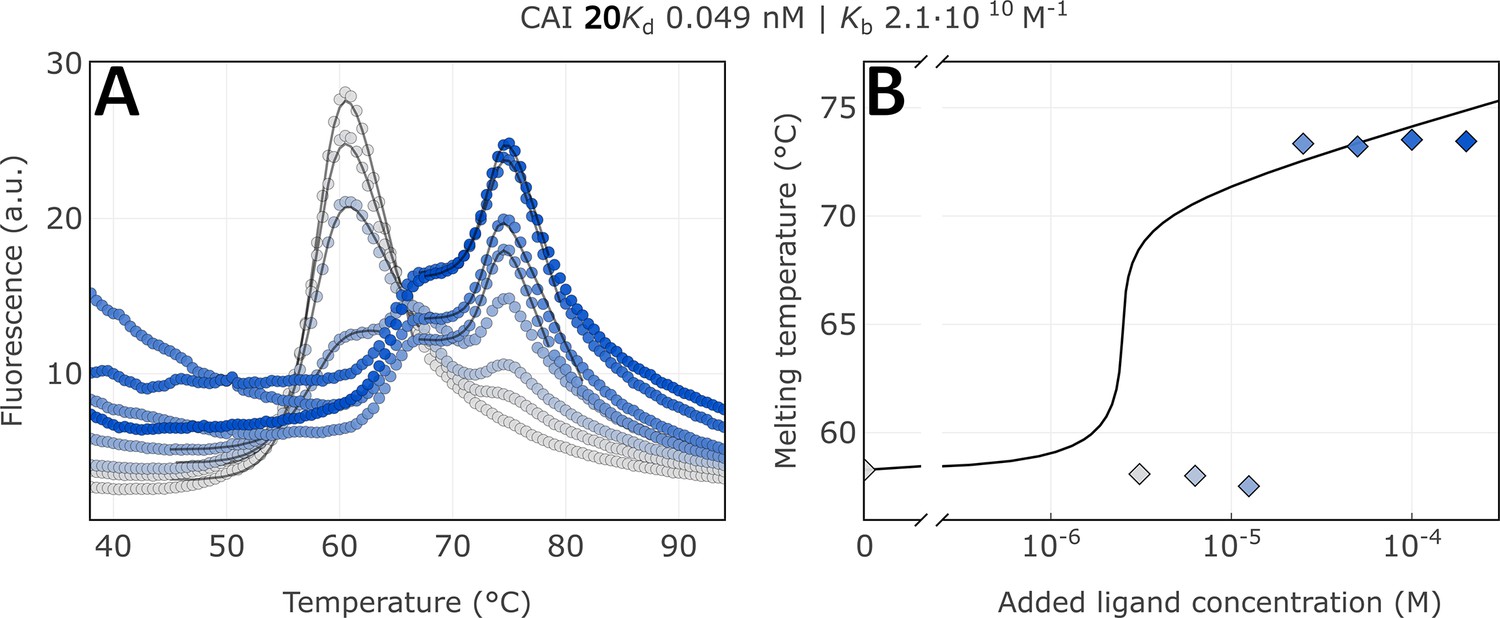
Raw FTSA data of compound 20 binding to CA I (A); enzyme melting temperature dependence on sulfonamide 20 concentration (B).
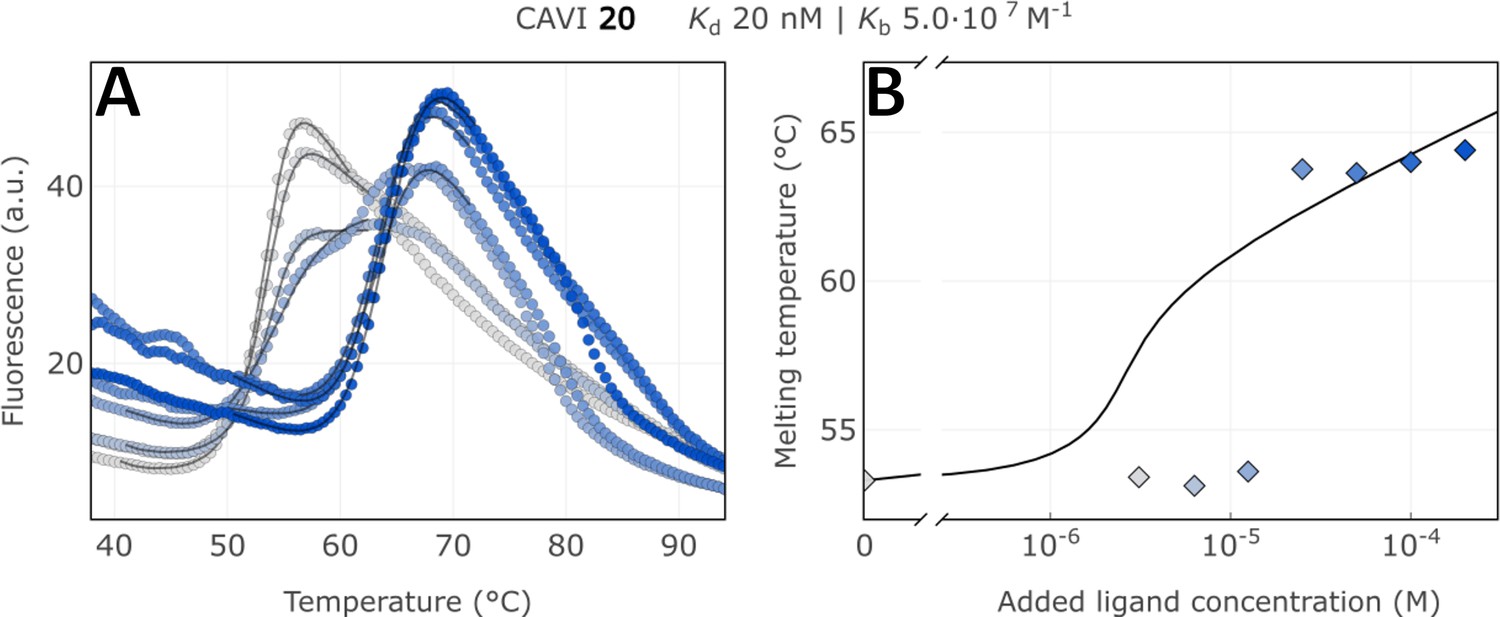
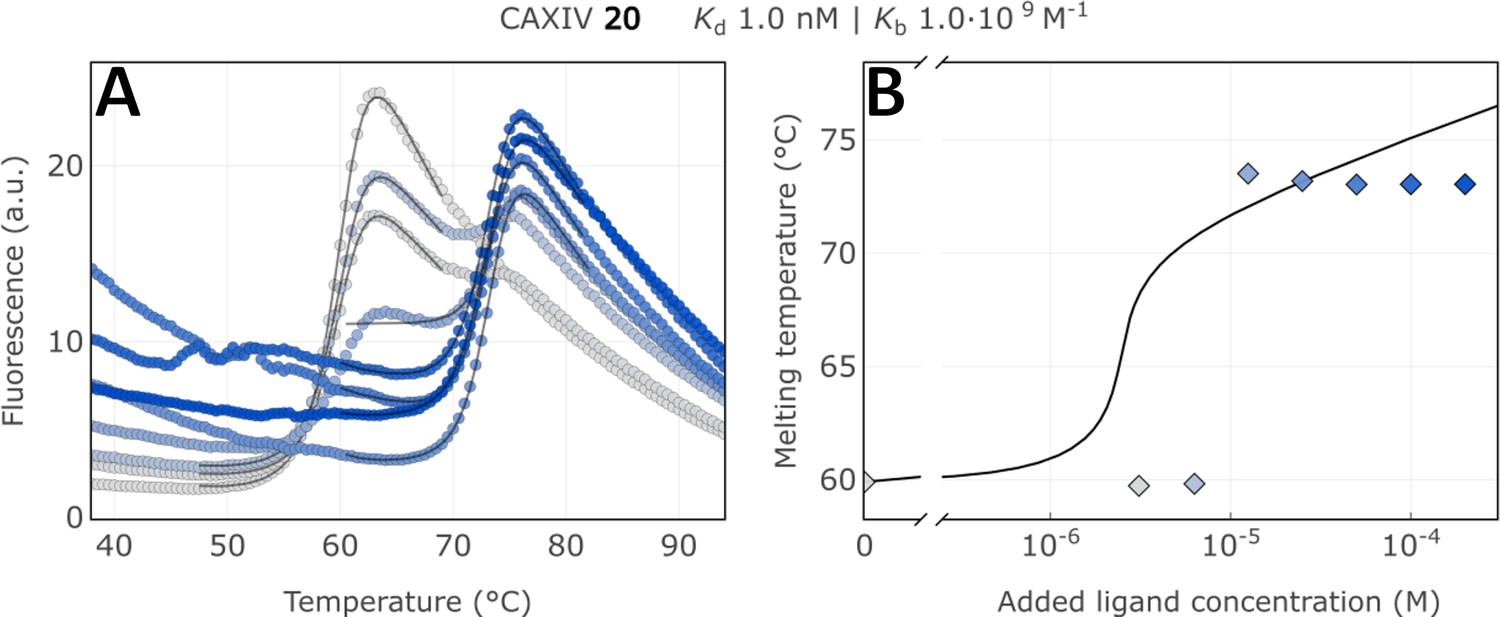
Figure 7—figure supplement 2
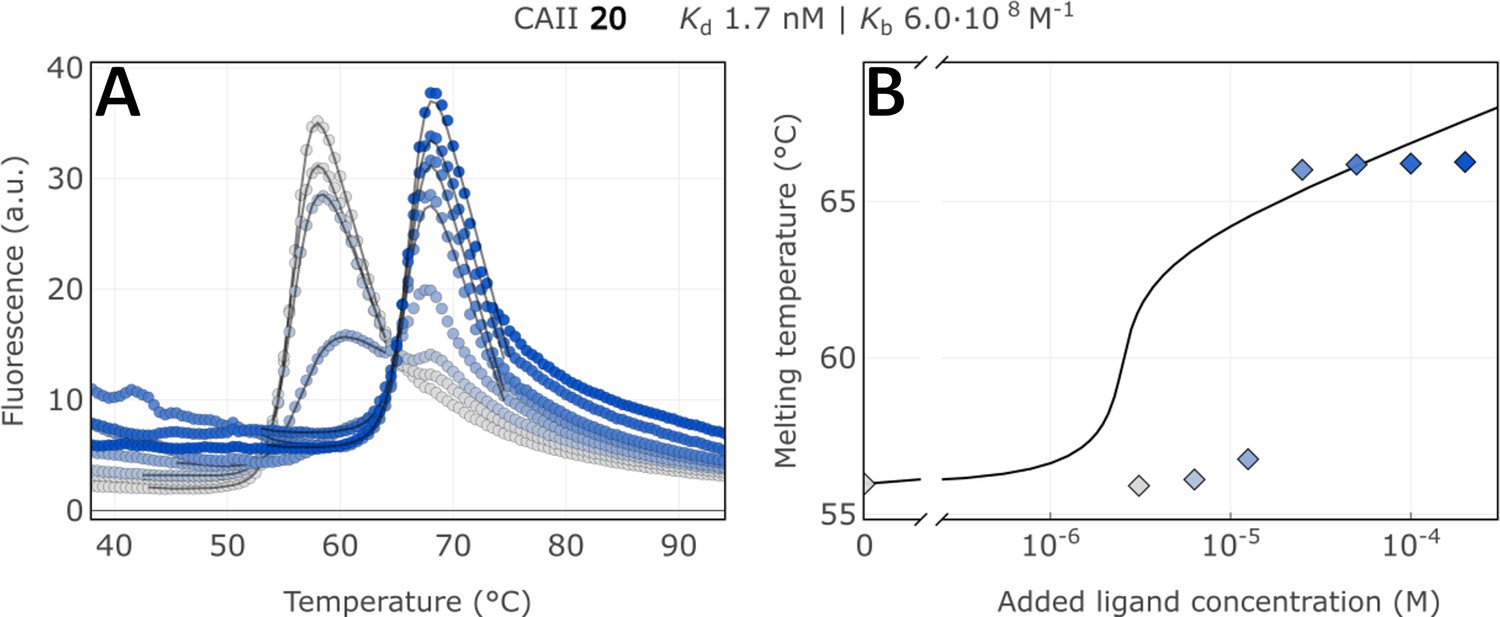
Raw FTSA data of compound 20 binding to CA II (A); enzyme melting temperature dependence on sulfonamide 20 concentration (B).
Figure 7—figure supplement 3
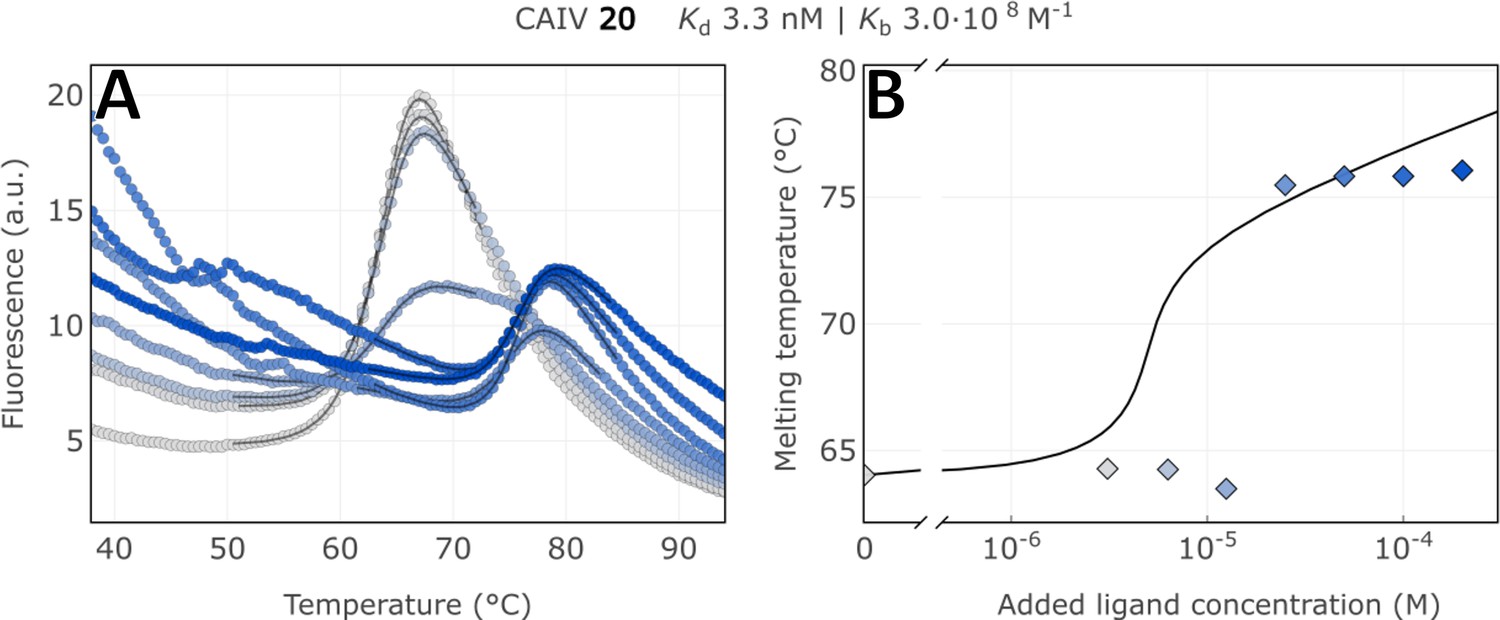
Raw FTSA data of compound 20 binding to CA IV (A); enzyme melting temperature dependence on sulfonamide 20 concentration (B).
Figure 7—figure supplement 4
Raw FTSA data of compound 20 binding to CA VI (A); enzyme melting temperature dependence on sulfonamide 20 concentration (B).
Figure 7—figure supplement 5
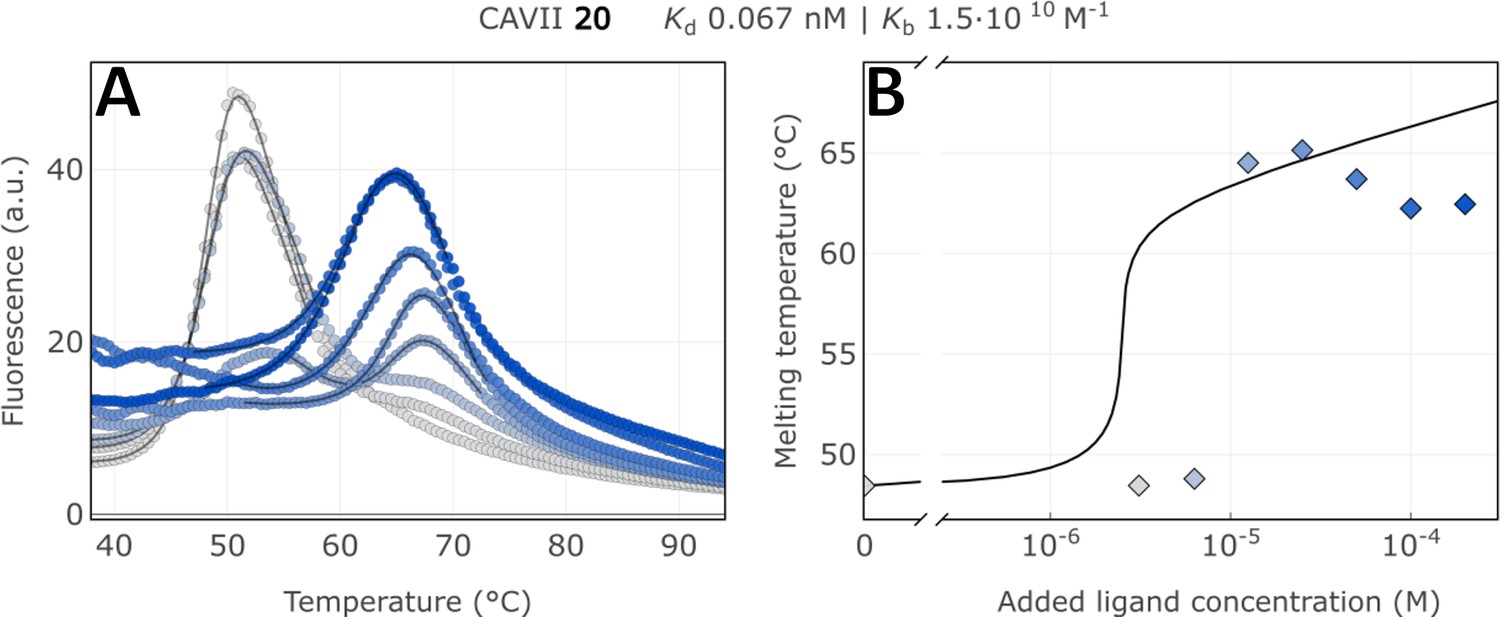
Raw FTSA data of compound 20 binding to CA VII (A); enzyme melting temperature dependence on sulfonamide 20 concentration (B).
Figure 7—figure supplement 6

Raw FTSA data of compound 20 binding to CA IX (A); enzyme melting temperature dependence on sulfonamide 20 concentration (B).
Figure 7—figure supplement 7
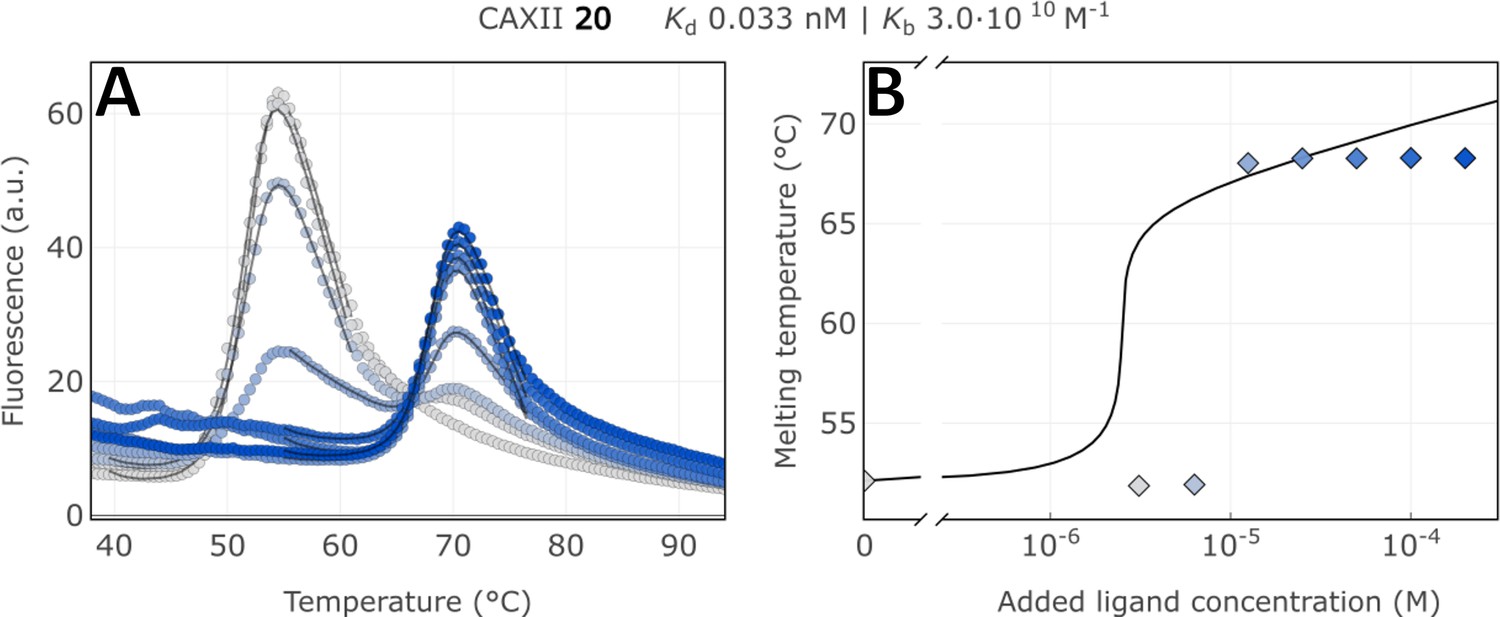
Raw FTSA data of compound 20 binding to CA XII (A); enzyme melting temperature dependence on sulfonamide 20 concentration (B).
Figure 7—figure supplement 8
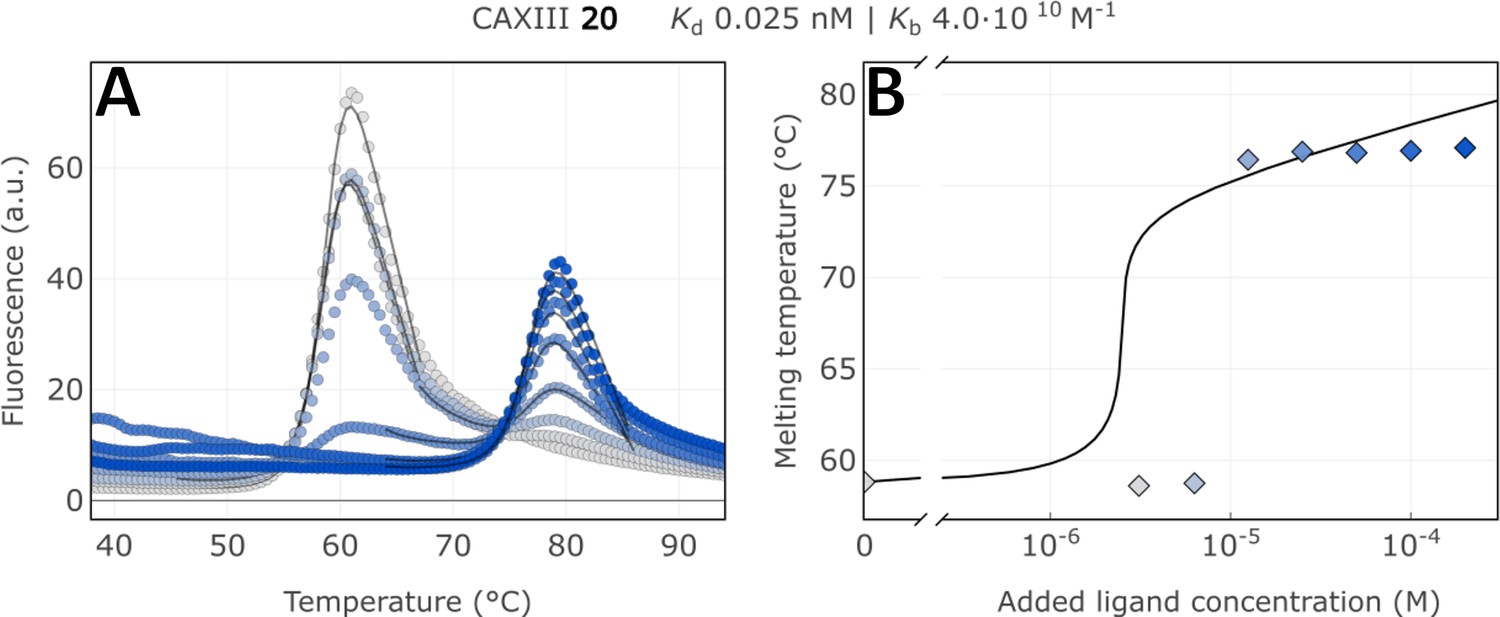
Raw FTSA data of compound 20 binding to CA XIII (A); enzyme melting temperature dependence on sulfonamide 20 concentration (B).
Figure 7—figure supplement 9
Raw FTSA data of compound 20 binding to CA XIV (A); enzyme melting temperature dependence on sulfonamide 20 concentration (B).
Figure 7—figure supplement 10
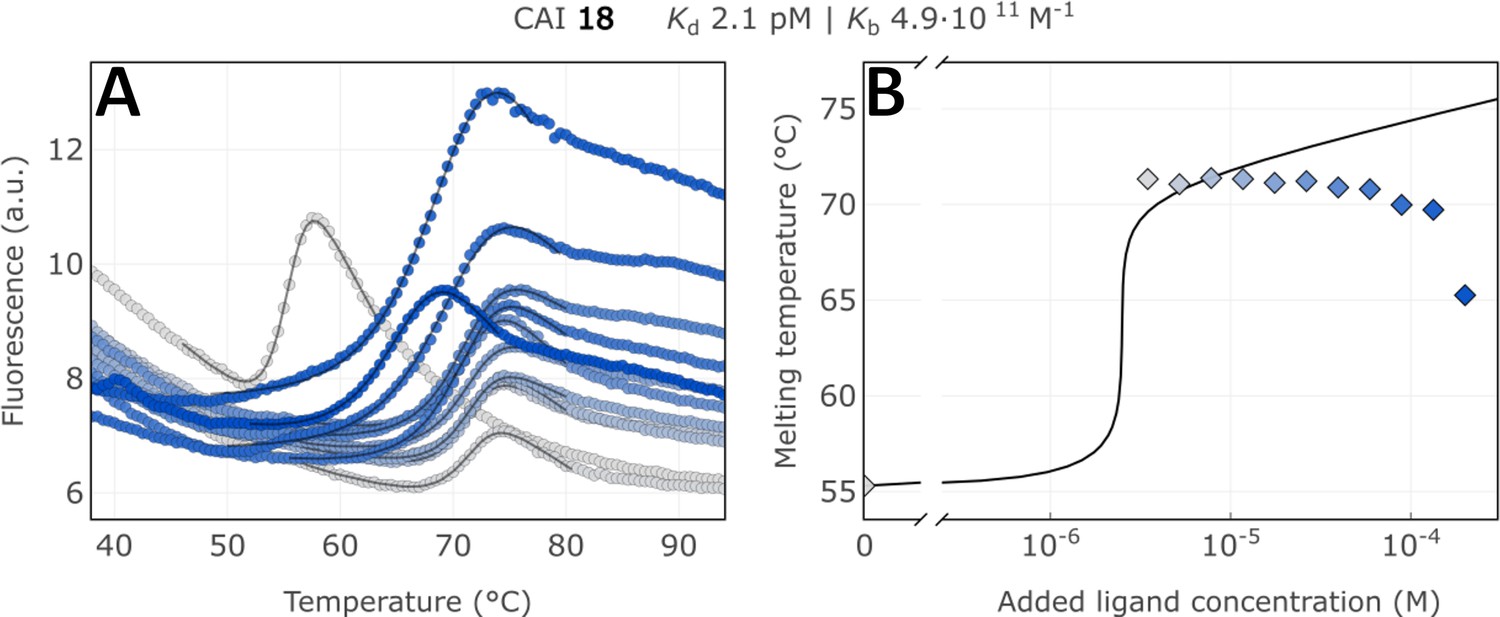
Raw FTSA data of compound 18 binding to CA I after a 2 hr incubation period (A); enzyme melting temperature dependence on sulfonamide 18 concentration (B).
Figure 7—figure supplement 11
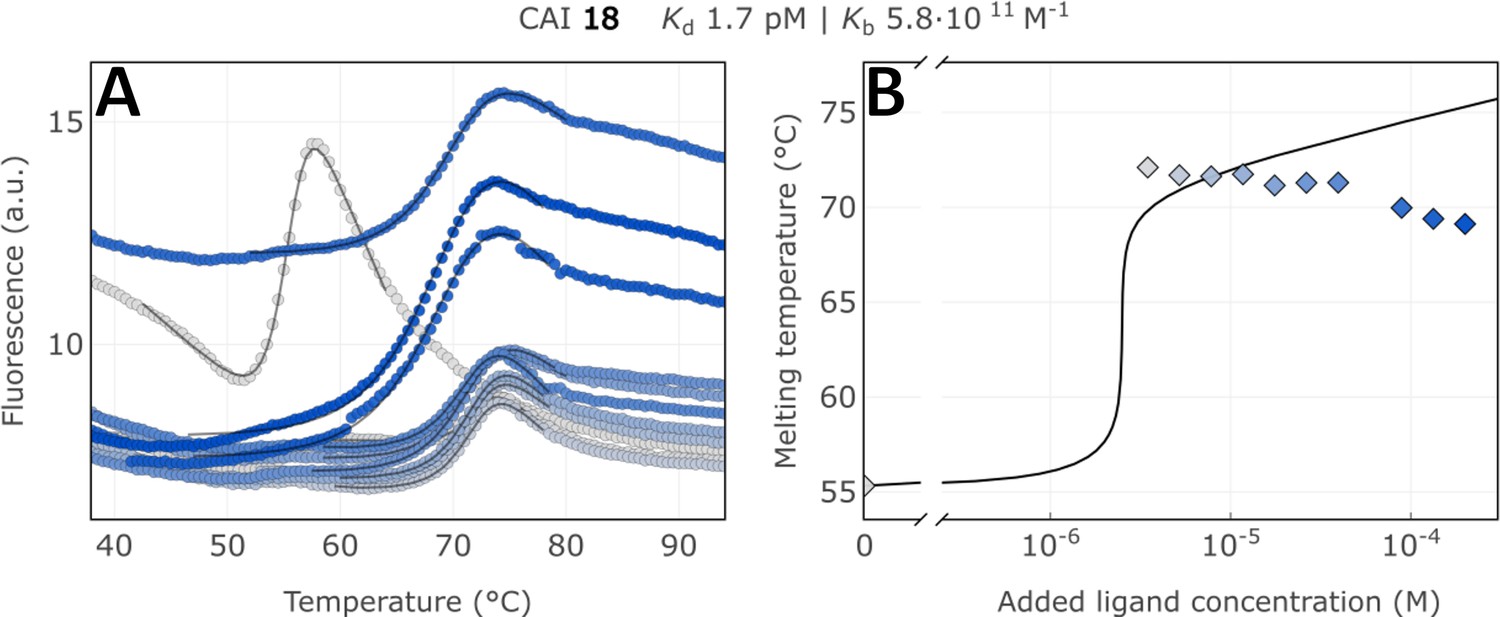
Raw FTSA data of compound 18 binding to CA I without incubating period (A); enzyme melting temperature dependence on sulfonamide 18 concentration (B).
Figure 7—figure supplement 12
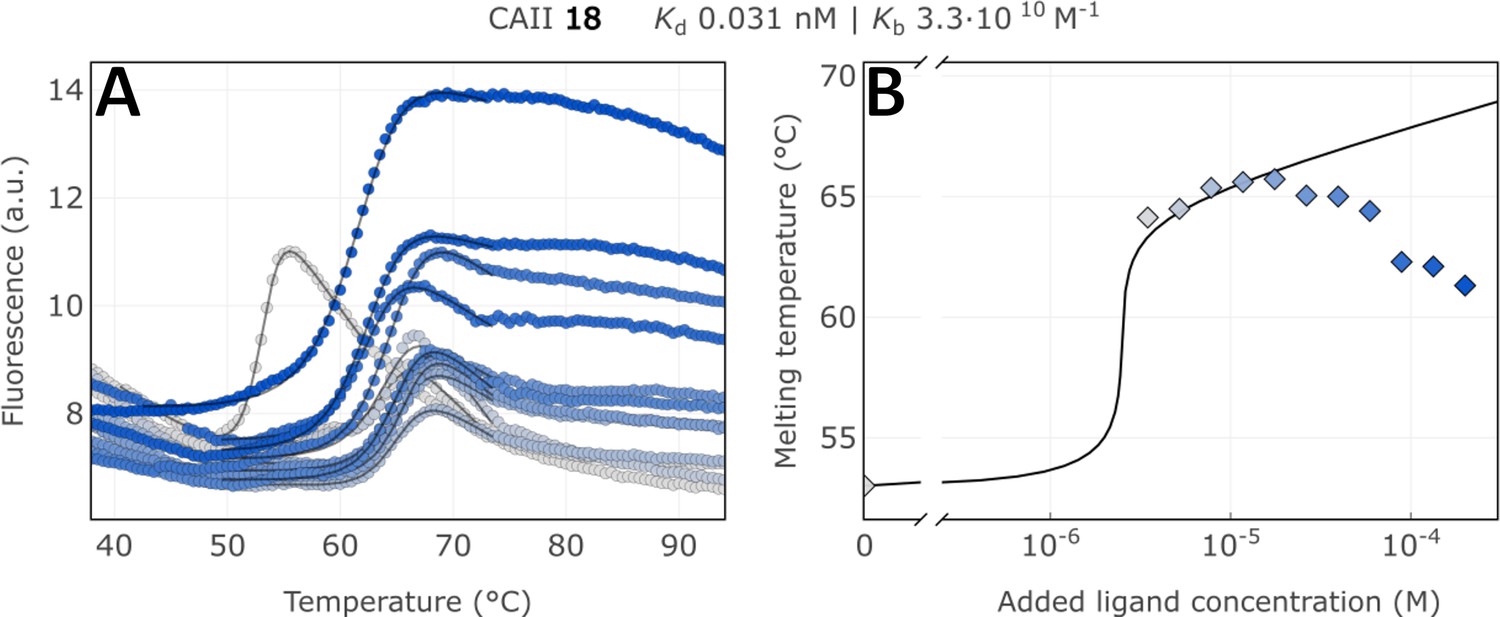
Raw FTSA data of compound 18 binding to CA II after a 2 hr incubation period (A); enzyme melting temperature dependence on sulfonamide 18 concentration (B).
Figure 7—figure supplement 13
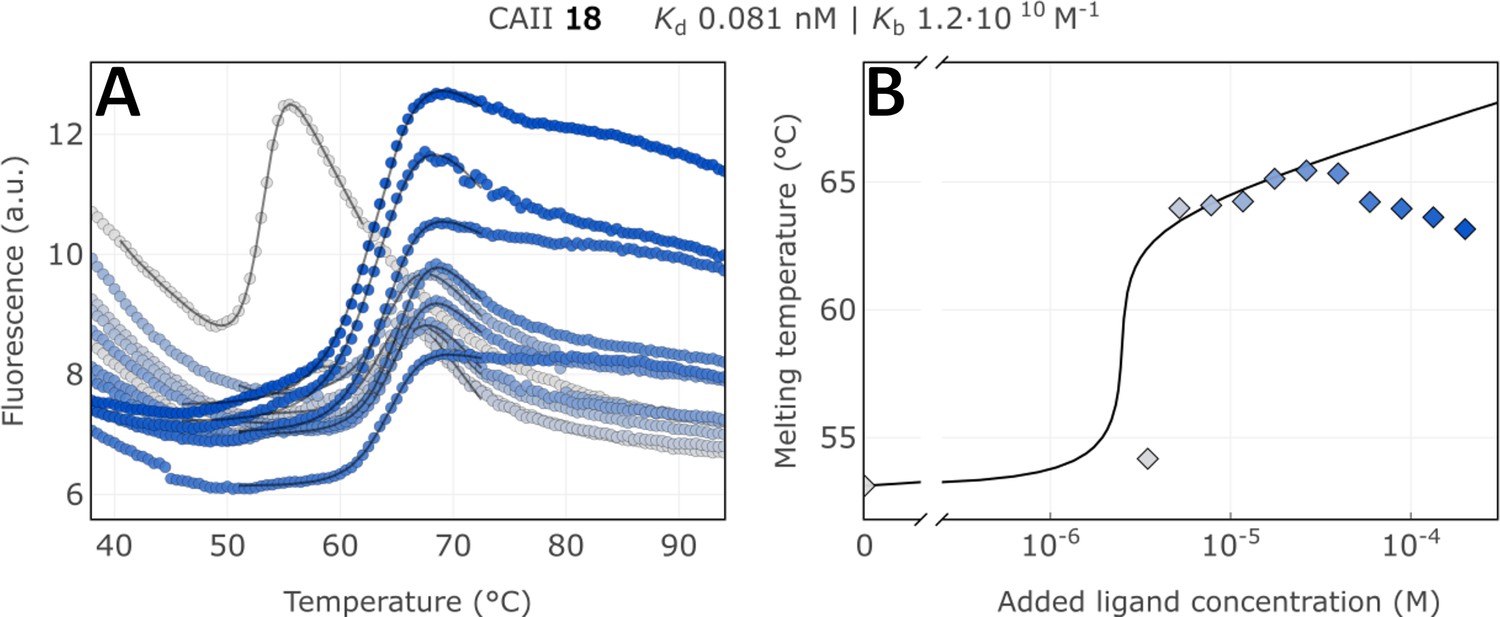
Raw FTSA data of compound 18 binding to CA II without an incubating period (A); enzyme melting temperature dependence on sulfonamide 18 concentration (B).
Figure 7—figure supplement 14
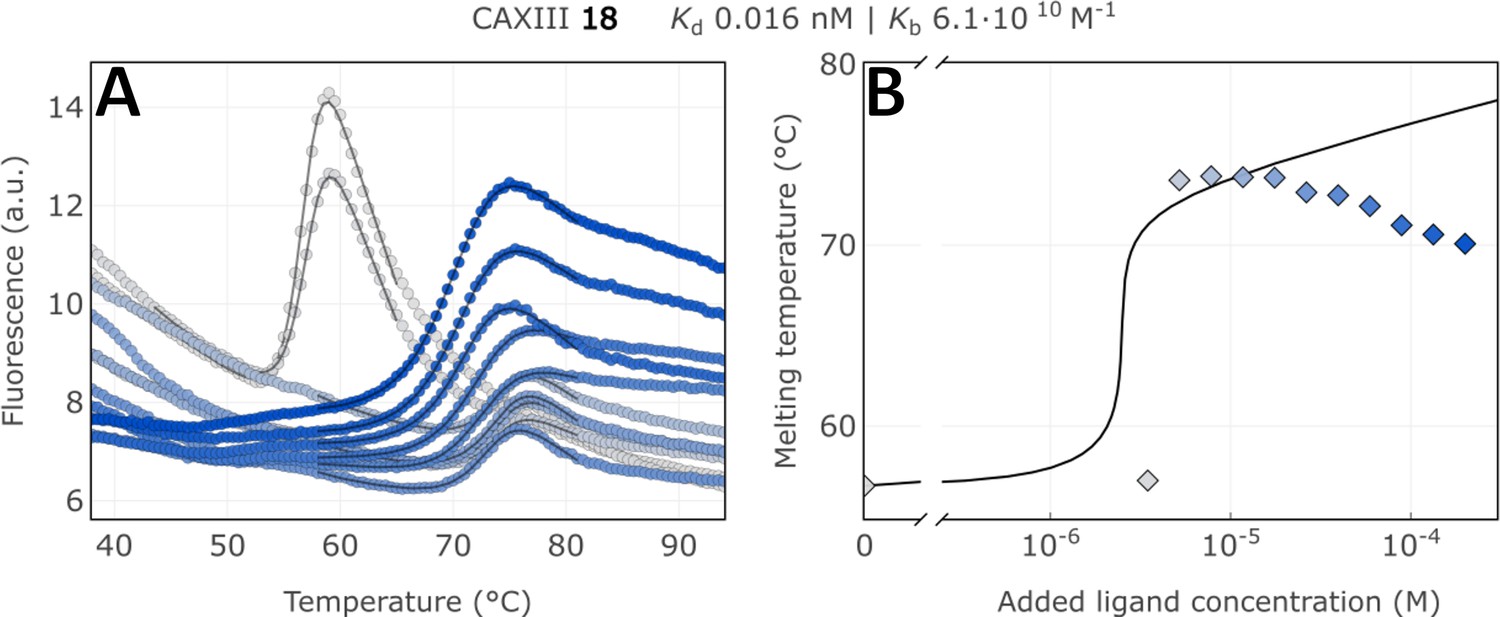
Raw FTSA data of compound 18 binding to CA XIII after a 2 hr incubation period (A); enzyme melting temperature dependence on sulfonamide 18 concentration (B).
Figure 7—figure supplement 15
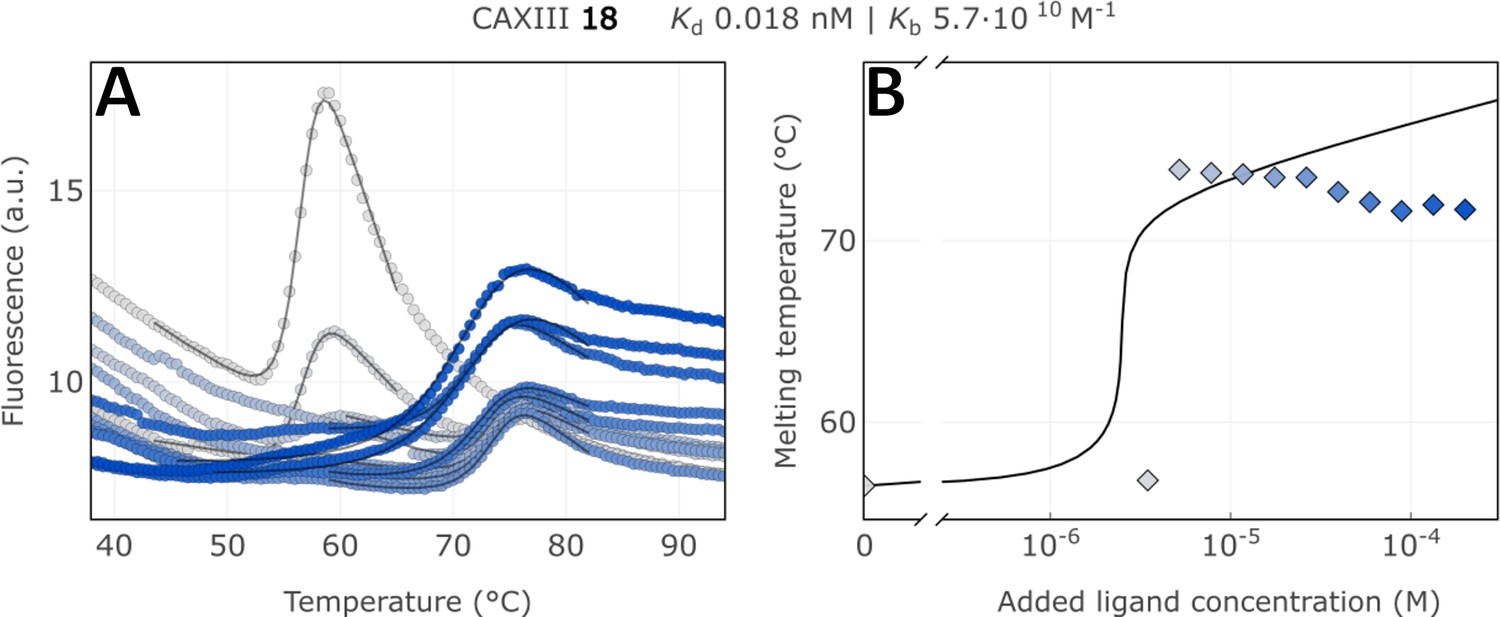
Raw FTSA data of compound 18 binding to CA XIII without an incubating period (A); enzyme melting temperature dependence on sulfonamide 18 concentration (B).
Figure 8
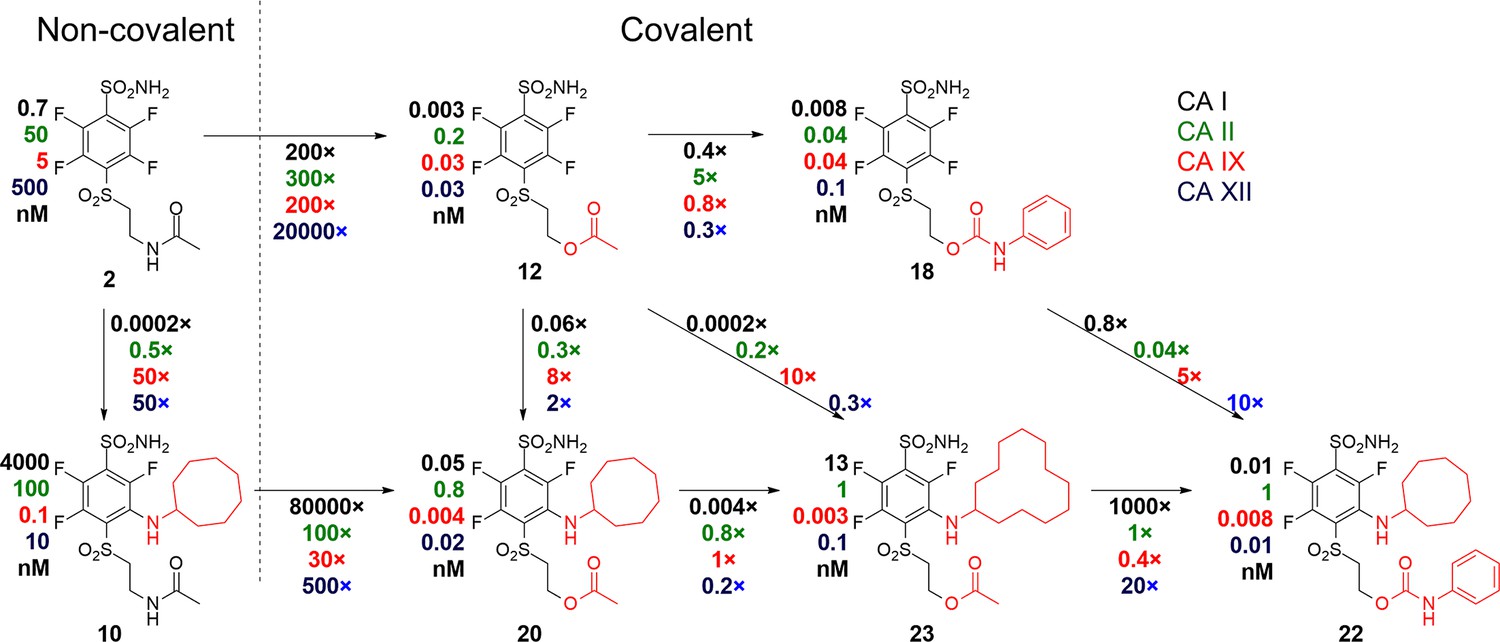
A correlation map between chemical structures and binding affinities showing apparent dissociation constants of compounds for CAI, CAII, CAIX, and CAXII, in nM units.
Apparent affinities are listed next to compound structures and the ratios of Kd,app – above or below the arrows connecting compounds that are compared. The two left compounds, both upper and lower, located to the left of the vertical dashed line do not form covalent bonds with the proteins, while the rest of the compounds form the covalent bond.
Figure 9
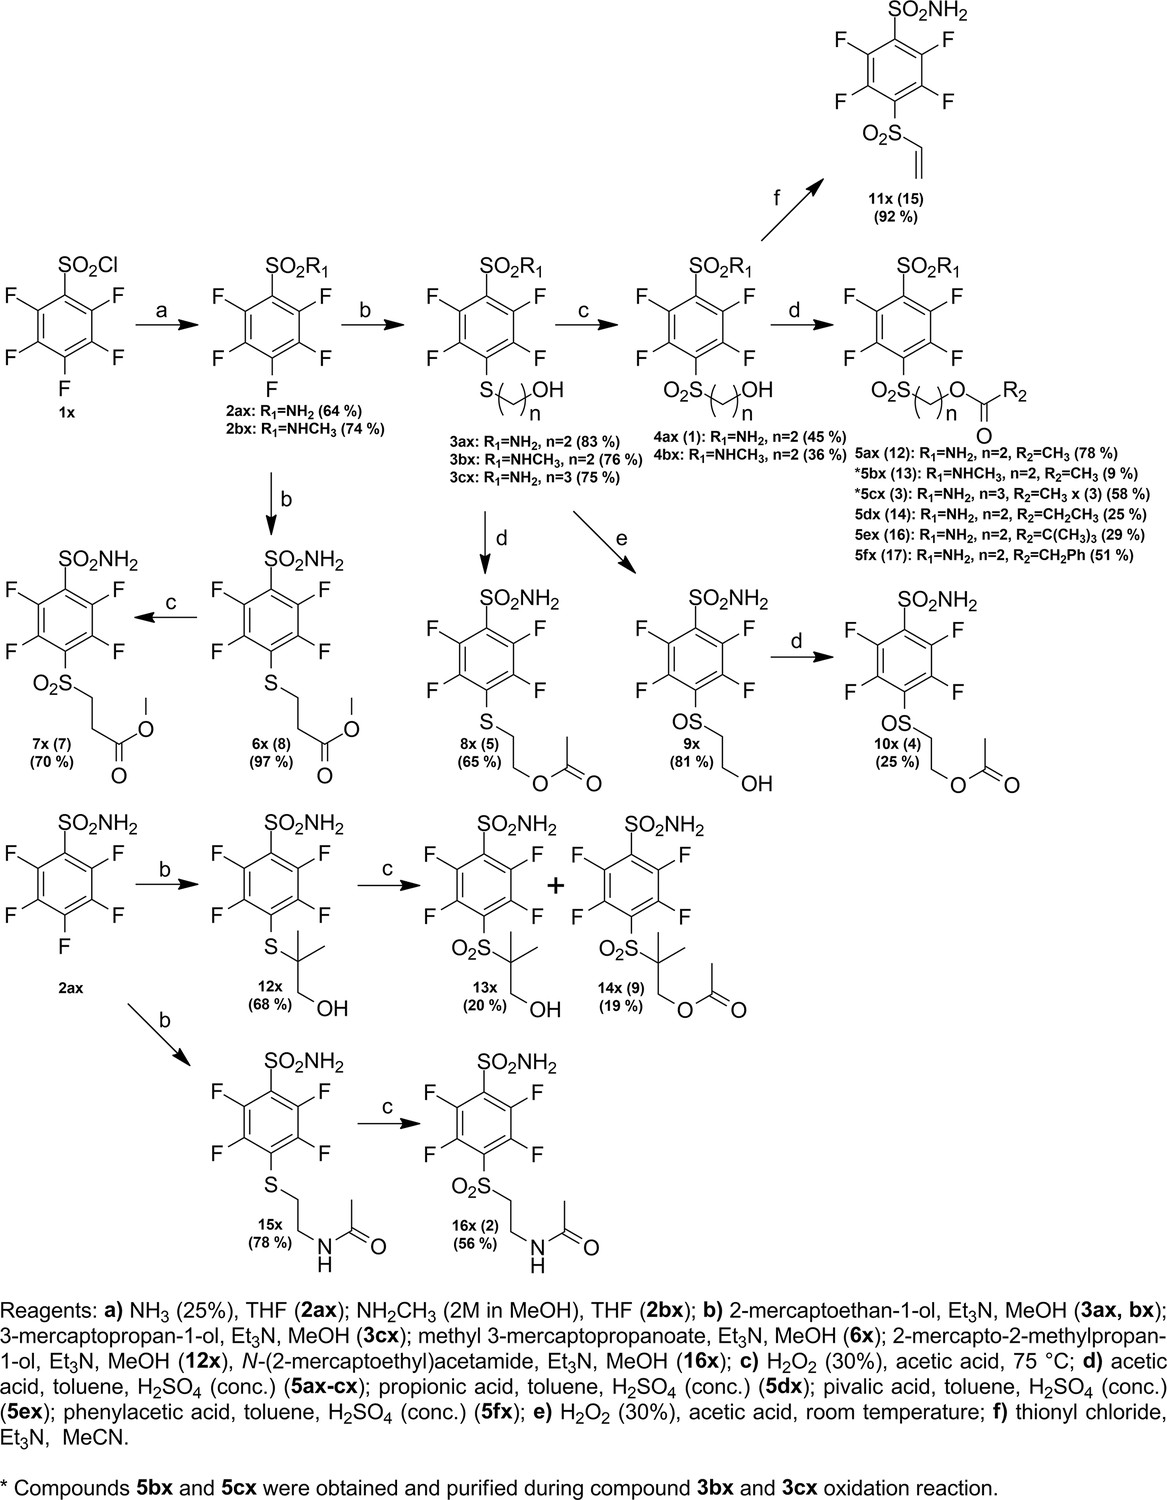
Synthesis paths of compounds 5ax-fx, 7x, 8x, 10x, 11x, 14x, and 16x.
Figure 10
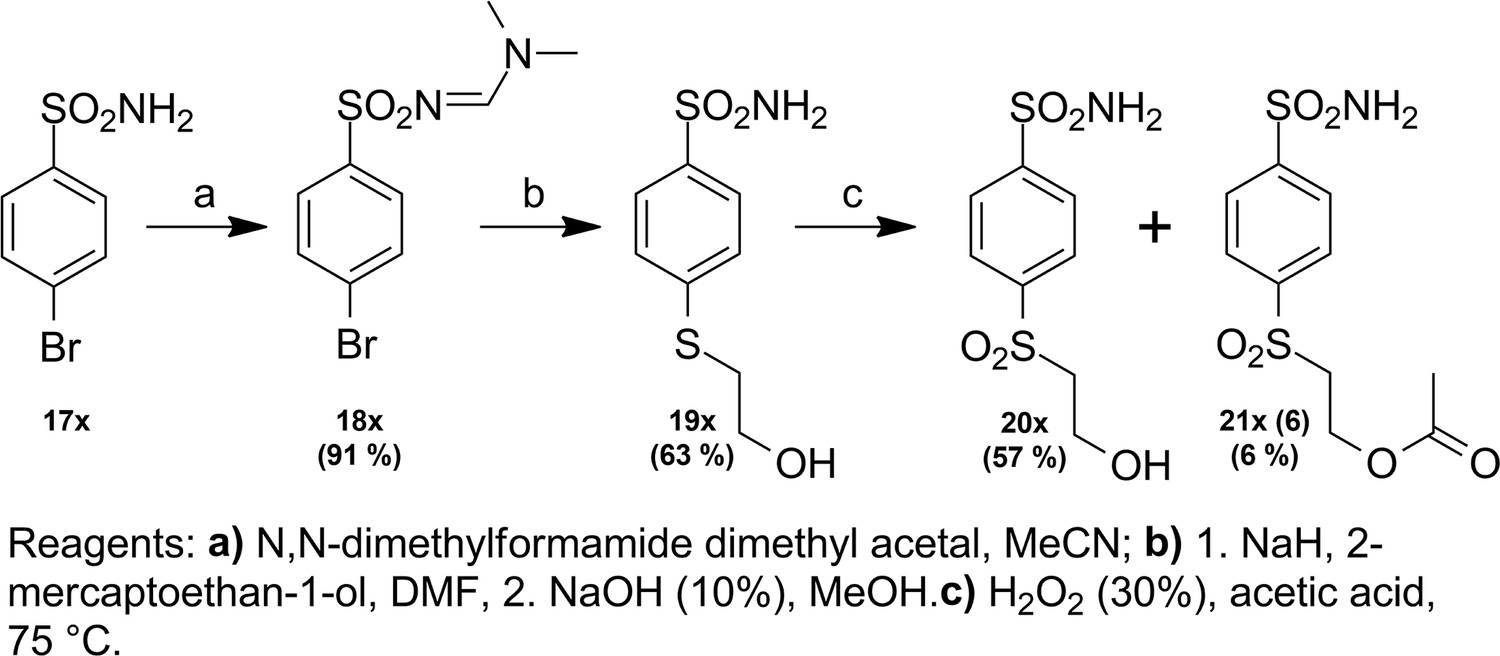
Synthesis path of compound 21x.
Figure 11
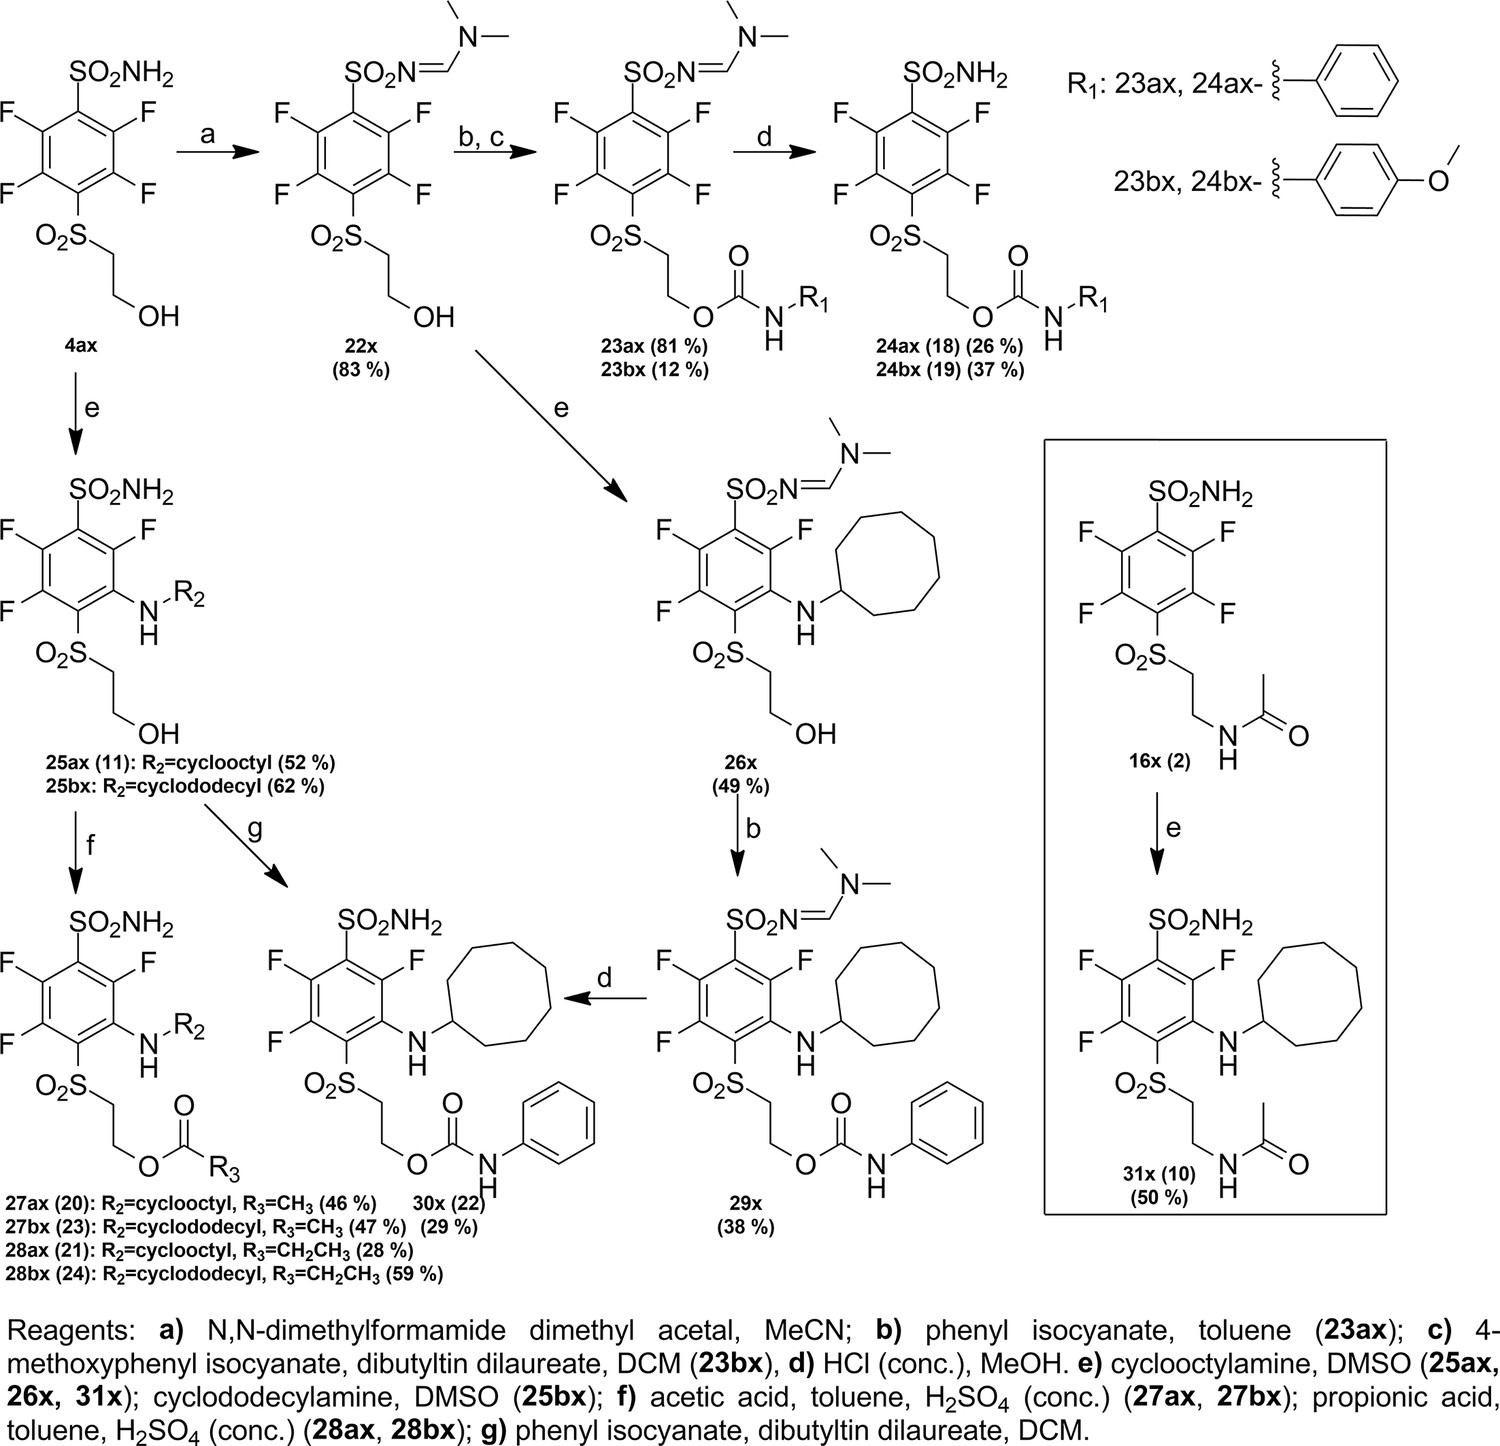
Synthesis paths of compounds 24 ax, 24bx, 27 ax, 27bx, 28 ax, 28bx, 30 x, and 31 x.
Tables
Table 1
X-ray crystal structure refinement statistics of CA II-20, CA I-21, and CA IX-23 complexes.
| Structure | CA II – 20 | CA I – 21 | CA IX – 23 |
|---|---|---|---|
| Space group | P21 | P 21 21 21 | H3 |
| Cell dimensions | |||
| a (Å) | 42.45 | 62.42 | 152.11 |
| b (Å) | 41.57 | 73.27 | 152.11 |
| c (Å) | 72.79 | 120.57 | 172.51 |
| β (o) | 104.4 | 90 | 90 |
| Resolution (Å) | 70.50–1.40 | 120.57–1.39 | 52.35–2.20 |
| Highest resolution shell (Å) | 1.40–1.47 | 1.39–1.41 | 2.20–2.25 |
| No. of reflections (unique) | 47352 | 110929 | 75528 |
| No. of reflections in the test set | 2410 | 10962 | 3874 |
| Completeness (%) | 96.9 (98.0*) | 98.3 (67.6*) | 100.0 (100.0*) |
| R merge | 0.14 (0.48*) | 0.06 (2.7*) | 0.07 (1.16*) |
| ⟨ I/σI ⟩ | 6.5 (3.0*) | 20.4 (0.5*) | 17.2 (1.9*) |
| Average multiplicity | 5.0 (5.0*) | 13.0 (4.7*) | 10.7 (11.0*) |
| R-factor | 0.18 (0.32*) | 0.21 (0.47*) | 0.17 (0.26*) |
| R free | 0.22 (0.34*) | 0.23 (0.48*) | 0.20 (0.32*) |
| Average B factor (Å2) | 11.0 | 26.6 | 52.4 |
| Average B factor for inhibitor (Å2) | 18.7 | 33.1 | 73.5 |
| ⟨B⟩ from Wilson plot (Å2) | 8.9 | 22.1 | 49.5 |
| No. of protein atoms | 2045 | 4032 | 7413 |
| No. of inhibitor atoms | 27 | 54 | 124 |
| No. of solvent molecules | 338 | 539 | 421 |
| RMS deviations from ideal values | |||
| Bond lengths (Å) | 0.02 | 0.01 | 0.01 |
| Bond angles (o) | 1.67 | 1.85 | 1.79 |
| Outliers in Ramachandran plot (%) | 0.39 | 0 | 0.21 |
| PDB code | 8OO8 | 8S4F | 9FLF |
-
*
Values in parenthesis are for the high-resolution bin.
Table 2
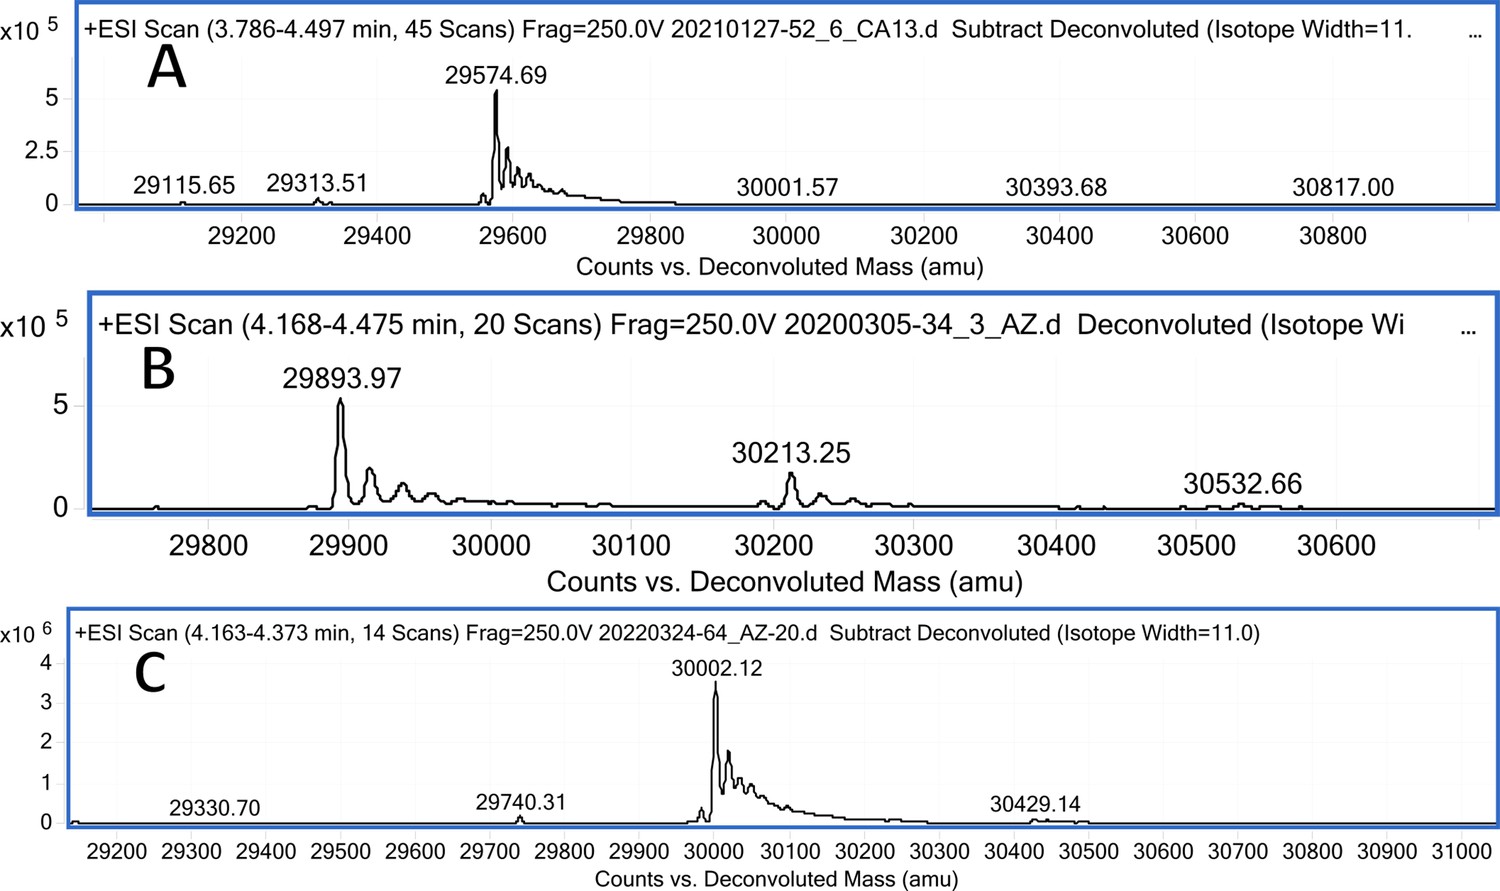
Carbonic anhydrase isozyme masses in the absence of compound and incubated with covalently-modifying compound 12.
All CA isozymes except CAIII were covalently modified by compound 12 to a variable extent.
| Enzyme | Plasmid number | Theoretical MW | Obtained mass | Protein mass with compound 12, most intense peak m/z | Difference |
|---|---|---|---|---|---|
| CA I | pL0067 | 31204.7 | 31074.31 (w/o Met) | 31393.63 | 319.32 |
| CA II | pL0059 | 29246 | 29115.54 (w/o Met) | 29434.81 | 319.27 |
| CA III | pL0066 | 31648.9 | 31518.29 (w/o Met), 31696.34 (w/o Met and glycosylated) | 31518.29 (w/o Met), 31696.34 | - |
| CA IV | pL0307 | 30454.6 | 30320.33 (w/o Met and S-S bridge) | 30639.53 | 319.20 |
| CA VA | pL0245 | 31285.3 | 31154.77 (w/o Met) | 31474.07 | 319.30 |
| CA VB | pL0173 | 34193.6 | 34063.56 (w/o Met) | 34382.29 | 318.73 |
| CA VI | pL0339 | 35367 | 35956.25 (glycosylated) 36208.06(glycosylated) 36412.74(glycosylated) 37643.18(glycosylated) 37934.87(glycosylated) | 36275.15 36528.43 36731.48 37962.27 38254.18 | 318.90 320.37 318.74 319.09 319.31 |
| CA VII | pL0137 | 31821.7 | 31689.57 (w/o Met) | 32008.73 32327.99 | 319.03 638.42 |
| CA IX | * | 28061.7 | 28060.32 | 28379.58 | 319.26 |
| CA XII | pL0119 | 29886.3 | 29754.54 (w/o Met) | 30072.81 | 318.27 |
| CA XIII | pL0058 | 29574.3 | 29574.69 | 29893.97 | 319.28 |
| CA XIV | pL0318 | 32129.7 | 31997.12 (w/o Met) 32175.25(w/o Met and glycosylated) | 32316.37 32494.53 | 319.25 319.28 |
-
*
CA IX mutant C174S, N346Q, prepared in yeast as described in Leitans et al., 2015.
Table 3
Affinities (apparent dissociation constants Kd,app) of covalent compound binding to cell-expressed CAIX determined by applying a competitive binding model to data in Figure 6 as previously described (Matulienė et al., 2022).
Parameters used in the competitive model were: the CAIX protein concentration was 5 nM (Pt = 5 nM), the dissociation constant of GZ19-32 was 150 pM (Kd_B = 150 pM), and the concentration of GZ19-32 was 10 nM (Lt_B = 10 nM).
| Compound | Kd,app_A, nM |
|---|---|
| 12 | 22 |
| 18 | 15 |
| 24 | 4.0 |
| 20 | 1.8 |
| 22 | 0.30 |
Table 4
The apparent dissociation constants Kd,app (in nM units) for compound interaction with human recombinant CA isozymes as determined by fluorescence-based thermal shift assay (FTSA) at pH 7.0 for 37 °C.
The values are logarithmic averages of several independent FTSA experiments.
| Compound | Kd,app, nM | ||||||||||||
|---|---|---|---|---|---|---|---|---|---|---|---|---|---|
| CAI | CAII | CAIII | CAIV | CAVA | CAVB | CAVI | CAVII | CAIX | CAXII | CAXIII | CAXIV | ||
| Non-covalent | |||||||||||||
| 1 | VD10-35 | 0.2 | 20 | 20,000 | 500 | 300 | 20 | 70 | 7 | 40 | 300 | 30 | 30 |
| 2 | JA16-9-26 | 0.7 | 50 | 60,000 | 2000 | 600 | 5 | 400 | 20 | 5 | 500 | 100 | 20 |
| 3 | AV19-64-1 | 0.6 | 20 | 20,000 | 700 | 200 | 2 | 200 | 1 | 50 | 600 | 2 | 8 |
| 4 | AV21-05 | 1 | 10 | ≥200,000 | 700 | 70 | 8 | 300 | 3 | 20 | 200 | 10 | 10 |
| 5 | AV19-36 | 0.2 | 10 | 50,000 | 700 | 200 | 20 | 700 | 5 | 20 | 200 | 4 | 4 |
| 6 | AV20-08 | 60 | 70 | 2000 | 20 | 10 | 3000 | 1000 | 40 | 20 | 700 | 800 | 40 |
| 7 | AV19-56 | 0.3 | 20 | 20,000 | 400 | 300 | 20 | 200 | 20 | 20 | 100 | 20 | 9 |
| 8 | AV17-06 | 0.2 | 10 | 40,000 | 800 | 300 | 8 | 300 | 3 | 10 | 200 | 2 | 5 |
| 9 | AV23-30-1 | 0.03 | 2 | 7000 | 100 | nd | nd | 1000 | nd | 3 | 40 | 3 | 5 |
| 10 | AV17-30 | 4000 | 100 | ≥200,000 | 100 | 4000 | 20 | 400 | 30 | 0.1 | 10 | 20 | 40 |
| 11 | VD11-4-2 | 800 | 60 | 30,000 | 60 | 3000 | 20 | 70 | 9 | 0.03 | 3 | 4 | 4 |
| Covalent | |||||||||||||
| 12 | VD10-35-2 | 0.003 | 0.2 | 30,000 | 10 | 2 | 100 | 0.1 | 0.007 | 0.03 | 0.03 | 0.01 | 0.007 |
| 13 | VD18-02 | 50,000 | 300,000 | ≥1,000,000 | ≥1,000,000 | ≥1,000,000 | ≥1,000,000 | ≥1,000,000 | ≥1,000,000 | 300,000 | 300,000 | ≥1,000,000 | 30,000 |
| 14 | AV21-03 | 0.003 | 0.07 | 40,000 | 2 | 3 | 0.01 | 0.05 | 0.002 | 0.02 | 0.02 | 0.003 | 0.1 |
| 15 | AV22-48 | 0.007 | 0.3 | 30,000 | 10 | 1 | 0.01 | 0.3 | 0.006 | 0.07 | 0.03 | 0.06 | 0.06 |
| 16 | AV22-162 | 0.008 | 0.4 | 20,000 | 60 | nd | nd | 0.3 | 0.8 | 0.09 | 0.3 | 0.05 | 1 |
| 17 | AV21-25 | 0.002 | 0.1 | 20,000 | 50 | 3 | 0.02 | 0.4 | 0.8 | 0.04 | 0.07 | 0.01 | 0.3 |
| 18 | AV22-138 | 0.008 | 0.4 | 4000 | 20 | 1 | 0.005 | 0.1 | 0.4 | 0.04 | 0.1 | 0.02 | 0.4 |
| 19 | AV23-04 | 0.003 | 0.3 | nd | 20 | nd | nd | 0.06 | 0.4 | 0.04 | 0.06 | 0.02 | 0.5 |
| 20 | AV19-37 | 0.05* | 0.8 | ≥200,000 | 1 | 500 | 4 | 10 | 0.04 | 0.004 | 0.02 | 0.02 | 0.2 |
| 21 | AV21-08 | 0.005* | 0.7 | ≥200,000 | 2 | 1000 | 0.02 | 3 | 0.2 | 0.002 | 0.01 | 0.005 | 0.3 |
| 22 | AV22-149 | 0.01* | 1 | 100,000 | 2 | nd | 0.1 | 40 | 80 | 0.008 | 0.01 | 0.02 | 2 |
| 23 | AV21-47 | 10* or 0.02 | 1 | ≥200,000 | 0.2 | 5000 | 0.3 | 30 | nd | 0.003 | 0.1 | 0.02 | 0.5 |
| 24 | AV22-132 | 20* or 0.02 | 2 | ≥200,000 | 4 | 3000 | 0.2 | 2000 | nd | 0.009 | 0.2 | 0.01 | 0.9 |
-
*
2 different fluorescence shifts were observed of which the dominating one was used for kd,app determination.
Additional files
Download links
A two-part list of links to download the article, or parts of the article, in various formats.
Downloads (link to download the article as PDF)
Open citations (links to open the citations from this article in various online reference manager services)
Cite this article (links to download the citations from this article in formats compatible with various reference manager tools)
Targeted anticancer pre-vinylsulfone covalent inhibitors of carbonic anhydrase IX
eLife 13:RP101401.
https://doi.org/10.7554/eLife.101401.3


