The membrane domains of mammalian adenylyl cyclases are lipid receptors
- Pharmazeutisches Institut der Universität Tübingen, Germany
- Max-Planck-Institut für Biologie, Germany
Figures
Figure 1 with 6 supplements
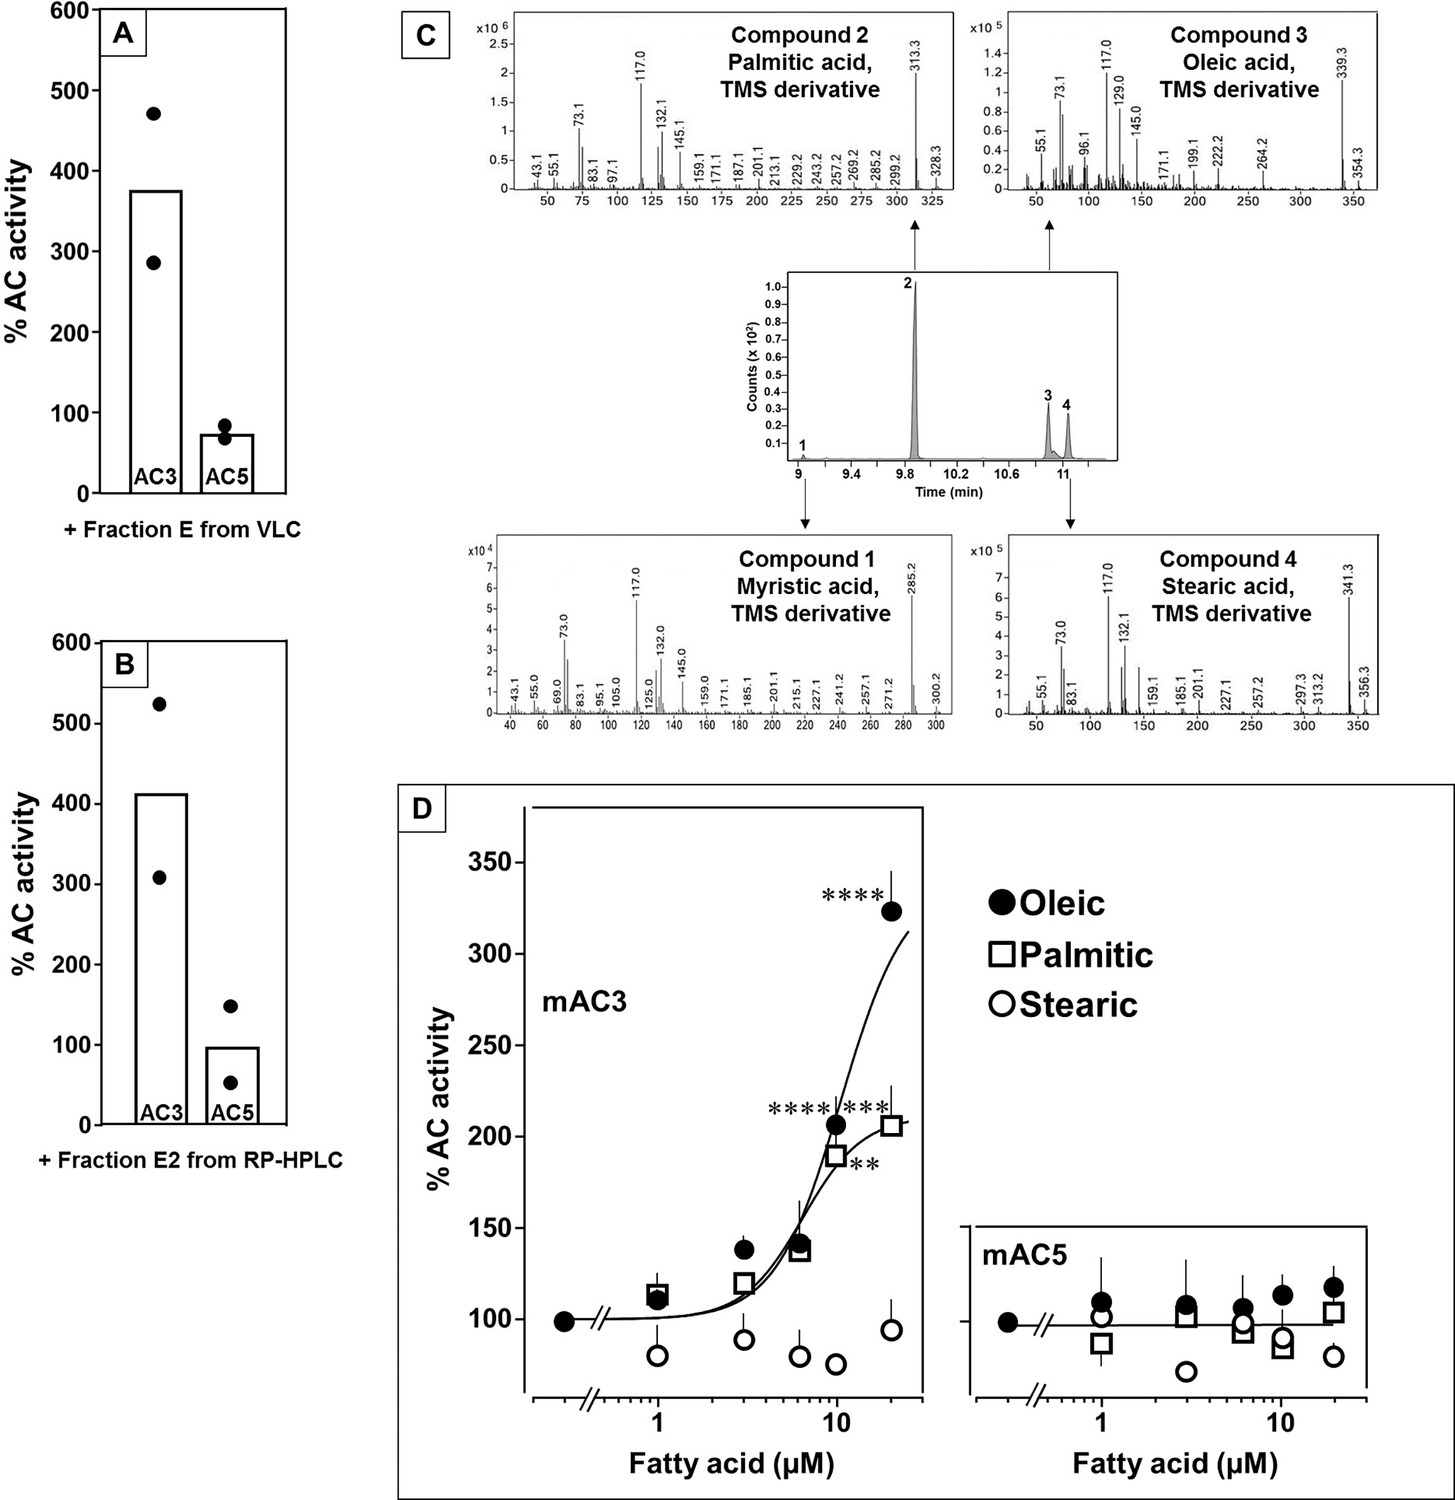
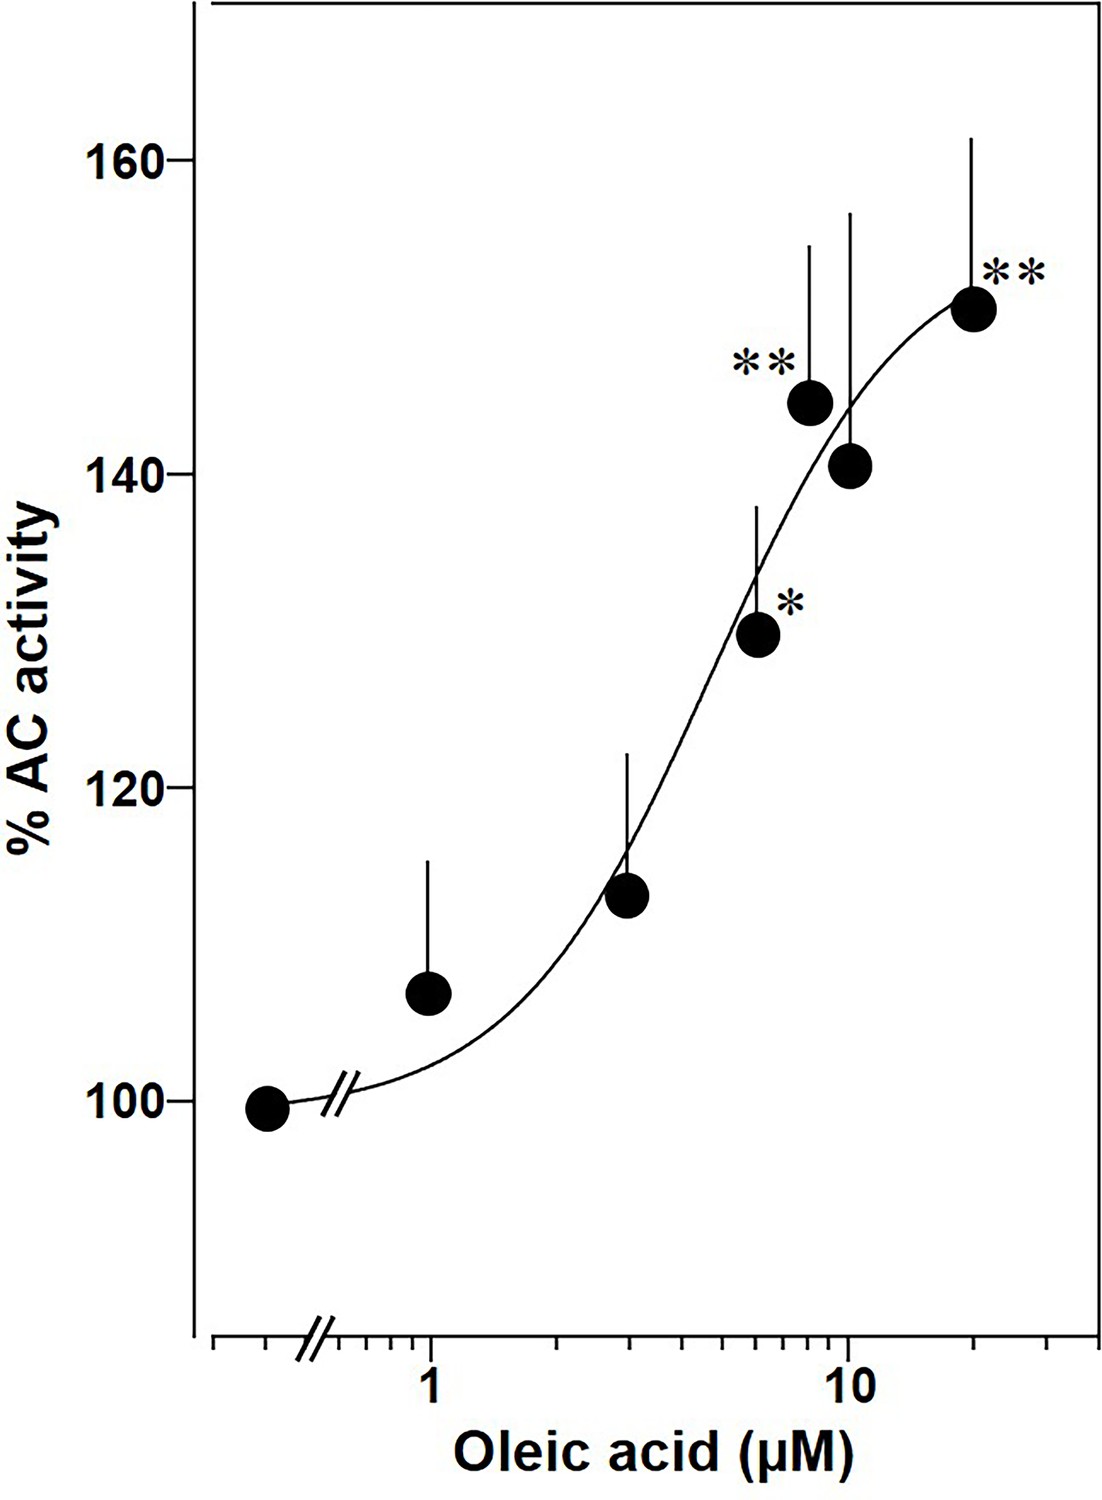
Identification of mAC3 activating fatty acids.
Effect of 1 µg/assay of fractions E from vacuum liquid chromatography (A) and E2 from reversed-phase high-performance liquid chromatography (RP-HPLC) (B) on 300 nM Gsα-stimulated mAC isoforms 3 and 5. Activities are shown as % compared to 300 nM Gsα stimulation (100%). n = 2, each with two technical replicates. Basal and Gsα activities of mAC3 in (A) were 0.01 and 0.07 and of mAC5 0.06 and 1.32 nmol cAMP•mg−1•min−1, respectively. In (B), basal and Gsα activities of mAC3 were 0.02 and 0.12 and of mAC5 0.09 and 1.1 nmol cAMP•mg−1•min−1, respectively. (C) Gas chromatography–mass spectrometry (GC–MS) chromatogram of fraction E2. Mass spectra of the fatty acids are shown. Fatty acids’ identity was confirmed by comparing with corresponding standards (TMS: Trimethylsilyl). (D) Effect of fatty acids identified by GC–MS on 300 nM Gsα-stimulated mAC3 (left) and mAC5 (right). Basal and Gsα activities of mAC3 were 0.023 ± 0.02 and 0.17 ± 0.03 and of mAC5 0.08 ± 0.02 and 0.44 ± 0.09 nmol cAMP•mg−1•min−1, respectively. n = 3–23. EC50 of palmitic and oleic acids for mAC3 were 6.4 and 10.4 μM, respectively. Data represent individual experiments (black dots in A and B) or mean ± SEM (D). One-sample t tests were performed. Significances: **p < 0.01; ***p < 0.001; ****p < 0.0001.
-
Figure 1—source data 1
Including data used for generating Figure 1A, B, D.
- https://cdn.elifesciences.org/articles/101483/elife-101483-fig1-data1-v1.xlsx
Figure 1—figure supplement 1
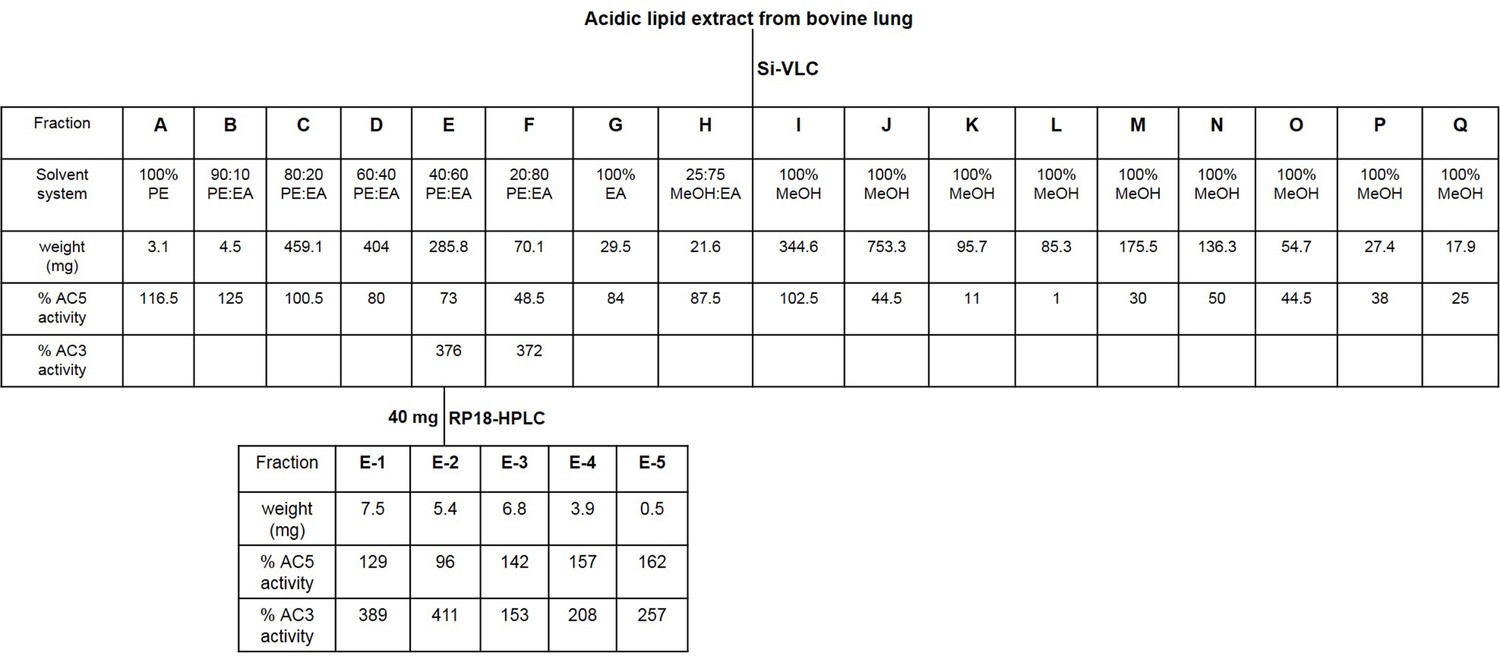
Si-VLC: silica-vacuum liquid chromatography, RP-HPLC: reversed-phase high-performance liquid chromatography, EA: ethyl acetate, PE: petroleum ether, MeOH: methanol.
% AC3 and AC5 activities compared to 300 nM Gsα stimulation = 100%; values are means of two experiments carried out in triplicates. Fractions were tested at 1 µg/10 μl assay. Basal AC5 and 300 nM Gsα activities were 0.05 nmol and 2.1 and for mAC3 0.02 and 0.15 nmol cAMP•mg−1•min−1, respectively.
Figure 1—figure supplement 2

Reversed-phase high-performance liquid chromatography (RP-HPLC) chromatogram of fraction E.
UV absorbance at 210 nm.
Figure 1—figure supplement 3
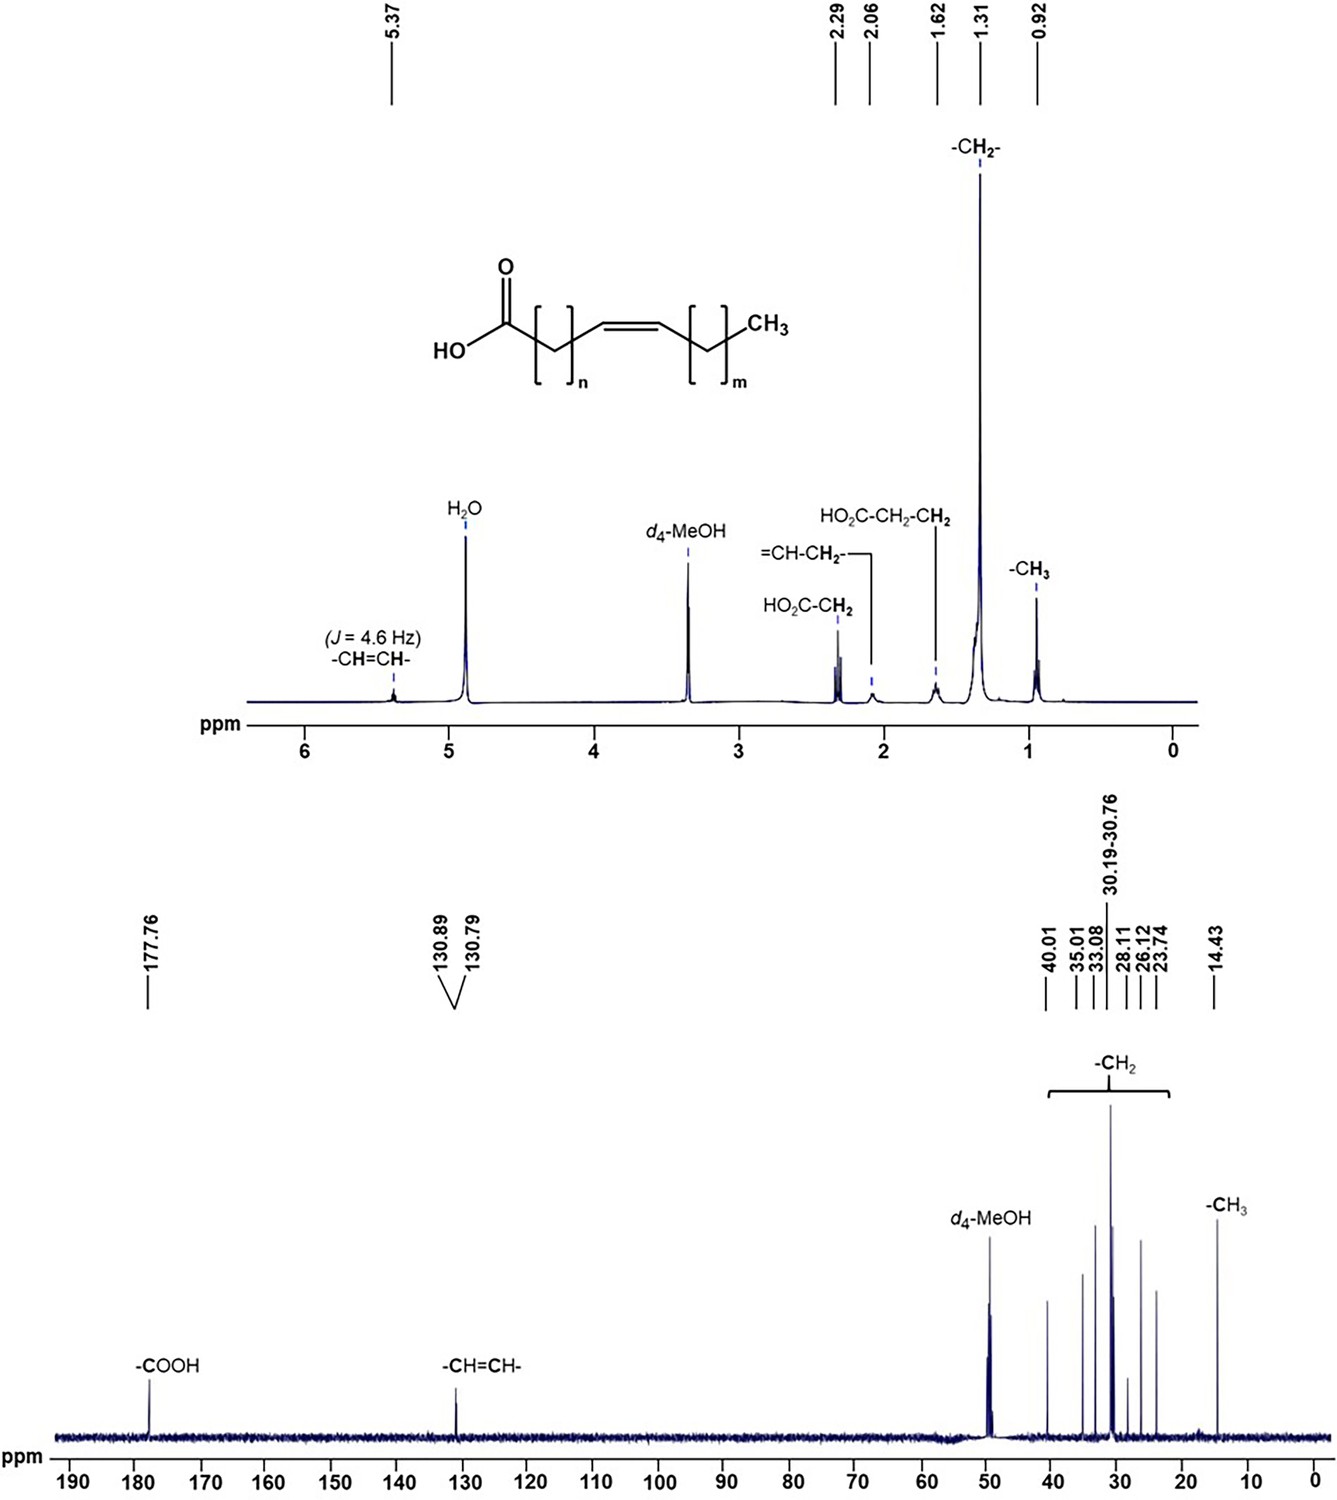
NMR spectra of fraction E2 in d4-MeOH.
(Top panel) 1H-NMR spectrum. (Bottom panel) 13C-NMR spectrum.
Figure 1—figure supplement 4

Time-dependent stimulation of mAC3 by oleic acid.
mAC3 was incubated with 300 nM Gsα ± 20 µM oleic acid at 37°C for the time depicted. Data represent the mean of two independent experiments performed in duplicates. Correlation coefficients were 0.9733 and 0.9864 minus and plus added oleic acid, respectively.
-
Figure 1—figure supplement 4—source data 1
Including data used for generating Figure 1—figure supplement 4.
- https://cdn.elifesciences.org/articles/101483/elife-101483-fig1-figsupp4-data1-v1.xlsx
Figure 1—figure supplement 5

Hanes–Woolf plot of mAC3 ± 20 µM oleic acid.
The assay at 37°C, 15 min. Km of ATP was 335 and 221 μM ± oleic acid, respectively (not significant). Vmax ± oleic acid was 0.62 and 1.23 nmol cAMP•mg−1•min−1, respectively. Lineweaver–Burk and Eddie–Hofstee plots yielded identical data.
-
Figure 1—figure supplement 5—source data 1
Including data used for generating Figure 1—figure supplement 5.
- https://cdn.elifesciences.org/articles/101483/elife-101483-fig1-figsupp5-data1-v1.xlsx
Figure 1—figure supplement 6

Oleic acid has no stimulatory effect on the soluble catalytic dimer.
Basal and 300 nM Gsα activities of the mAC1-C1/mAC2-C2 were 0.02 ± 0.003 and 0.08 ± 0.02 nmol cAMP•mg−1•min−1, respectively. Error bars within the symbol size (n = 3).
-
Figure 1—figure supplement 6—source data 1
Including data used for generating Figure 1—figure supplement 6.
- https://cdn.elifesciences.org/articles/101483/elife-101483-fig1-figsupp6-data1-v1.xlsx
Figure 2
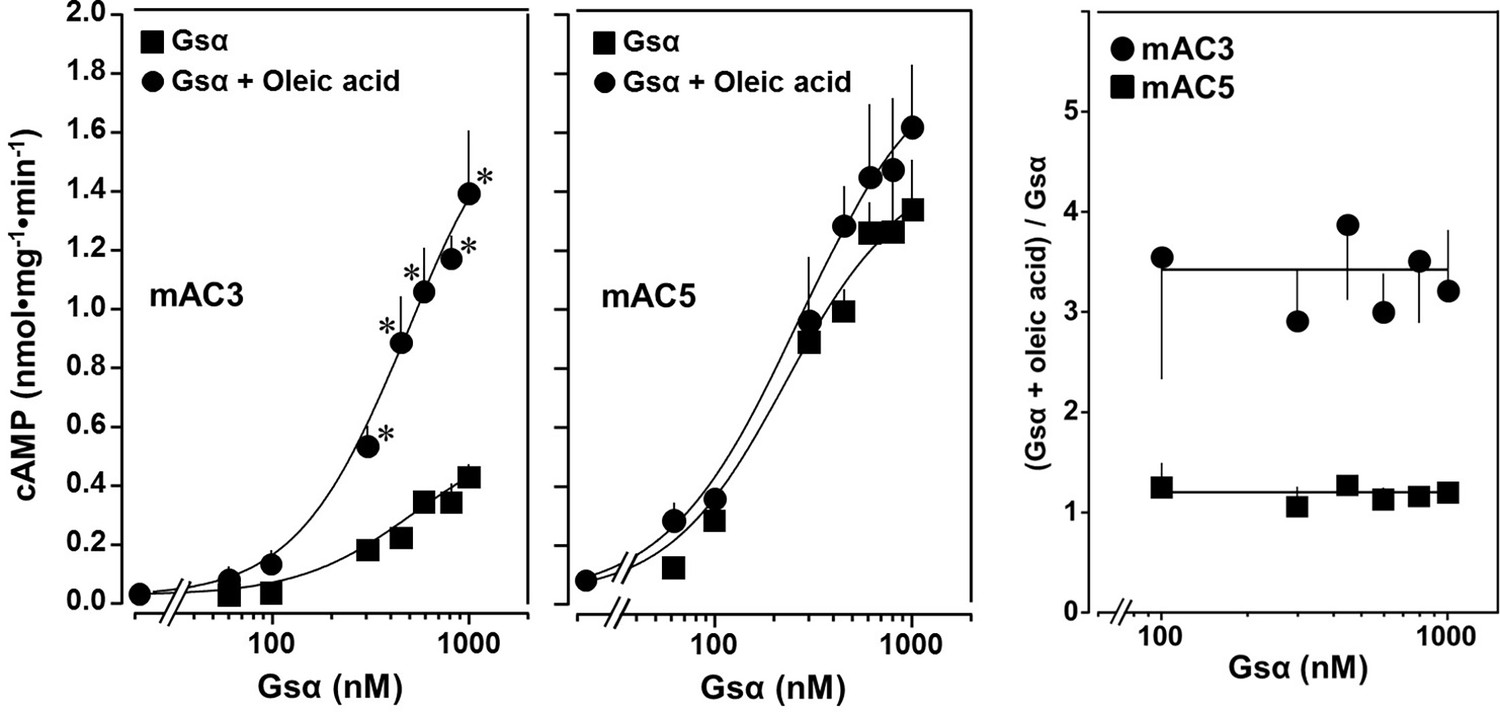
Concentration–response curves for Gsα and mAC3 and five activities in presence or absence of 20 µM oleic acid.
20 µM oleic acid enhances Gsα stimulation of mAC3 (left) but not of mAC5 (center). (Left) EC50 of Gsα in the absence of oleic acid was 549 nM and in the presence of 20 µM oleic acid, it was 471 nM (not significant). mAC3 basal activity was 30 ± 24 pmol cAMP•mg−1•min−1. n = 3, each with two technical replicates. (Center) The EC50 of Gsα in the absence of oleic acid was 245 nM and in the presence of oleic acid, it was 277 nM (not significant). mAC5 basal activity was 84 ± 60 cAMP•mg−1•min−1. n = 2, each with two technical replicates. (Right) (Gsα + oleic acid stimulation)/(Gsα stimulation) ratio of mAC3 and mAC5 from left and center (n = 2–3). Data are mean ± SEM, paired t test for left and center, and one-way ANOVA for right. Significances: *p < 0.05.
-
Figure 2—source data 1
Including data used for generating Figure 2, left, center, and right.
- https://cdn.elifesciences.org/articles/101483/elife-101483-fig2-data1-v1.xlsx
Figure 3 with 1 supplement
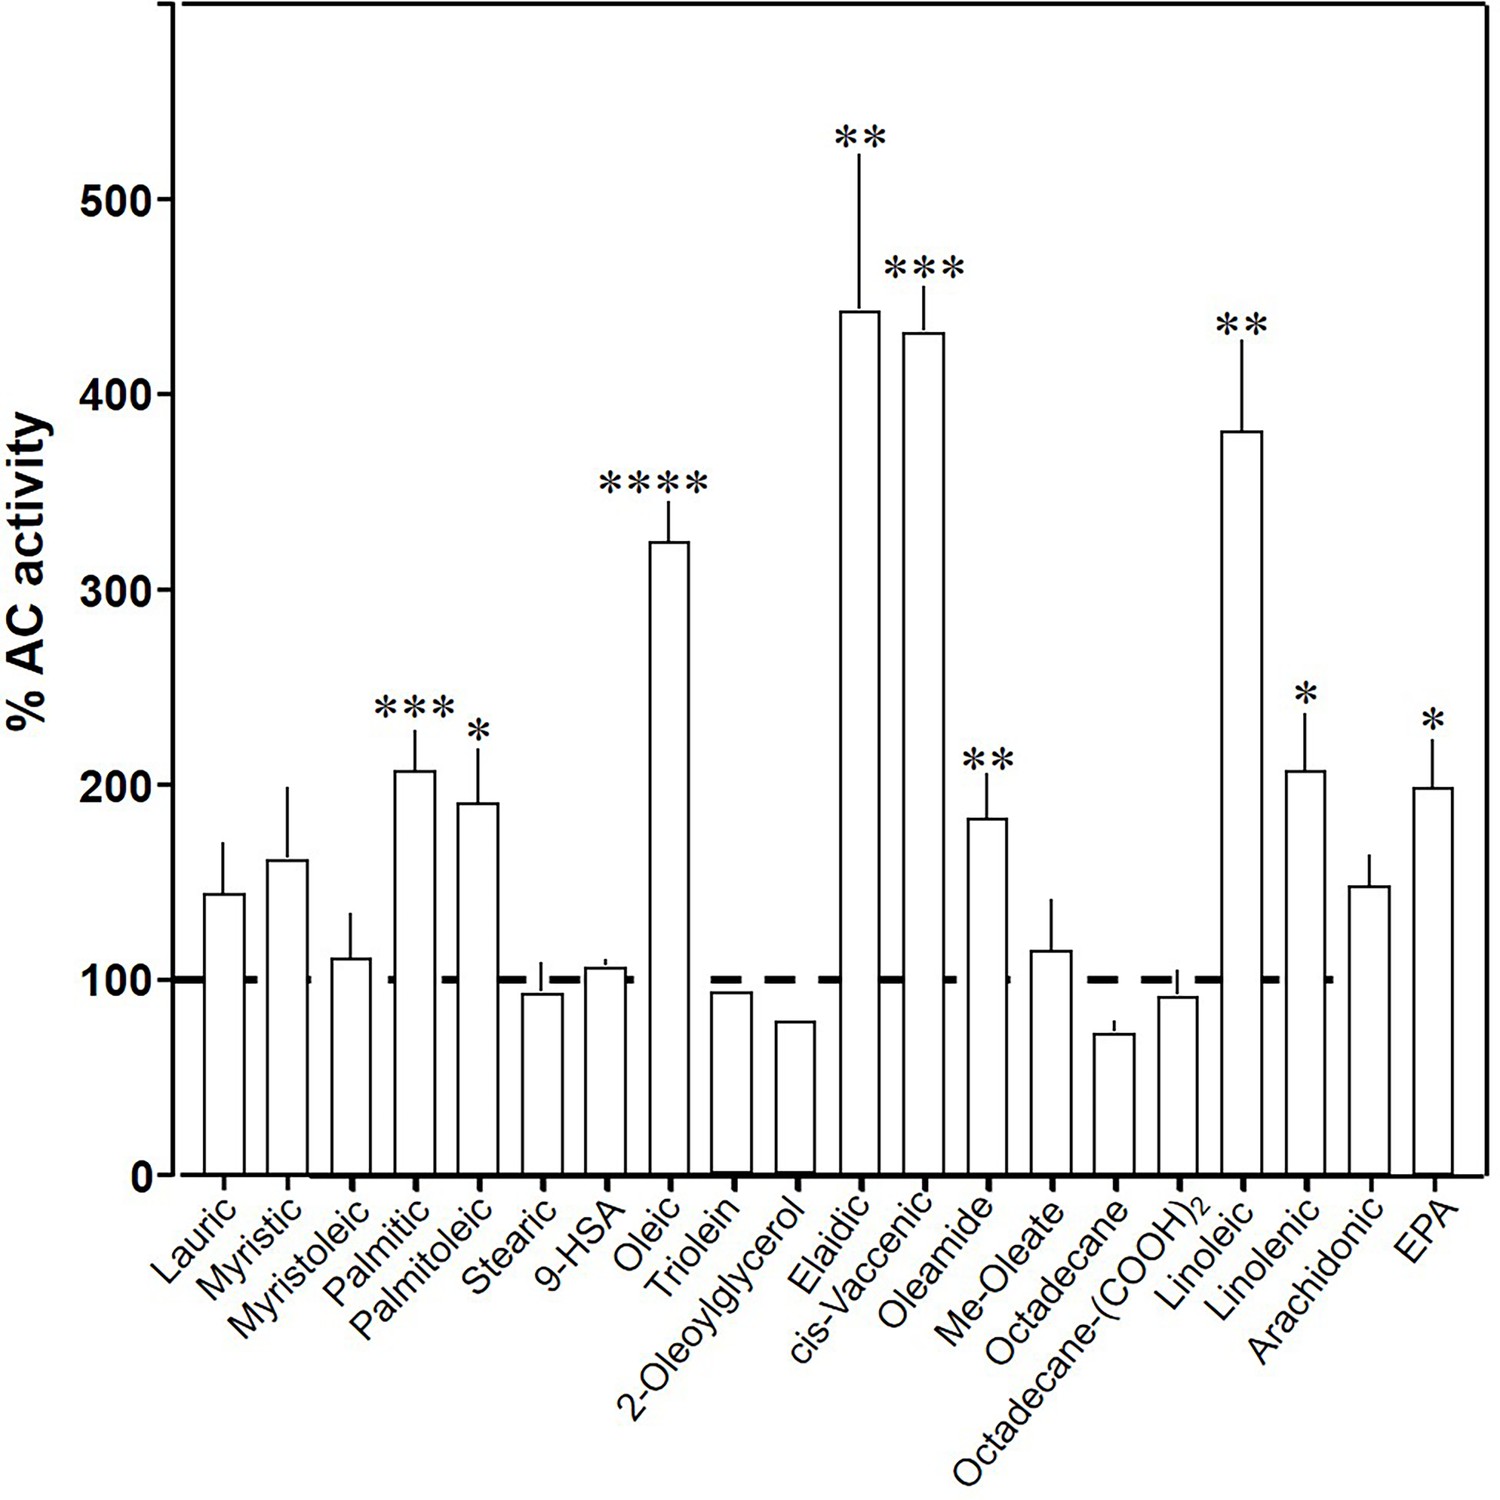
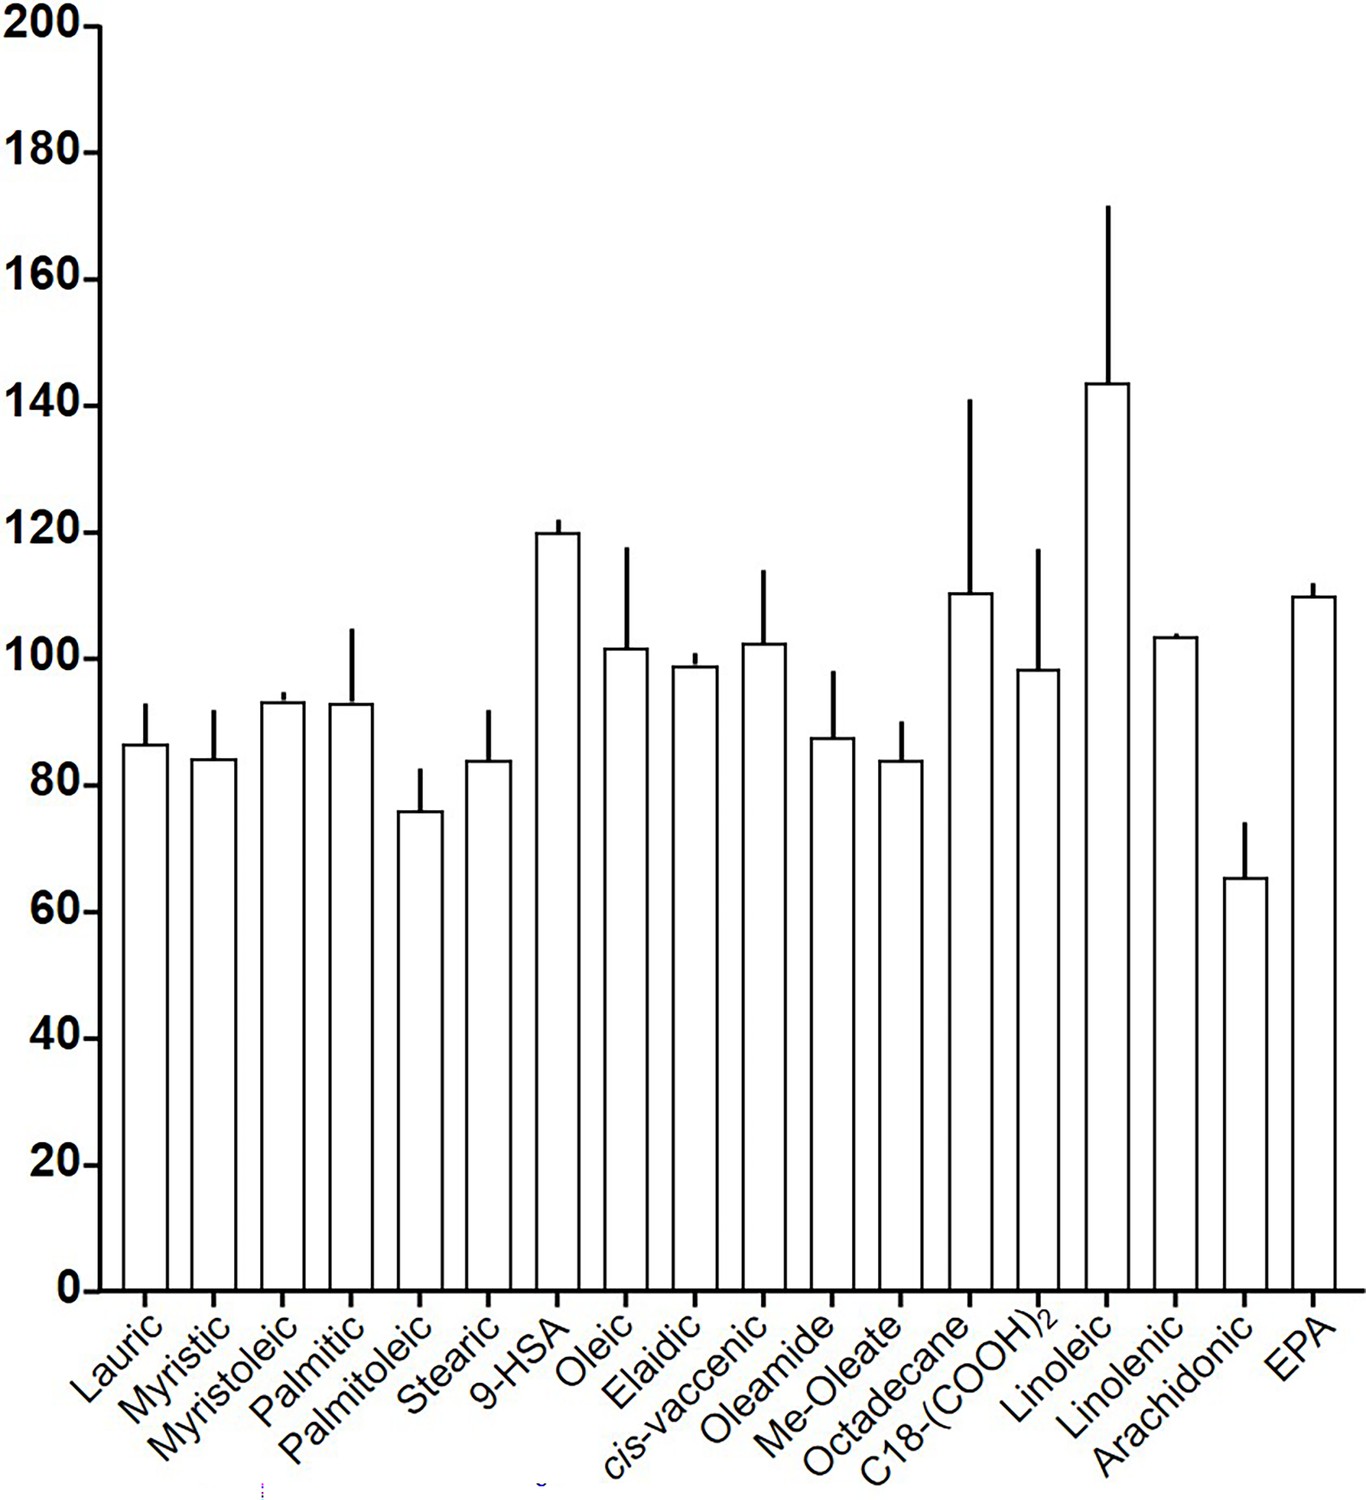
Effect of 20 µM lipids on 300 nM Gsα-stimulated mAC3.
Basal and Gsα-stimulated activities were 0.02 ± 0.001 and 0.17 ± 0.01 nmol cAMP•mg−1•min−1, respectively. EPA: eicosapentaenoic acid; 9-HSA: 9-hydroxystearic acid. Data are mean ± SEM, n = 2–23. One-sample t tests, Significances: *p < 0.05; **p < 0.01; ***p < 0.001; ****p < 0.0001.
-
Figure 3—source data 1
Including data used for generating Figure 3.
- https://cdn.elifesciences.org/articles/101483/elife-101483-fig3-data1-v1.xlsx
Figure 3—figure supplement 1

Structures of the tested aliphatic lipids listed in Table 1.
Figure 4 with 2 supplements
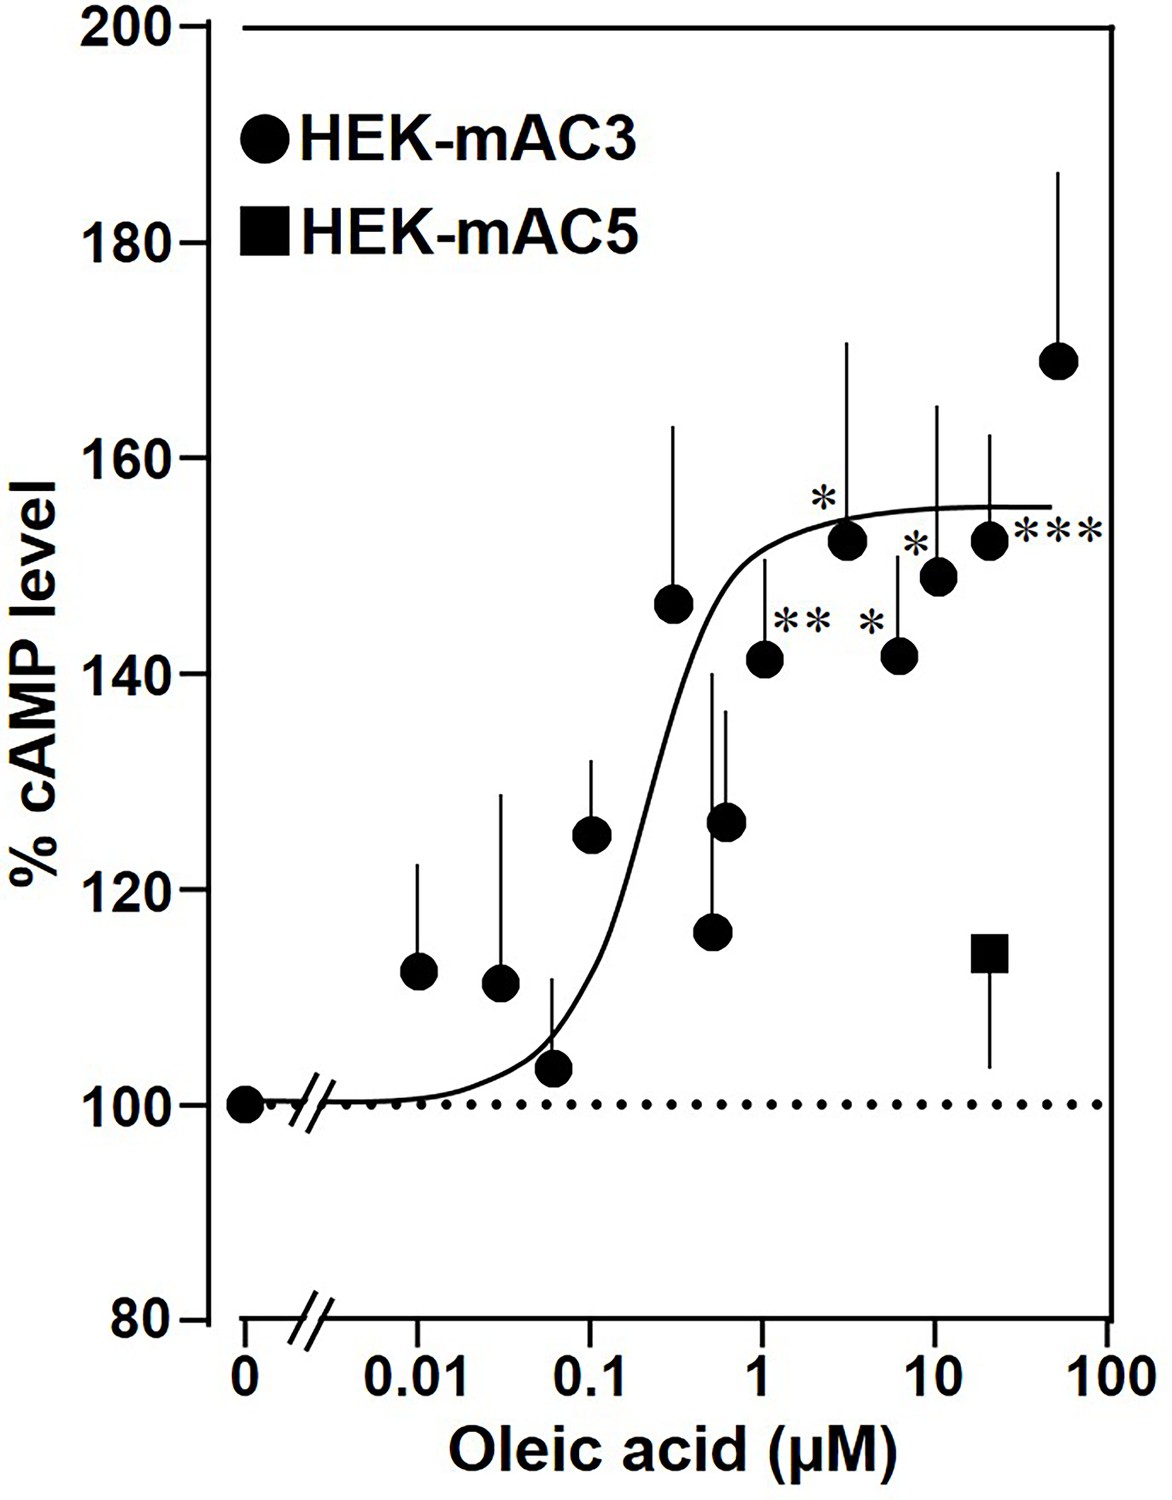
Oleic acid enhances cAMP formation in mAC3-transfected HEK293 cells.
Effect of oleic acid on HEK293 cells permanently transfected with mACs 3 and 5 stimulated by 2.5 µM isoproterenol (set as 100%). Basal and isoproterenol-stimulated cAMP levels of HEK-mAC3 were 0.02 ± 0.006 and 1.35 ± 0.24 and of HEK-mAC5 2.13 ± 0.69 and 2.60 ± 0.88 pmol cAMP/10,000 cells, respectively. n = 3–9, carried out in technical triplicates. Data are mean ± SEM. One-sample t tests. Significances: *p < 0.05; **p < 0.01; ***p < 0.001.
-
Figure 4—source data 1
Including data used for generating Figure 4.
- https://cdn.elifesciences.org/articles/101483/elife-101483-fig4-data1-v1.xlsx
Figure 4—figure supplement 1

Effect of isoproterenol on cAMP formation in HEK293 cells transfected with mAC3.
Basal activity was 0.04 ± 0.01 pmol cAMP/10,000. Where applicable, error bars indicate SEM (experiments carried out in triplicates; n = 1–3). Calculated EC50 = 1.4 µM. Isoproterenol concentrations used in HEK293 cell experiments with lipid ligands are based on this data.
-
Figure 4—figure supplement 1—source data 1
Including data used for generating Figure 4—figure supplement 1.
- https://cdn.elifesciences.org/articles/101483/elife-101483-fig4-figsupp1-data1-v1.xlsx
Figure 4—figure supplement 2
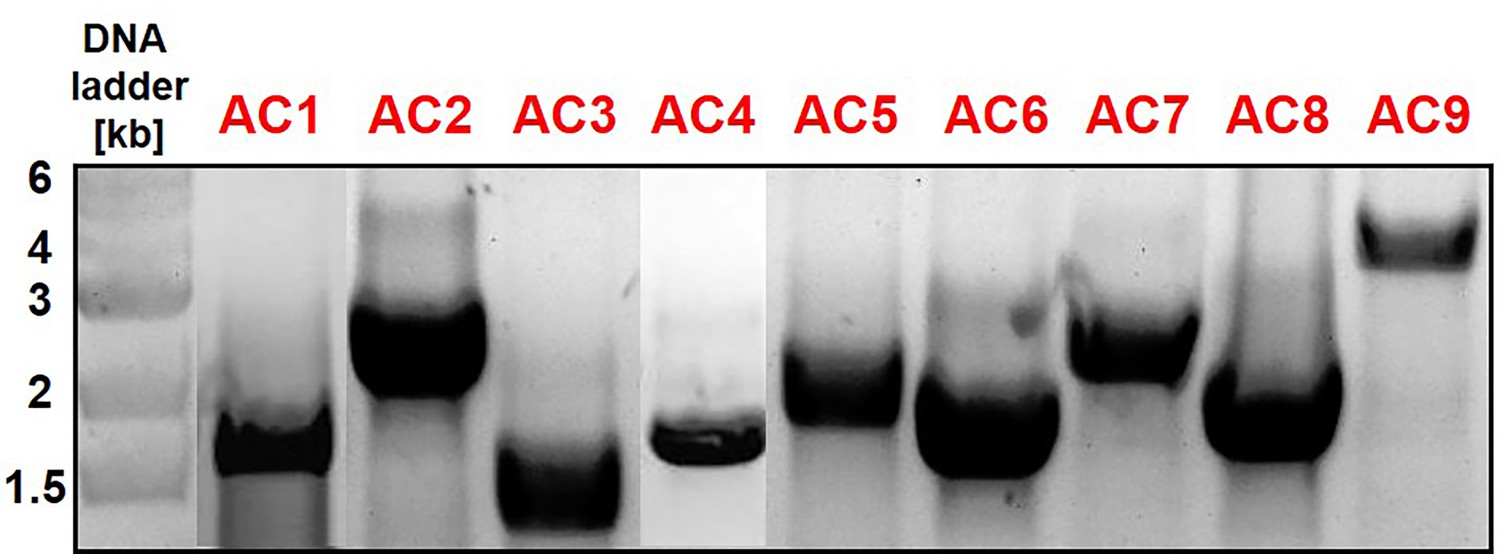
Agarose gels of PCR products from HEK293 cells permanently transfected with mAC1–9.
Expected amplicon lengths were 1667, 2266, 1296, 1642, 1864, 1624, 2270, 1730, and 3614 bp for mAC isoforms 1–9, respectively. As controls, the primers pairs for each isoform were tested with DNA isolated from all other eight cell lines, resulting in no bands (not shown). Furthermore, the untransfected HEK293 cells were tested with the primers specific for each isoform, resulting in no bands (not shown; the primer pairs are listed in the experimental section).
-
Figure 4—figure supplement 2—source data 1
PDF file containing original gels for Figure 4—figure supplement 2, indicating the relevant bands.
- https://cdn.elifesciences.org/articles/101483/elife-101483-fig4-figsupp2-data1-v1.zip
-
Figure 4—figure supplement 2—source data 2
Original files containing gels for Figure 4—figure supplement 2.
- https://cdn.elifesciences.org/articles/101483/elife-101483-fig4-figsupp2-data2-v1.zip
Figure 5 with 4 supplements
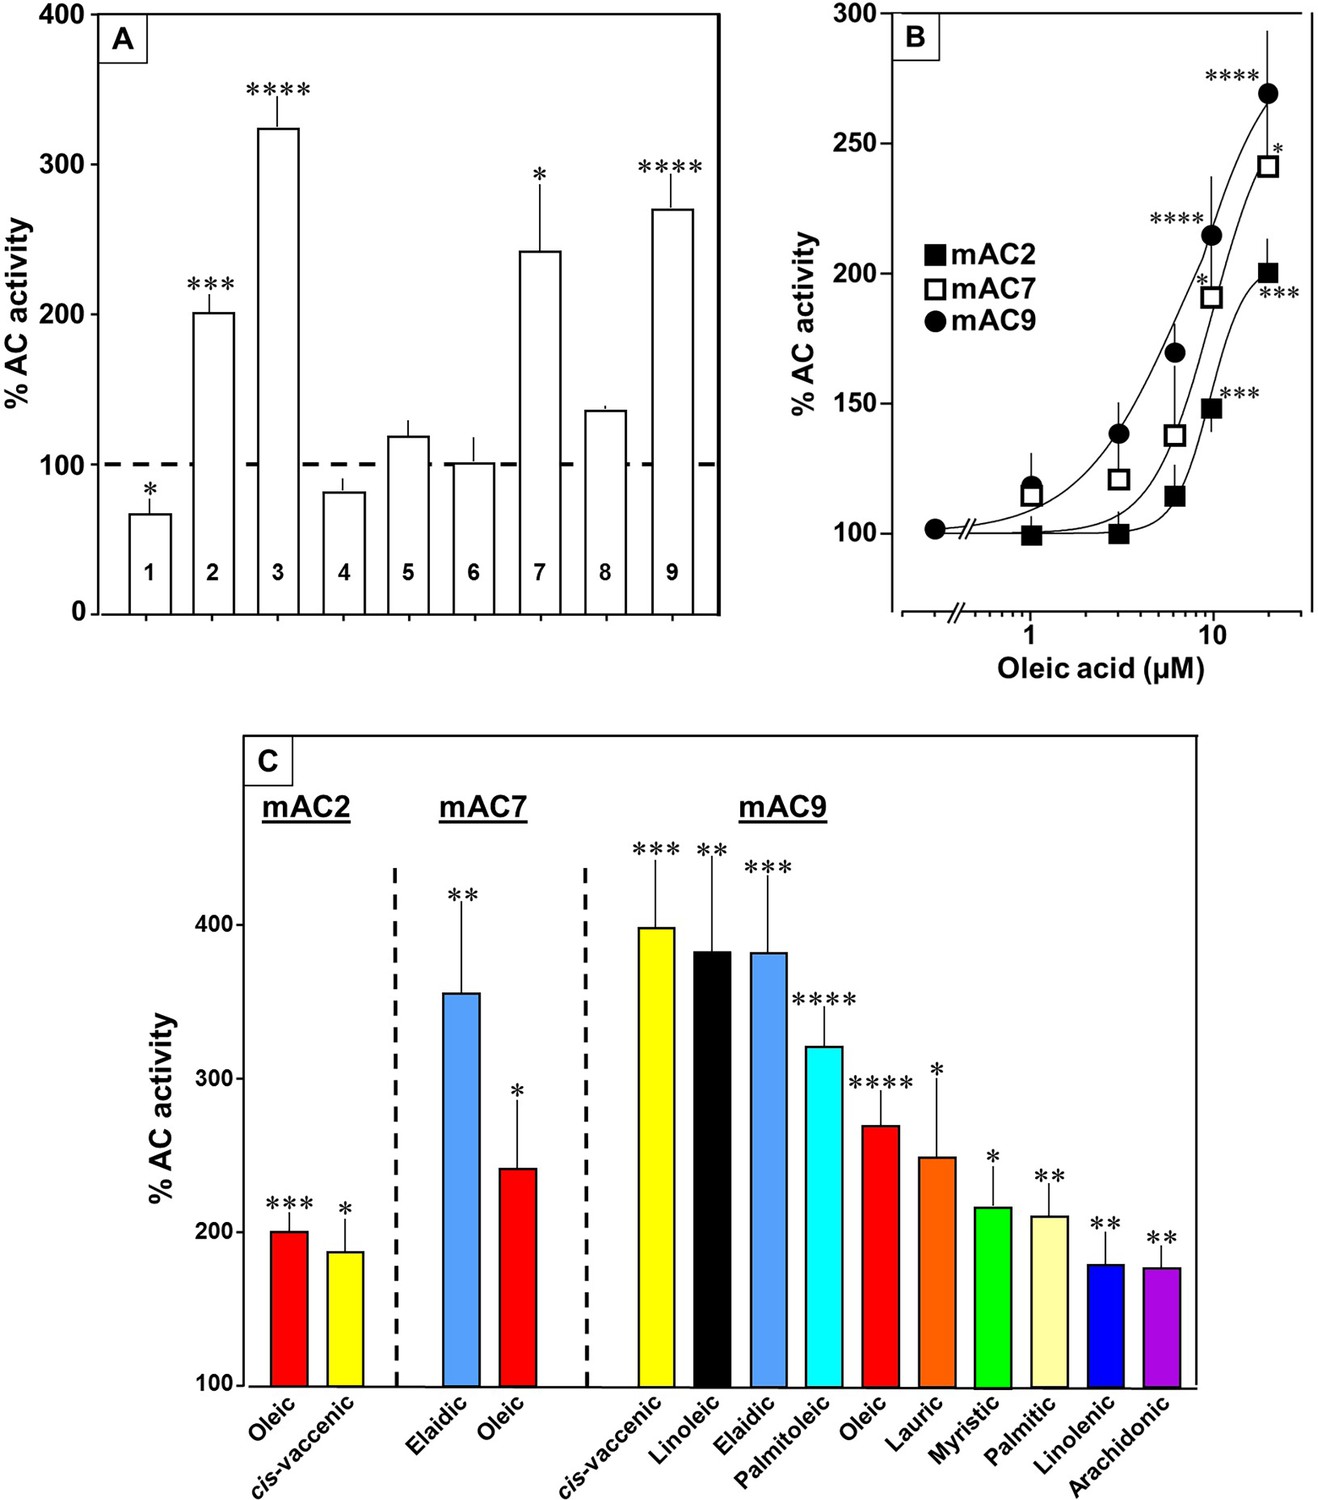
Fatty acids enhance mAC isoforms 2, 7, and 9 activities.
(A) Effect of 20 µM oleic acid on 300 nM Gsα-stimulated mAC activities normalized to 100%. Basal and Gsα-stimulated activities for each isoform are in Figure 5—figure supplement 1. n = 2–23. (B) Oleic acid activates mACs 2, 7, and 9 stimulated by 300 nM Gsα. n = 7–23. (C) Fatty acids activating mACs 2, 7, and 9 at 20 µM. For basal and Gsα-stimulated activities, see Figure 5—figure supplements 1–4. n = 5–15. Identical colors indicate identical compounds. Data are mean ± SEM. One-sample t tests were performed. Significances: *p < 0.05; **p < 0.01; ***p < 0.001; ****p < 0.0001.
-
Figure 5—source data 1
Including data used for generating Figure 5A–C.
- https://cdn.elifesciences.org/articles/101483/elife-101483-fig5-data1-v1.xlsx
Figure 5—figure supplement 1

Effect of lipids on 300 nM Gsα-stimulated mAC2.
(Left) Effect of 20 μM lipids on mAC2. (Right) Concentration–response curve of cis-vaccenic acid. Basal and Gsα activities mAC2 were 0.38 ± 0.04 and 2.79 ± 0.35 nmol cAMP•mg−1•min−1, respectively. EC50 of cis-vaccenic acid was 10.6 µM. Error bars denote SEM of n = 2–7. One-sample t test: *p < 0.05; ***p < 0.001 compared to 100% (300 nM Gsα stimulation).
-
Figure 5—figure supplement 1—source data 1
Including basal and Gsα-stimulated activities of mAC1–mAC9.
- https://cdn.elifesciences.org/articles/101483/elife-101483-fig5-figsupp1-data1-v1.xlsx
-
Figure 5—figure supplement 1—source data 2
Including data used for generating Figure 5—figure supplement 1, left and right.
- https://cdn.elifesciences.org/articles/101483/elife-101483-fig5-figsupp1-data2-v1.xlsx
Figure 5—figure supplement 2
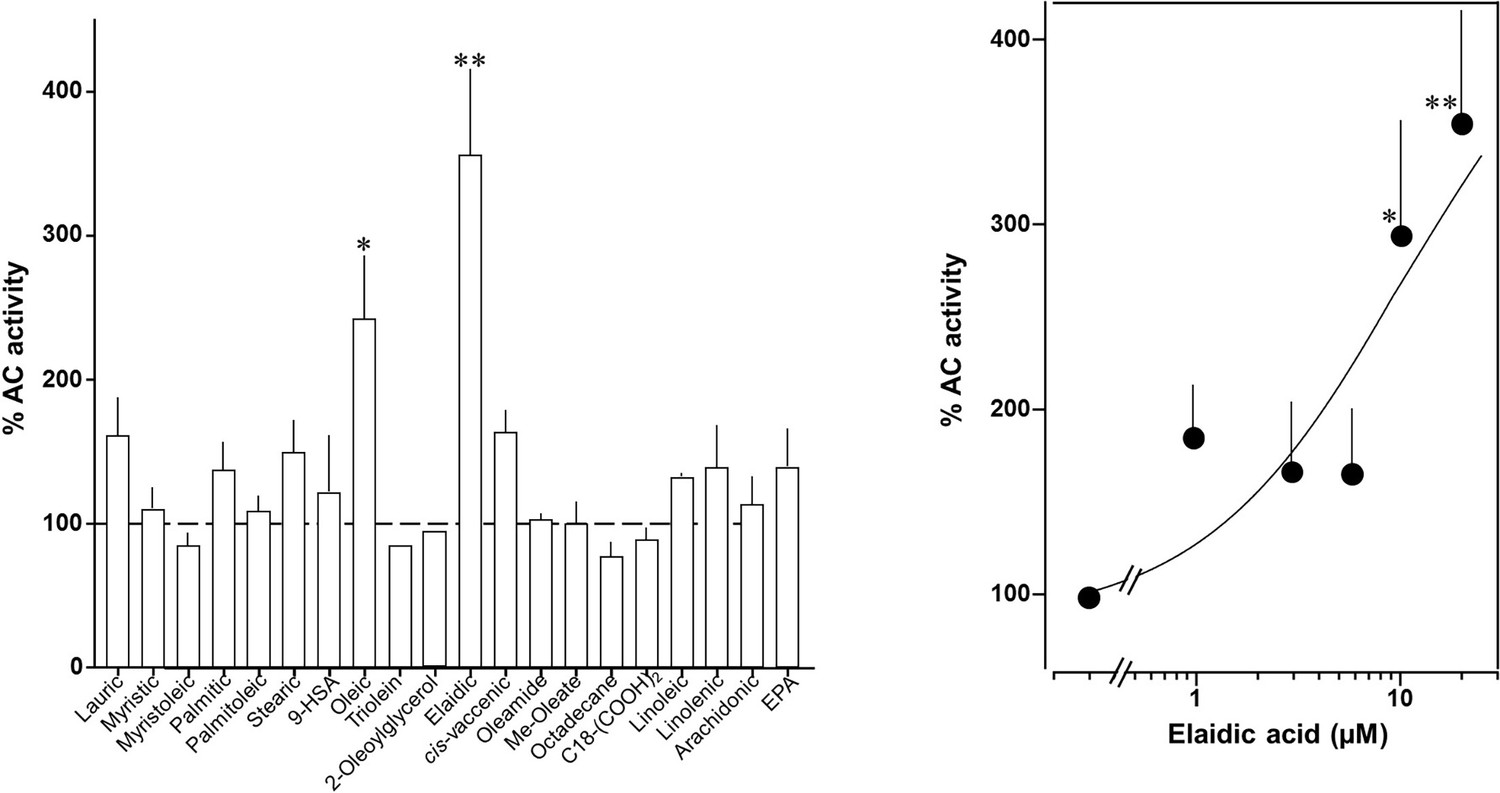
Effect of lipids on 300 nM Gsα-stimulated mAC7.
(Left) Effect of 20 μM lipids on mAC7. (Right) Concentration–response curve for elaidic acid. Basal and Gsα activities were 0.01 ± 0.003 and 0.06 ± 0.01 nmol cAMP•mg−1•min−1, respectively. EC50 was 9.7 µM. Error bars are SEM of n = 2–7. One-sample t test: *p < 0.05; **p < 0.01 compared to 100% (300 nM Gsα stimulation).
-
Figure 5—figure supplement 2—source data 1
Including data used for generating Figure 5—figure supplement 2, left and right.
- https://cdn.elifesciences.org/articles/101483/elife-101483-fig5-figsupp2-data1-v1.xlsx
Figure 5—figure supplement 3

Effect of lipids on 300 nM Gsα-stimulated mAC9.
(Left) Effect of 20 μM lipids on mAC9. (Right) Concentration–response curves of elaidic and linoleic acids. EC50 for elaidic acid was 5 μM. Basal and Gsα activities were 0.07 ± 0.005 and 0.95 ± 0.06 nmol cAMP•mg−1•min−1, respectively. Error bars denote SEM of n = 2–15. One-sample t test: *p < 0.05; **p < 0.01; ***p < 0.001; ****p < 0.0001 compared to 100% (300 nM Gsα stimulation).
-
Figure 5—figure supplement 3—source data 1
Including data used for generating Figure 5—figure supplement 3, left and right.
- https://cdn.elifesciences.org/articles/101483/elife-101483-fig5-figsupp3-data1-v1.xlsx
Figure 5—figure supplement 4

Concentration–response curves of fatty acids activating Gsα-stimulated mAC9.
Basal and Gsα activities were 0.06 ± 0.005 and 0.92 ± 0.07 nmol cAMP•mg−1•min−1, respectively. EC50 for lauric, cis-vaccenic, palmitic, and arachidonic acids were 13.7, 8.5, 8.6, and 7.5 μM, respectively. Error bars denote SEM of n = 3–9. Significances were removed for clarity.
-
Figure 5—figure supplement 4—source data 1
Including data used for generating Figure 5—figure supplement 4, left and right.
- https://cdn.elifesciences.org/articles/101483/elife-101483-fig5-figsupp4-data1-v1.xlsx
Figure 6 with 3 supplements
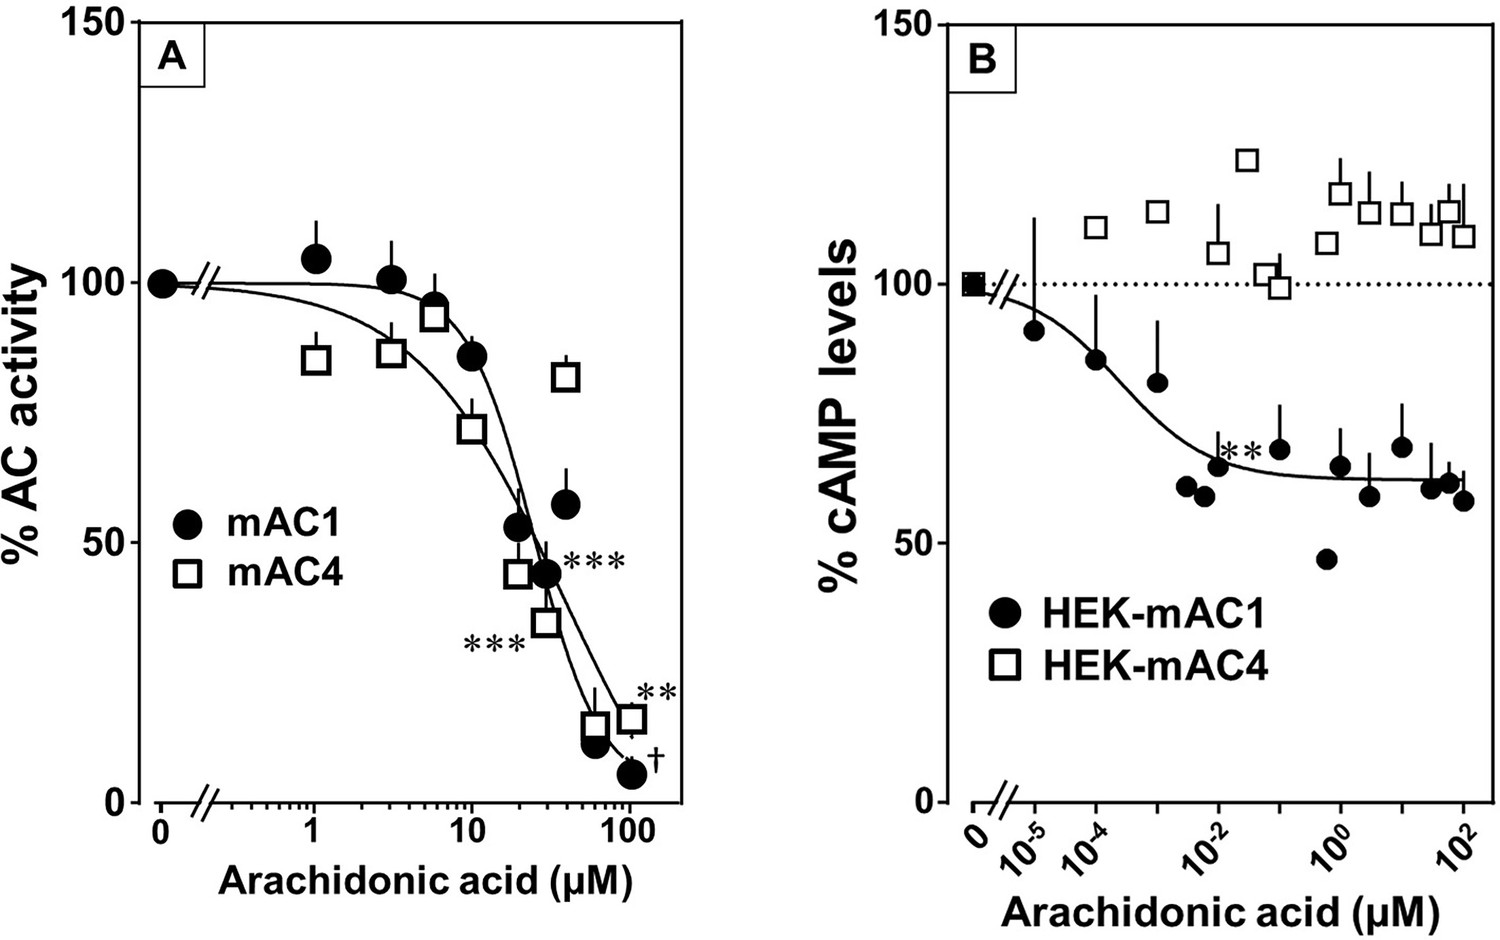
Arachidonic acid attenuates 300 nM Gsα-stimulated activities of mACs 1 and 4.
(A) Arachidonic acid attenuates Gsα-stimulated mACs 1 and 4. Basal and Gsα-stimulated activities of mAC1 were 0.12 ± 0.01 and 0.42 ± 0.03 and of mAC4 0.02 ± 0.002 and 0.14 ± 0.02 nmol cAMP•mg−1•min−1, respectively. IC50 of arachidonic acid for mAC1 and mAC4 were 23 and 36 μM, respectively. n = 3–9. (B) Effect of arachidonic acid on HEK-mAC1 and HEK-mAC4 cells. Cells were stimulated by 10 µM isoproterenol (set as 100 %) in the presence of 0.5 mM IBMX (3-isobutyl-1-methylxanthine). Basal and isoproterenol-stimulated cAMP levels in HEK-mAC1 were 1.03 ± 0.15 and 1.66 ± 0.28 and in HEK-mAC4 0.20 ± 0.04 and 0.86 ± 0.24 pmol cAMP/10,000 cells, respectively. IC50 for HEK-mAC1 was 250 pM. n = 2–11, each with three replicates. Data are mean ± SEM. One-sample t tests were performed. Significances: **p < 0.01; ***p < 0.001; †p < 0.0001. For clarity, not all significances are indicated.
-
Figure 6—source data 1
Including data used for generating Figure 6A, B.
- https://cdn.elifesciences.org/articles/101483/elife-101483-fig6-data1-v1.xlsx
Figure 6—figure supplement 1

Effect of 20 µM lipids on 300 nM Gsα-stimulated mAC1.
Basal and Gsα activities were 0.18 ± 0.02 and 0.46 ± 0.02 nmol cAMP•mg−1•min−1, respectively. Error bars denote SEM of n = 2–9. One-sample t test: *p < 0.05; ***p < 0.001 compared to 100% (300 nM Gsα stimulation).
-
Figure 6—figure supplement 1—source data 1
Including data used for generating Figure 6—figure supplement 1.
- https://cdn.elifesciences.org/articles/101483/elife-101483-fig6-figsupp1-data1-v1.xlsx
Figure 6—figure supplement 2

Effect of 20 µM lipids on 300 nM Gsα-stimulated mAC4.
Basal and Gsα activities were 0.03 ± 0.003 and 0.59 ± 0.11 nmol cAMP•mg−1•min−1, respectively. Error bars denote SEM of n = 2–6. One-sample t test: **p < 0.01; ***p < 0.001 compared to 100% (300 nM Gsα stimulation).
-
Figure 6—figure supplement 2—source data 1
Including data used for generating Figure 6—figure supplement 2.
- https://cdn.elifesciences.org/articles/101483/elife-101483-fig6-figsupp2-data1-v1.xlsx
Figure 6—figure supplement 3
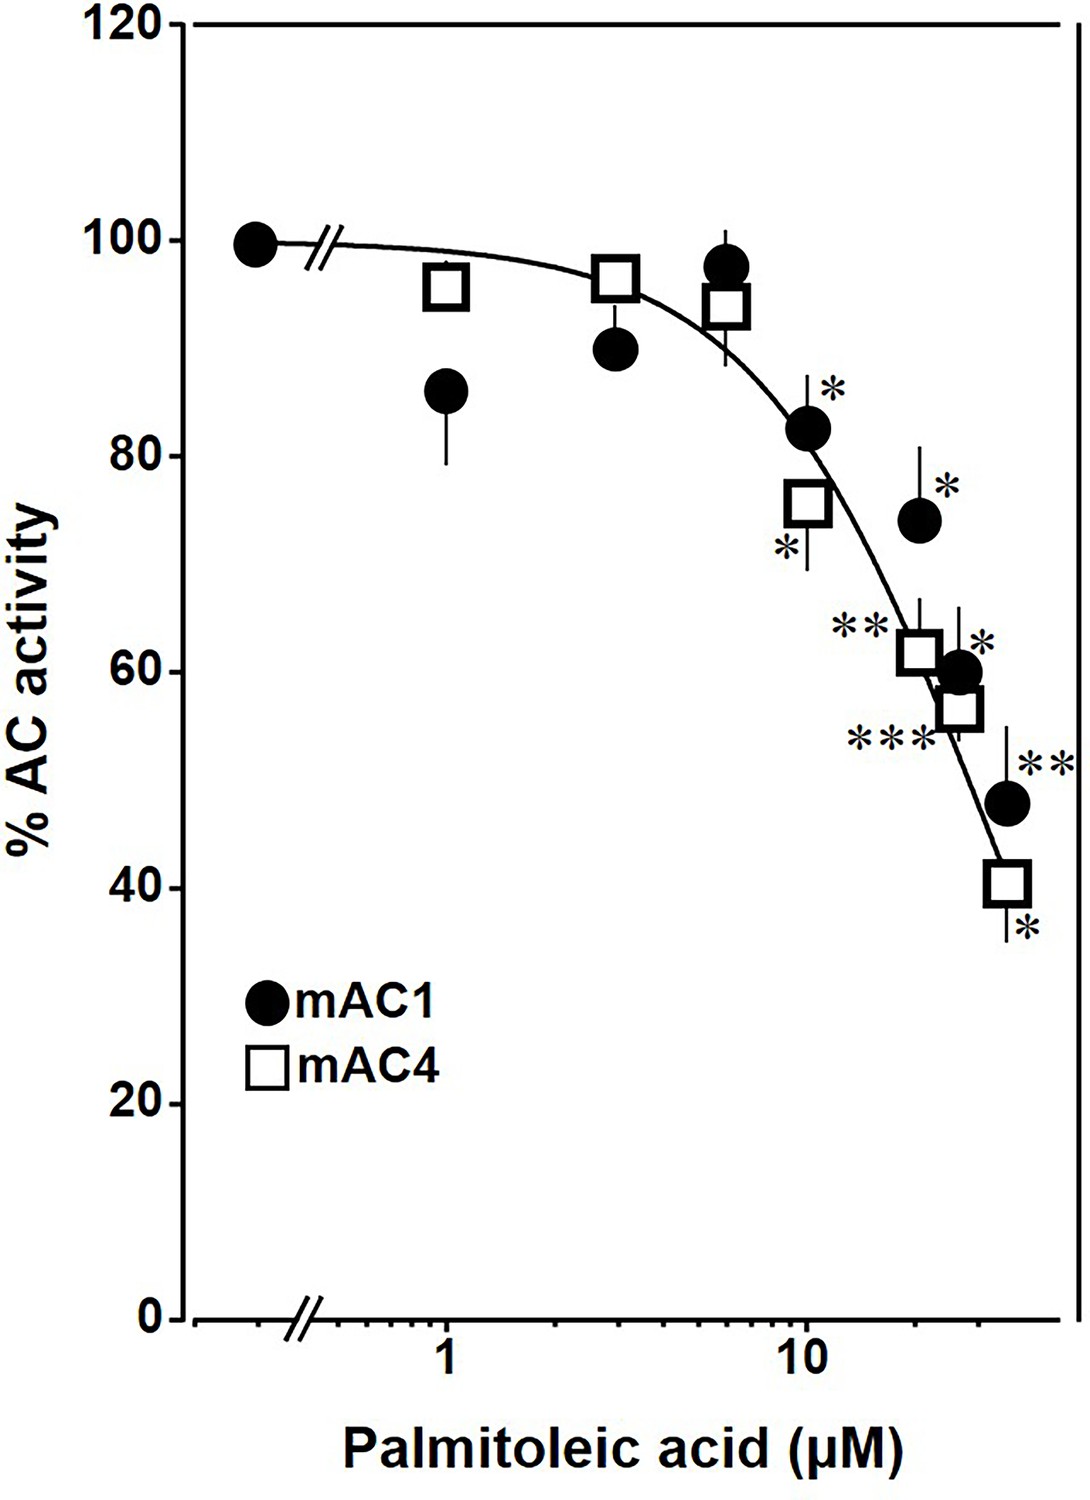
Palmitoleic acid inhibits mACs 1 and 4 stimulated by 300 nM Gsα.
Basal and Gsα-stimulated activities of mAC1 were 0.14 ± 0.01 and 0.44 ± 0.02 and of mAC4 were 0.03 ± 0.002 and 0.25 ± 0.02 nmol cAMP•mg−1•min−1. IC50 for mAC1 and 4 were 49 and 20 µM, respectively. Error bars denote SEM of n = 3–6. One-sample t test: *p < 0.05; **p < 0.01; ***p < 0.001; compared to 100% (300 nM Gsα stimulation).
-
Figure 6—figure supplement 3—source data 1
Including data used for generating Figure 6—figure supplement 3.
- https://cdn.elifesciences.org/articles/101483/elife-101483-fig6-figsupp3-data1-v1.xlsx
Figure 7 with 2 supplements
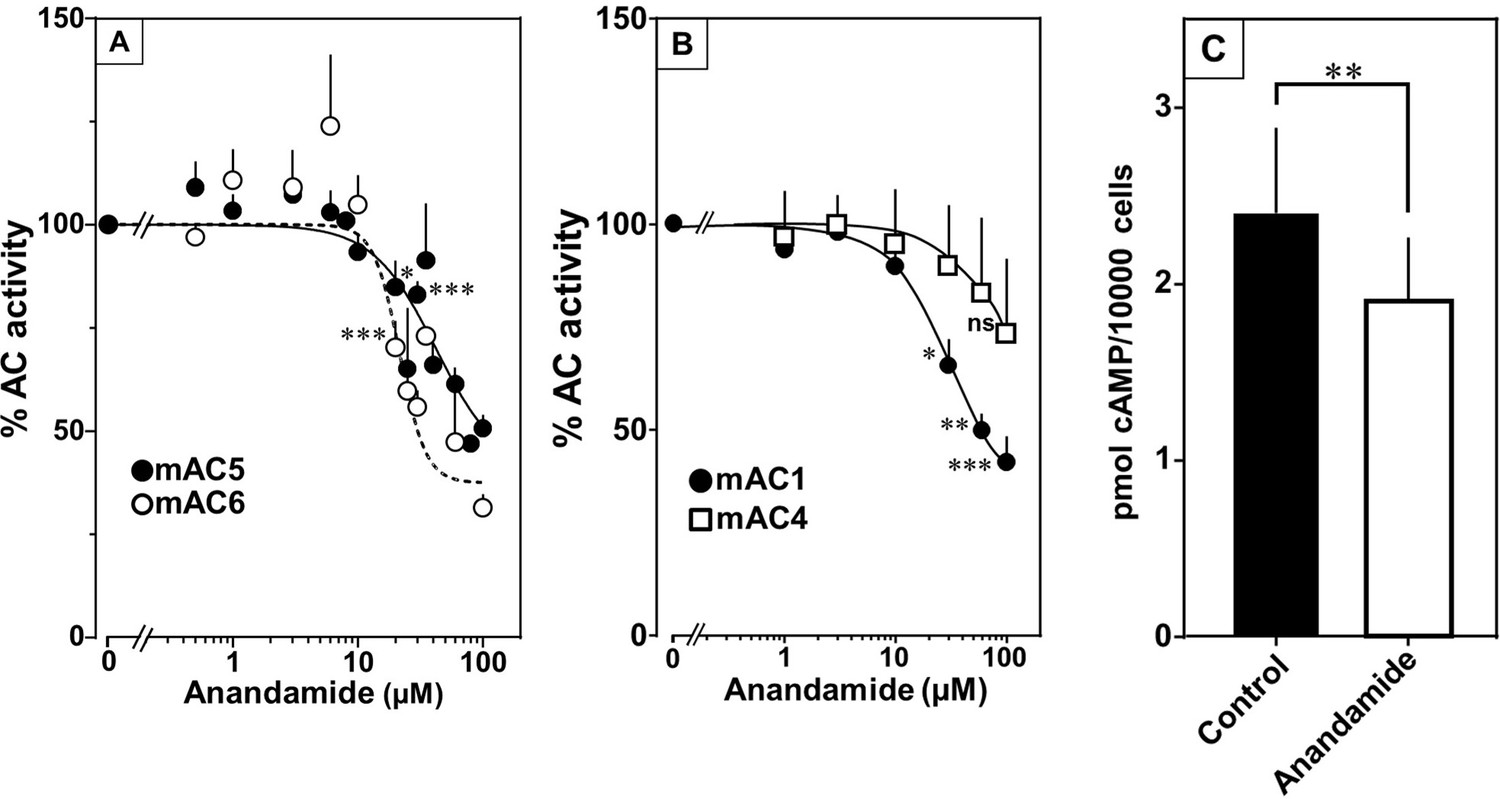
Anandamide attenuates 300 nM Gsα-stimulated activities of mACs 1, 4, 5, and 6.
(A) Effect of anandamide on Gsα-stimulated mAC5 and 6. Basal and Gsα activities of mAC5 were 0.05 ± 0.01 and 0.98 ± 0.12 and of mAC6 0.05 ± 0.01 and 0.78 ± 0.12 nmol cAMP•mg−1•min−1, respectively. IC50 of anandamide were 42 and 22 μM, respectively. n = 3–32. (B) Anandamide attenuates mAC1 but not mAC4 stimulated by Gsα. Basal and Gsα-stimulated activities of mAC1 were 0.12 ± 0.01 and 0.40 ± 0.03 and of mAC4 0.02 ± 0.002 and 0.15 ± 0.02 nmol cAMP•mg−1•min−1, respectively. IC50 for mAC1 was 29 μM. n = 3–4, each with two technical replicates. (C) Effect of anandamide on 2.5 µM isoproterenol-stimulated HEK-mAC5. Basal and isoproterenol-stimulated cAMP levels of HEK-mAC5 were 1.8 ± 0.22 and 2.4 ± 0.48 pmol cAMP/10,000 cells, respectively. The control bar represents 2.5 µM isoproterenol stimulation alone. n = 5–6, each with three technical replicates. IC50 of anandamide was 133 µM. Data are mean ± SEM. One-sample t tests (A, B) and paired t test (C) were performed. Significances: ns: not significant p > 0.05; *p < 0.05; **p < 0.01; ***p < 0.001. For clarity, not all significances are indicated.
-
Figure 7—source data 1
Including data used for generating Figure 7A–C.
- https://cdn.elifesciences.org/articles/101483/elife-101483-fig7-data1-v1.xlsx
Figure 7—figure supplement 1

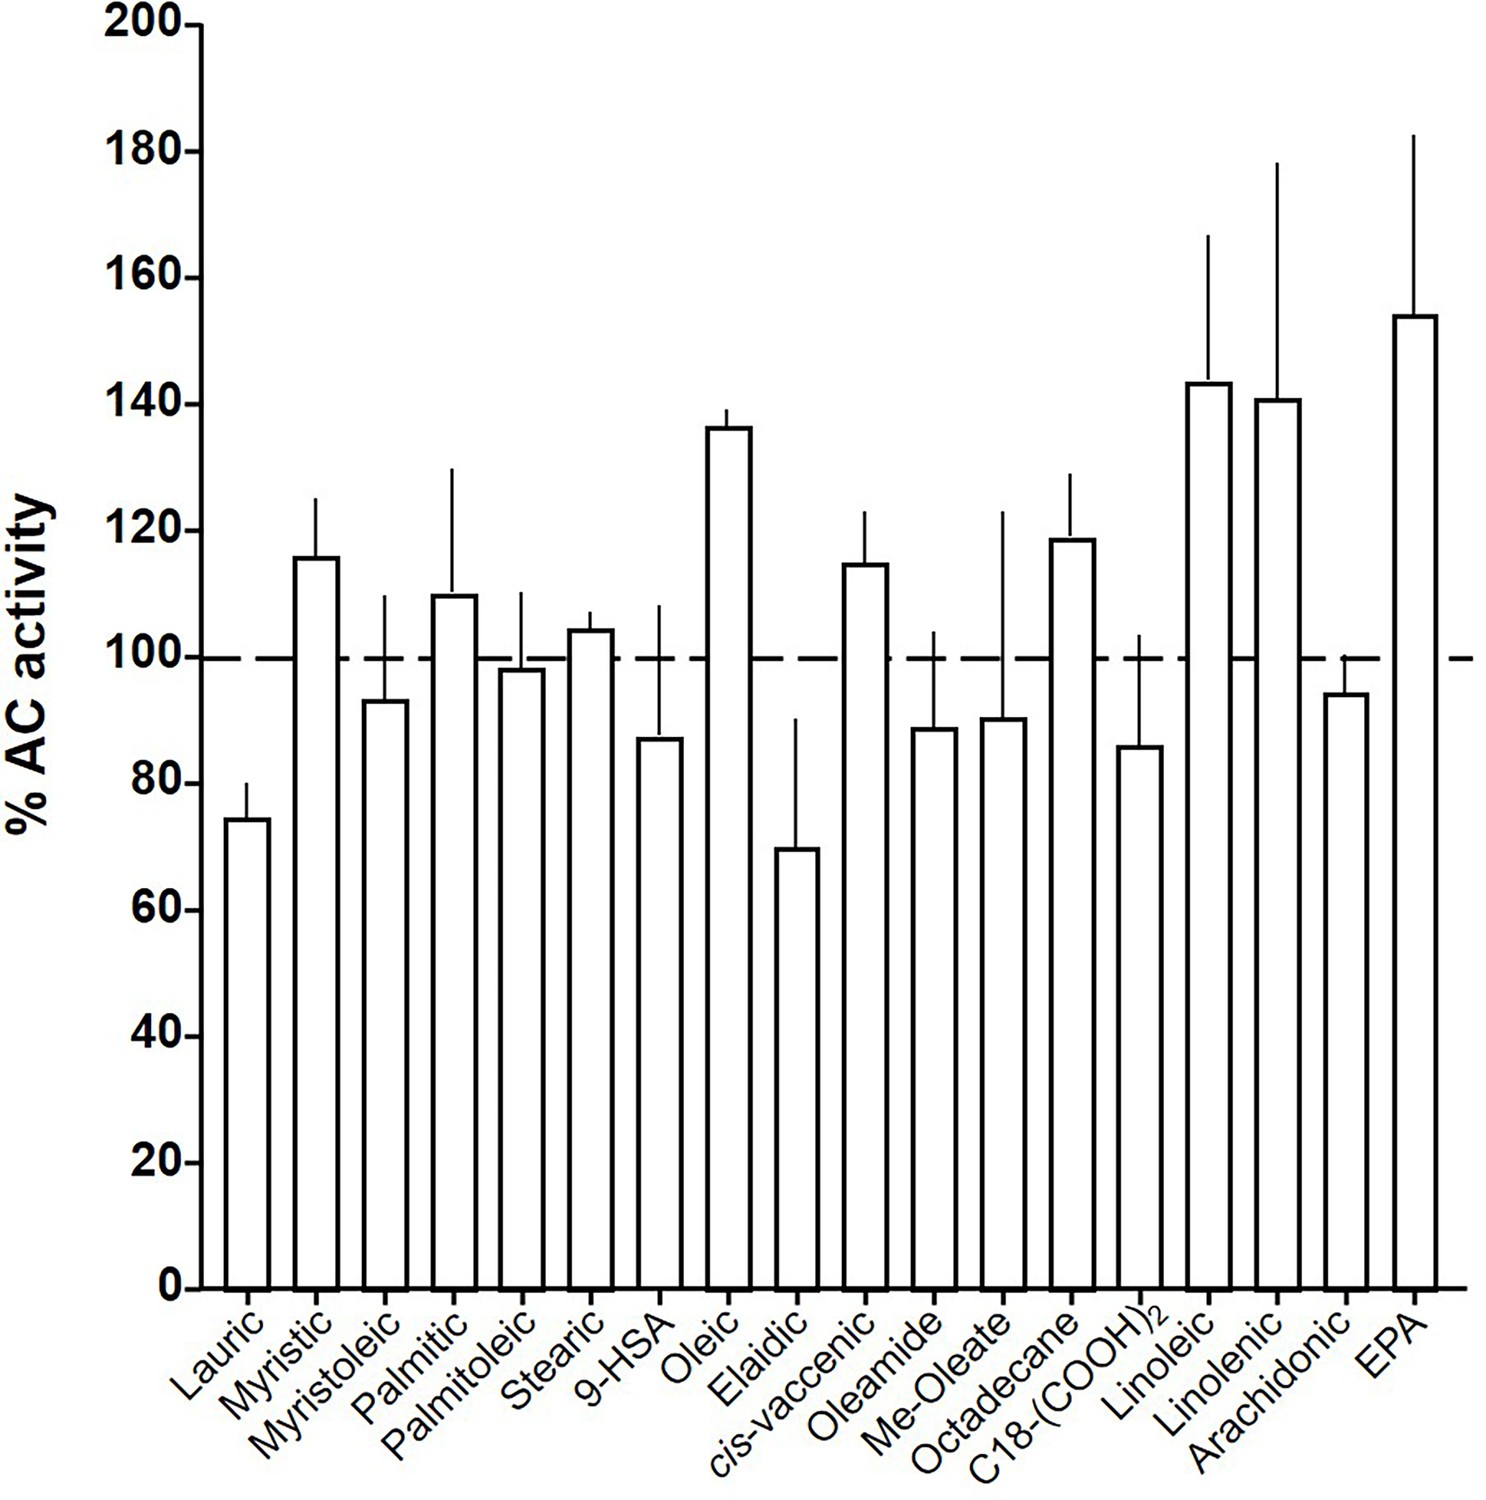
Effect of 20 µM lipids on 300 nM Gsα-stimulated mAC5.
Basal and Gsα activities were 0.07 ± 0.01 and 0.46 ± 0.04 nmol cAMP•mg−1•min−1, respectively. Error bars denote SEM of n = 2–5.
-
Figure 7—figure supplement 1—source data 1
Including data used for generating Figure 7—figure supplement 1.
- https://cdn.elifesciences.org/articles/101483/elife-101483-fig7-figsupp1-data1-v1.xlsx
Figure 7—figure supplement 2
Effect of 20 µM lipids on 300 nM Gsα-stimulated mAC6.
Basal and Gsα activities were 0.07 ± 0.01 and 0.50 ± 0.06 nmol cAMP•mg−1•min−1, respectively. Error bars denote SEM of n = 2–6.
-
Figure 7—figure supplement 2—source data 1
Including data used for generating Figure 7—figure supplement 2.
- https://cdn.elifesciences.org/articles/101483/elife-101483-fig7-figsupp2-data1-v1.xlsx
Figure 8
Effect of 20 µM lipids on 300 nM Gsα-stimulated mAC8.
Basal and Gsα activities were 0.19 ± 0.01 and 1.04 ± 0.19 nmol cAMP•mg−1•min−1, respectively. Error bars denote SEM of n = 2–5.
-
Figure 8—source data 1
Including data used for generating Figure 8.
- https://cdn.elifesciences.org/articles/101483/elife-101483-fig8-data1-v1.xlsx
Figure 9
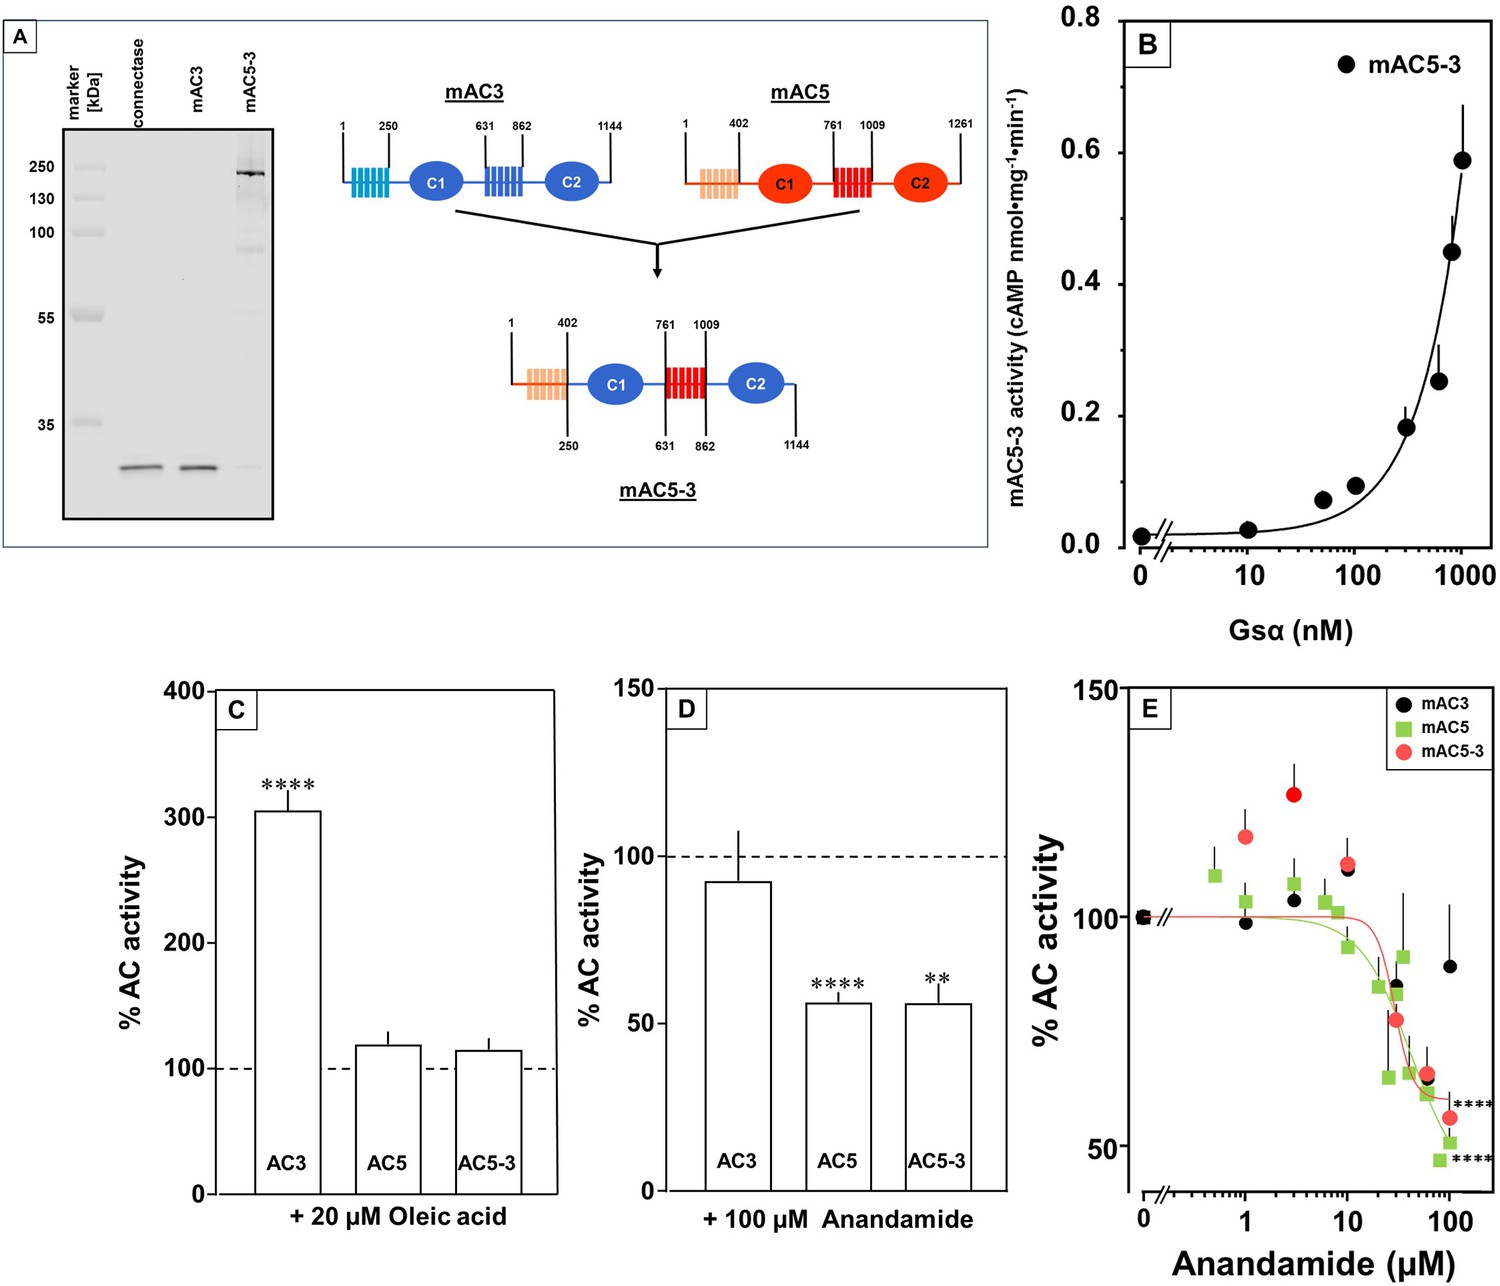
Receptor properties are exchangeable between mAC isoforms.
(A, left) Detection of AC5(membr)–AC3(cat) receptor chimeras. AC5(membr)–AC3(cat) (AC5–3) (Tews et al., 2005) was expressed in HEK293 cells with an N-terminal tag for labeling with the protein ligase Connectase. The membrane preparation was incubated with fluorophore-conjugated Connectase and separated by sodium dodecyl sulfate–polyacrylamide gel electrophoresis (SDS–PAGE). A fluorescence scan of the gel detects AC5(membr)–AC3(cat) (right), the reagent (fluorophore-conjugated Connectase) is detected when using HEK293 membrane (middle) or a buffer control (left); (A, right) Design of the chimeric AC5–3 construct. Numbers are amino acid positions in mAC3 and 5, respectively. (B) Gsα concentration–response curve of mAC5–3. Basal activity for mAC5–3 was 0.02 pmol cAMP•mg−1•min−1. Error bars denote SEM of n = 3, each with two technical replicates. (C) Effect of 20 µM oleic acid on 300 nM Gsα-stimulated mACs 3, 5, and 5–3. Basal and Gsα activities of mACs 3, 5, and 5–3 were 0.02 ± 0.003 and 0.11 ± 0.02, 0.05 ± 0.01 and 0.98 ± 0.12, and 0.01 ± 0.004 and 0.2 ± 0.02 nmol cAMP•mg−1•min−1, respectively. n = 7–33. (D) Effect of 100 µM Anandamide on 300 nM Gsα-stimulated mACs 3, 5, and 5–3. Basal and Gsα activities of mACs 3, 5, and 5–3 were 0.02 ± 0.002 and 0.19 ± 0.02, 0.05 ± 0.01 and 0.98 ± 0.12, and 0.02 ± 0.003 and 0.23 ± 0.04 nmol cAMP•mg−1•min−1, respectively. n = 6–9. IC50 for mAC5 and mAC5–3 were 42 and 29 µM, respectively. (E). Exchange of TM domains transfers anandamide effect on mAC3. Basal and Gsα-stimulated activities of mAC3 were 0.02 ± 0.002 and 0.12 ± 0.02 nmol cAMP•mg−1•min−1, respectively. Basal and Gsα-stimulated activities of mAC5 were 0.05 ± 0.005 and 0.98 ± 0.12 nmol cAMP•mg−1•min−1, respectively. Basal and Gsα-stimulated activities of mAC5–3 were 0.02 ± 0.002 and 0.22 ± 0.03 nmol cAMP•mg−1•min−1, respectively. Calculated IC50 concentrations of anandamide for mAC5 and mAC5–3 were 42 and 29 µM, respectively. Data are mean ± SEM. One-sample t tests. Significances: **p < 0.01; ****p < 0.0001.
-
Figure 9—source data 1
PDF file containing original gel for Figure 9A, indicating the relevant bands.
- https://cdn.elifesciences.org/articles/101483/elife-101483-fig9-data1-v1.zip
-
Figure 9—source data 2
Original file containing gel for Figure 9A.
- https://cdn.elifesciences.org/articles/101483/elife-101483-fig9-data2-v1.zip
-
Figure 9—source data 3
Including data used for generating Figure 9B–E.
- https://cdn.elifesciences.org/articles/101483/elife-101483-fig9-data3-v1.xlsx
Figure 10
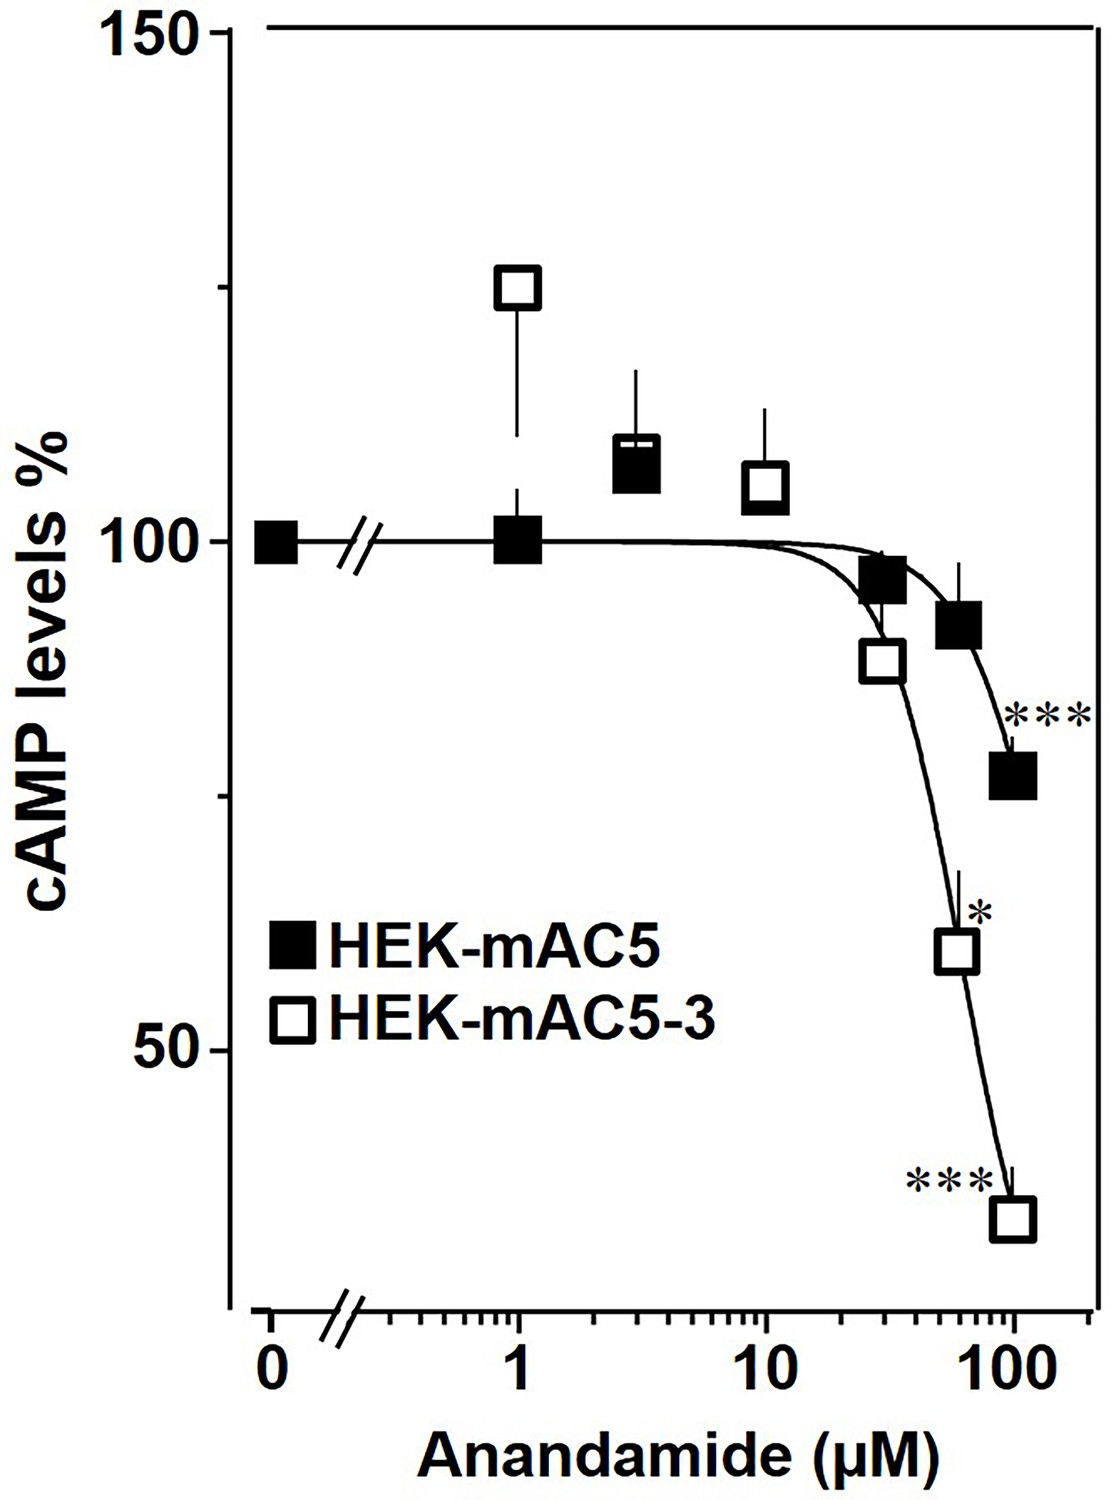
mAC5–mAC3 receptor transfer analyzed in HEK293 cells.
Effect of anandamide on HEK-mAC5 and HEK-mAC5–3 cells stimulated by 2.5 µM isoproterenol (set as 100%). Basal and isoproterenol-stimulated cAMP levels in HEK-mAC5 were 1.80 ± 0.22 and 2.29 ± 0.39 and in HEK-mAC5–3 (+0.5 mM IBMX) 0.17 ± 0.02 and 3.11 ± 0.55 pmol cAMP/10,000 cells, respectively. n = 4–11. IC50 for HEK-mAC5 and HEK-mAC5–3 were 133 and 60 μM, respectively. Anandamide had no effect on basal activity of HEK-mAC5 and stimulated HEK-mAC3 cells in concentrations up to 100 µM (data not shown). Data are mean ± SEM. One-sample t tests were performed. Significances: *p < 0.05; ***p < 0.001.
-
Figure 10—source data 1
Including data used for generating Figure 10.
- https://cdn.elifesciences.org/articles/101483/elife-101483-fig10-data1-v1.xlsx
Figure 11
Oleic acid concentration dependently potentiates mAC activity in brain cortical membranes from mouse.
Basal and 300 nM Gsα activities were 0.4 ± 0.1 and 2.7 ± 0.7 nmol cAMP•mg−1•min−1, respectively. n = 4–6. One-sample t test: *p < 0.05; **p < 0.01 compared to 100% (300 nM Gsα stimulation).
-
Figure 11—source data 1
Including data used for generating Figure 11.
- https://cdn.elifesciences.org/articles/101483/elife-101483-fig11-data1-v1.xlsx
Tables
Table 1
List of lipids tested against mAC isoforms.
| Lauric (dodecanoic) acid |
| Myristic (tetradecanoic) acid |
| Myristoleic ((9Z)-tetradecenoic) acid |
| Palmitic (hexadecanoic) acid |
| Palmitoleic ((9Z)-hexadecenoic) acid |
| Octadecane |
| 1,18-Octadecanedicarboxylic acid |
| Stearic (octadecanoic) acid |
| 9-Hydroxystearic acid |
| Oleic ((9Z)-octadecenoic) acid |
| Oleamide ((9Z)-octadecenamide) |
| Methyl oleate |
| 2-Oleoylglycerol |
| Triolein |
| Elaidic ((9E)-octadecenoic) acid |
| cis-Vaccenic ((11E)-octadecenoic) acid |
| Linoleic ((9Z,12Z)-octadecadienoic) acid |
| Linolenic ((9Z,12Z,15Z)-octadecatrienoic) acid |
| Arachidonic ((5Z,8Z,11Z,14Z)-eicosatetraenoic) acid |
| Eicosapentaenoic ((5Z,8Z,11Z,14Z,17Z)-eicosapentaenoic) acid |
Additional files
Download links
A two-part list of links to download the article, or parts of the article, in various formats.
Downloads (link to download the article as PDF)
Open citations (links to open the citations from this article in various online reference manager services)
Cite this article (links to download the citations from this article in formats compatible with various reference manager tools)
The membrane domains of mammalian adenylyl cyclases are lipid receptors
eLife 13:RP101483.
https://doi.org/10.7554/eLife.101483.3


