A new preprocedural predictive risk model for post-endoscopic retrograde cholangiopancreatography pancreatitis: The SuPER model
- Department of Gastroenterology, Fukushima Medical University, School of Medicine, Japan
- Department of Gastroenterology, Fukushima Rosai Hospital, Japan
- Department of Gastroenterology, Aizu Medical Center, Fukushima Medical University, Japan
- Department of Gastroenterology, Ohta Nishinouchi Hospital, Japan
- Department of Gastroenterology, Fukushima Redcross Hospital, Japan
- Department of Gastroenterology, Soma General Hospital, Japan
- Department of Gastroenterology, Saiseikai Fukushima General Hospital, Japan
- Department of Endoscopy, Fukushima Medical University Hospital, Japan
Figures
Figure 1
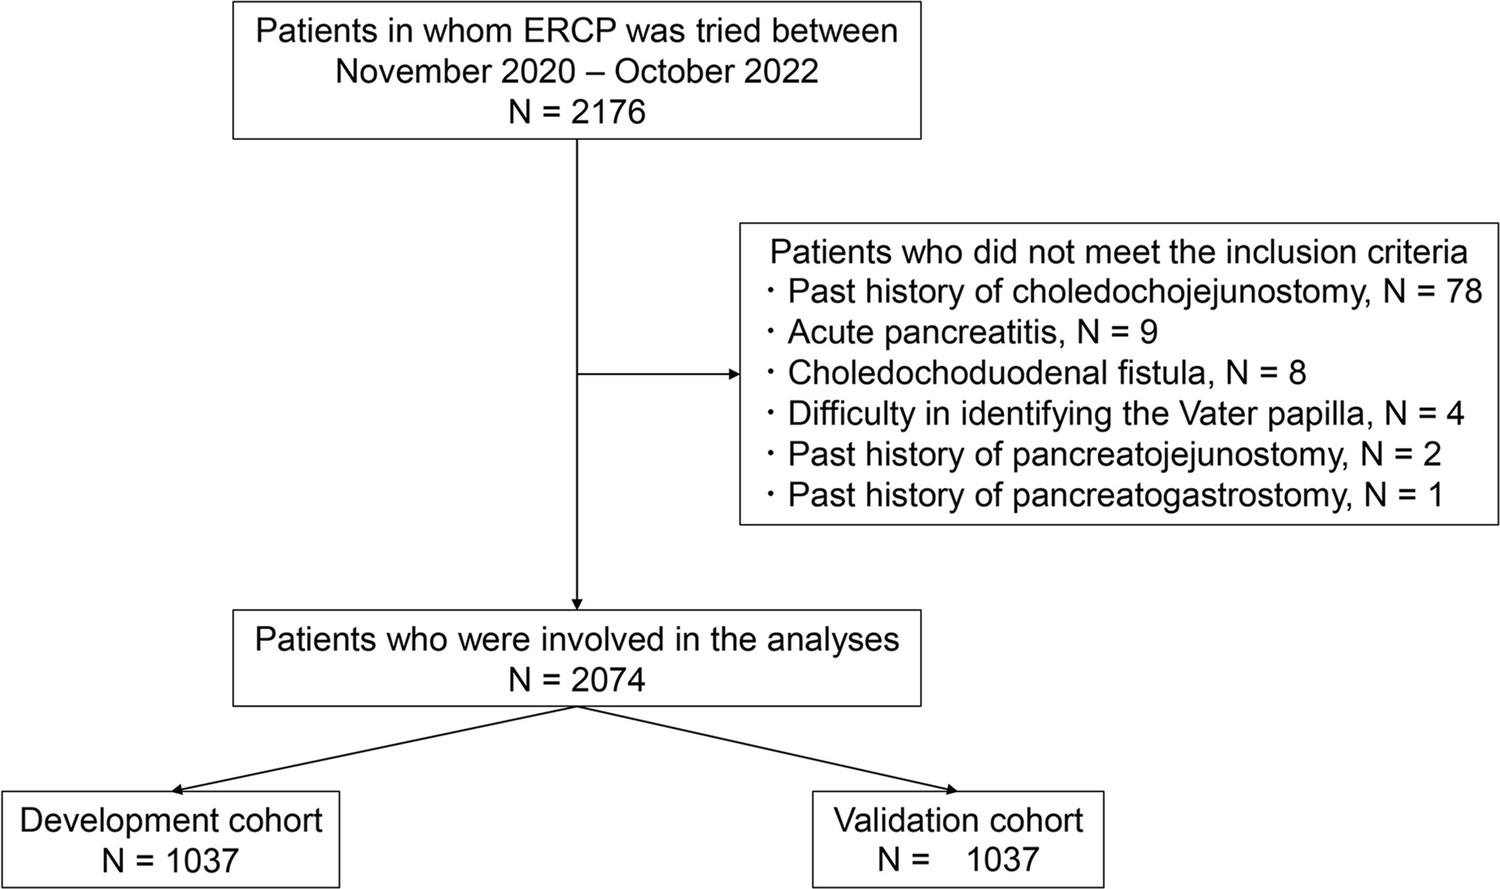
Flowchart of the inclusion criteria.
ERCP, endoscopic retrograde cholangiopancreatography.
Figure 2
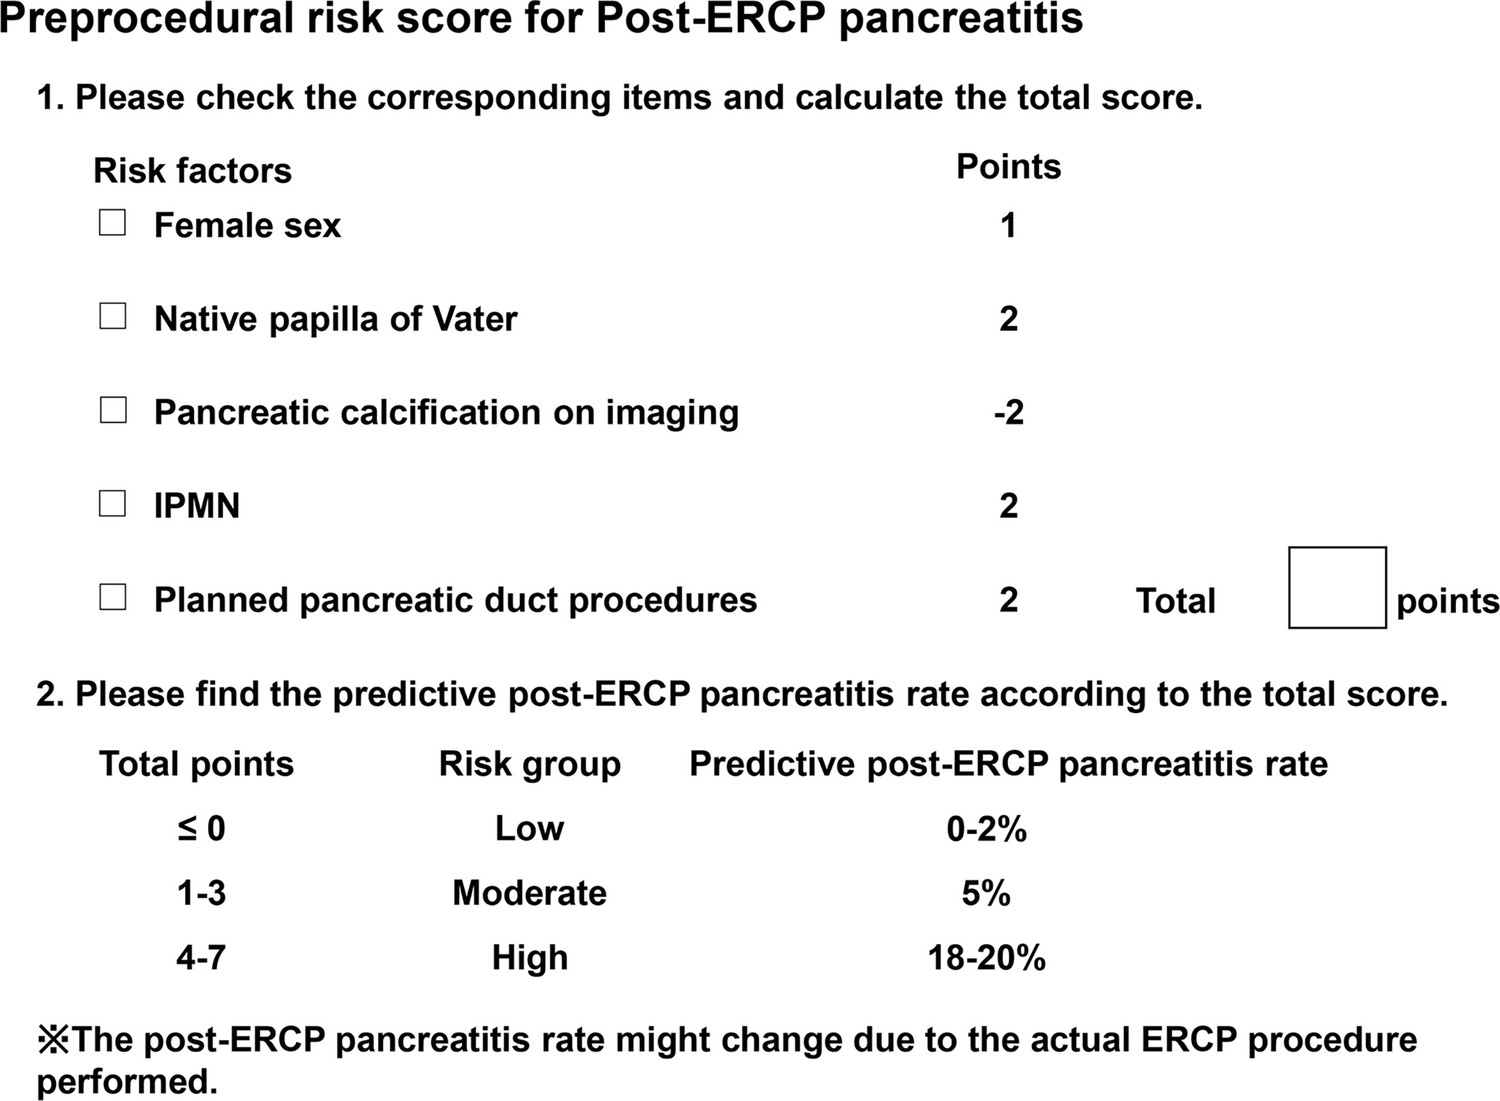
Example of the preprocedural PEP risk checklist.
ERCP, endoscopic retrograde cholangiopancreatography; IPMN, intraductal papillary mucinous neoplasm; PEP, post-ERCP pancreatitis.
Tables
Table 1
Comparison of patient characteristics and ERCP outcomes between the development and validation cohorts.
| Development cohort(n=1037) | Validation cohort(n=1037) | p-Value | |
|---|---|---|---|
| Patient factors | |||
| Age, years, mean ± SD | 73.8 ± 12.7 | 75.1 ± 12.5 | 0.02 |
| Sex, n, male/female | 642/395 | 629/408 | 0.59 |
| History of pancreatitis, n (%) | 73 (7.0) | 45 (4.4) | 0.01 |
| History of PEP, n (%) | 26 (2.5) | 24 (2.3) | 0.89 |
| History of gastrectomy, n (%) | 82 (7.9) | 88 (8.5) | 0.69 |
| Billroth-I reconstruction, n | 24 | 25 | |
| Billroth-II reconstruction, n | 23 | 25 | |
| Roux-en-Y reconstruction, n | 33 | 36 | |
| Double tract, n | 1 | 1 | |
| Gastric tube reconstruction, n | 1 | 1 | |
| Pancreatic cancer, n (%) | 145 (14.0) | 174 (16.8) | 0.09 |
| IPMN, n (%) | 17 (1.6) | 8 (0.8) | 0.11 |
| Native papilla of Vater, n (%) | 535 (51.6) | 494 (47.7) | 0.08 |
| Total bilirubin, mg/dl, mean ± SD * | 3.5 ± 5.3 | 3.6 ± 5.0 | 0.45 |
| Diameter of the MPD, mm, mean ± SD † | 2.84 ± 2.63 | 3.1 ± 2.9 | 0.10 |
| Pancreatic calcification, n (%) ‡ | 107 (10.6) | 87 (8.7) | 0.15 |
| Periampullary diverticulum, n (%) | 207 (20.0) | 224 (21.6) | 0.39 |
| Pre-ERCP prophylaxis | |||
| Protease inhibitors, n (%) | 709 (68.4) | 703 (67.8) | 0.81 |
| Intravenous hydration, n (%) | 22 (2.1) | 14 (1.4) | 0.24 |
| NSAID suppository, n (%) | 53 (5.1) | 45 (4.3) | 0.47 |
| Factors related to the planned procedure | |||
| EST, n (%) | 449 (43.3) | 434 (41.9) | 0.53 |
| EPBD, n (%) | 31 (3.0) | 40 (3.9) | 0.33 |
| EPLBD, n (%) | 56 (5.4) | 55 (5.3) | 1.0 |
| Biliary stone removal, n (%) | 327 (31.5) | 342 (33.0) | 0.51 |
| Ampullectomy, n (%) | 5 (0.5) | 5 (0.5) | 1.0 |
| Biliary stent, n (%) | 594 (57.3) | 611 (58/9) | 0.48 |
| Plastic stent, n (%) | 445 (42.9) | 436 (42.0) | 0.72 |
| SEMS, n (%) | 119 (11.5) | 122 (11.8) | 0.89 |
| CSEMS, n (%) | 36 (3.5) | 44 (4.2) | 0.43 |
| Biliary stent above the papilla, n (%) | 45 (4.3) | 47 (4.5) | 0.92 |
| Procedures on the pancreatic duct, n (%) | 285 (27.5) | 237 (22.9) | 0.017 |
| PEP occurrence, n (%) | 70 (6.8) | 64 (6.2) | 0.66 |
| Mild, n | 60 | 53 | |
| Moderate, n | 8 | 7 | |
| Severe, n | 2 | 4 |
-
ERCP, endoscopic retrograde cholangiopancreatography; PEP, post-ERCP pancreatitis; IPMN, intraductal papillary mucinous neoplasm; MPD, main pancreatic duct; EST, endoscopic sphincterotomy; EPBD, endoscopic papillary balloon dilation; SEMS, self-expandable metallic stent; CSEMS, covered SEMS.
-
*
Data were available for 2042 patients.
-
†
Data were available for 1671 patients.
-
‡
Data were available for 2017 patients.
Table 2
Logistic regression analysis of predictive factors for PEP in the development cohort.
| Univariate analysis | Multivariate analysis | |||||||
|---|---|---|---|---|---|---|---|---|
| OR | 95% CI | p- Value | OR | 95% CI | p-Value | Regression coefficient | Points | |
| Age <50 years | 2.42 | 0.99–6.0 | 0.053 | 1.76 | 0.67–4.63 | 0.25 | 0.56 | - |
| Female | 1.91 | 1.17–3.10 | <0.01 | 1.72 | 1.03–2.89 | 0.039 | 0.55 | 1 |
| History of pancreatitis | 1.26 | 0.53–3.0 | 0.61 | |||||
| History of PEP | 1.84 | 0.54–6.28 | 0.33 | |||||
| History of gastrectomy | 0.89 | 0.35–2.27 | 0.81 | |||||
| Pancreatic cancer | 1.03 | 0.51–2.06 | 0.94 | |||||
| IPMN | 8.15 | 2.92–22.7 | <0.01 | 3.04 | 0.97–9.52 | 0.056 | 1.11 | 2 |
| Native papilla of Vater | 4.49 | 2.42–8.30 | <0.01 | 2.72 | 1.30–5.71 | <0.01 | 1.0 | 2 |
| Total bilirubin ≤1.2 mg/dl * | 1.13 | 0.69–1.84 | 0.62 | |||||
| Diameter of the MPD >3 mm† | 1.31 | 0.76–2.25 | 0.33 | |||||
| Pancreatic calcification‡ | 0.36 | 0.11–1.17 | 0.089 | 0.32 | 0.10–1.1 | 0.072 | –1.13 | -2 |
| Periampullary diverticulum | 0.65 | 0.33–1.30 | 0.22 | |||||
| Protease inhibitors | 0.72 | 0.44–1.19 | 0.20 | |||||
| Intravenous hydration | 1.39 | 0.32–6.08 | 0.66 | |||||
| NSAID suppository before ERCP | 1.47 | 0.57–3.83 | 0.43 | |||||
| EST | 1.71 | 1.05–2.79 | 0.03 | 0.83 | 0.45–1.52 | 0.54 | –0.19 | - |
| EPBD | <0.01 | 0–infinity | 0.98 | |||||
| EPLBD | 0.24 | 0.03–1.76 | 0.16 | |||||
| Biliary stone removal | 0.68 | 0.39–1.19 | 0.18 | |||||
| Ampullectomy | 3.49 | 0.39–31.6 | 0.27 | |||||
| Biliary stent | 0.93 | 0.57–1.52 | 0.78 | |||||
| Plastic stent | 0.72 | 0.44–1.20 | 0.21 | |||||
| SEMS | 1.66 | 0.87–3.20 | 0.13 | |||||
| CSEMS | 0.81 | 0.19–3.43 | 0.77 | |||||
| Biliary stent above the papilla | 0.30 | 0.04–2.24 | 0.24 | |||||
| Procedures on the pancreatic duct | 4.77 | 2.89–7.89 | <0.01 | 3.49 | 1.99–6.12 | <0.01 | 1.25 | 2 |
-
PEP, post–endoscopic retrograde cholangiopancreatography pancreatitis; IPMN, intraductal papillary mucinous neoplasm; MPD, main pancreatic duct; EST, endoscopic sphincterotomy; EPBD, endoscopic papillary balloon dilation; EPLBD, endoscopic papillary large balloon dilation; SEMS, self-expandable metallic stent; CSEMS, covered SEMS.
-
*
Data were available for 1024 patients in the development cohort.
-
†
Data were available for 985 patients in the development cohort.
-
‡
Data were available for 1012 patients in the development cohort.
Table 3
Patient distribution in terms of risk score and classification.
| Risk score | Development cohort (n=1012) * | Validation cohort (n=1005) † | |||||
|---|---|---|---|---|---|---|---|
| PEP occurrence, N | PEP rate (95% CI) (%) | p-Value ‡ | PEP occurrence, N | PEP rate (95% CI) (%) | p-Value ‡ | ||
| -2 | 0/29 | 0 (0–11.9) | <0.01 | 0/33 | 0 (0–10.6) | <0.01 | |
| -1 | 0/9 | 0 (0–33.6) | 0/5 | 0 (0–52.2) | |||
| 0 | 0/289 | 0 (0–1.3) | 8/293 | 2.7 (1.2–5.3) | |||
| 1 | 6/140 | 4.3 (1.6–9.1) | 5/160 | 3.1 (1.0–7.1) | |||
| 2 | 8/202 | 4.0 (1.7–7.7) | 14/195 | 7.2 (4.0–11.8) | |||
| 3 | 13/150 | 8.7 (4.7–14.4) | 8/158 | 5.1 (2.2–9.7) | |||
| 4 | 18/97 | 18.6 (11.4–27.7) | 14/84 | 16.7 (9.4–26.4) | |||
| 5 | 17/83 | 20.5 (12.4–30.8) | 14/71 | 19.7 (11.2–30.9) | |||
| 6 | 3/9 | 33.3 (7.5–70.1) | 0/3 | 0 (0–70.8) | |||
| 7 | 1/4 | 25.0 (0.6–80.6) | 1/3 | 33.3 (0.8–90.6) | |||
| Risk classification | Risk score | PEP occurrence, N | PEP rate (95% CI) (%) | p-Value ‡ | PEP occurrence, N | PEP rate (95% CI) (%) | p-Value ‡ |
| Low | ≤0 | 0/327 | 0 (0–1.1) | <0.01 | 8/331 | 2.4 (1.0–4.7) | <0.01 |
| Moderate | 1–3 | 27/492 | 5.5 (3.6–7.9) | 27/513 | 5.3 (3.5–7.6) | ||
| High | 4–7 | 39/193 | 20.2 (14.8–26.6) | 29/161 | 18.0 (12.4–24.8) | ||
-
PEP, post–endoscopic retrograde cholangiopancreatography pancreatitis.
-
*
There were missing data for 25 patients.
-
†
Data for 32 patients were missing.
-
‡
The correlations between the risk score or classification and PEP occurrence were evaluated via the Cochran–Armitage test.
Table 4
Goodness of fit of the risk score model.
| Development cohort | Validation cohort | |
|---|---|---|
| C statistic (95% CI) | 0.77 (0.72–0.82) | 0.71 (0.64–0.78) |
| Hosmer‒Lemeshow test, p value | 0.59 | 0.40 |
Additional files
-
Supplementary file 1
Risk classification and unpredictable intraprocedural risk factors for PEP (multivariate logistic regression).
PEP, post-endoscopic retrograde cholangiopancreatography pancreatitis. a Patients with missing data for variables selected in the risk score model were removed.
- https://cdn.elifesciences.org/articles/101604/elife-101604-supp1-v1.docx
-
Supplementary file 2
Risk of PEP following implantation of pancreatic stents (logistic regression).
PEP, post-endoscopic retrograde cholangiopancreatography pancreatitis.
- https://cdn.elifesciences.org/articles/101604/elife-101604-supp2-v1.docx
-
MDAR checklist
- https://cdn.elifesciences.org/articles/101604/elife-101604-mdarchecklist1-v1.pdf
-
Source data 1
The dataset was original raw data without personal information.
The data was anonymized and deidentified.
- https://cdn.elifesciences.org/articles/101604/elife-101604-data1-v1.xlsx
Download links
A two-part list of links to download the article, or parts of the article, in various formats.
Downloads (link to download the article as PDF)
Open citations (links to open the citations from this article in various online reference manager services)
Cite this article (links to download the citations from this article in formats compatible with various reference manager tools)
A new preprocedural predictive risk model for post-endoscopic retrograde cholangiopancreatography pancreatitis: The SuPER model
eLife 13:RP101604.
https://doi.org/10.7554/eLife.101604.3


