Sex-dependent gastrointestinal colonization resistance to MRSA is microbiota and Th17 dependent
- Department of Microbiology, New York University School of Medicine, United States
- Department of Medicine, Division of Infectious Diseases, New York University School of Medicine, United States
- Department of Medicine, Division of Gastroenterology and Hepatology, New York University Langone Health, United States
- Antimicrobial-Resistant Pathogens Program, New York University School of Medicine, United States
- NYU-Regeneron Veterinary Postdoctoral Training Program in Laboratory Animal Medicine, Division of Comparative Medicine, New York University School of Medicine, United States
- Department of Host-Microbe Interactions, St. Jude Children’s Research Hospital, United States
- Department of Medicine, Division of Gastroenterology and Hepatology, University of Pennsylvania Perelman School of Medicine, United States
- Department of Pathobiology, University of Pennsylvania Perelman School of Veterinary Medicine, United States
Figures
Figure 1 with 1 supplement
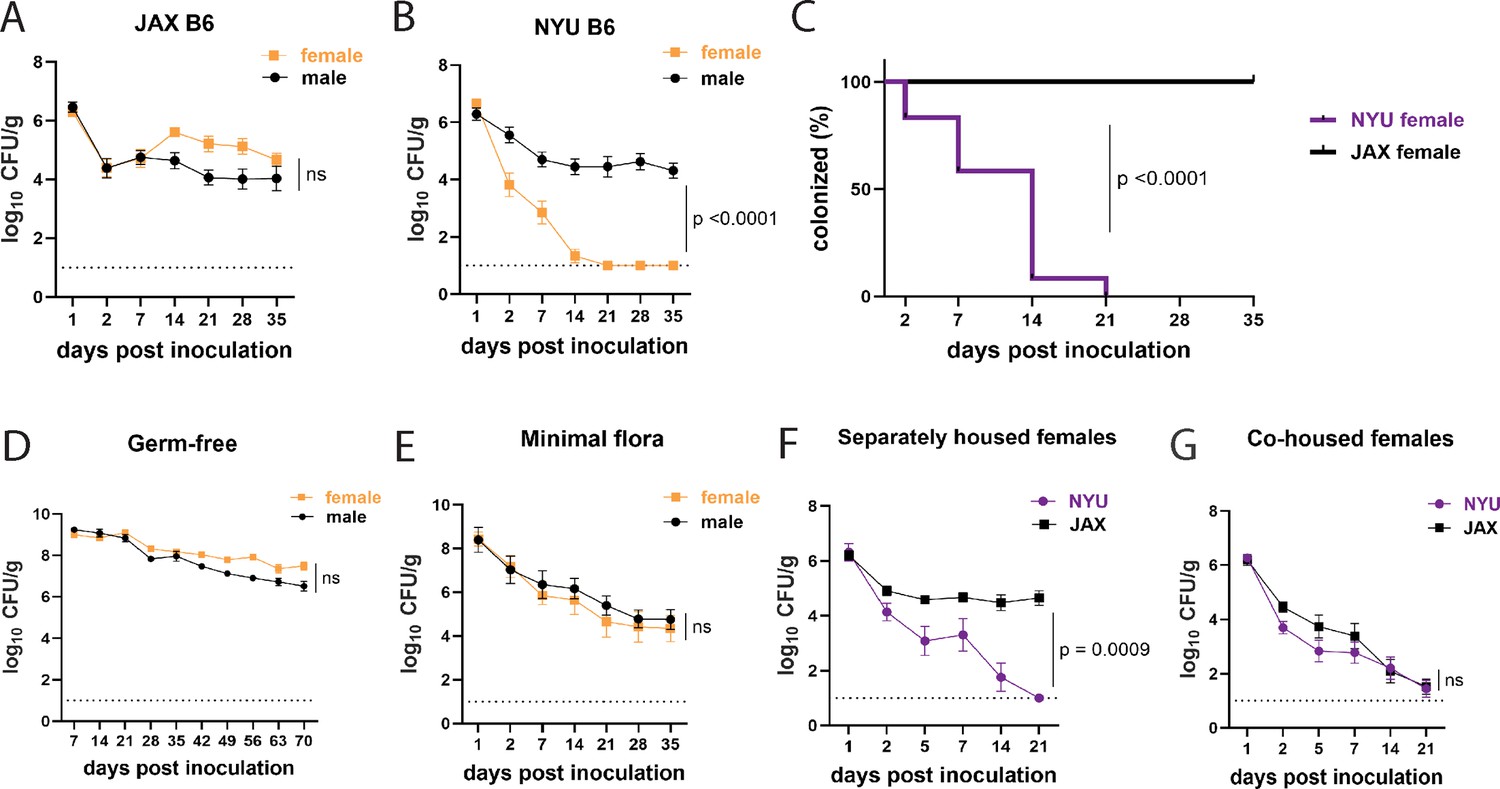
Female mice are protected from methicillin-resistant S. aureus (MRSA) gastrointestinal colonization in a microbiota-dependent manner.
(A) MRSA colony forming units (CFU) per gram of stool following oral inoculation of B6 mice purchased from Jackson Laboratory (JAX). Males n=10, females n=13. (B) MRSA CFU in stool following oral inoculation of B6 mice generated from breeders in the NYU animal facility. Males n=13, females n=13. (C) Proportion of JAX and NYU female mice with detectable MRSA gastrointestinal (GI) colonization over time. (D) MRSA CFU stool burden following oral inoculation of germ-free mice. Males n=8, females n=7. (E) MRSA CFU in stool following oral inoculation of mice with a defined minimal microbiota. Males n=12, females n=11. (F) MRSA CFU stool burden of female NYU or JAX mice housed separately or (G) co-housed with each other. NYU n=9, JAX n=11, co-housed NYU n=14, co-housed JAX n=14. Data points represent mean ± SEM from at least two independent experiments. Statistical analysis: area under the curve followed by a two-tailed t-test for (A), (B), (D–G) and Log-rank Mantel-Cox test for (C). ns: not significant.
Figure 1—figure supplement 1
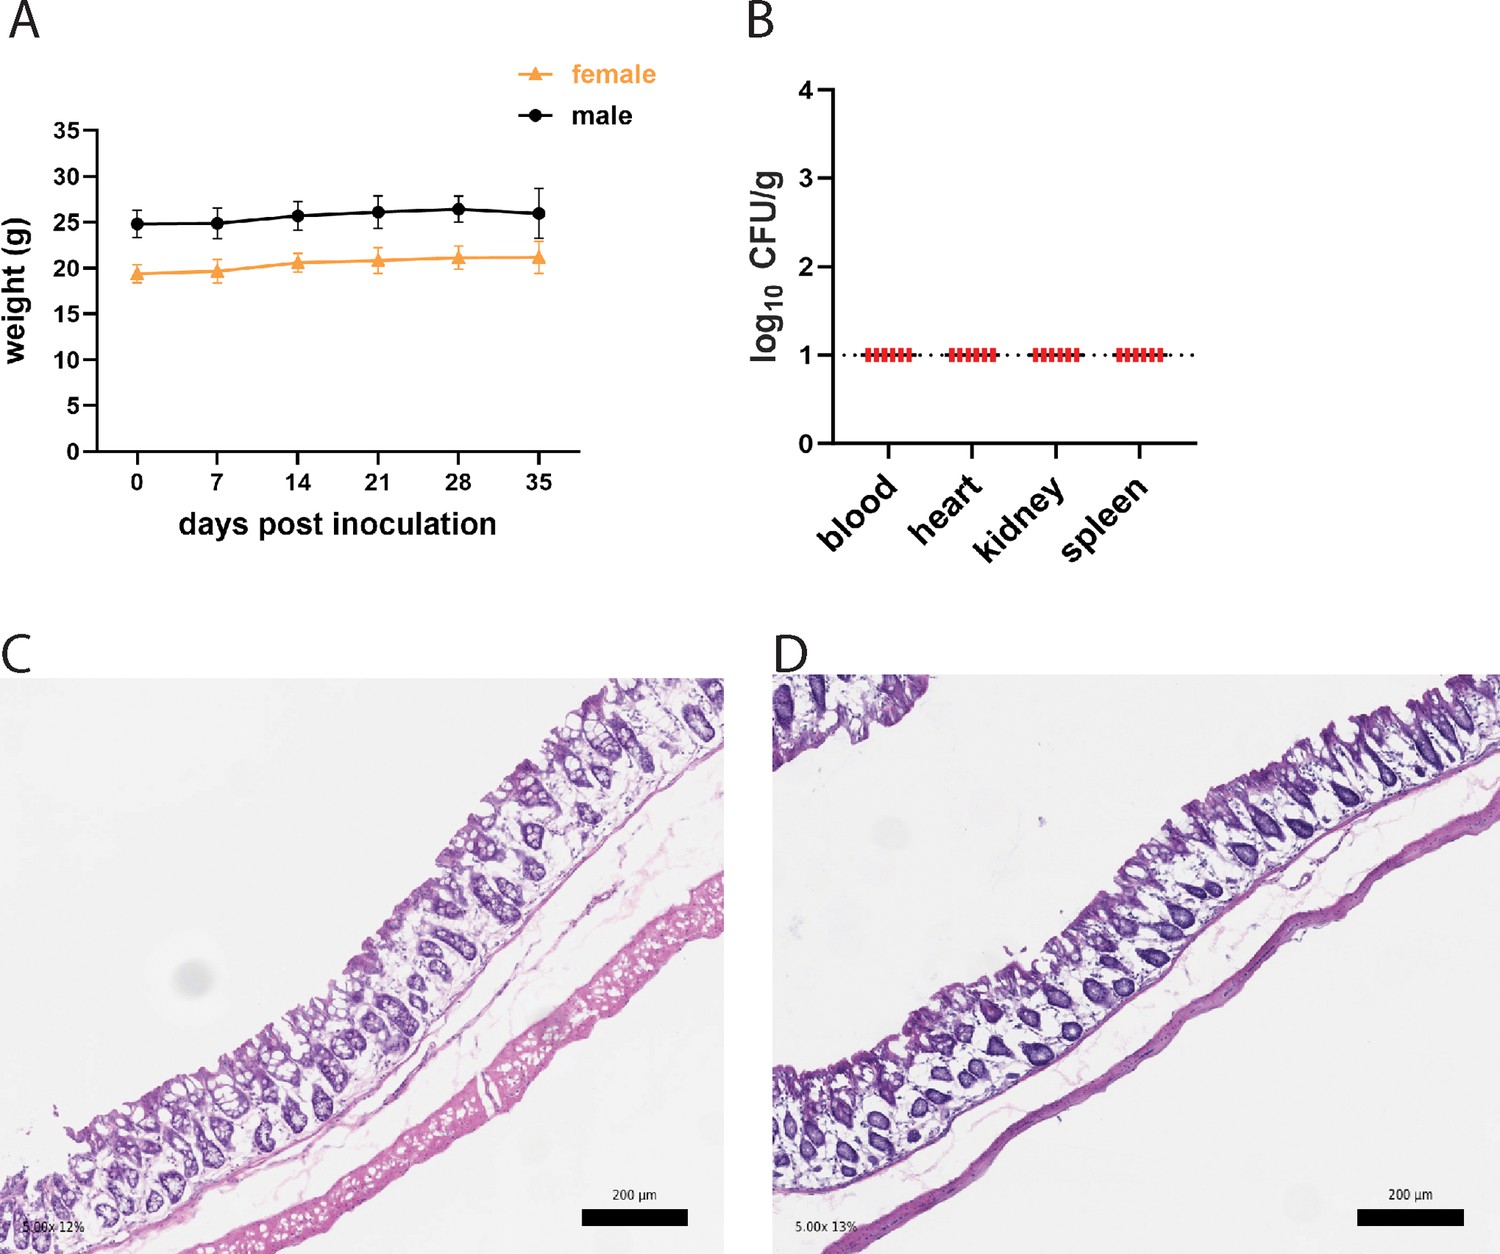
Mice inoculated with methicillin-resistant S. aureus (MRSA) do not display signs of disease.
(A) Weight in grams of B6 mice from NYU and Jackson Laboratory (JAX) following oral inoculation of MRSA. JAX n=23, NYU n=26. Data points represent mean ± SEM. (B) MRSA colony forming units (CFU) in blood, heart, kidney, and spleen following oral inoculation of B6 mice from JAX or NYU. Dots represent individual mice. NYU n = 3, JAX n = 3. (C) Representative image showing hematoxylin and eosin staining of a colonic section 2 days post MRSA inoculation of a male NYU B6 or (D) female NYU B6 mouse. ×5 magnification, scale bar = 200 μm.
Figure 2
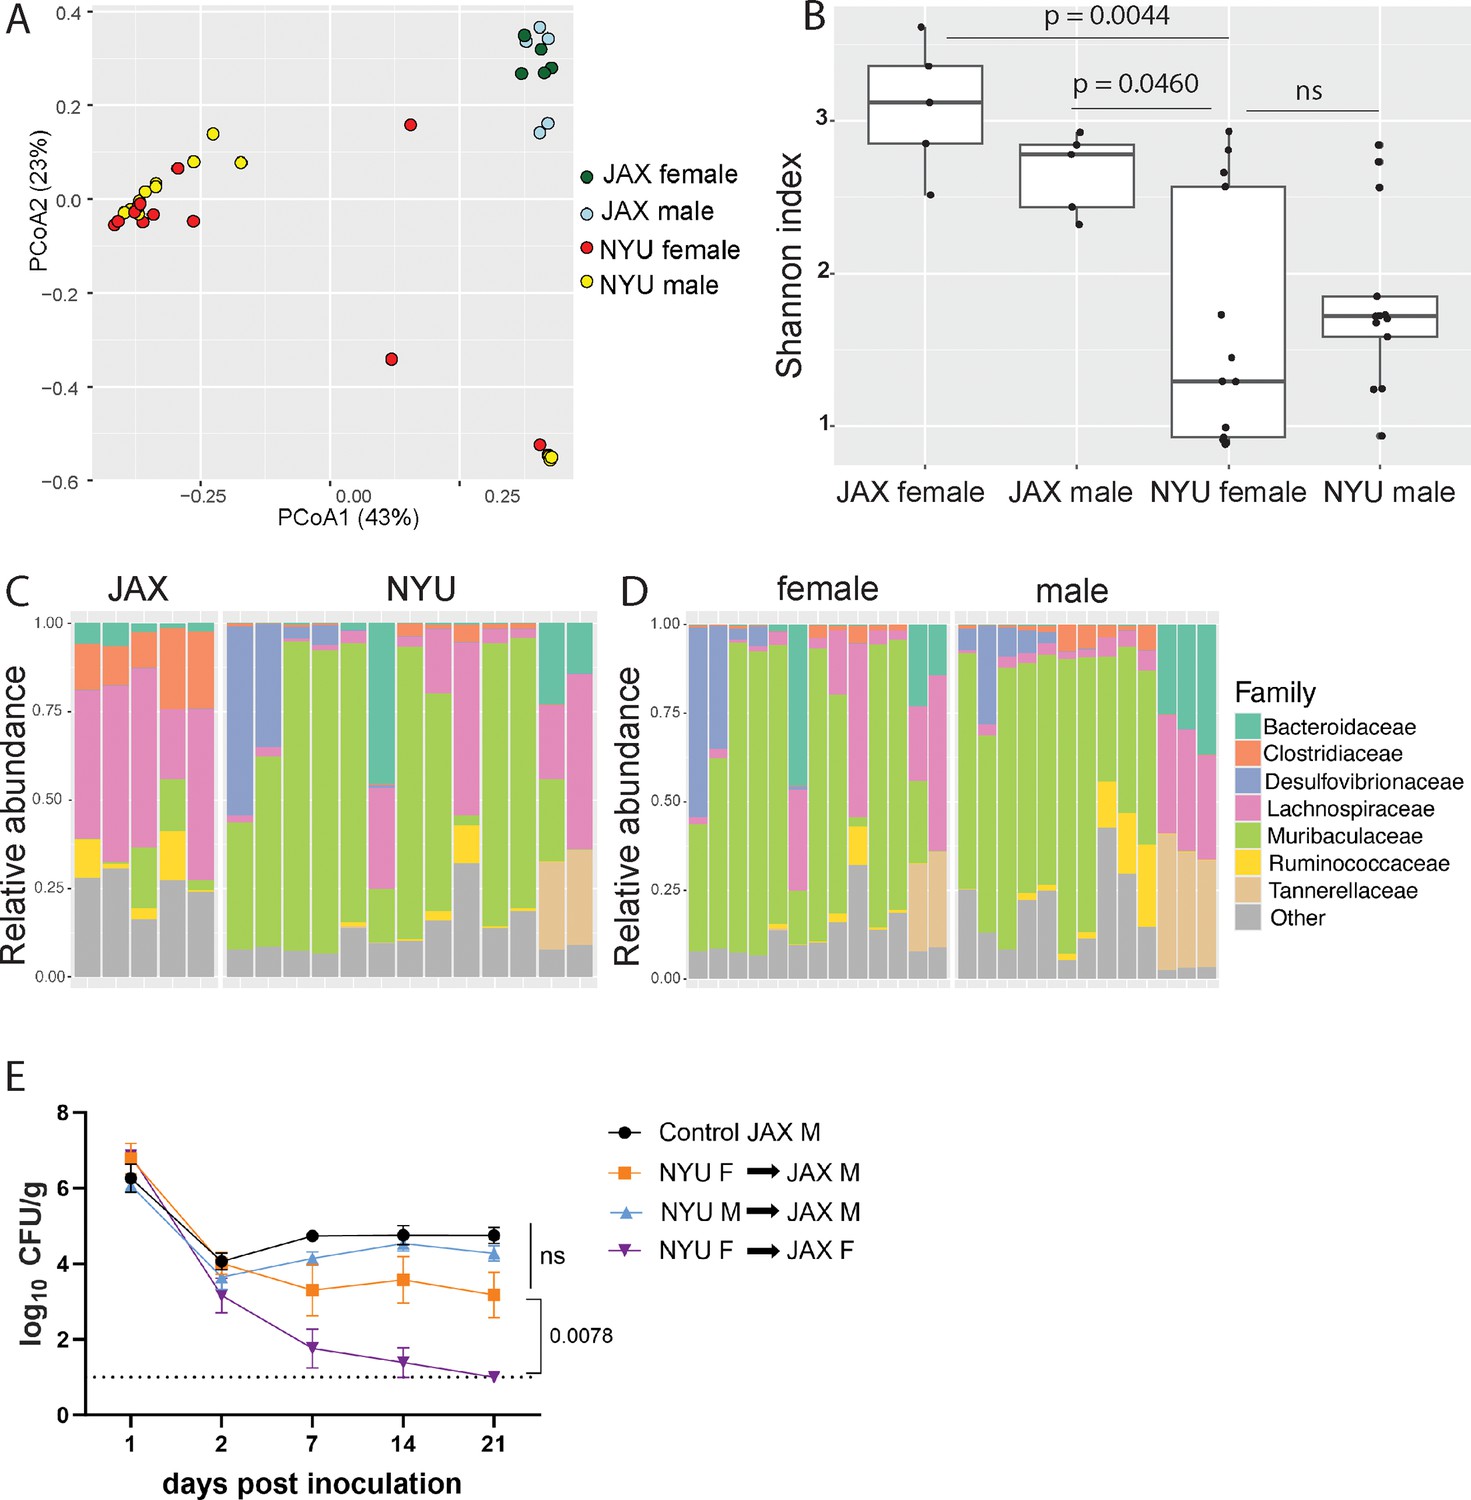
Microbiome is not sufficient to explain sex bias in methicillin-resistant S. aureus (MRSA) gastrointestinal (GI) colonization.
(A) Principal coordinates analysis (PCoA) based on Bray-Curtis distances of 16S sequences obtained from stool of Jackson Laboratory (JAX) and NYU male and female mice prior to MRSA inoculation. Proportion of variance explained by each axes shown in parentheses. JAX M n=5, JAX F n=5, NYU M n=11, NYU F n=13. (B) Alpha diversity of the microbiomes of male and female JAX and NYU mice. Wilcoxon rank sum test used for pairwise statistical comparisons to NYU females; ns: not significant. (C) Relative abundance of bacterial families in female NYU and JAX mice prior to MRSA inoculation. (D) Relative abundance of bacterial families in male and female NYU mice prior to MRSA inoculation. (E) MRSA colony forming units (CFU) in stool following oral inoculation of JAX female (JAX F) and male (JAX M) recipients of fecal microbiota transplantations (FMT) from female (NYU F) and male (NYU M) donor mice compared with JAX male controls (control JAX M) that did not receive an FMT. Mean MRSA burden ± SEM. Area under the curve analysis+one-way ANOVA Sidak’s multiple comparisons test for (E). Control M n=6, M+NYU F stool n=7, M+NYU M stool n=6, F+NYU F stool n=6. ns: not significant.
Figure 3 with 1 supplement
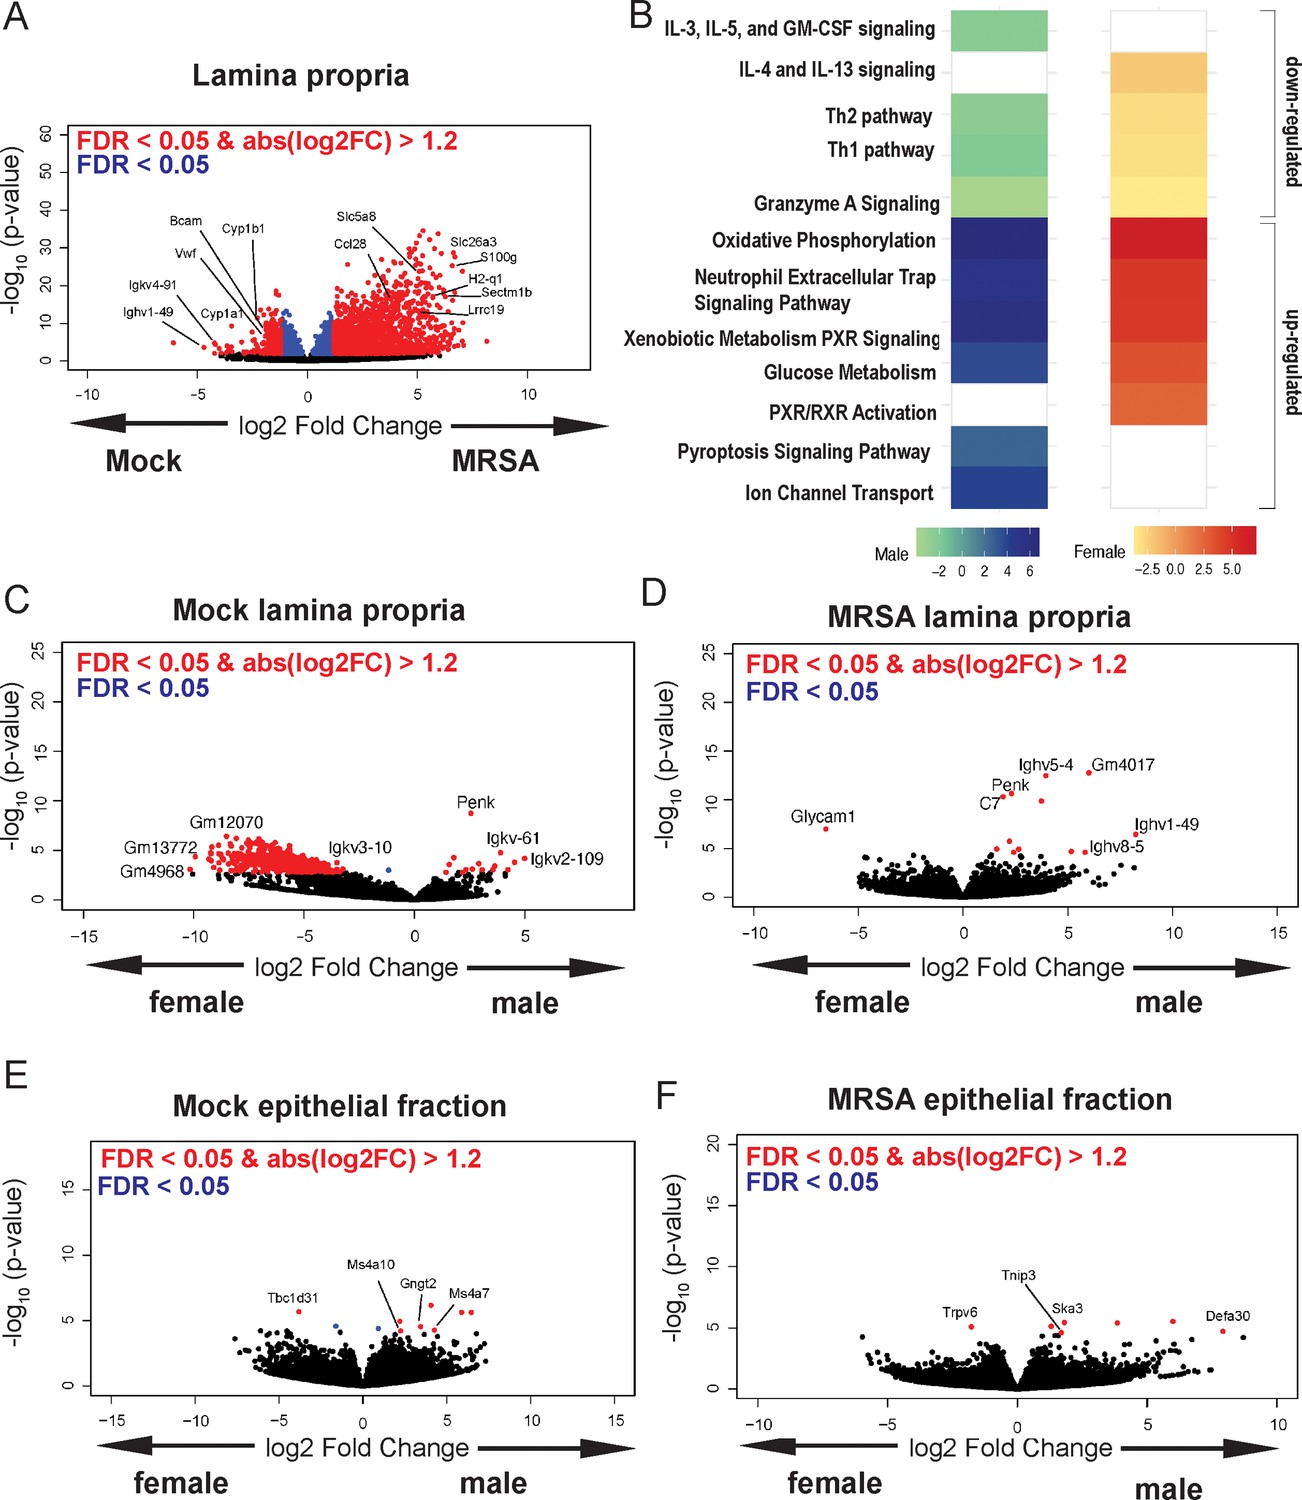
Methicillin-resistant S. aureus (MRSA) gastrointestinal (GI) colonization elicits sex-dependent gene expression changes in the gut.
(A) Volcano plot of differentially expressed genes identified by RNA-seq analyses of the intestinal lamina propria of NYU mice 2 days post inoculation (dpi) with MRSA compared with phosphate-buffered saline (PBS) mock inoculated NYU mice. (B) Ingenuity Pathway Analysis (IPA) of downregulated and upregulated genes in the intestinal lamina propria upon MRSA inoculation of male and female mice. (C) Volcano plot of differentially expressed genes in the intestinal lamina propria comparing mock-treated males and females. (D) Volcano plot of differentially expressed genes in the intestinal lamina propria comparing males and females 2 dpi with MRSA. (E) Volcano plot of differentially expressed genes in the intestinal epithelial fraction of males and females prior to MRSA inoculation. (F) Volcano plot of differentially expressed genes in the intestinal epithelial fraction of males and females 2 dpi with MRSA. Four mice were used for each sequencing experimental condition. Genes shown in red have a false discovery rate (FDR) of <0.05 and an absolute log2 fold change (abslog2FC) of >1.2. Genes shown in blue have a FDR of <0.05. Genes linked to X and Y chromosomes were removed from volcano plots.
Figure 3—figure supplement 1
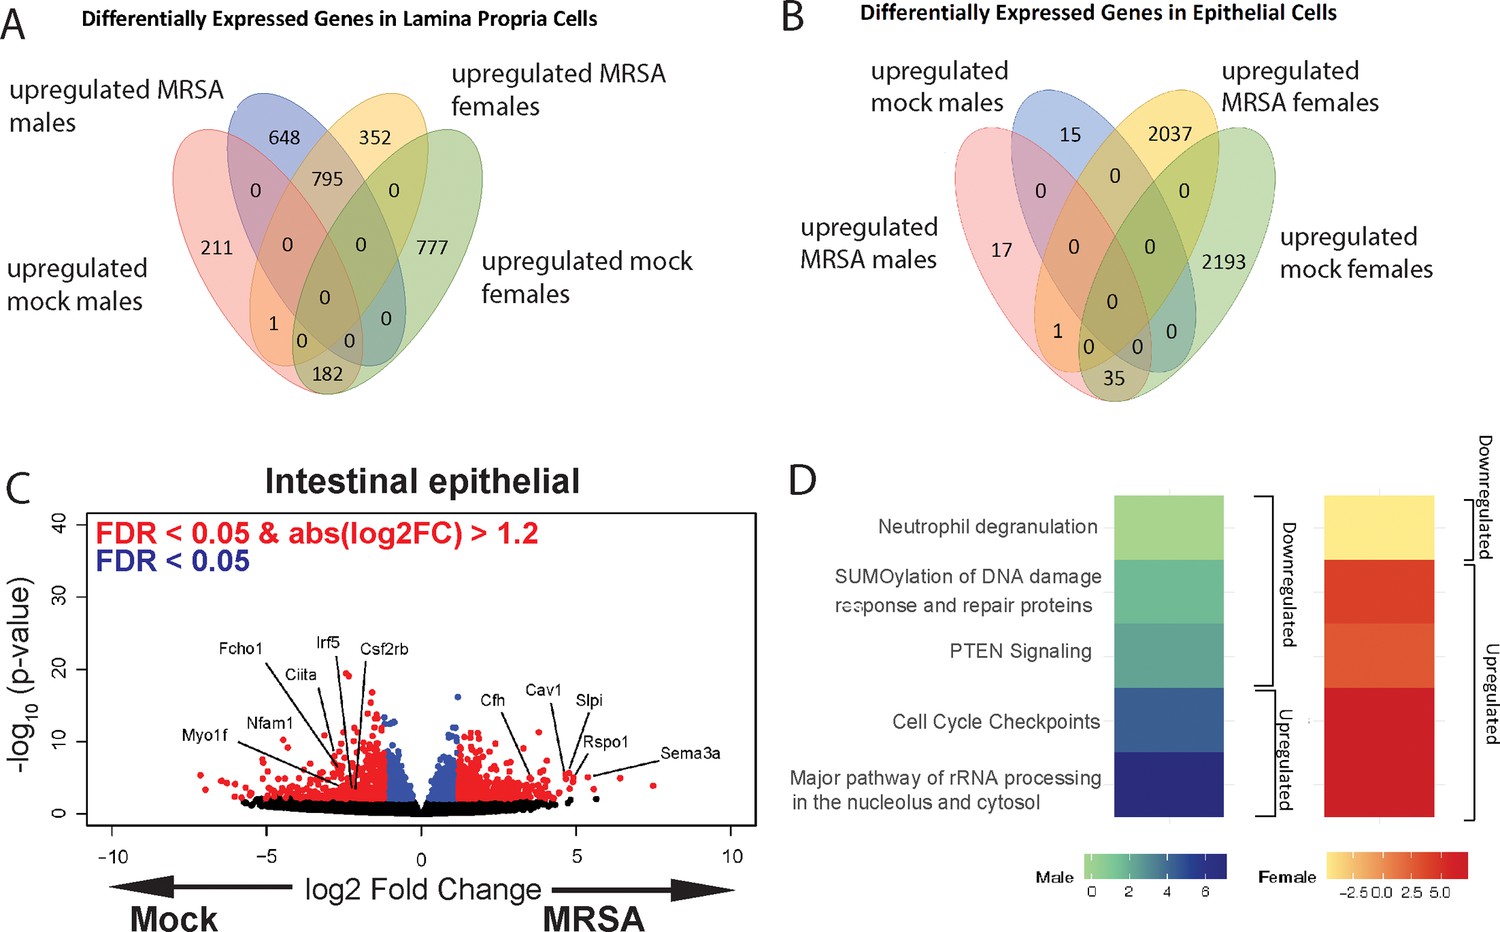
Transcriptional analyses of the intestine following methicillin-resistant S. aureus (MRSA) inoculation.
(A) Venn diagram showing the number of differentially expressed genes in RNA sequencing (RNA-seq) of lamina propria cells comparing mock to 2 days post inoculation (dpi) MRSA conditions between male and female mice. (B) Venn diagram showing the number of differentially expressed genes from RNA-seq of intestinal epithelial cells comparing mock and 2 dpi MRSA conditions between male and female mice. (C) Volcano plot of differentially expressed genes identified by RNA-seq analyses of the intestinal epithelial cells of NYU mice 2 dpi with MRSA compared with phosphate-buffered saline (PBS) mock inoculated NYU mice. (D) Ingenuity Pathway Analysis (IPA) of downregulated and upregulated genes in colonic epithelial cells upon MRSA inoculation of male and female mice. Four mice were used for each sequencing experimental condition. Genes shown in red have a false discovery rate (FDR) of <0.05 and an absolute log2 fold change (abslog2FC) of >1.2. Genes shown in blue have an FDR of <0.05. Genes linked to X and Y chromosomes were removed from volcano plots.
Figure 4 with 1 supplement
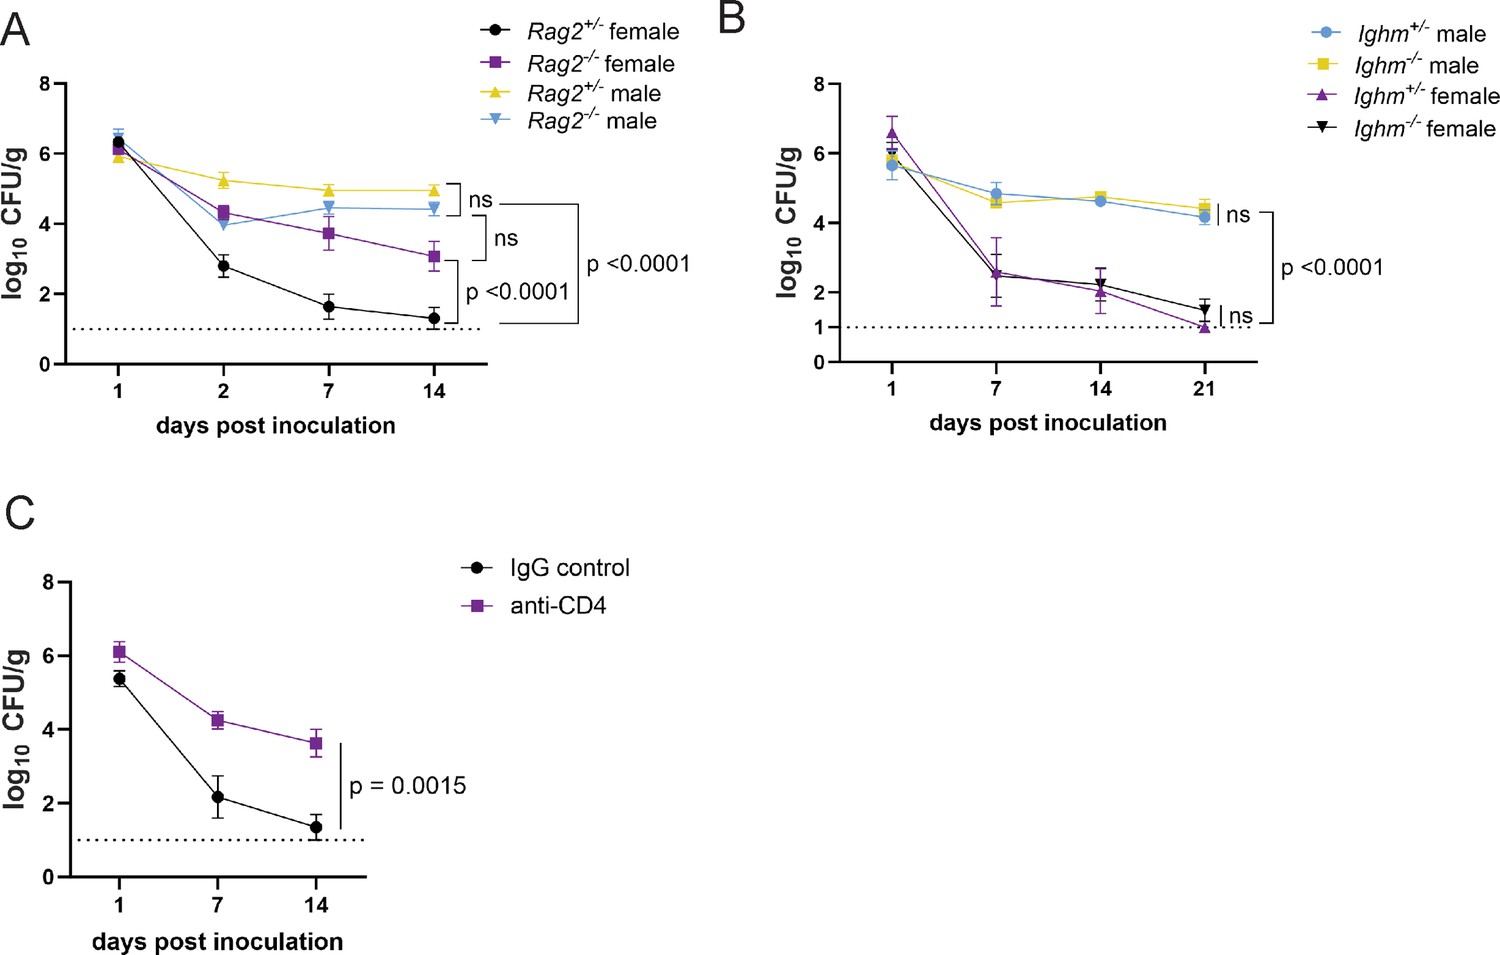
CD4+ T cells mediate colonization resistance in female mice.
(A) Methicillin-resistant S. aureus (MRSA) colony forming units (CFU) in stool following oral inoculation of Rag2−/− and Rag2+/− mice bred at NYU. Male Rag2−/− n=12, male Rag2+/− n=12, female Rag2−/− n=12, female Rag2+/− n=11. (B) MRSA CFU in stool following oral inoculation of Ighm−/− and Ighm+/− mice bred at NYU. Male Ighm−/− n=6, male Ighm+/− n=6, female Ighm−/− n=8, female Ighm+/− n=5. (C) MRSA CFU in stool following oral inoculation of female NYU B6 mice injected intraperitoneally (IP) with 250 μg of anti-CD4 depleting antibody or anti-IgG control. Anti-IgG n=8, anti-CD4 n=10. Data points represent mean ± SEM from at least two independent experiments. Statistical analysis: area under the curve analyzed by a one-way ANOVA with Sidak’s multiple comparison test for (A) and (B) and a two-tailed t-test for (C). ns: not significant.
Figure 4—figure supplement 1
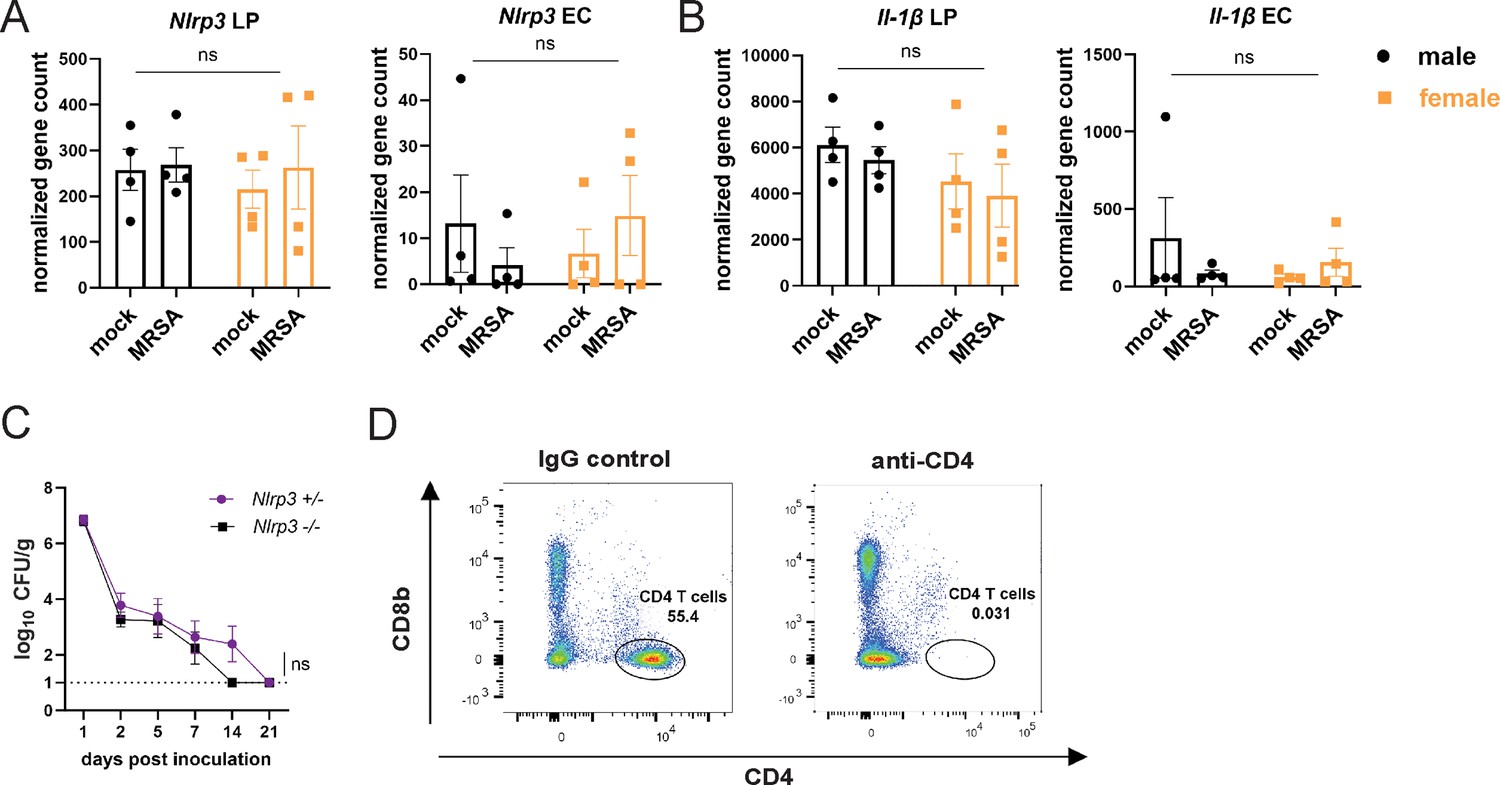
NLRP3 inflammasome activation is not required for methicillin-resistant S. aureus (MRSA) colonization resistance in female NYU mice.
(A) Nlrp3 gene counts from bulk RNA sequencing (RNA-seq) analysis from cells isolated from the colon lamina propria (LP) or colon epithelial cells (EC). (B) Il-1β gene counts from bulk RNA-seq analysis from cells isolated from the colon lamina propria (LP) or colon epithelial cells (EC). (C) MRSA colony forming units (CFU) in stool following oral inoculation of Nlrp3−/− and Nlrp3+/− mice bred at NYU. Nlrp3−/− n=6, Nlrp3+/− n=6. (D) Representative flow gating to confirm depletion of CD4+ T cells in colon lamina propria 3 days post injection. Data points represent mean ± SEM from at least two independent experiments. Statistical analysis: area under the curve followed by a two-tailed t-test. ns: not significant.
Figure 5 with 2 supplements
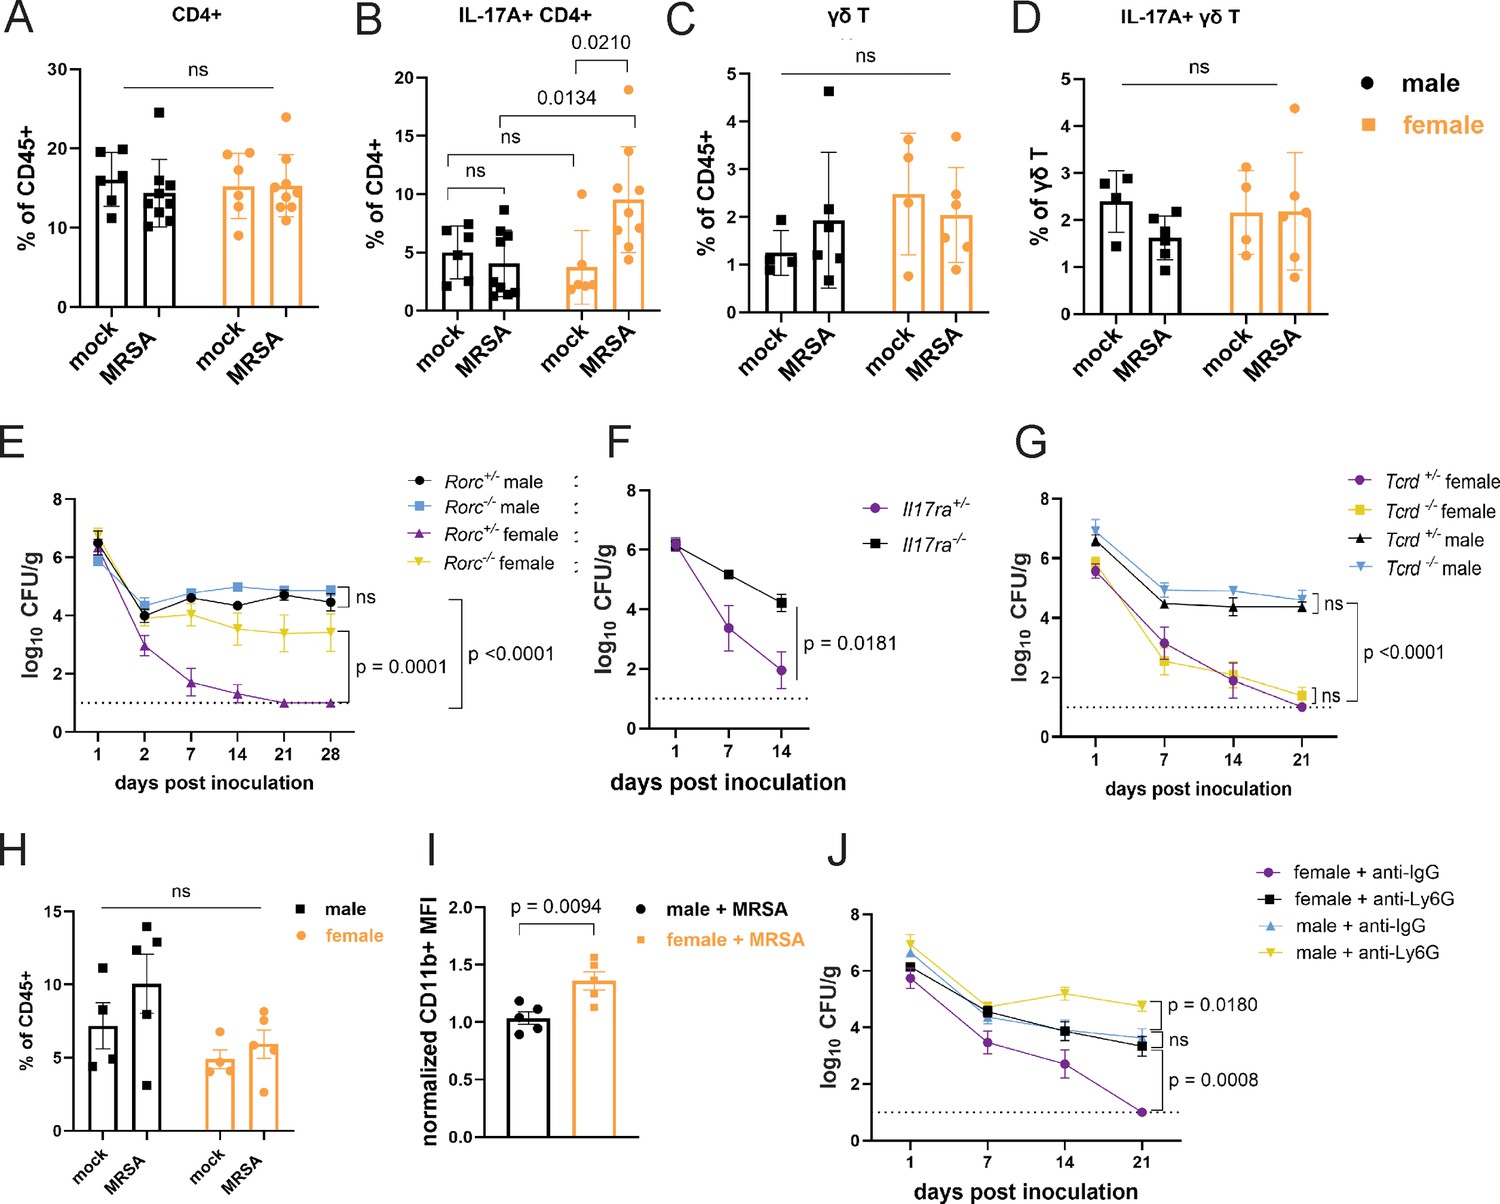
Female mice have increased IL-17A+ CD4+ T cells and require neutrophils for methicillin-resistant S. aureus (MRSA) clearance.
(A) Flow cytometry of cecal-colonic lamina propria CD4+ T cells as a percentage of CD45+ cells in male and female NYU mice treated with phosphate-buffered saline (PBS) or MRSA 2 days post inoculation (dpi). (B) Flow cytometry of cecal-colonic lamina propria IL17A+ CD4+ T cells as a percentage of total CD4+ T cells in male and female NYU mice treated with PBS or MRSA 2 dpi. (C) Flow cytometry of cecal-colonic lamina propria γδ T cells as a percentage of CD45+ cells in male and female NYU mice treated with PBS or MRSA 2 dpi. (D) Flow cytometry of cecal-colonic lamina propria IL17A+ γδ T cells as a percentage of total CD4+ T cells in male and female NYU mice treated with PBS or MRSA 2 dpi. (E) MRSA colony forming units (CFU) in stool following oral inoculation of Rorc−/− and Rorc+/− mice bred at NYU. Male Rorc+/− n = 5, male Rorc−/− n=7, female Rorc+/− n = 9, female Rorc−/− n=9. (F) MRSA CFU in stool following oral inoculation of female Il17ra+/- and Il17ra-/- mice bred at NYU. Il17ra+/- n = 6, Il17ra-/- n=6. (G) MRSA CFU in stool following oral inoculation of Tcrd+/− and Tcrd−/− mice bred at NYU. Male Tcrd+/− n = 6, male Tcrd−/− n=6, female Tcrd+/− n=8, and female Tcrd−/− n=12. (H) Flow cytometry of cecal-colonic lamina propria Ly6G+CD11b+ neutrophils as a percentage of CD45+ cells in male and female NYU mice treated with PBS or MRSA 2 dpi. (I) Quantification of mean fluorescence intensity (MFI) of surface CD11b on neutrophils by flow cytometry normalized to mock-treated controls. (J) MRSA CFU in stool following oral inoculation of NYU B6 mice treated with anti-Ly6G neutrophil depleting antibody or anti-IgG control. Male anti-IgG n=6, male anti-Ly6G n=8, female anti-IgG n = 12, and female anti-CD4+ n = 15. Data points represent mean ± SEM from at least two independent experiments. Statistical analysis: two-way ANOVA+Sidak’s multiple comparisons test for (A–D) and (H), area under the curve followed by a one-way ANOVA+Sidak’s multiple comparisons test for (E), (G), (J) or a two-tailed t-test for (F) and a two-tailed t-test for (I). ns: not significant.
Figure 5—figure supplement 1
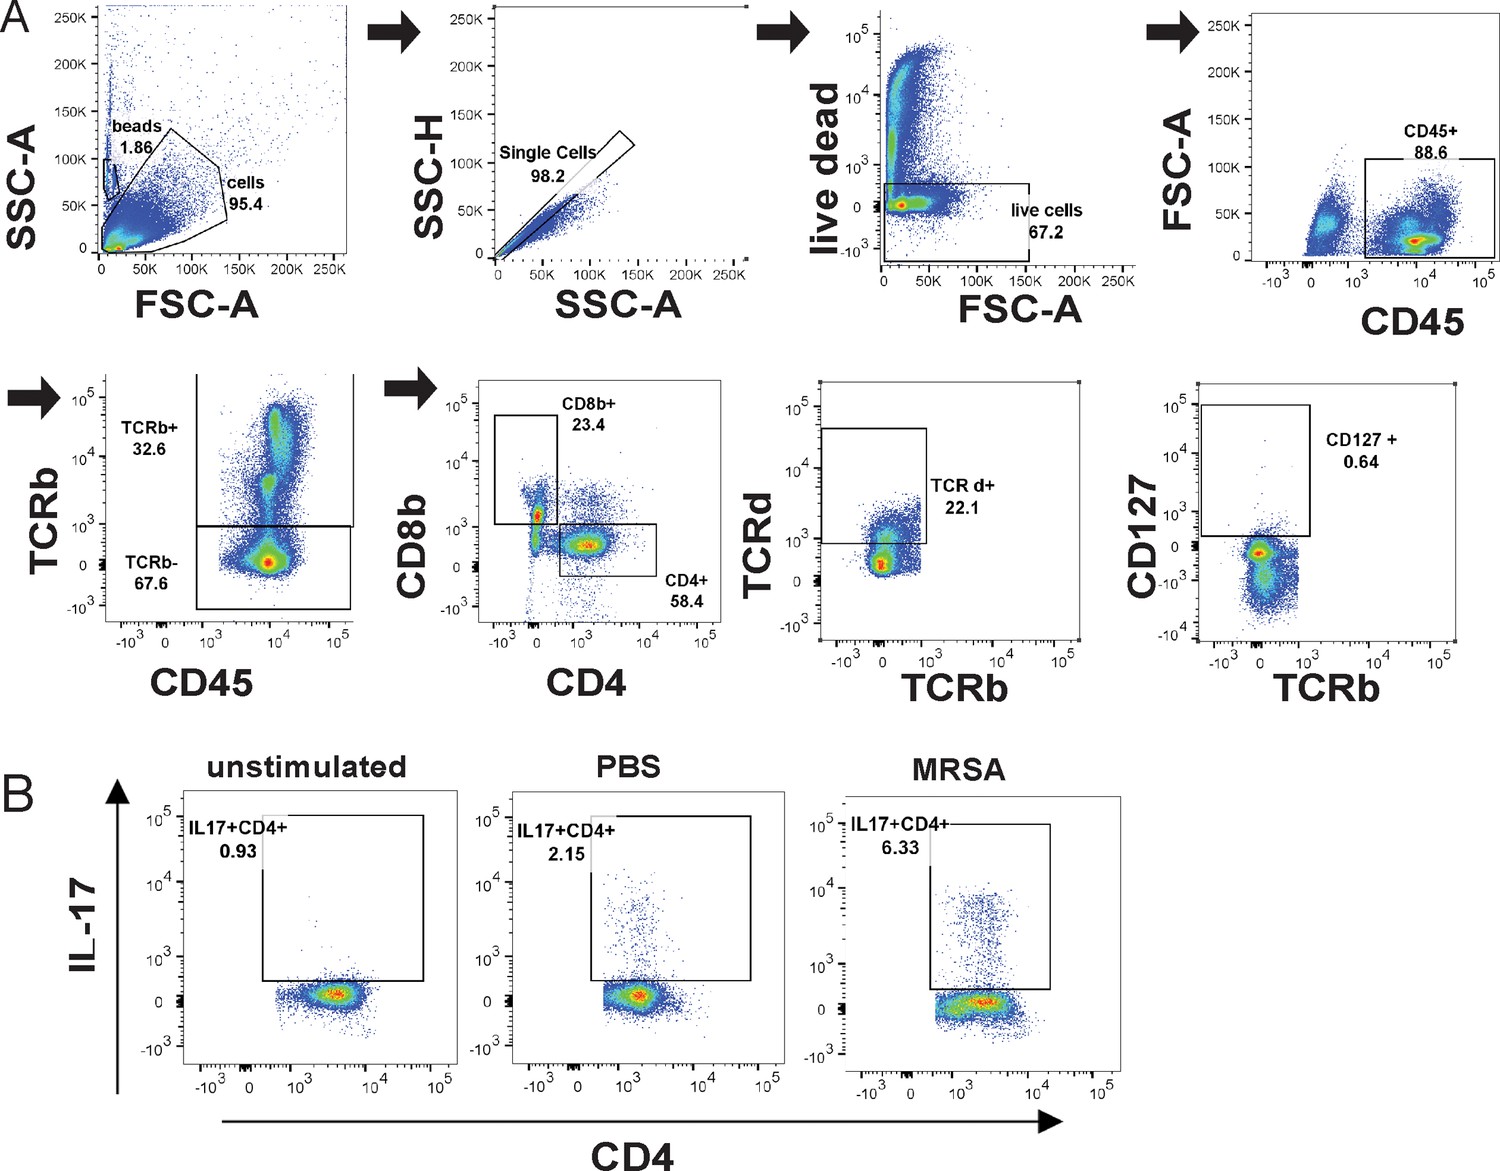
Flow cytometry gating scheme for lymphoid subsets in the lamina propria.
(A) Flow cytometry gating scheme for innate lymphoid cells (ILCs), CD4+ and γδ T cell populations. (B) Representative sample gating of IL17A+ CD4+ populations in unstimulated, mock and 2 days post inoculation (dpi) methicillin-resistant S. aureus (MRSA)-treated samples.
Figure 5—figure supplement 2
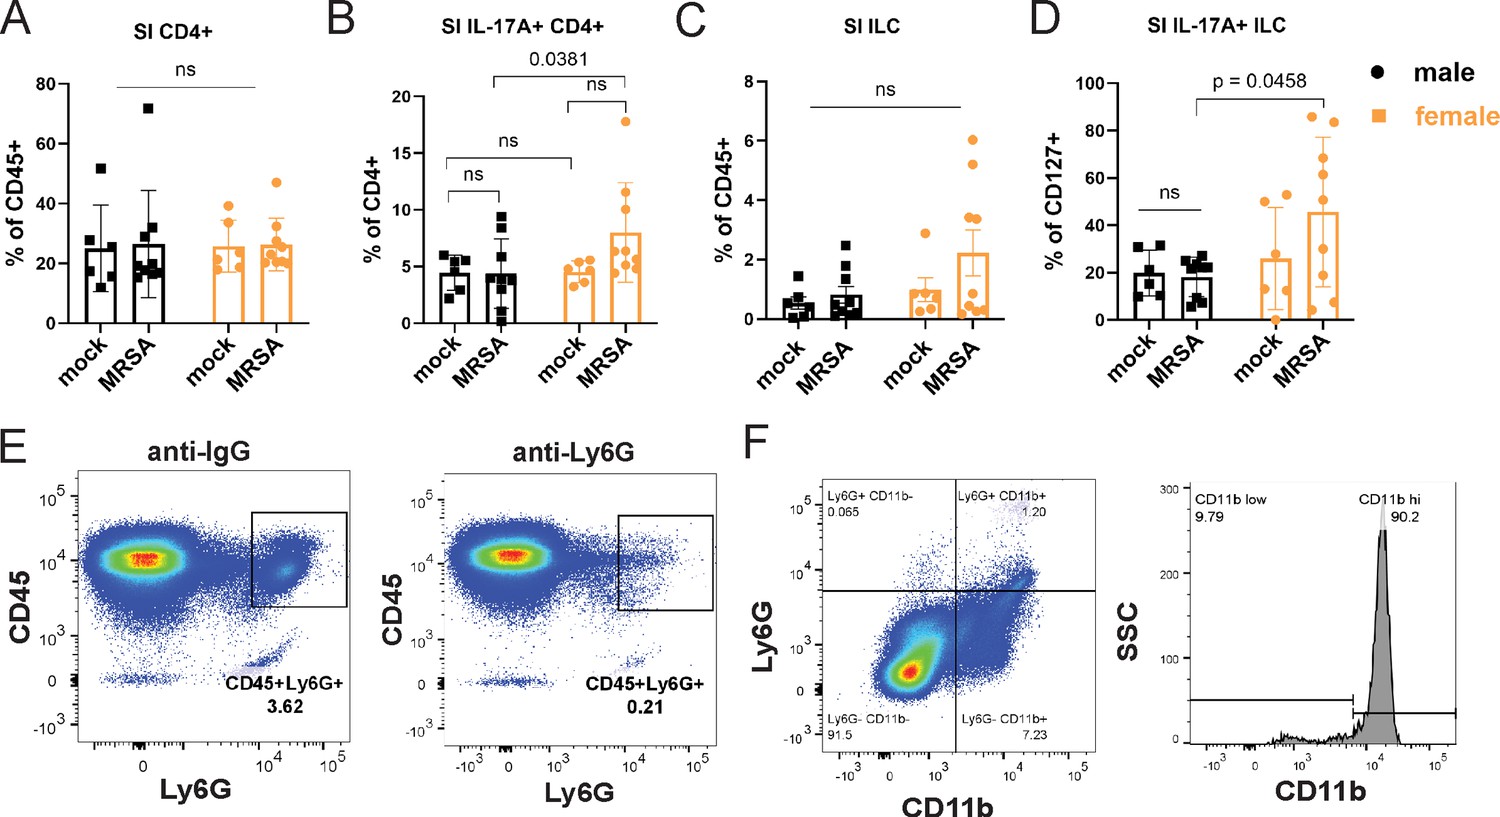
Immune cell populations detected by flow cytometry.
(A) Flow cytometry of small intestinal (SI) lamina propria CD4+ T cells as a percentage of CD45+ cells in male and female NYU mice treated with phosphate-buffered saline (PBS) or methicillin-resistant S. aureus (MRSA) 2 days post inoculation (dpi). (B) Flow cytometry of SI lamina propria IL-17A+ CD4+ T cells as a percentage of total CD4+ T cells in male and female NYU mice treated with PBS or MRSA 2 dpi. (C) Flow cytometry of cecal-colonic lamina propria CD127+ innate lymphoid cells (ILCs) as a percentage of CD45+ in male and female NYU mice treated with PBS or MRSA 2 dpi. (D) Flow cytometry of cecal-colonic lamina propria IL17A+ ILCs as a percentage of total ILCs in male and female NYU mice treated with PBS or MRSA 2 dpi. (E) Representative flow gating of CD45+ Ly6G+ cells isolated from the spleens of B6 NYU mice treated with anti-Ly6G neutrophil depleting antibody or anti-IgG control. (F) Representative flow cytometry gating plot of CD45+Ly6G+CD11b+ neutrophils isolated from the cecal-colonic tissue of B6 NYU mice treated with a PBS mock control or MRSA. Representative flow cytometry gating plot of CD11b mean fluorescent intensity (MFI) of Ly6G+CD11b+ neutrophils. Data points represent mean ± SEM from at least two independent experiments. Statistical analysis: two-way ANOVA+Sidak’s multiple comparisons test for (A–D). ns: not significant.
Figure 6 with 1 supplement
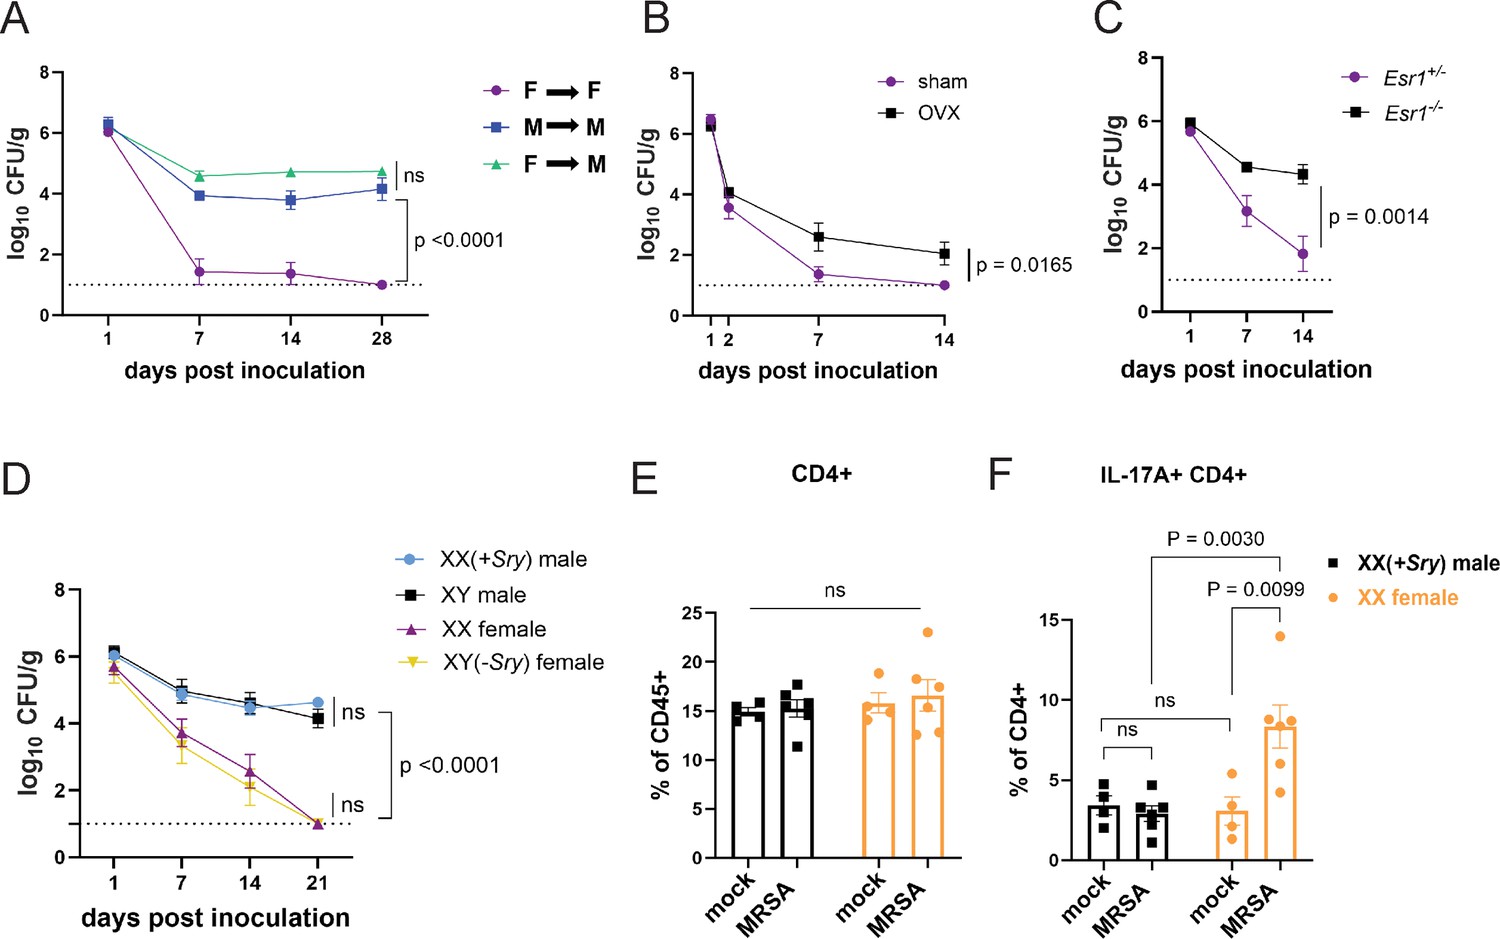
Sex hormones, not sex chromosomes, mediate methicillin-resistant S. aureus (MRSA) colonization resistance in female mice.
(A) MRSA colony forming units (CFU) in stool following oral inoculation of male or female mice that were irradiated and reconstituted with bone marrow (BM) from donor male or female mice. Female BM into female recipients (F→F) n=8, male BM into male recipients (M→M) n=7, female BM into male recipients (F→M) n=8. (B) MRSA CFU in stool following oral inoculation of ovariectomized female mice or sham operated littermate controls. Ovariectomized (OVX) n=10, sham n=10. (C) MRSA CFU in stool following oral inoculation of Esr1+/- and Esr1-/- female mice bred at NYU. Esr1+/- n = 6, Esr1-/- n=6. (D) MRSA CFU in stool following oral inoculation of four core genotype mice. XX n=5, XY(-Sry) n=5. XY n=5, XX(+Sry) n=4. (E) CD4+ T cells from cecal-colonic lamina propria of XX females and XX(+Sry) males 2 days post inoculation (dpi) inoculation with MRSA or mock control. (F) Percentage of IL-17A+CD4+ T cells in cecal-colonic lamina propria of XX females and XX(+Sry) males 2 dpi inoculation with MRSA or mock control. Data points represent mean ± SEM from at least two independent experiments. Statistical analysis: area under the curve followed by a one-way ANOVA with Sidak’s multiple comparisons for (A, C) and two-tailed t-test for (B, F) and two-way ANOVA+Sidak’s multiple comparisons test for (D–E). ns: not significant.
Figure 6—figure supplement 1
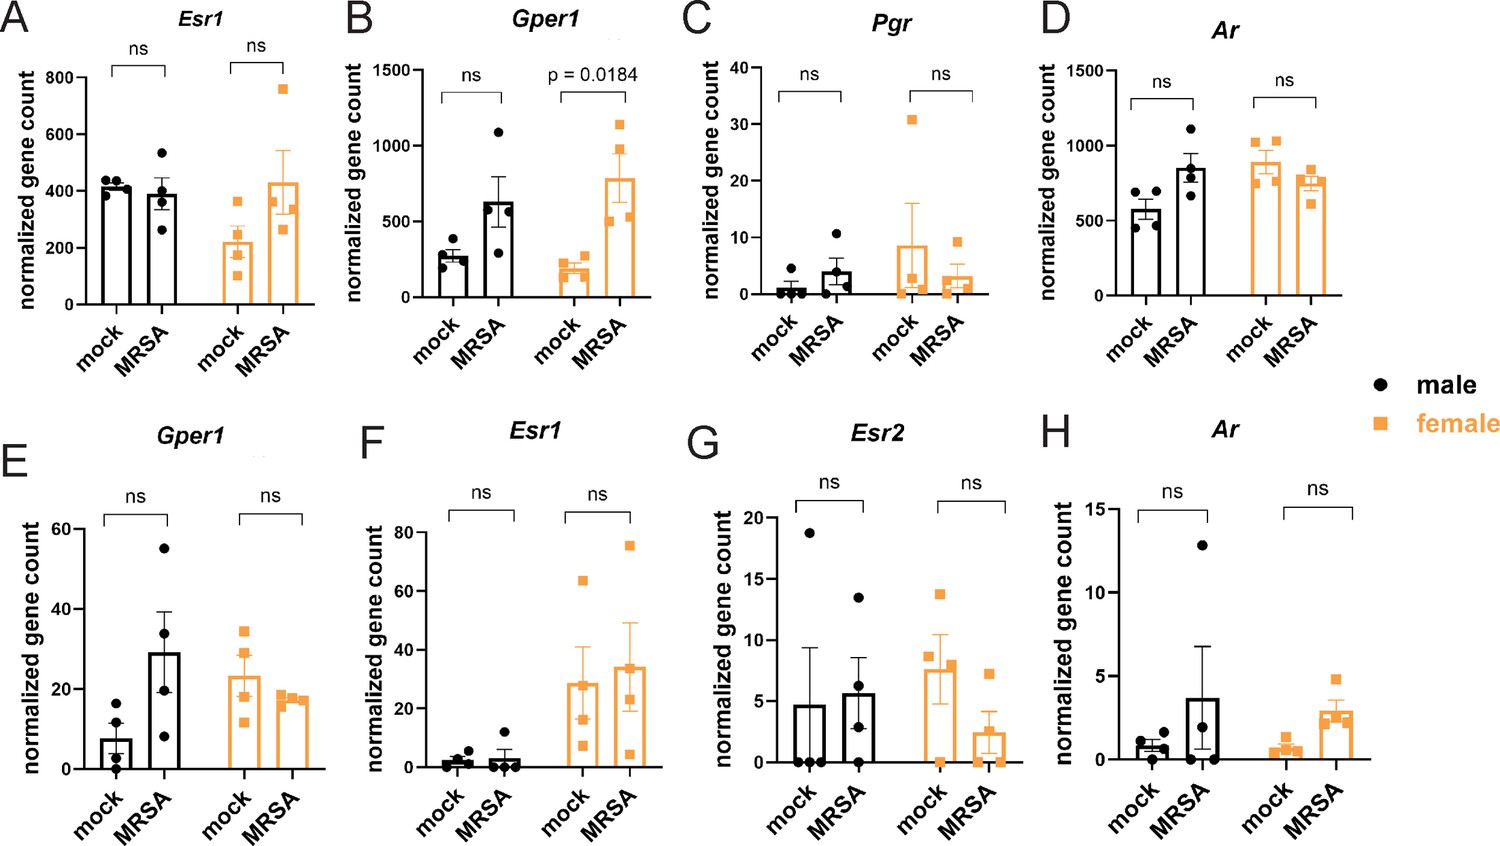
Sex hormone receptor expression in cecal-colonic lamina propria immune and epithelial cells.
(A) Estrogen receptor alpha (Esr1) gene counts. (B) G-protein coupled estrogen receptor 1 (Gper1) expression gene counts. (C) Progesterone receptor (Pgr) gene counts. (D) Androgen receptor (Ar) gene counts. All gene counts are from bulk RNA sequencing analysis from cells isolated from the cecal-colonic lamina propria for (A–D). (E) G-protein coupled receptor (Gper1) expression gene counts. (F) Estrogen receptor alpha (Esr1) gene counts. (G) Estrogen receptor beta (Esr2) gene counts. (H) Androgen receptor (Ar) gene counts from bulk RNA sequencing analysis. All gene counts are from bulk RNA sequencing analysis from cells isolated from the cecal-colonic epithelial for (E–H). Data points represent mean ± SEM from at least two independent experiments. Statistical analysis: two-way ANOVA+Sidak’s multiple comparisons test. ns: not significant.
Author response image 1
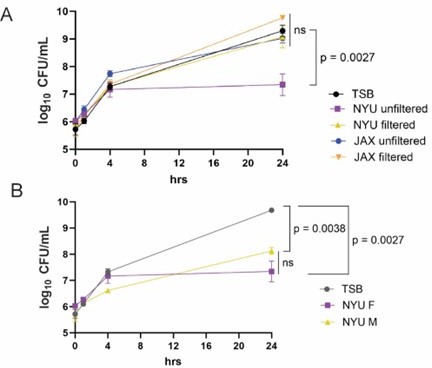
Stool from NYU mice inhibits MRSA growth in vitro.
(A) MRSA CFU/mL in media (TSB) following culture with unfiltered or filtered stool homogenate from female NYU or JAX mice. Stool homogenate or TSB alone was added in a 1:1 ratio to 1x10⁶ CFU/mL MRSA and cultured anaerobically for up to 24 hours. (B) MRSA CFU/mL in TSB following culture with unfiltered stool homogenate from NYU male or female mice. Stool homogenate or TSB alone was added in a 1:1 ratio to 1x10⁶ CFU/mL MRSA. 3 experimental replicates performed; stool taken from 6 individual mice per condition. Mean MRSA burden ± SEM. Area under the curve analysis + One way ANOVA with Sidak’s multiple comparisons test. ns: not significant.
Author response image 2

Estradiol levels in stool samples prior to MRSA inoculation.
(A) Estradiol levels in stool samples collected prior to MRSA inoculation in male and female mice bred at NYU or purchased from Jackson Labs. Frozen stool samples were normalized by weight and processed using the DetectX Estradiol ELISA Kit (Arbor Assays).
Additional files
Download links
A two-part list of links to download the article, or parts of the article, in various formats.
Downloads (link to download the article as PDF)
Open citations (links to open the citations from this article in various online reference manager services)
Cite this article (links to download the citations from this article in formats compatible with various reference manager tools)
Sex-dependent gastrointestinal colonization resistance to MRSA is microbiota and Th17 dependent
eLife 13:RP101606.
https://doi.org/10.7554/eLife.101606.3


