Non-destructive in situ monitoring of structural changes of 3D tumor spheroids during the formation, migration, and fusion process
- Key Laboratory of Luminescence Analysis and Molecular Sensing, Ministry of Education, Institute for Clean Energy and Advanced Materials, School of Materials and Energy, Southwest University, China
- Key Laboratory of Animal Biological Products & Genetic Engineering, Ministry of Agriculture and Rural, Sinopharm Animal Health Corporation Ltd, China
- State Key Laboratory of Novel Vaccines for Emerging Infectious Diseases, China National Biotec Group Company Limited, China
- School of Computer and Information Science, Southwest University, China
Figures
Figure 1

Validation of the non-destructive in situ observation of three-dimensional (3D) spheroids by the side-view observation device.
(A) The illustration of the side-view observation device. (B) Exploded view diagram of the side-view observation device. (C) The definition of the bottom- and the side-view of a spheroid sample. (D) The working principle of the device. (E) The photo of the petri dish mounted on the sample stage of the microscope. (F) The 0.3 mm round-type microscope calibration slide for side-view observation. (G) The bottom- and side-view images of the 0.03 mm microscope calibration slide were captured with different objective lenses. (H) The length of the 0.3 mm dot measured from the bottom- and side-view captured images. (I) A 0.03 mm line-type microscope calibration slide was vertically fixed to a base positioned at a 90° angle to the start of another microscope calibration slide. (J) The photograph of the microscope calibration slide and the image of the edge of the first-surface mirror (gray part) by the microscope. (K) The images were captured with the distance between the mirror and the sample at 2, 3, and 4 mm. (L) The length of the 0.3 mm line-type calibration slide measured from the bottom- and side-view images captured with the distance between the mirror and the sample at 2, 3, and 4 mm. (M) The optical path in the cell culture medium and the chromatic aberration generated. (N) The fitting curve between NA and relative offset distance between 486.1 and 656.3 nm (∆l) when d is 1, 2, 3, and 4 mm. (O) The bottom- and side-view images of 0.03 mm microscope calibration slide captured with 4×, 10×, 20×, and 40× objective lenses in ddH2O and DMEM medium. (P) The length of the 0.3 mm line-type calibration slide was measured in ddH2O and DMEM mediums through the bottom and side views (error bars = SD, n = 5).
Figure 2
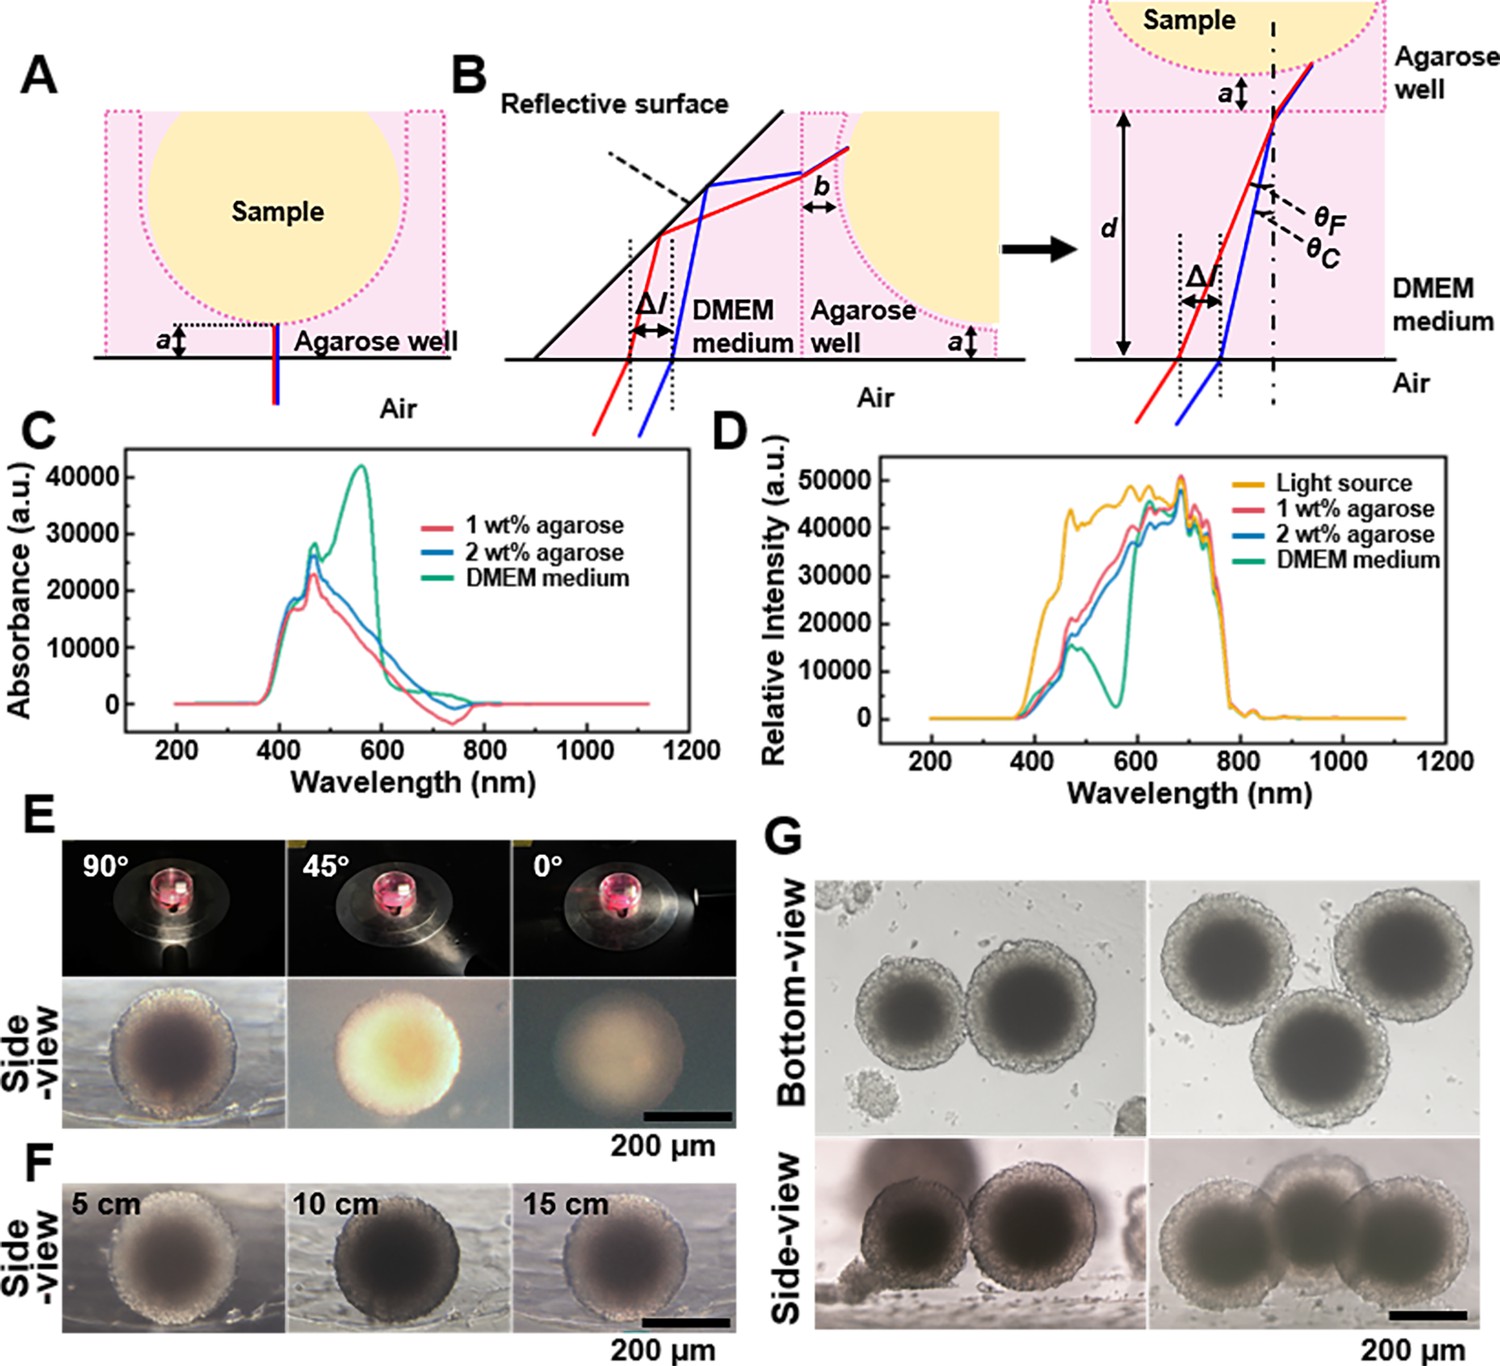
Spheroids’ observation and imaging setup.
(A) Light path of the bottom-view observation of the spheroid in the agarose micro-well. (B) Light path of side-view observing of the spheroid in the agarose micro-well. (C) The absorption spectrum of the 1 wt% agarose, 2 wt% agarose, and DMEM culture medium. (D) The spectra of the 1 wt% agarose, 2 wt% agarose, and DMEM culture medium using the CEL-TCX250 Xenon lamp light source. (E) Images quality display of spheroid under the 90°, 45°, and 0° lighting. (F) Images display of the spheroids under 5, 10, and 15 cm lighting. (G) Using the side-view observation petri dish/device can be used to photograph multi-spheroids samples.
Figure 3
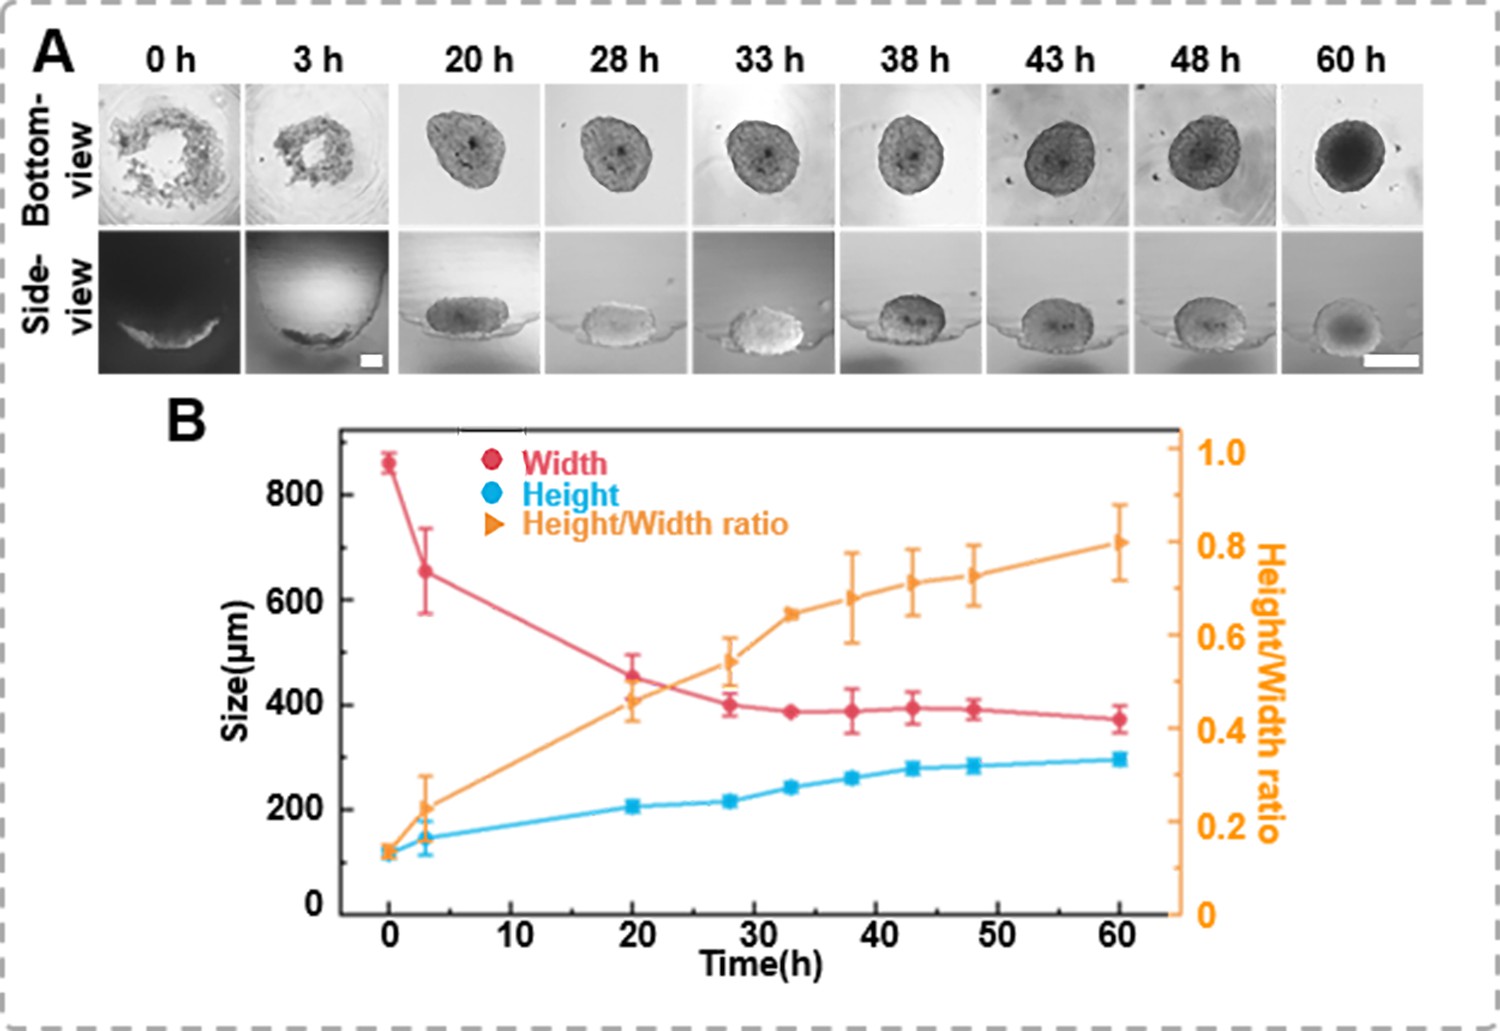
The formation dynamics of the spheroids.
(A) Time-lapse images of DU 145 spheroid formation in an agarose well (1 × 10⁴ cells/well, scale bar = 100 μm). (B) Changes in height and width during the growth process of the spheroids, as well as variations in height-to-width ratio.
Figure 4
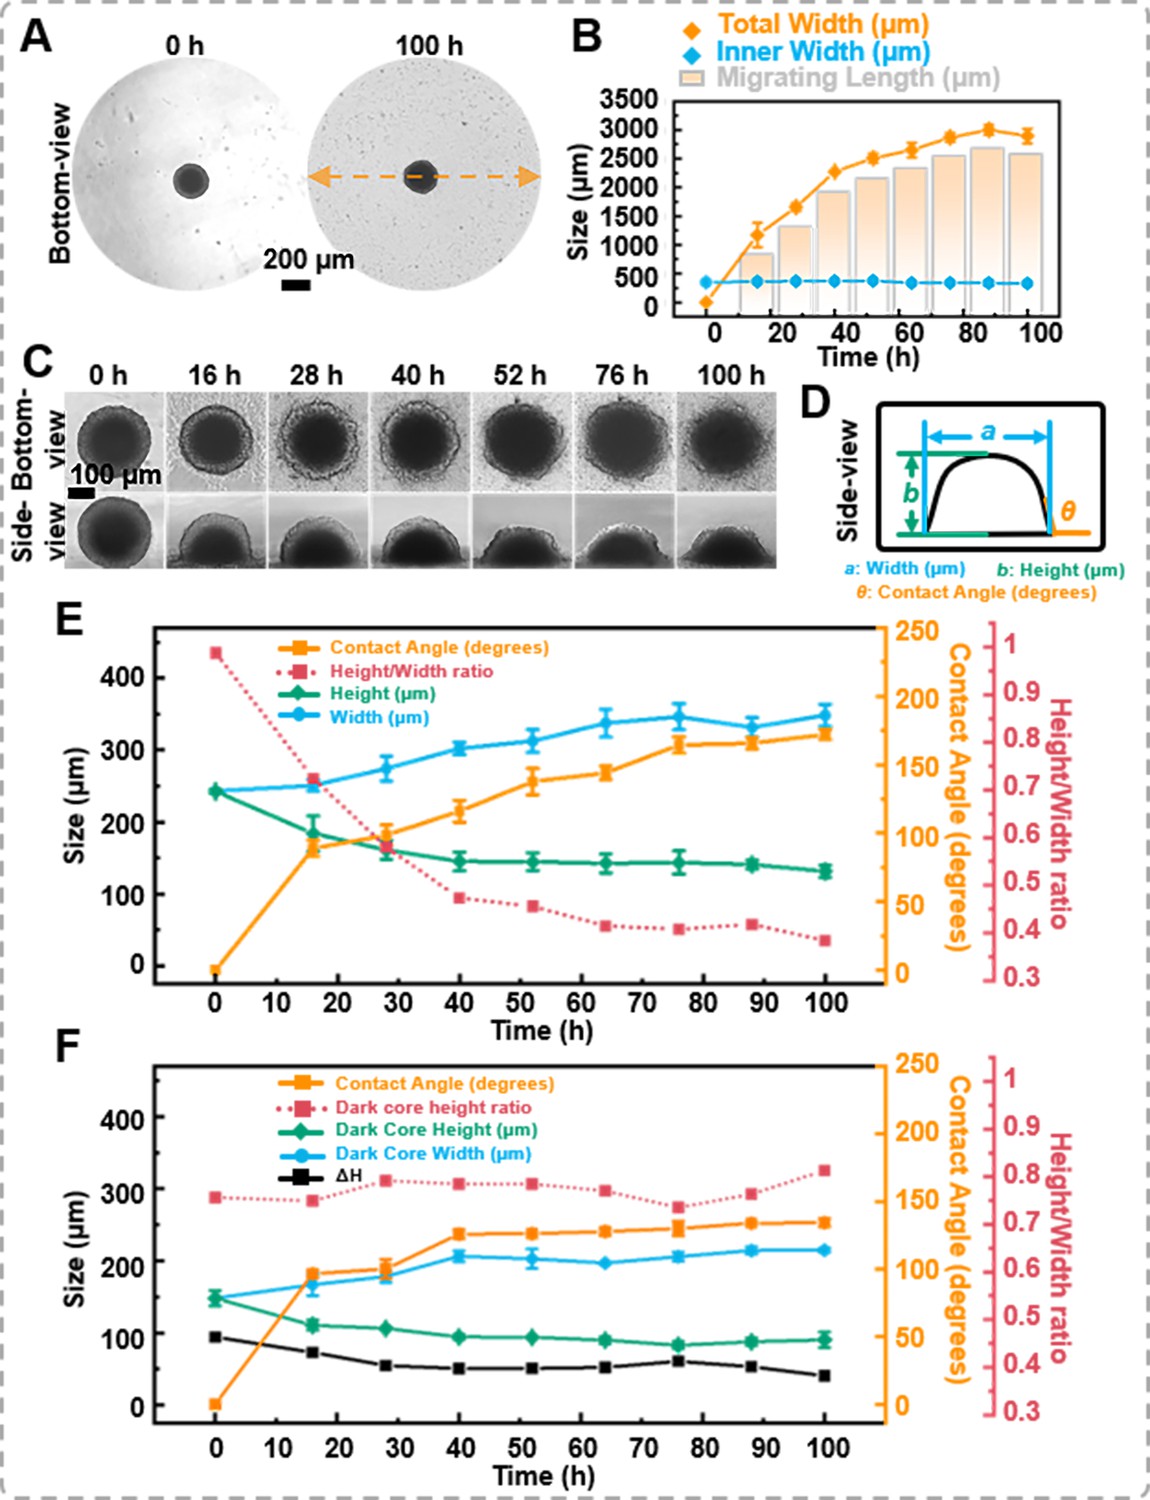
The migration of the spheroids.
(A) The bottom-view images of the spheroid in the petri dish, cells extrude from the spheroid, forming sprouts. (B) Statistics on the changes in total width, inner width, and migration distance of spheroids during migration process. (C) Time-lapse bottom- and side-view images of DU 145 spheroids during migration process. (D) Definition of the measured data points based on the side-view images of spheroids. (E) Trend of morphological changes in the outer layer of spheroids during the migration process. (F) Trend of morphological changes in the dark core of spheroids during the migration process (error bars = SD, n = 3).
Figure 5
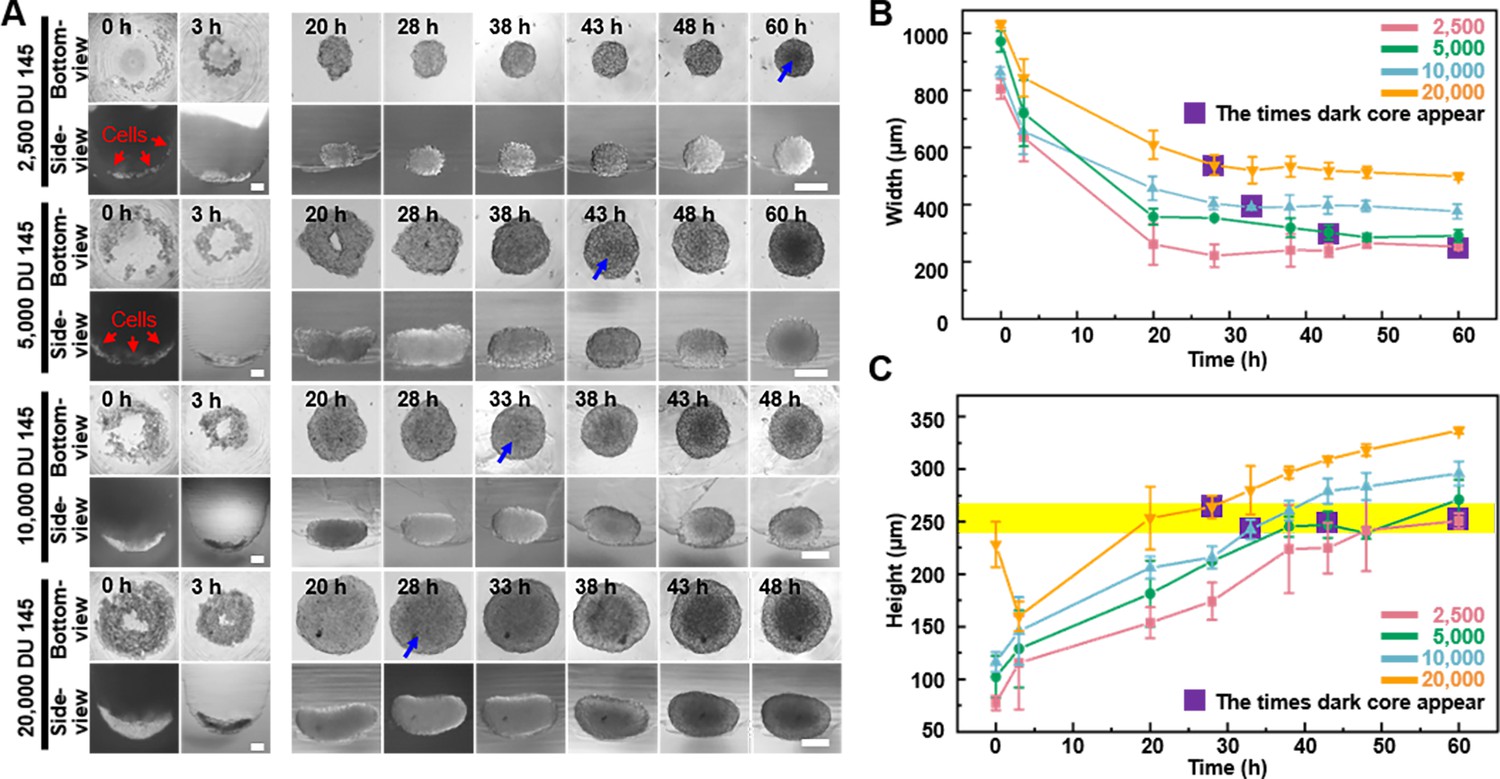
The dynamics of dark zone formation within the three-dimensional (3D) spheroid.
(A) Time-lapse bottom- and side-view images of DU 145 spheroids formed from different initial cell concentrations (2.5 × 10³, 5 × 10³, 1 × 10⁴, and 2 × 10⁴ cells/well). Blue arrows indicate the appearance of observable dark cores. (B) Relationship between spheroid width changes and dark core appears at different initial cell concentrations analyzed through bottom-view images. (C) Relationship between spheroid height changes and dark core appears at different initial cell concentrations analyzed through side-view images (the yellow stripe indicates the height of 250 ± 15 μm) (error bars = SD, n = 3).
Figure 6
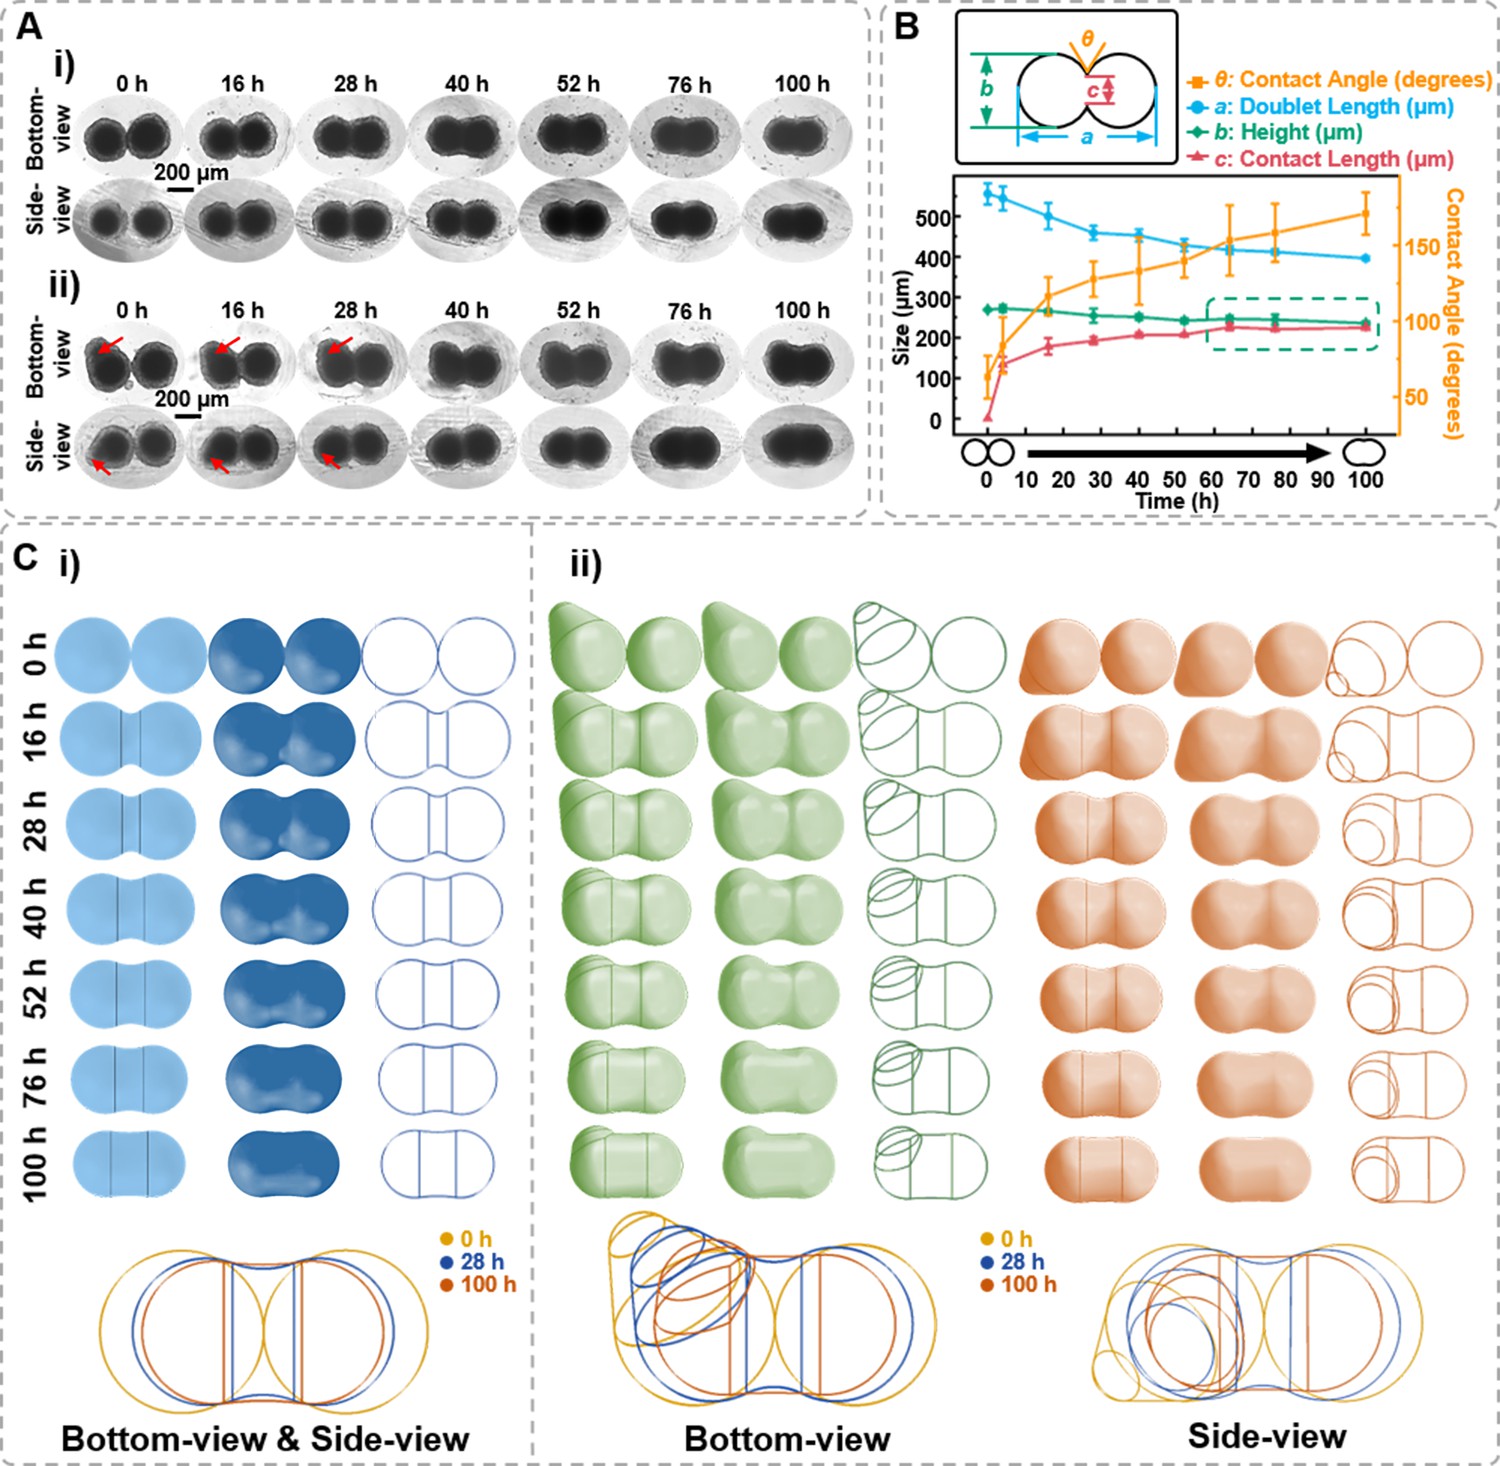
Characterization of the spheroids fusion process.
(A) Time-lapse bottom- and side-view images of fusion body formed by two 7-day-old DU 145 cell spheroids with ideal ball-like structure (i) and irregular cell spheroid (ii). Red arrows point to the protruding part of the cell spheroid. (B) Definition of the measured data points based on the side-view images of fusion spheroids and the changes in doublet length, height, contact angle, and contact length during the fusion process. (C) Three-dimensional spheroid fusion process modeling using bottom- and side-view images of ideal ball-like structure (i) and irregular cell spheroid (ii). The vertical lines on the model surface illustrate the position where the arc tangentially intersects both spheroids (error bars = SD, n = 3).
Figure 7

The in situ observation of DU 145 spheroids under the killing effect of doxorubicin (DOX) and natural killer (NK) cells.
(A) Time-lapse bottom- and side-view images of 3- and 7-day-age DU 145 cell spheroids (1 × 10⁴ cells/spheroid) under DOX (50 μg/mL) treatment. (B) The changes of DU 145 spheroids’ width and height upon DOX treatment. (C) Time-lapse bottom- and side-view images of 7-day-old DU 145 cell spheroids (1 × 10⁴ cells/spheroid) co-cultured with 1 × 10⁴ NK-92 cells. (D) Changes in internal and external width and height of 7-day-old DU 145 cell spheroids (1 × 10⁴ cells/spheroid) co-cultured with NK-92 cells. (E) The different performances of DOX and NK-92 cells killing on the overall height-to-width ratio of the spheroids (n = 3, error bars = SD).
Figure 8
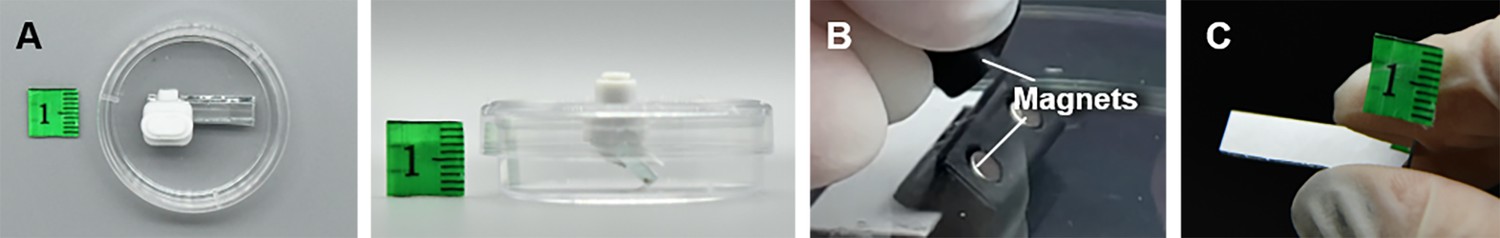
The display of the side-view observation petri dish/device.
(A) The top- and side-view images of the side-view observation petri dish/device. (B) The magnets inside the device.
Author response image 1
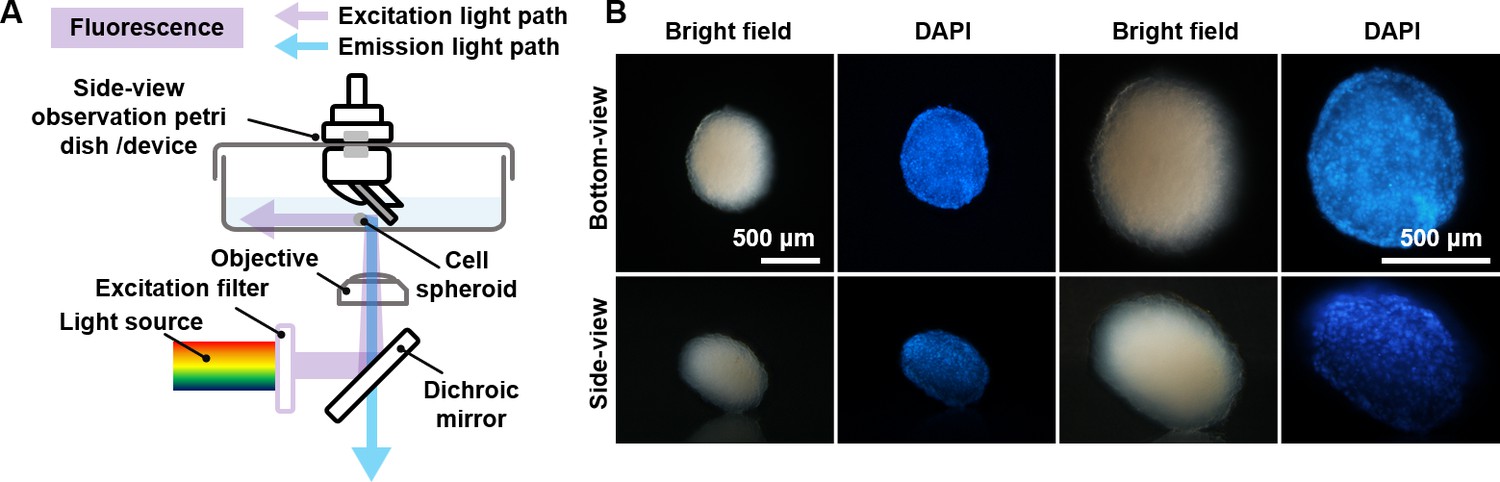
The device was used on an inverted microscope to capture fluorescence images.
(A) Schematic of the imaging setup. (B) Bright-field and fluorescence images of cells. (Scale bar = 500 µm.)
Videos
Video 1
Observation of the bottom- and side-view of a tumor spheroid using the side-view observation device.
Video 2
Locating the side-view of the spheroid in the agarose micro-well through the bottom-view.
Video 3
Recording the side-view images of different spheroids in the agarose micro-well.
Video 4
Non-destructive in situ observation of the thickness changes during DU 145 cell spheroids formation process.
Video 5
Non-destructive in situ observation of the thickness changes during DU 145 cell spheroids migration process.
Tables
Key resources table
| Reagent type (species) or resource | Designation | Source or reference | Identifiers | Additional information |
|---|---|---|---|---|
| Cell line (human prostate cancer cell) | DU 145 | Pricella Biotechnology | CL-0075 (RRID:CVCL_0105) | |
| Cell line (human natural killer cell) | NK-92 | Pricella Biotechnology | CL-0530 (RRID:CVCL_2142) | |
| Chemical compound, drug | DMEM culture medium | Gibco | C11995500BT | |
| Chemical compound, drug | Fetal bovine serum | Bio-channel | BC-SE-FBS01 | |
| Chemical compound, drug | Penicillin–streptomycin solution | Beyotime Biotechnology | C0222 | |
| Chemical compound, drug | NK-92 special medium | Pricella Biotechnology | CM-0530 | |
| Chemical compound, drug | Agarose | Aladdin Scientific | 11966311 | |
| Chemical compound, drug | Phosphate-buffered saline | Beijing DingGuo ChangSheng Biotechnology Co Ltd | BF-0011 | |
| Chemical compound, drug | Ultrapure water | ELGA Corporation | PURELAB flex system | |
| Software, algorithm | Origin | OriginLab Corporation | 2021 (RRID:SCR_014212) | |
| Software, algorithm | ImageJ | LOCI, University of Wisconsin | (RRID:RCR_003070) | |
| Other | Xenon lamp | Beijing zhongjiao Jinyuan Technology Co, Ltd | CEL-TCX250 | Light source |
| Other | Fiber optic spectrometer | Fuxiang Optics Co, Ltd | PG2000-Pro-EX | Instrument |
| Other | Microscope | Nikon | ECLIPSE Ti (RRID:SCR_021242) | Instrument |
| Other | D-LH/LC lamphouse | Nikon | Light source | |
| Other | 3D printer | Bambu Lab | P1P | Instrument |
Additional files
Download links
A two-part list of links to download the article, or parts of the article, in various formats.
Downloads (link to download the article as PDF)
Open citations (links to open the citations from this article in various online reference manager services)
Cite this article (links to download the citations from this article in formats compatible with various reference manager tools)
Non-destructive in situ monitoring of structural changes of 3D tumor spheroids during the formation, migration, and fusion process
eLife 13:RP101886.
https://doi.org/10.7554/eLife.101886.3


