Loss function of tumor suppressor FRMD8 confers resistance to tamoxifen therapy via a dual mechanism
- Program for Cancer and Cell Biology, Department of Human Anatomy, Histology and Embryology, School of Basic Medical Sciences, Peking University International Cancer Institute, State Key Laboratory of Molecular Oncology, Peking University Health Science Center, China
- Department of Gastroenterology, Beijing Friendship Hospital, Capital Medical University; State Key Laboratory for Digestive Health; National Clinical Research Center for Digestive Diseases, China
- Department of Breast Pathology and Lab, Tianjin Medical University Cancer Institute and Hospital, National Clinical Research Center for Cancer, Key Laboratory of Breast Cancer Prevention and Therapy of Ministry of Education of China, Tianjin Medical University, Tianjin’s Clinical Research Center for Cancer, China
- Department of Genetic Engineering, Beijing Institute of Biotechnology, China
Figures
Figure 1 with 1 supplement
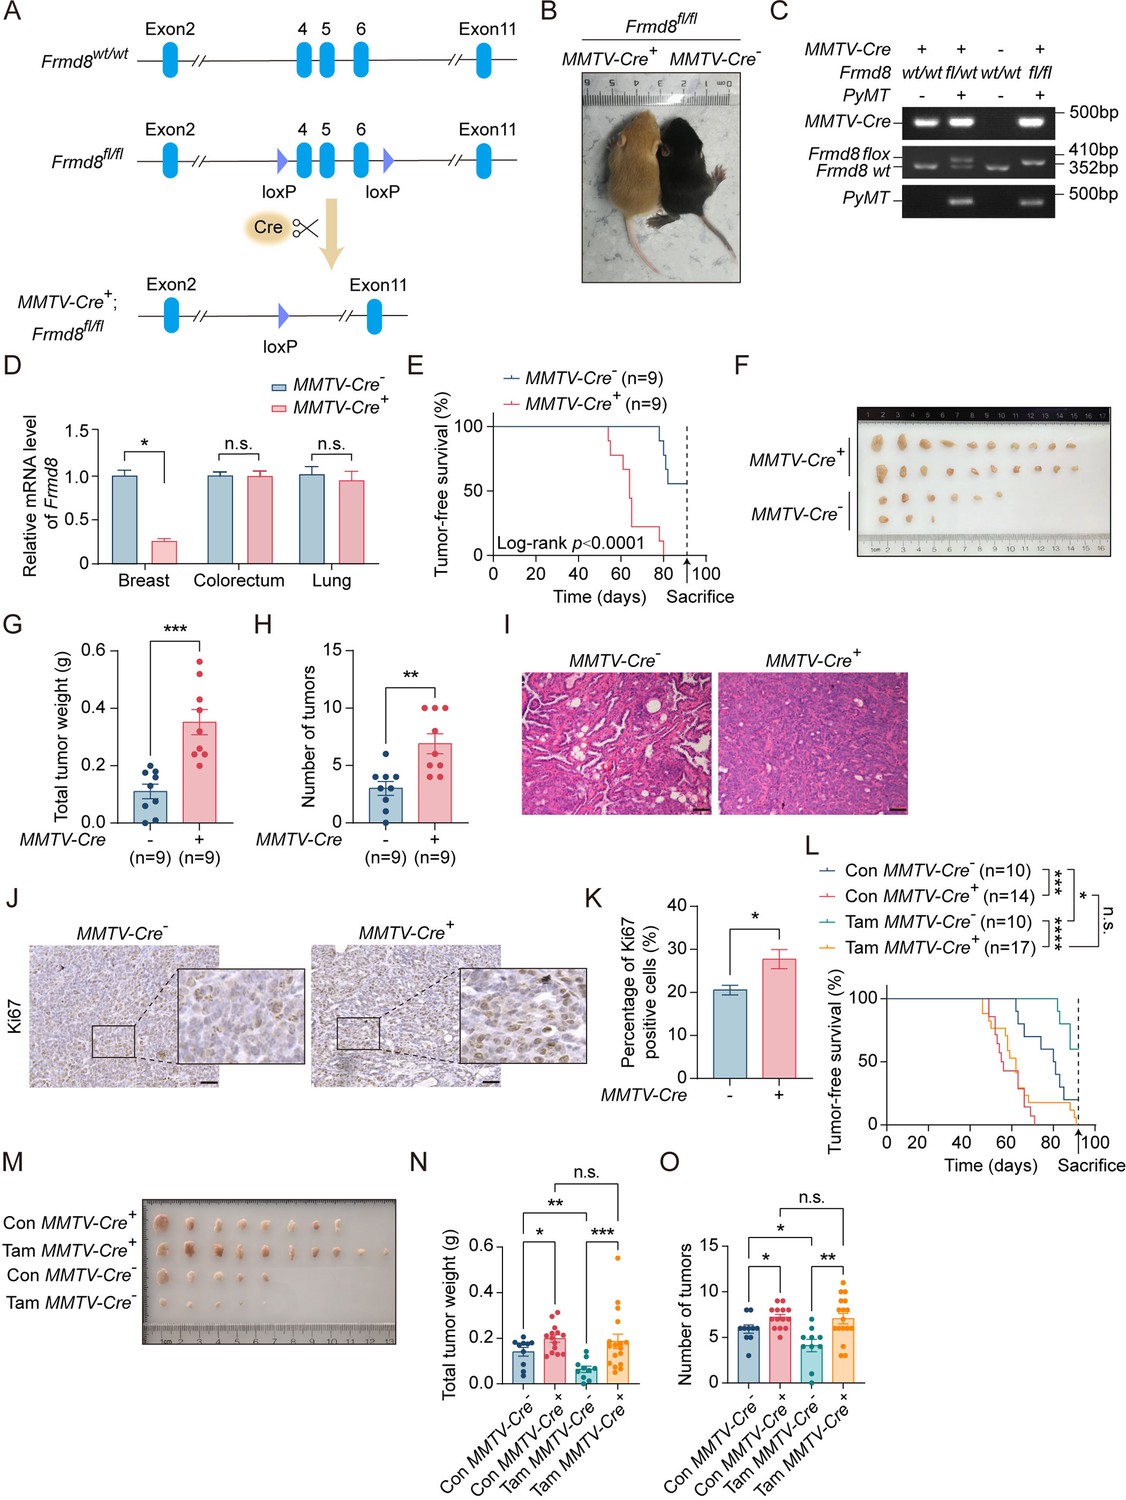
Loss of Frmd8 promotes mammary tumor growth and generates tamoxifen resistance in vivo.
(A) A diagram of the Frmd8 targeted alleles. Exons 4, 5, and 6 are flanked by loxp sites. (B) Distinguishing the genotype of littermate mice by mice coat color. Yellow represents MMTV-Cre+; Frmd8fl/fl; PyMT genotype, and black represents MMTV-Cre-; Frmd8fl/fl; PyMT genotype. (C) Representative PCR genotyping of mouse tail DNA. (D) Relative mRNA level of Frmd8 in 7-week-old mammary glands from PyMT mice was analyzed by qRT-PCR. Gapdh was used as an internal reference. *p<0.05 by unpaired Student’s t-test, n = 3. (E) Kaplan–Meier plot showing the appearance of palpable tumors in MMTV-Cre-; Frmd8fl/fl; PyMT (n = 9) and MMTV-Cre+; Frmd8fl/fl; PyMT (n = 9) mice (Log-rank test). (F) Representative images of tumors from MMTV-Cre-; Frmd8fl/fl; PyMT and MMTV-Cre+; Frmd8fl/fl; PyMT mice. (G, H) Total tumor weight (G) and number of tumors (H) per mice were measured. **p<0.01, ***p<0.001 by unpaired Student’s t-test. (I) Representative H&E staining of tumors from MMTV-Cre-; Frmd8fl/fl; PyMT and MMTV-Cre+; Frmd8fl/fl; PyMT mice. Scale bar, 50 μm. (J) Immunohistochemistry (IHC) staining for Ki67 expression in mammary tumors from PyMT mice. The black boxes represent the magnified typical staining of the original images. Scale bar, 50 μm. (K) Quantification of Ki67-positive cell percentage in (J). *p<0.05 by unpaired Student’s t-test, n = 3. (L) Kaplan–Meier plot showing the appearance of palpable tumors in MMTV-Cre-; Frmd8fl/fl; PyMT and MMTV-Cre+; Frmd8fl/fl; PyMT mice, with or without tamoxifen treatment (Log-rank test, *p<0.05, ***p<0.001, ****p<0.0001). (M) Representative images of tumors from MMTV-Cre-; Frmd8fl/fl; PyMT and MMTV-Cre+; Frmd8fl/fl; PyMT mice, with or without tamoxifen treatment. (N, O) Total tumor weight (N) and number of tumors (O) per mice from (L) were measured (n ≥ 10). *p<0.05, **p<0.01, ***p<0.001 by unpaired Student’s t-test or Mann–Whitney test.
-
Figure 1—source data 1
Unedited gel pictures for Figure 1, indicating the relevant bands.
- https://cdn.elifesciences.org/articles/101888/elife-101888-fig1-data1-v1.pdf
-
Figure 1—source data 2
Original files for gel pictures displayed in Figure 1.
- https://cdn.elifesciences.org/articles/101888/elife-101888-fig1-data2-v1.zip
Figure 1—figure supplement 1
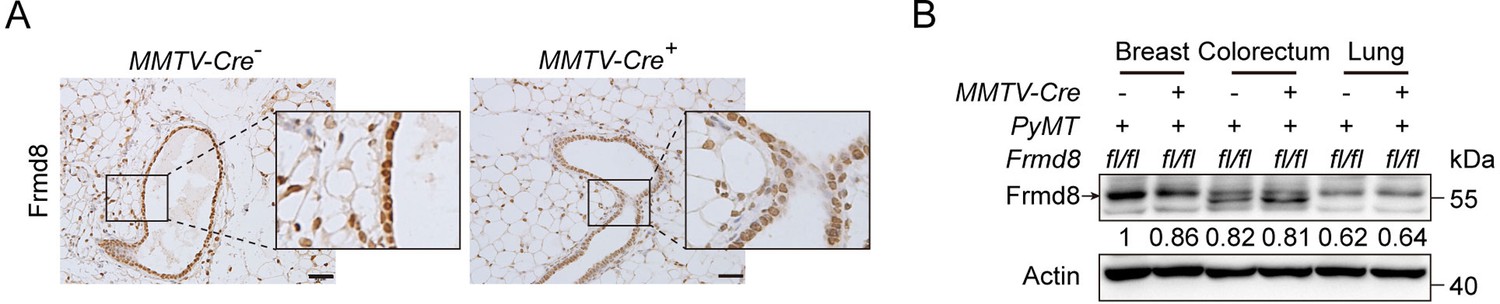
Loss of FRMD8 promotes breast cancer cell proliferation.
(A) Immunohistochemistry staining for Frmd8 expression in mammary glands from PyMT mice. The black boxes represent the magnified typical staining of the original images. Scale bar, 50 μm. (B) Lysates from different tissues of MMTV-Cre-; Frmd8fl/fl; PyMT and MMTV-Cre+; Frmd8fl/fl; PyMT mice were examined by western blot. Specific bands are marked with an arrow.
-
Figure 1—figure supplement 1—source data 1
Unedited western blot pictures for Figure 1—figure supplement 1, indicating the relevant bands.
- https://cdn.elifesciences.org/articles/101888/elife-101888-fig1-figsupp1-data1-v1.pdf
-
Figure 1—figure supplement 1—source data 2
Original files for western blot pictures displayed in Figure 1—figure supplement 1.
- https://cdn.elifesciences.org/articles/101888/elife-101888-fig1-figsupp1-data2-v1.zip
Figure 2 with 1 supplement
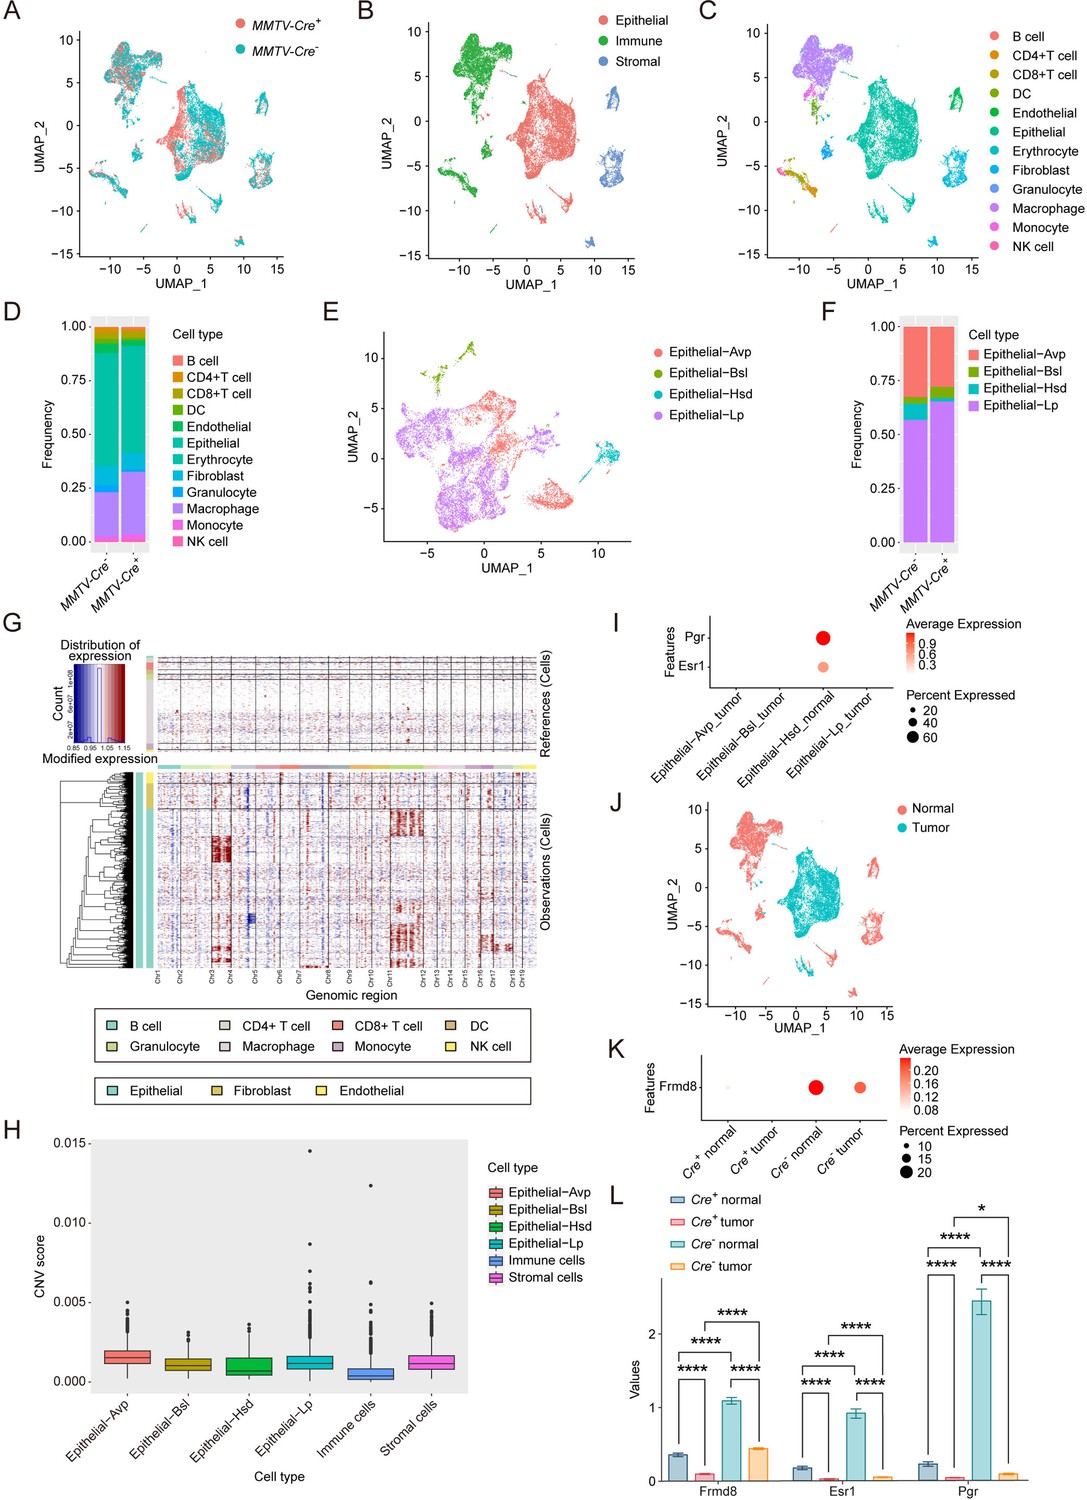
Frmd8 knockout decreases the proportion of the hormone-sensing differentiated epithelial cells.
(A) T-SNE plot showing the distribution of cells from MMTV-Cre-; Frmd8fl/fl; PyMT and MMTV-Cre+; Frmd8fl/fl; PyMT mice. (B) T-SNE plot showing the distribution of epithelial, immune, and stromal cells. (C, D) T-SNE plot showing the distribution of main cell lineages (C) and their relative percentage (D). (E, F) T-SNE plot showing the distribution of epithelial cell lineages (E) and their relative percentage (F). (G) Heatmap showing distinct features of each cell lineages. Rows, genes. Columns, cells. The color key from blue to red indicates low to high gene expression. (H) Boxplot showing copy number variation (CNV) score of main cell lineages. (I) Dot plot showing the expression of Esr1 and Pgr in epithelial cell lineages. (J) T-SNE plot showing the distribution of normal cells and tumor cells. (K) Dot plot showing the expression of Frmd8 in normal and tumor cells from MMTV-Cre-; Frmd8fl/fl; PyMT and MMTV-Cre+; Frmd8fl/fl; PyMT mice. (L) Statistical analysis of Frmd8, Esr1 and Pgr expression in normal and tumor cells from MMTV-Cre-; Frmd8fl/fl; PyMT and MMTV-Cre+; Frmd8fl/fl; PyMT mice. *p<0.05, ****p<0.0001 by Mann–Whitney test.
Figure 2—figure supplement 1
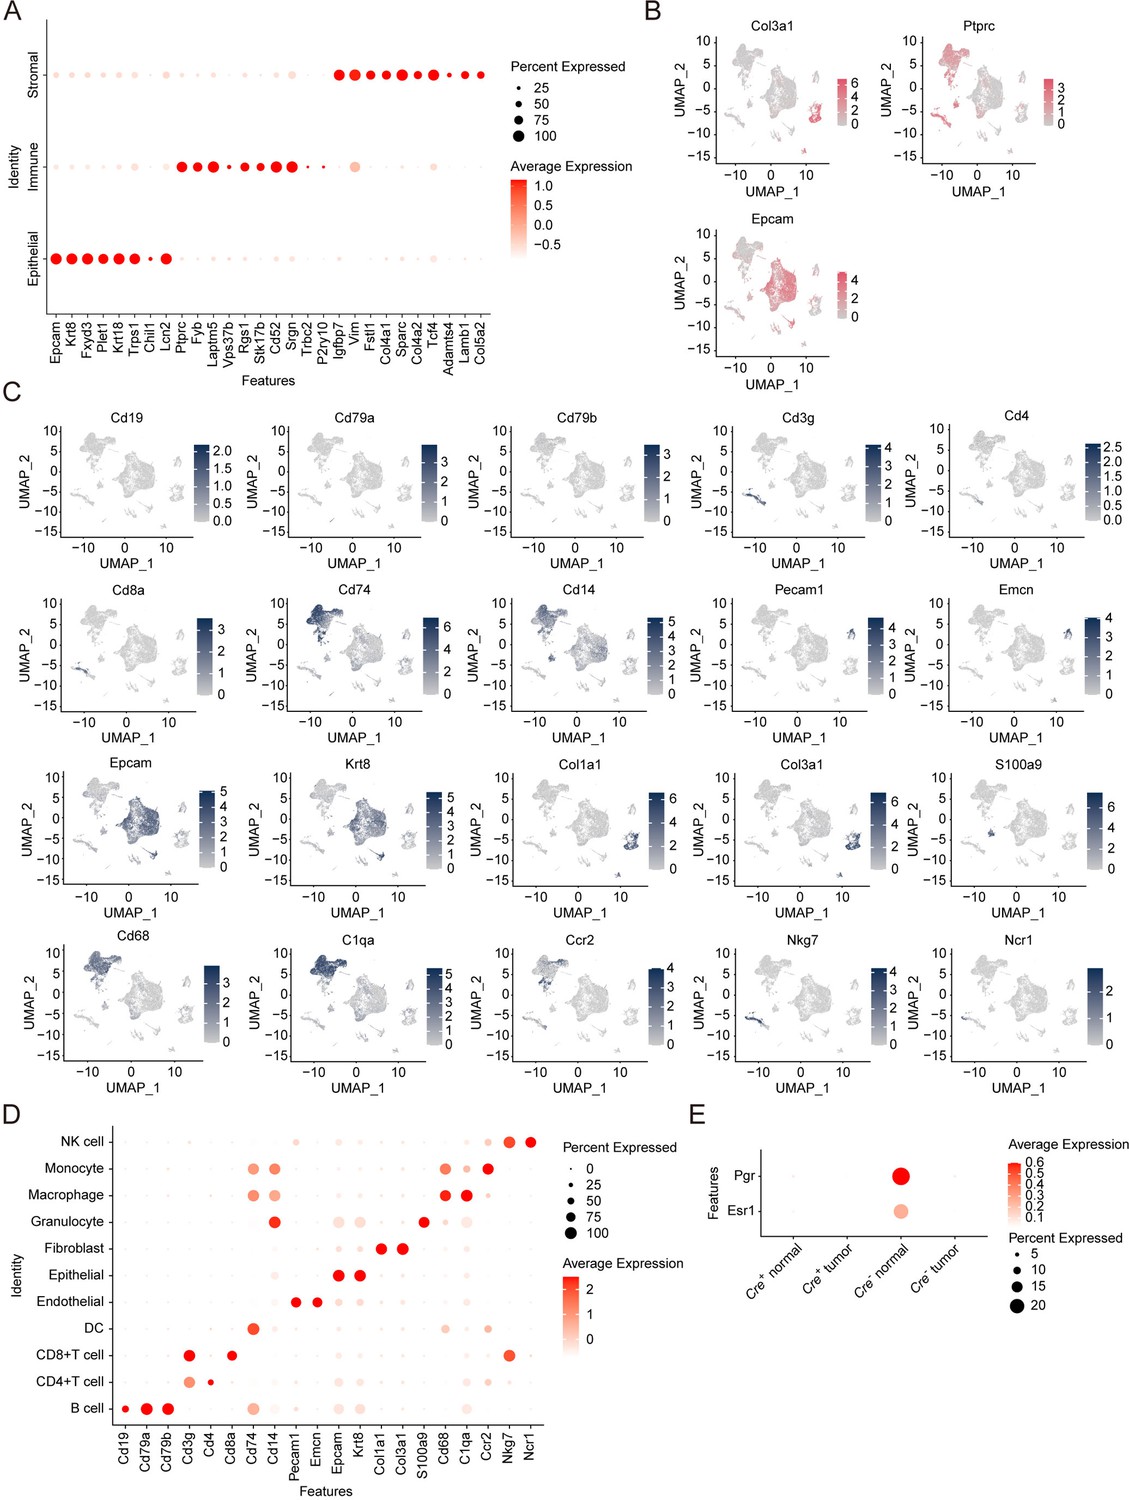
Distinct cell lineages determined by single-cell RNA-seq analysis.
(A) Dot plot representing the expression level (red jet) and the number of expressing cells (dot size) of the top markers from main cell lineages. (B) T-SNE visualization of the expression level of main lineages markers. The color key from gray to pink indicates low to high gene expression. (C) T-SNE visualization of the expression level of the top markers from each of the cell lineages. The color key from gray to blue indicates low to high gene expression. (D) Dot plot representing the expression level (red jet) and the number of expressing cells (dot size) of the top markers from each of the cell lineages. (E) Dot plot showing the expression of Esr1 and Pgr in normal and tumor cells from MMTV-Cre-; Frmd8fl/fl; PyMT and MMTV-Cre+; Frmd8fl/fl; PyMT mice.
Figure 3 with 1 supplement
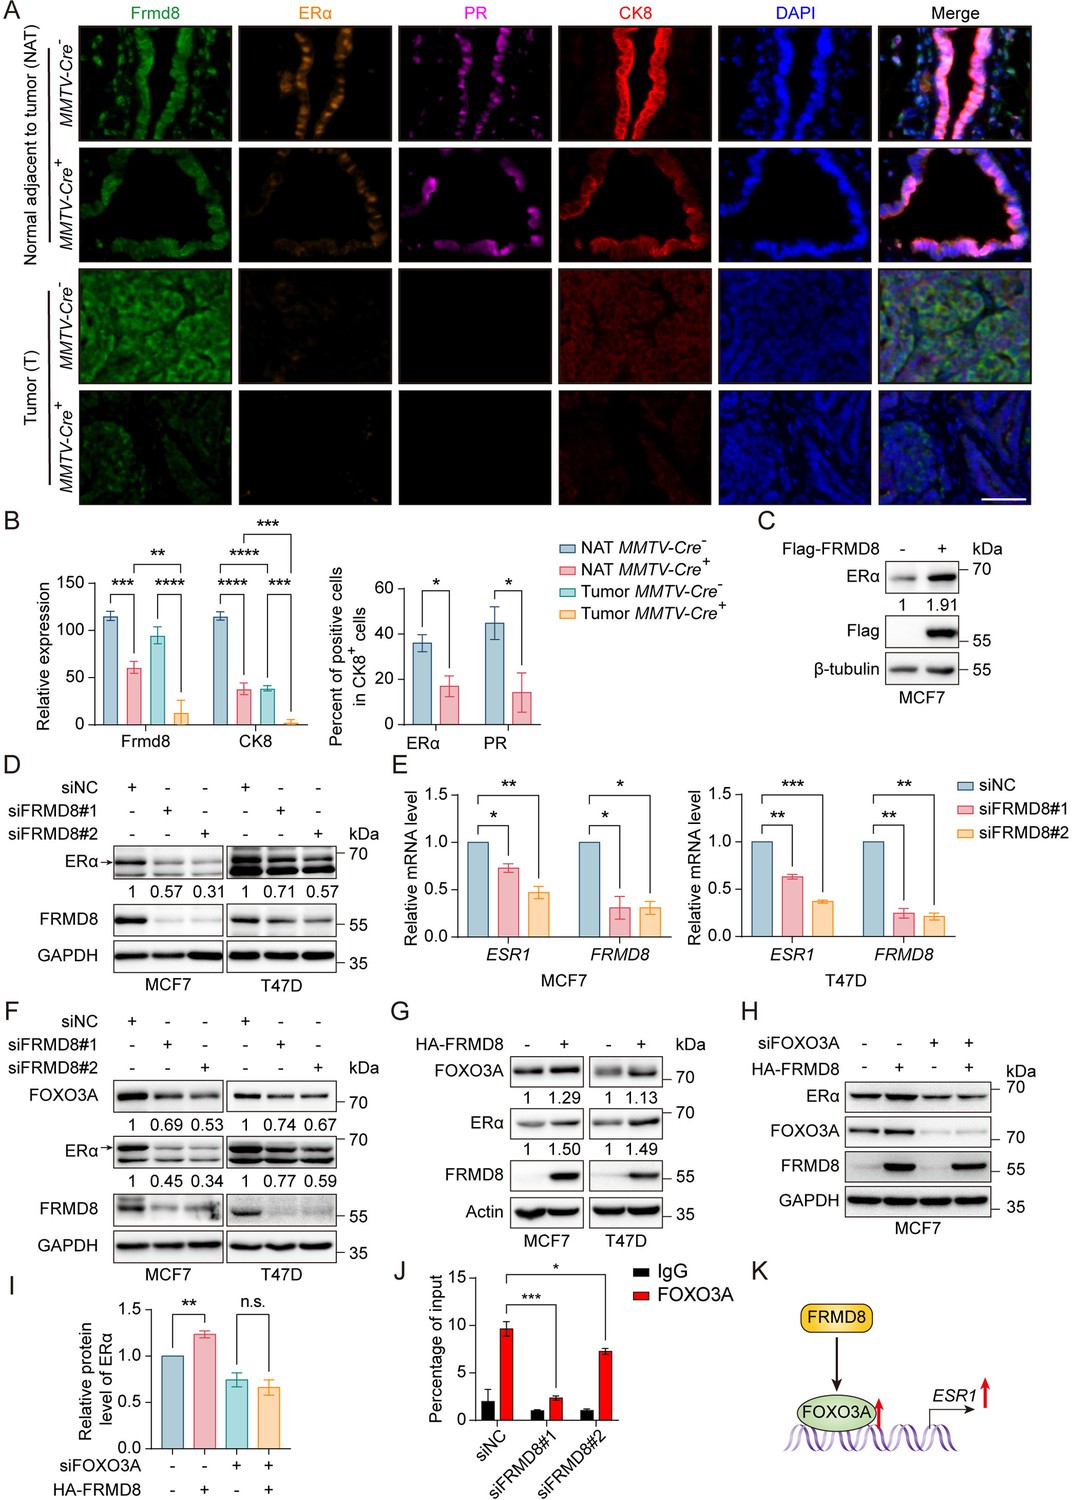
FRMD8 promotion of ESR1 expression is mediated by FOXO3A.
(A) Representative multiplex immunofluorescence images of tumor tissues and tissues adjacent to tumor from MMTV-Cre-; Frmd8fl/fl; PyMT and MMTV-Cre+; Frmd8fl/fl; PyMT mice. Scale bar, 50 μm. (B) Qualification of Frmd8 and CK8 expression (left panel) and ERα and PR-positive cell percentage in CK8+ cells (right panel) in (A). *p<0.05, **p<0.01, ***p<0.001, ****p<0.0001 by one-way ANOVA (left panel) or unpaired Student’s t-test (right panel), n ≥ 3. (C) Lysates from MCF7 cells transiently transfected with Flag or Flag-FRMD8 were immunoblotted. (D) Lysates from MCF7 and T47D cells transiently transfected with control or FRMD8 siRNA were immunoblotted. In this and subsequent figures, specific bands are marked with an arrow. (E) Relative mRNA levels of ESR1 and FRMD8 from MCF7 and T47D cells transiently transfected with control or FRMD8 siRNA were analyzed by qRT-PCR. GAPDH was used as an internal reference. *p<0.05, **p<0.01, ***p<0.001 by one-way ANOVA, n = 2. (F) Lysates from MCF7 and T47D cells transiently transfected with control or FRMD8 siRNA were immunoblotted. (G) Lysates from MCF7 and T47D cells transiently transfected with HA or HA-FRMD8 were immunoblotted. (H, I) Lysates of MCF7 cells co-transfected with HA-FRMD8 and FOXO3A siRNA as indicated were immunoblotted (H). ERα protein levels were quantified by normalizing to the intensity of the GAPDH band (I). **p<0.01 by unpaired Student’s t-test, n = 3. (J) Lysates of T47D cells transfected with control or FRMD8 siRNA were subjected to anti-FOXO3A ChIP-qPCR. *p<0.05, ***p<0.001 by one-way ANOVA, n = 2. (K) Working model for FRMD8 promotes ESR1 transcription via upregulating FOXO3A expression.
-
Figure 3—source data 1
Unedited western blot pictures for Figure 3, indicating the relevant bands.
- https://cdn.elifesciences.org/articles/101888/elife-101888-fig3-data1-v1.pdf
-
Figure 3—source data 2
Original files for western blot pictures displayed in Figure 3.
- https://cdn.elifesciences.org/articles/101888/elife-101888-fig3-data2-v1.zip
Figure 3—figure supplement 1
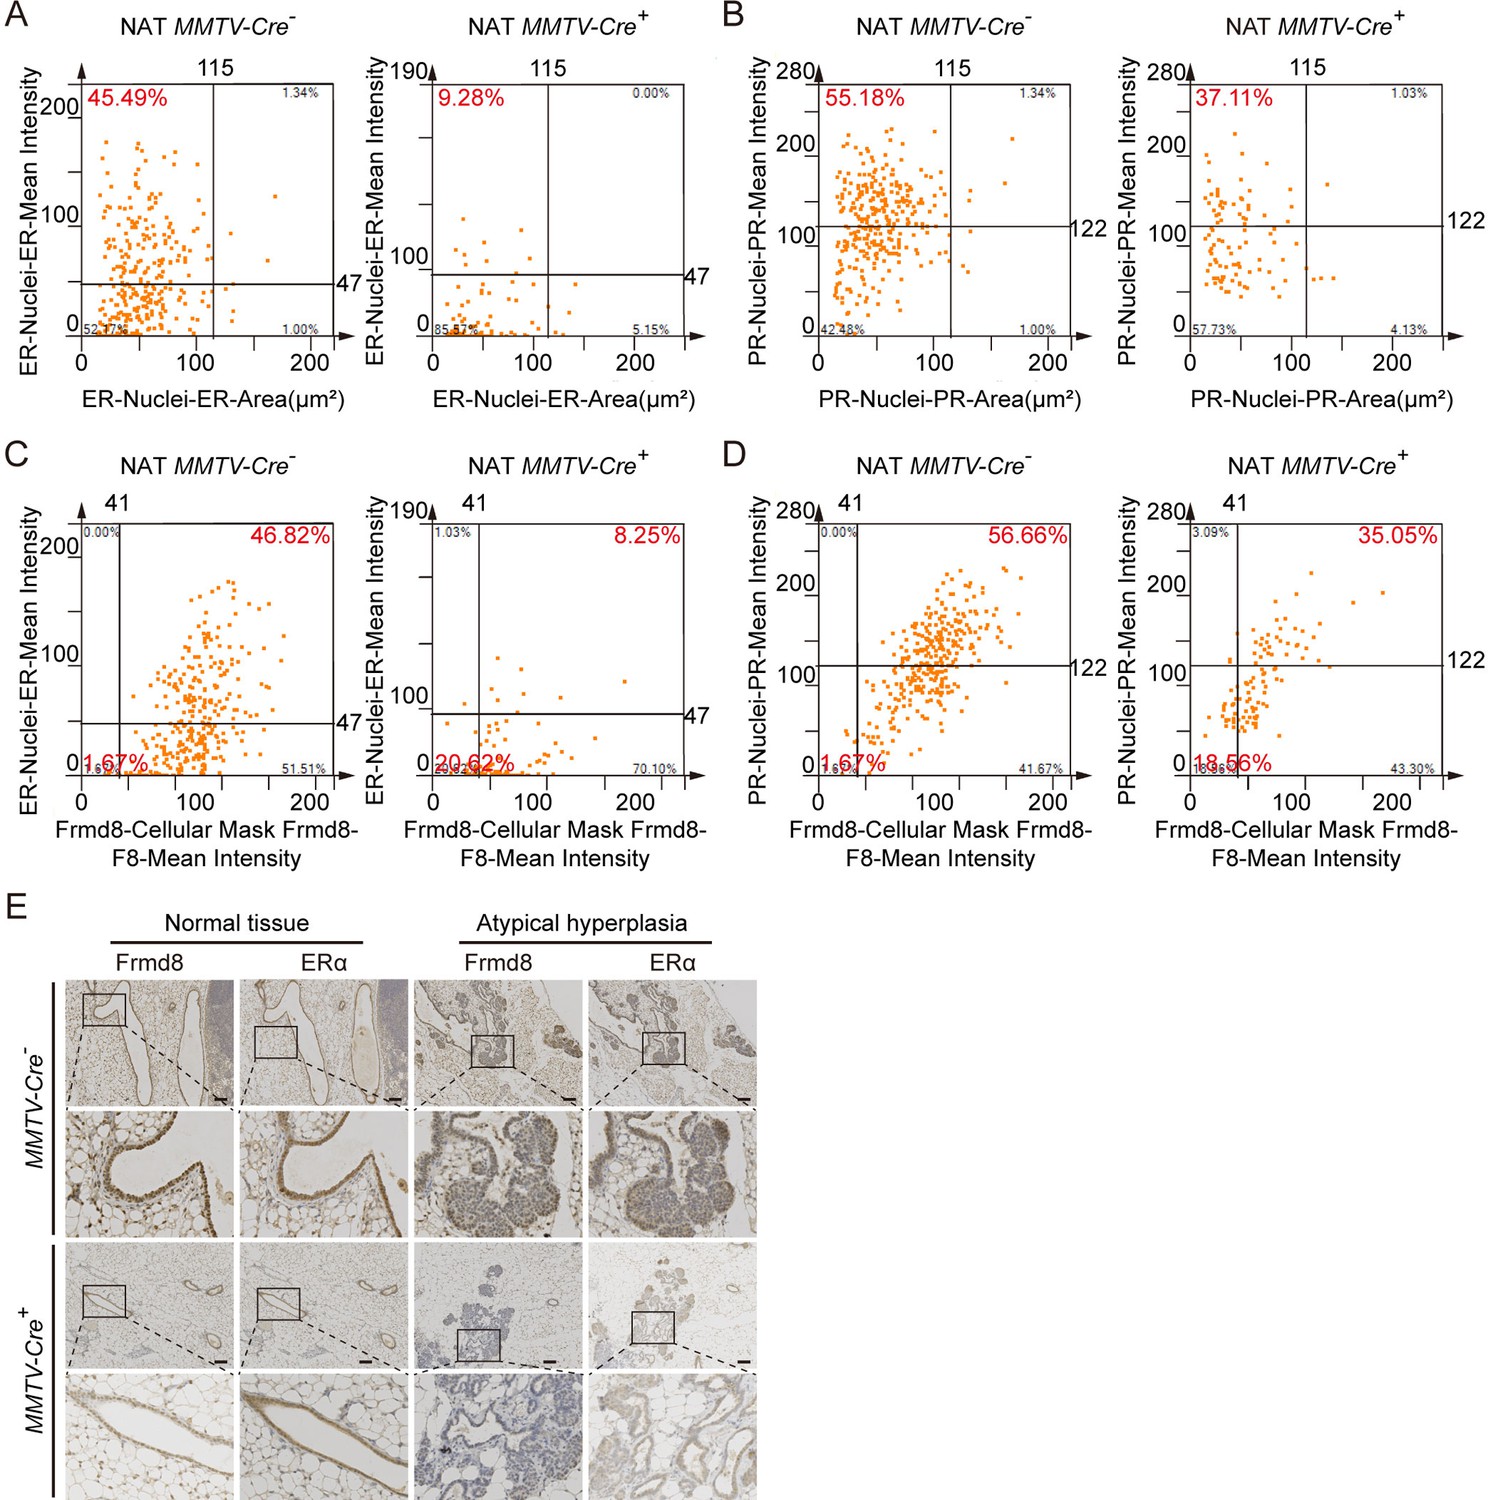
The expressions of ERα and PR decreased in Frmd8-deleted mammary tissues.
(A–D) The scatter plot shows the cells in multiplex immunofluorescence images of normal tissues adjacent to tumor in MMTV-Cre-; Frmd8fl/fl; PyMT and MMTV-Cre+; Frmd8fl/fl; PyMT mice. (E) Immunohistochemistry (IHC) staining for Frmd8 and ERα expression in 7-week-old mammary glands from PyMT mice. The black boxes represent the magnified typical staining of the original images. Scale bar, 100 μm.
Figure 4
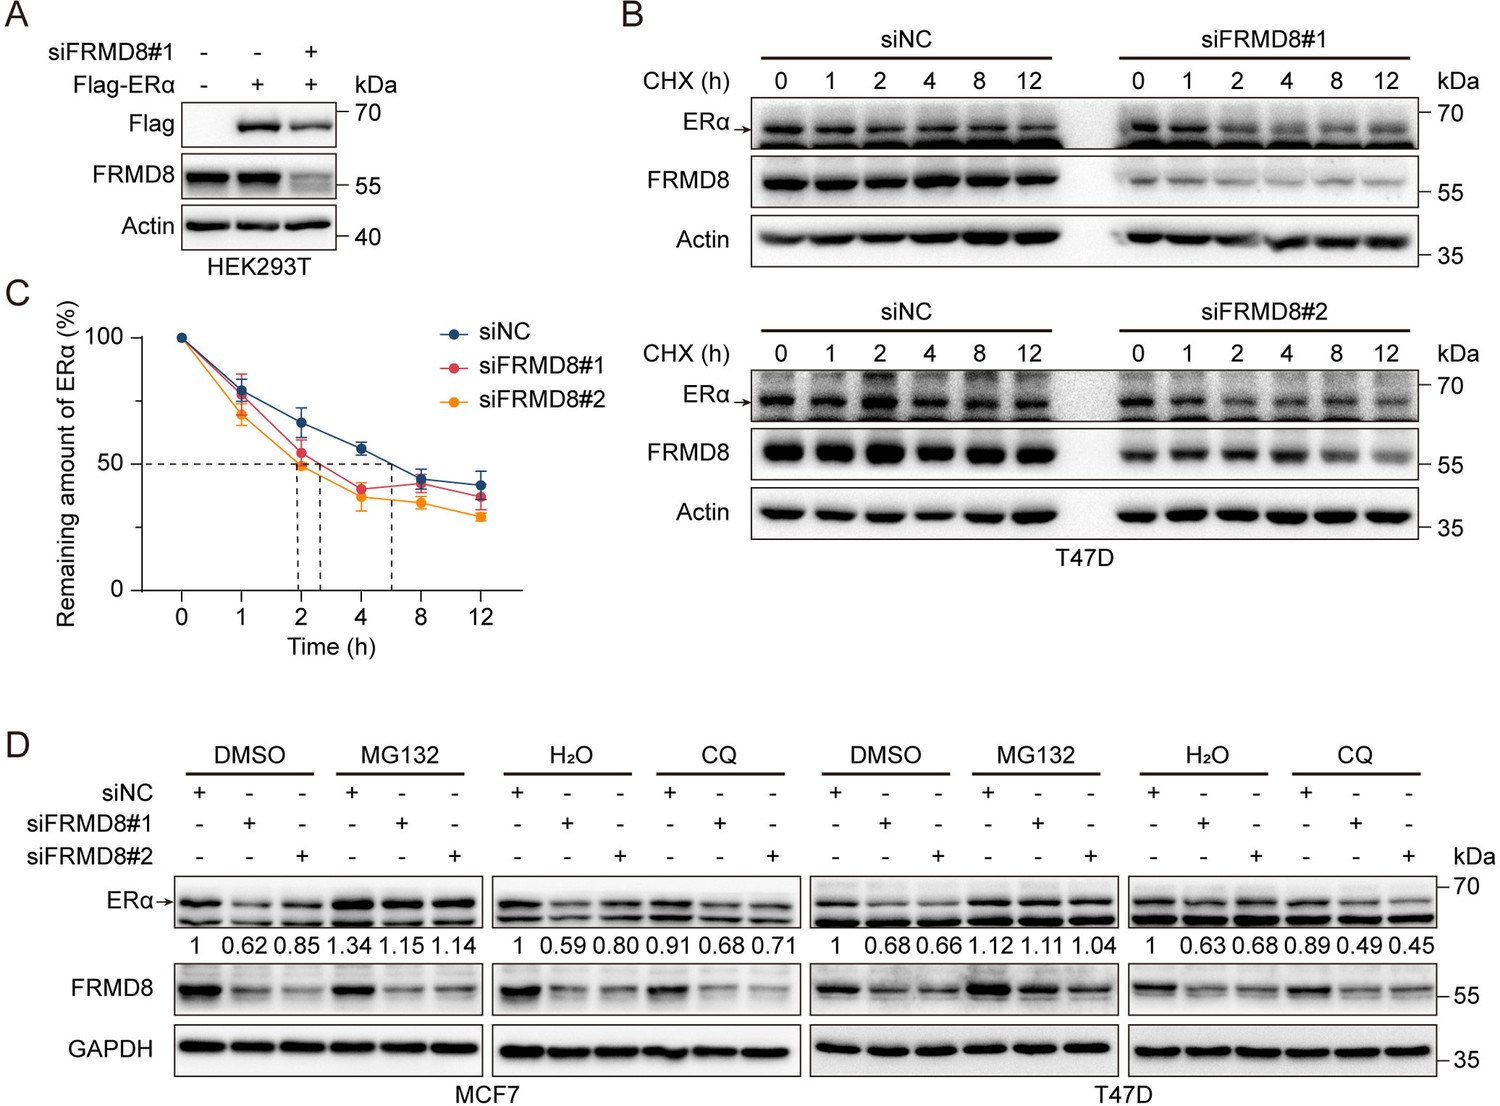
FRMD8 stabilizes ERα via prevention of its degradation.
(A) Lysates of HEK293T cells co-transfected with Flag-ERα and FRMD8 siRNA as indicated were immunoblotted. (B, C) Lysates from T47D cells transiently transfected with control or FRMD8 siRNA were subjected to immunoblotting. Cells were treated with 100 μg/ml CHX for the indicated times (B). ERα protein levels were quantified by normalizing to the intensity of the Actin band, n = 4 (C). (D) Immunoblot analysis of ERα in MCF7 and T47D cells transiently transfected with control or FRMD8 siRNA. The cells were treated with MG132 (25 μM) or chloroquine (50 μM) for 6 h.
-
Figure 4—source data 1
Unedited western blot pictures for Figure 4, indicating the relevant bands.
- https://cdn.elifesciences.org/articles/101888/elife-101888-fig4-data1-v1.pdf
-
Figure 4—source data 2
Original files for western blot pictures displayed in Figure 4.
- https://cdn.elifesciences.org/articles/101888/elife-101888-fig4-data2-v1.zip
Figure 5
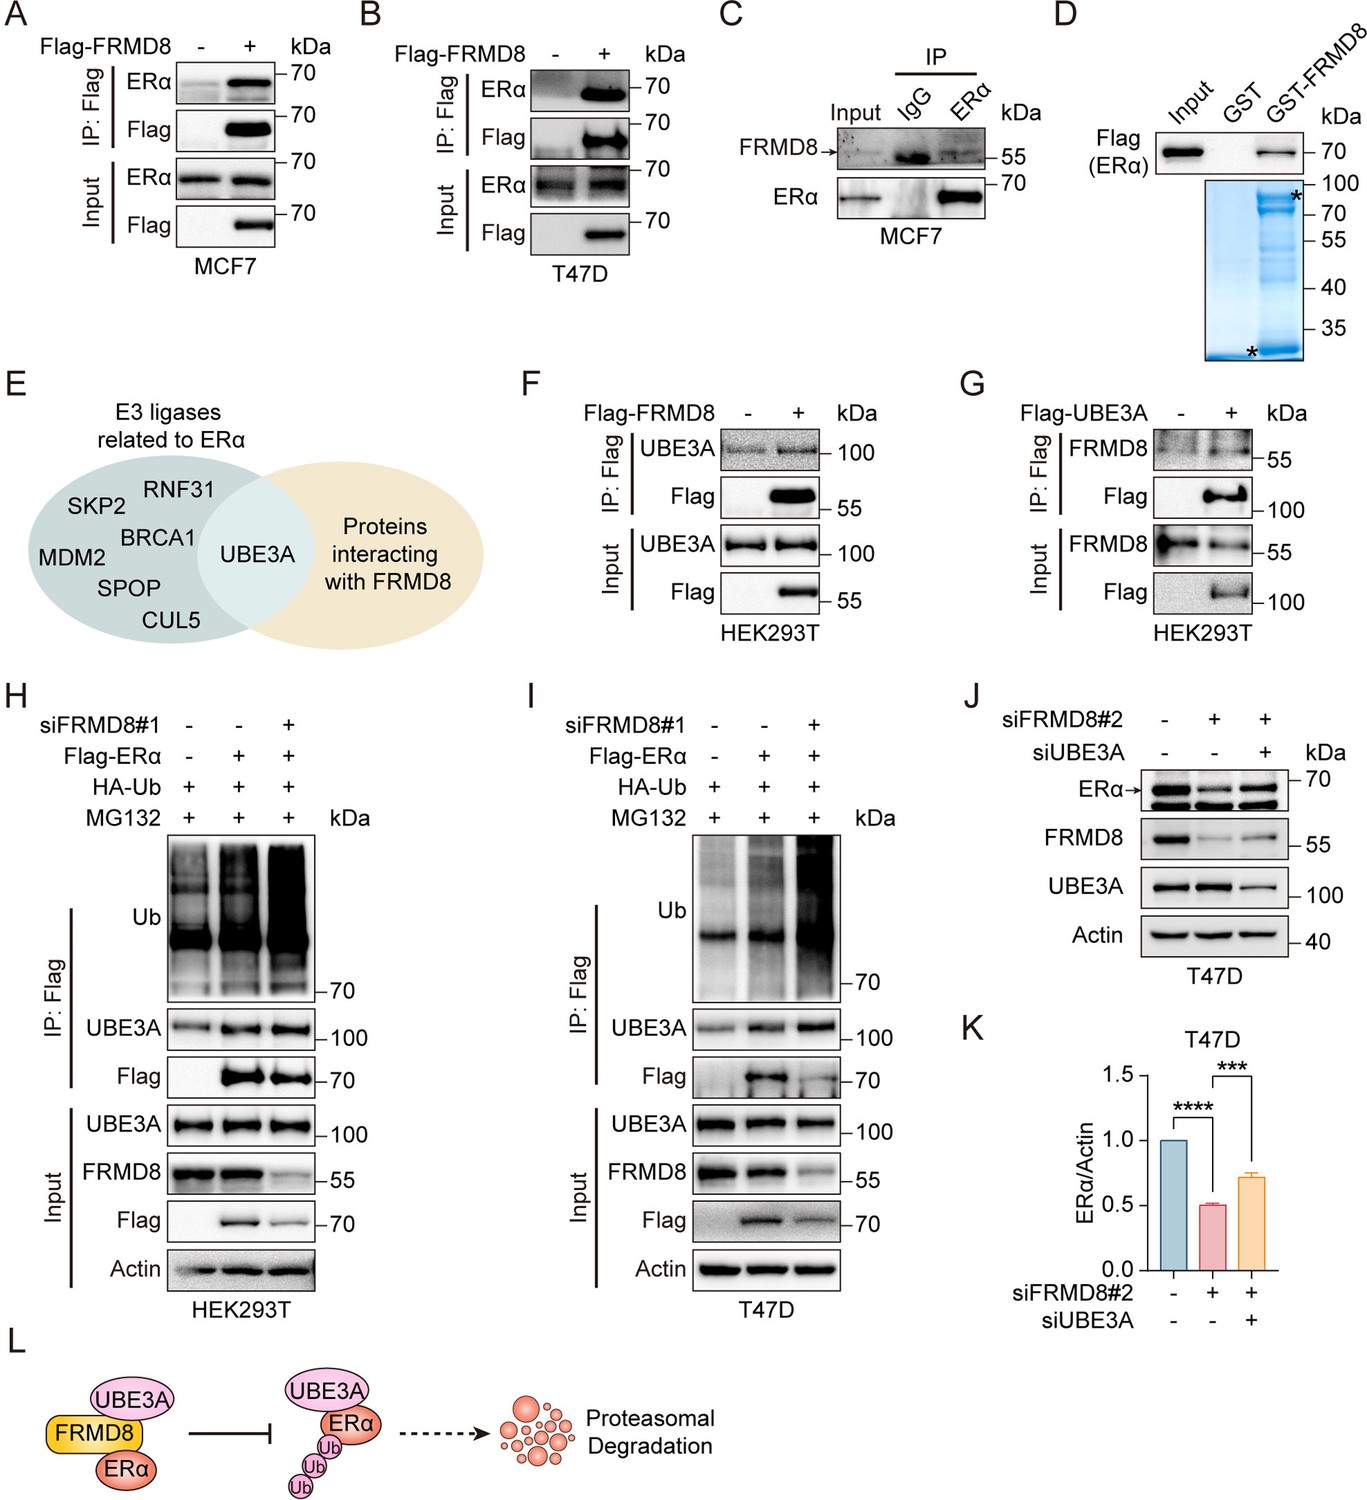
FRMD8 inhibits ERα degradation by blocking UBE3A binding with ERα.
(A, B) Lysates of MCF7 (A) and T47D (B) cells transfected with Flag or Flag-FRMD8 were anti-Flag immunoprecipitated and immunoblotted for ERα and Flag. (C) Lysates from MCF7 cells were immunoprecipitated with IgG or anti-ERα, then immunoblotted for FRMD8 and ERα. (D) HEK293T cells were transiently transfected with Flag-ERα. ERα proteins in HEK293T whole-cell lysates (WCL) pulled down by GST or GST-FRMD8 recombinant proteins were subjected to western blot. Asterisks indicate proteins at the expected molecular weight. (E) Venn diagram showing overlap of E3 ligases related to ERα and proteins interacting with FRMD8. (F) Lysates of HEK293T cells transfected with Flag or Flag-FRMD8 were anti-Flag immunoprecipitated and immunoblotted. (G) Lysates of HEK293T cells transfected with Flag or Flag-UBE3A were anti-Flag immunoprecipitated and immunoblotted. (H, I) HEK293T (H) and T47D (I) cells were co-transfected with Flag-ERα, HA-Ub, and FRMD8 siRNA as indicated. Cells were treated with MG132 (25 μM) for 6 h. WCL were immunoprecipitated with anti-Flag and then immunoblotted for ubiquitinated ERα. (J, K) Lysates of T47D cells co-transfected with FRMD8 and UBE3A siRNA as indicated were immunoblotted (J). ERα protein levels were quantified by normalizing to the intensity of the Actin band (K). ***p<0.001, ****p<0.0001 by one-way ANOVA, n = 3. (L) Working model for FRMD8 disrupts the interaction between ERα and UBE3A, and protects ERα from UBE3A-mediated degradation.
-
Figure 5—source data 1
Unedited western blot pictures for Figure 5, indicating the relevant bands.
- https://cdn.elifesciences.org/articles/101888/elife-101888-fig5-data1-v1.pdf
-
Figure 5—source data 2
Original files for western blot pictures displayed in Figure 5.
- https://cdn.elifesciences.org/articles/101888/elife-101888-fig5-data2-v1.zip
Figure 6 with 1 supplement
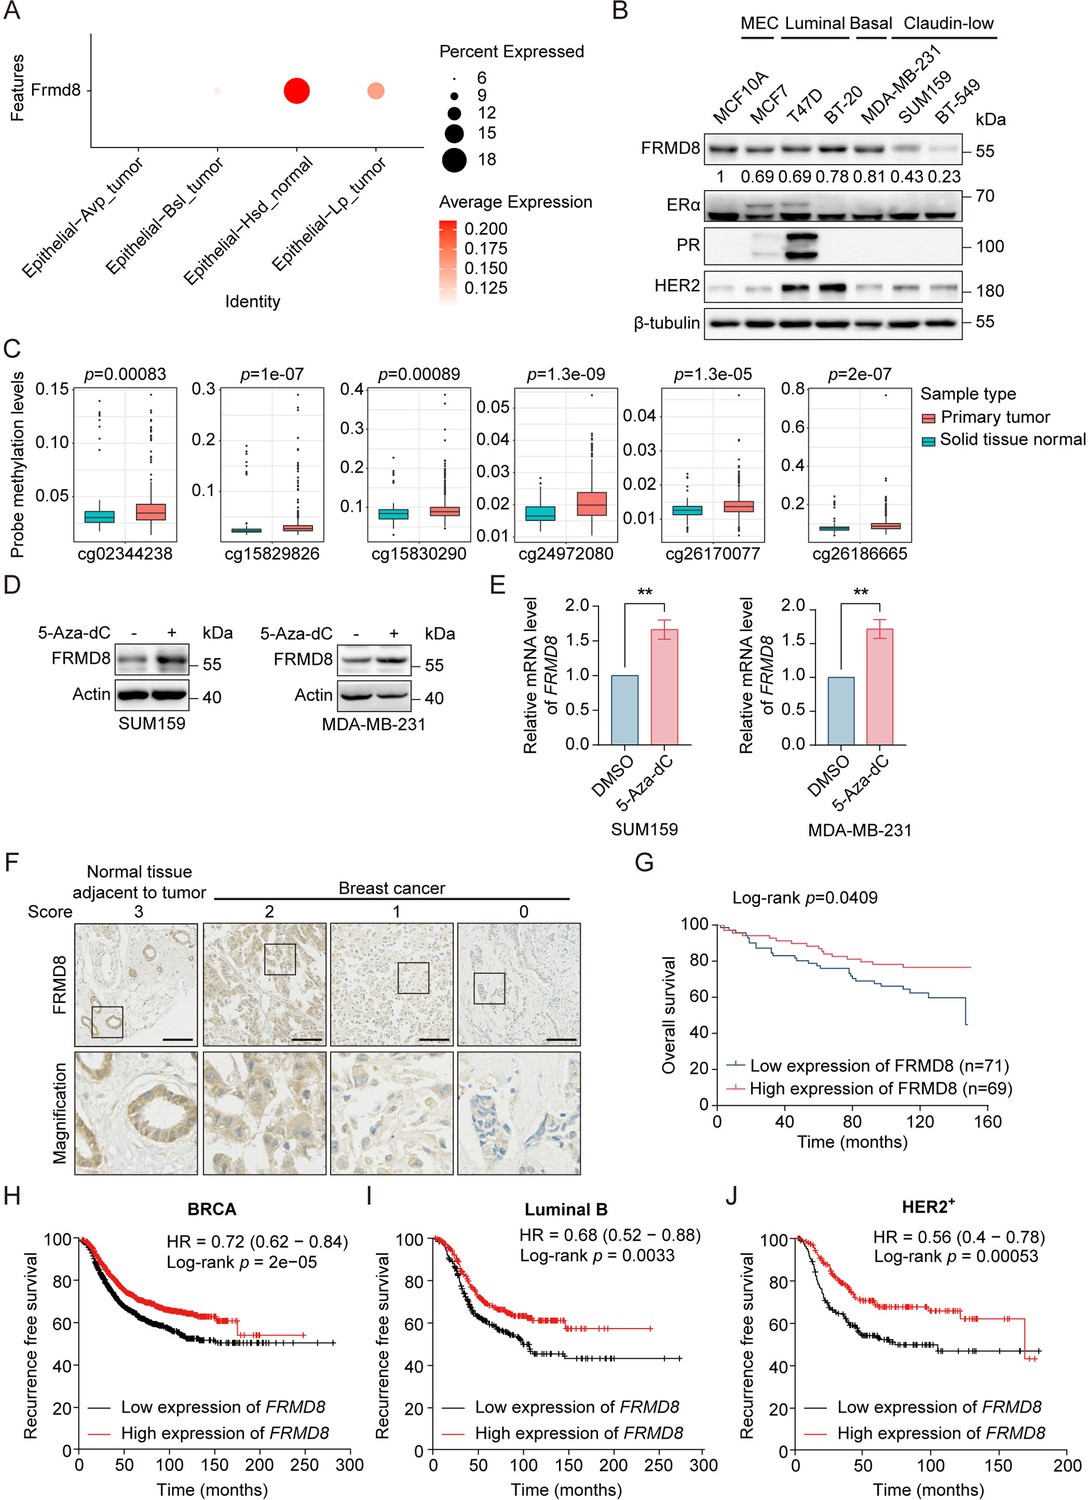
FRMD8 promoter is methylated and low FRMD8 level predicts poor prognosis in breast cancer patients.
(A) Dot plot showing the expression of Frmd8 in epithelial cell lineages from PyMT mice. (B) Lysates from human mammary epithelial cell (MEC) and breast cancer cells were subjected to immunoblotting. (C) Methylation of FRMD8 promoter region in breast cancer according to the University of California Santa Cruz (UCSC) database (http://xena.ucsc.edu/). (D) SUM159 and MDA-MB-231 cells were treated with 5-Aza-dC (10 μM) for 48 h. Protein expression of FRMD8 was examined by western blot. (E) SUM159 and MDA-MB-231 cells were treated with 5-Aza-dC (10 μM) for 48 h. FRMD8 mRNA levels was examined by quantitative reverse transcription PCR (qRT-PCR) GAPDH was used as an internal reference. **p<0.01 by unpaired Student’s t-test, n = 3. (F) IHC analysis of FRMD8 expression in human breast carcinoma TMA was performed. Representative examples (scale bar, 100 μm) of normal tissue adjacent to tumor and breast cancer with different levels of FRMD8 expression are shown, with the magnification of selected areas inserted. (G) Kaplan–Meier analysis for the overall survival of breast cancer patients according to FRMD8 expression (Log-rank test). (H–J) Recurrence-free survival of breast cancer patients according to FRMD8 expression were analyzed according to Kaplan–Meier plotter (http://kmplot.com/analysis/).
-
Figure 6—source data 1
Unedited western blot pictures for Figure 6, indicating the relevant bands.
- https://cdn.elifesciences.org/articles/101888/elife-101888-fig6-data1-v1.pdf
-
Figure 6—source data 2
Original files for western blot pictures displayed in Figure 6.
- https://cdn.elifesciences.org/articles/101888/elife-101888-fig6-data2-v1.zip
Figure 6—figure supplement 1
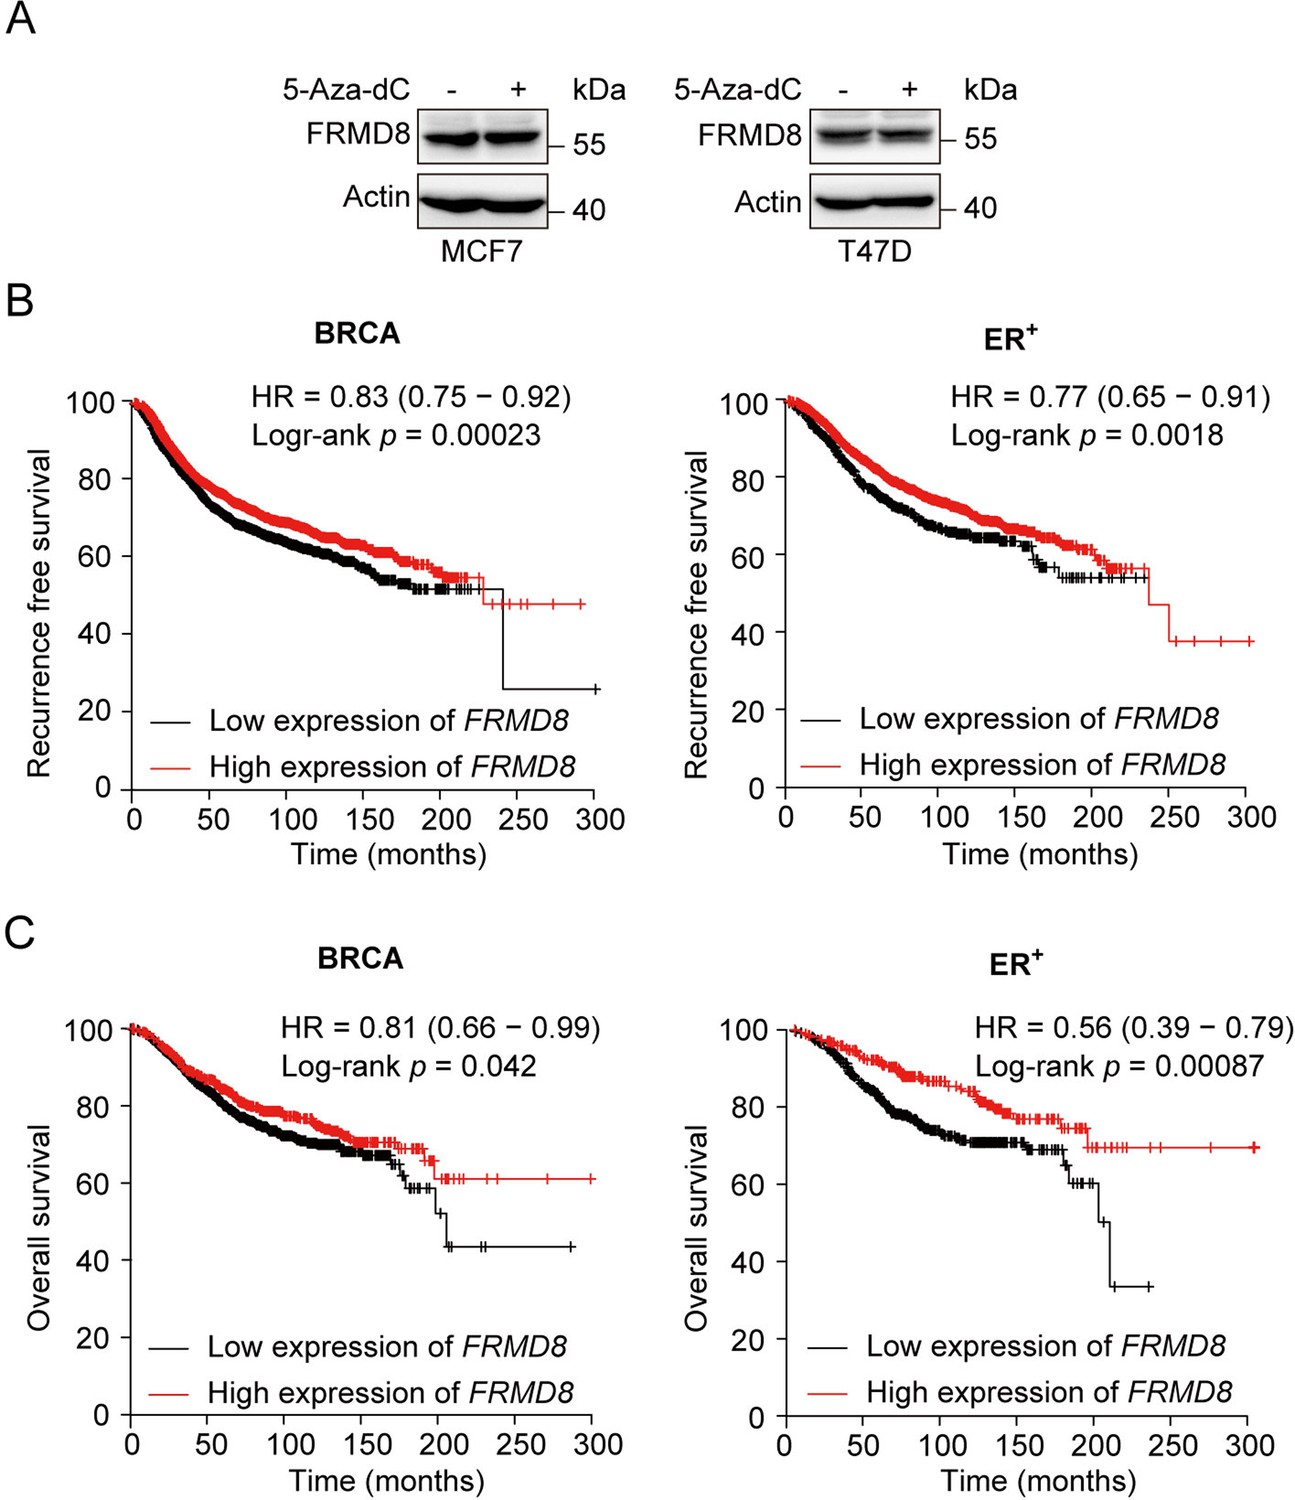
FRMD8 promoter is methylated and low FRMD8 level predicts poor prognosis in breast cancer patients.
(A) MCF7 and T47D cells were treated with 5-Aza-dC (10 μM) for 48 h. Protein expression of FRMD8 was examined by western blot. (B, C) Recurrence-free survival (B) and overall survival (C) of breast cancer patients with tamoxifen treatment according to FRMD8 expression were analyzed according to Kaplan–Meier plotter.
-
Figure 6—figure supplement 1—source data 1
Unedited western blot pictures for Figure 6—figure supplement 1, indicating the relevant bands.
- https://cdn.elifesciences.org/articles/101888/elife-101888-fig6-figsupp1-data1-v1.pdf
-
Figure 6—figure supplement 1—source data 2
Original files for western blot pictures displayed in Figure 6—figure supplement 1.
- https://cdn.elifesciences.org/articles/101888/elife-101888-fig6-figsupp1-data2-v1.zip
Figure 7
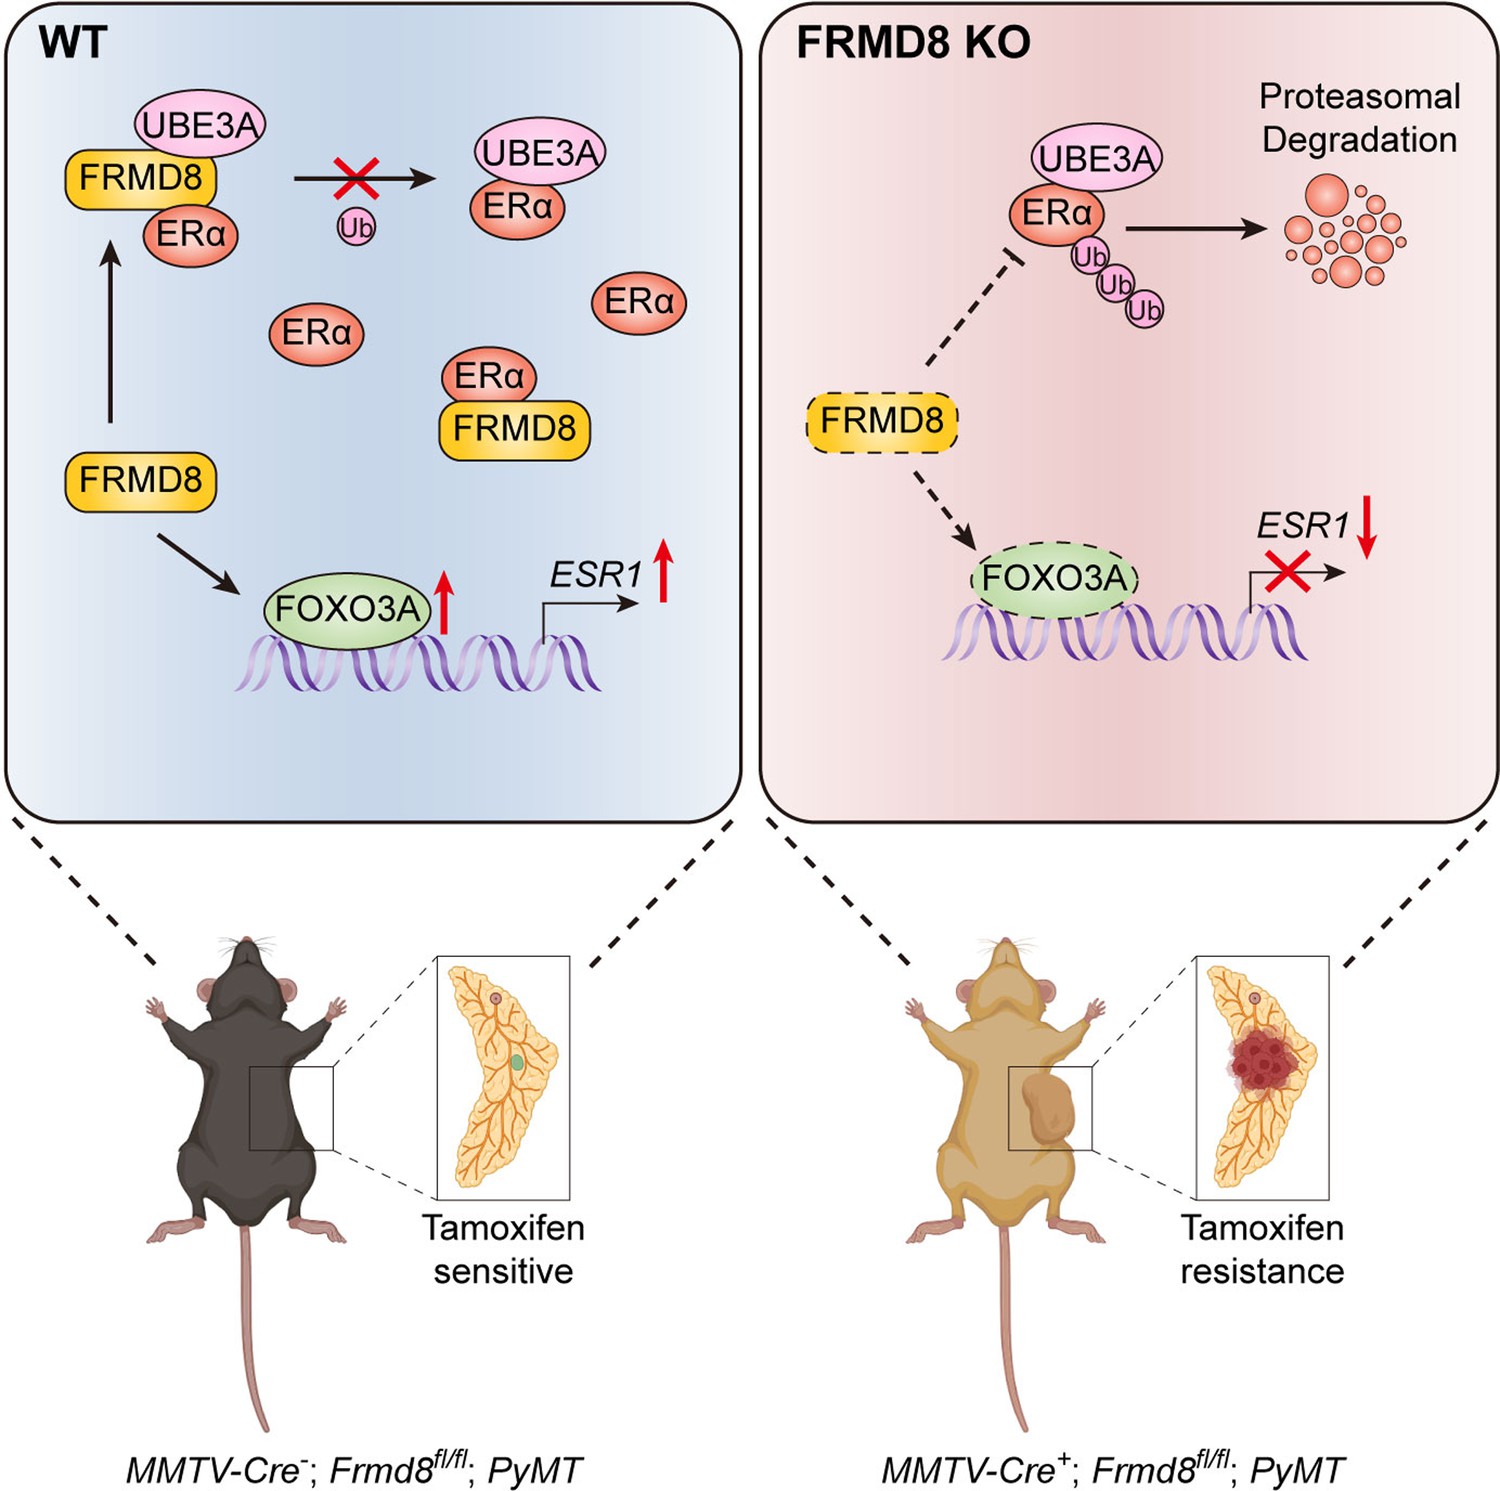
A working model shows that loss of FRMD8 promotes mammary tumor progression and confers tamoxifen resistance by downregulating ERα expression at both transcriptional and post-translational levels.
Author response image 1
Additional files
-
Supplementary file 1
Mass spectrometry (MS) analyses of HEK293A cells transiently expressing Flag-FRMD8.
- https://cdn.elifesciences.org/articles/101888/elife-101888-supp1-v1.xlsx
-
Supplementary file 2
Primers for genotyping, RNA silencing, and qRT-PCR.
- https://cdn.elifesciences.org/articles/101888/elife-101888-supp2-v1.docx
-
Supplementary file 3
Patient information of tissue microarray.
- https://cdn.elifesciences.org/articles/101888/elife-101888-supp3-v1.xlsx
-
MDAR checklist
- https://cdn.elifesciences.org/articles/101888/elife-101888-mdarchecklist1-v1.pdf
Download links
A two-part list of links to download the article, or parts of the article, in various formats.
Downloads (link to download the article as PDF)
Open citations (links to open the citations from this article in various online reference manager services)
Cite this article (links to download the citations from this article in formats compatible with various reference manager tools)
Loss function of tumor suppressor FRMD8 confers resistance to tamoxifen therapy via a dual mechanism
eLife 13:RP101888.
https://doi.org/10.7554/eLife.101888.3


