Alzheimer-mutant γ-secretase complexes stall amyloid β-peptide production
- Department of Medicinal Chemistry, University of Kansas, United States
- Alzheimer Research Unit, MassGeneral Institute for Neurodegenerative Disease, Massachusetts General Hospital, Harvard Medical School, United States
Figures
Figure 1 with 3 supplements
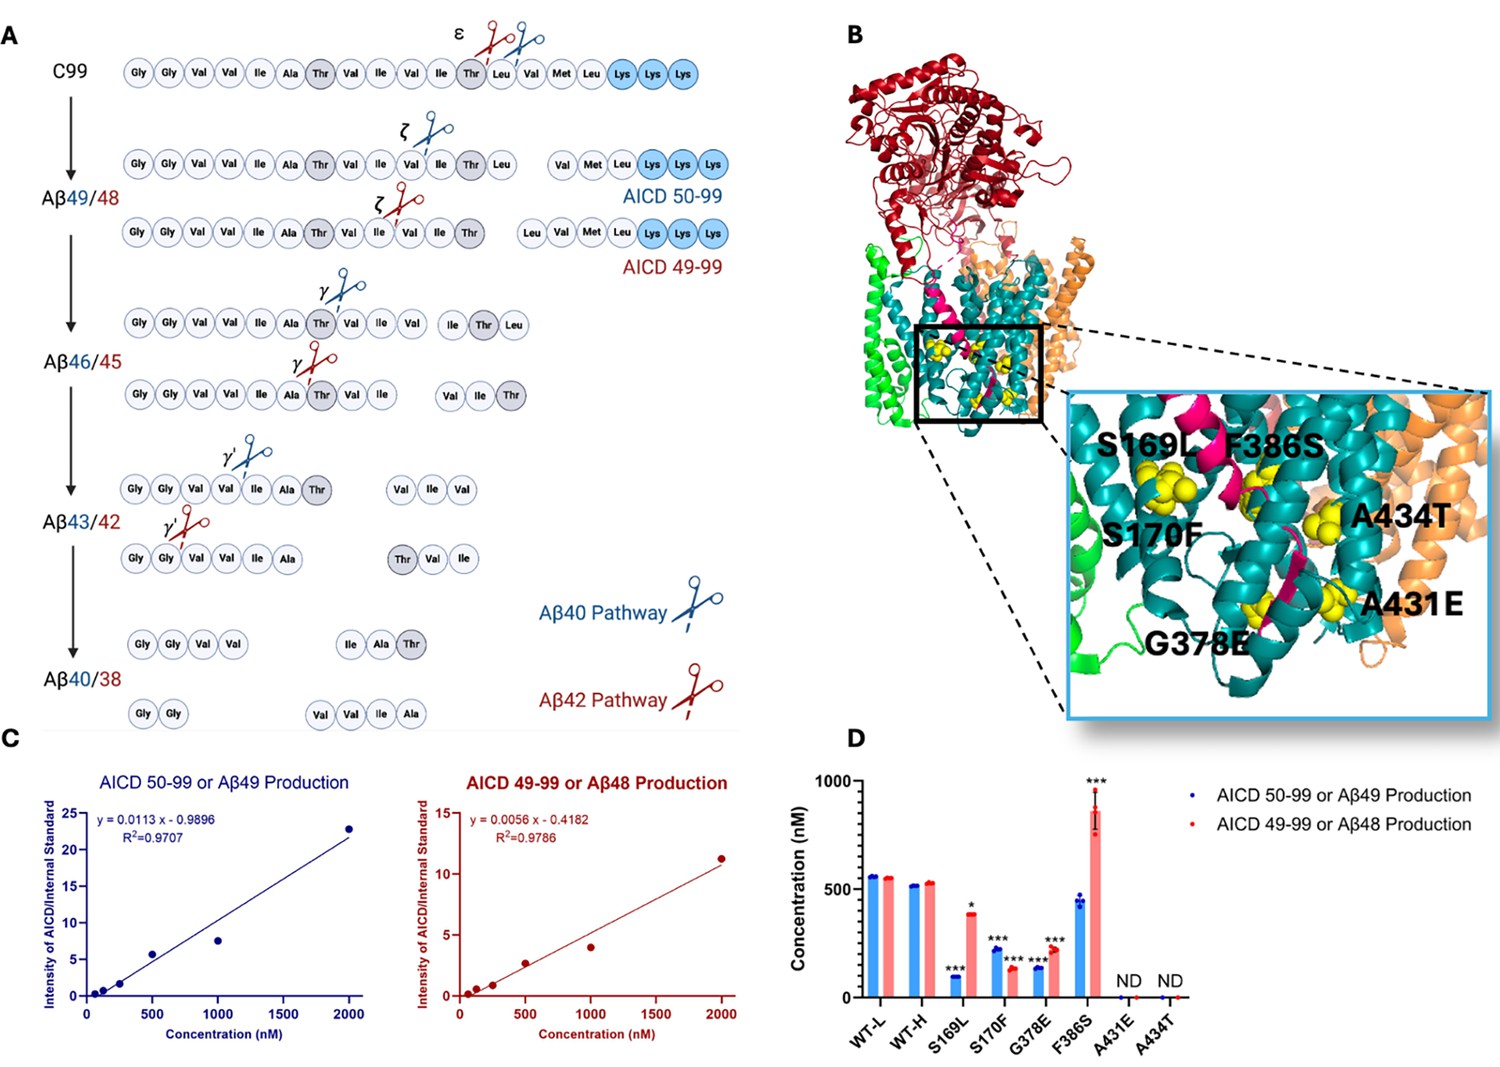
Effects of familial Alzheimer’s disease (FAD)-mutant PSEN1 on endoproteolysis of C99 by γ-secretase.
(A) Diagram of proteolytic cleavage of APP substrate by γ-secretase via two pathways. (B) Ribbon diagram of APP substrate bound to γ-secretase. The six FAD PSEN1 mutations studied in this paper are highlighted in yellow with side chain atoms as spheres. (C) Standard curves for APP intracellular domain (AICD) 50–99-Flag and AICD 49–99-Flag, coproducts of Aβ49 and Aβ48, respectively, were generated by matrix-assisted laser desorption/ionization time-of-flight (MALDI-TOF) using synthetic peptides, with insulin as an internal standard. (D) Quantification of AICD-Flag peptides from enzyme reactions of recombinant APP substrate C100-Flag with wild-type (WT) vs. FAD-mutant proteases by MALDI-TOF mass spectrometry (MS). Standard curves were used to quantify AICD levels for all reactions. Detection limits prevented measurement of AICD-Flag production below 62.5 nM (the lowest standard concentration) for two mutations (A431E and A434T). Consequently, these concentrations are marked as not determined (nd). In all graphs, n=4 and error bars represent s.d. Statistical comparisons between AICD product levels from FAD-mutant vs. wild-type (WT) enzymes were performed using unpaired two-tailed t-tests (*p<0.05, **p<0.01, ***p<0.001). All data describe biological replicates, and experiments were replicated in two independent experiments.
-
Figure 1—source data 1
Spreadsheet contains mass spectrometry data for AICD49-99 and AICD50-99 associated with panels C and D.
- https://cdn.elifesciences.org/articles/102274/elife-102274-fig1-data1-v1.xlsx
Figure 1—figure supplement 1
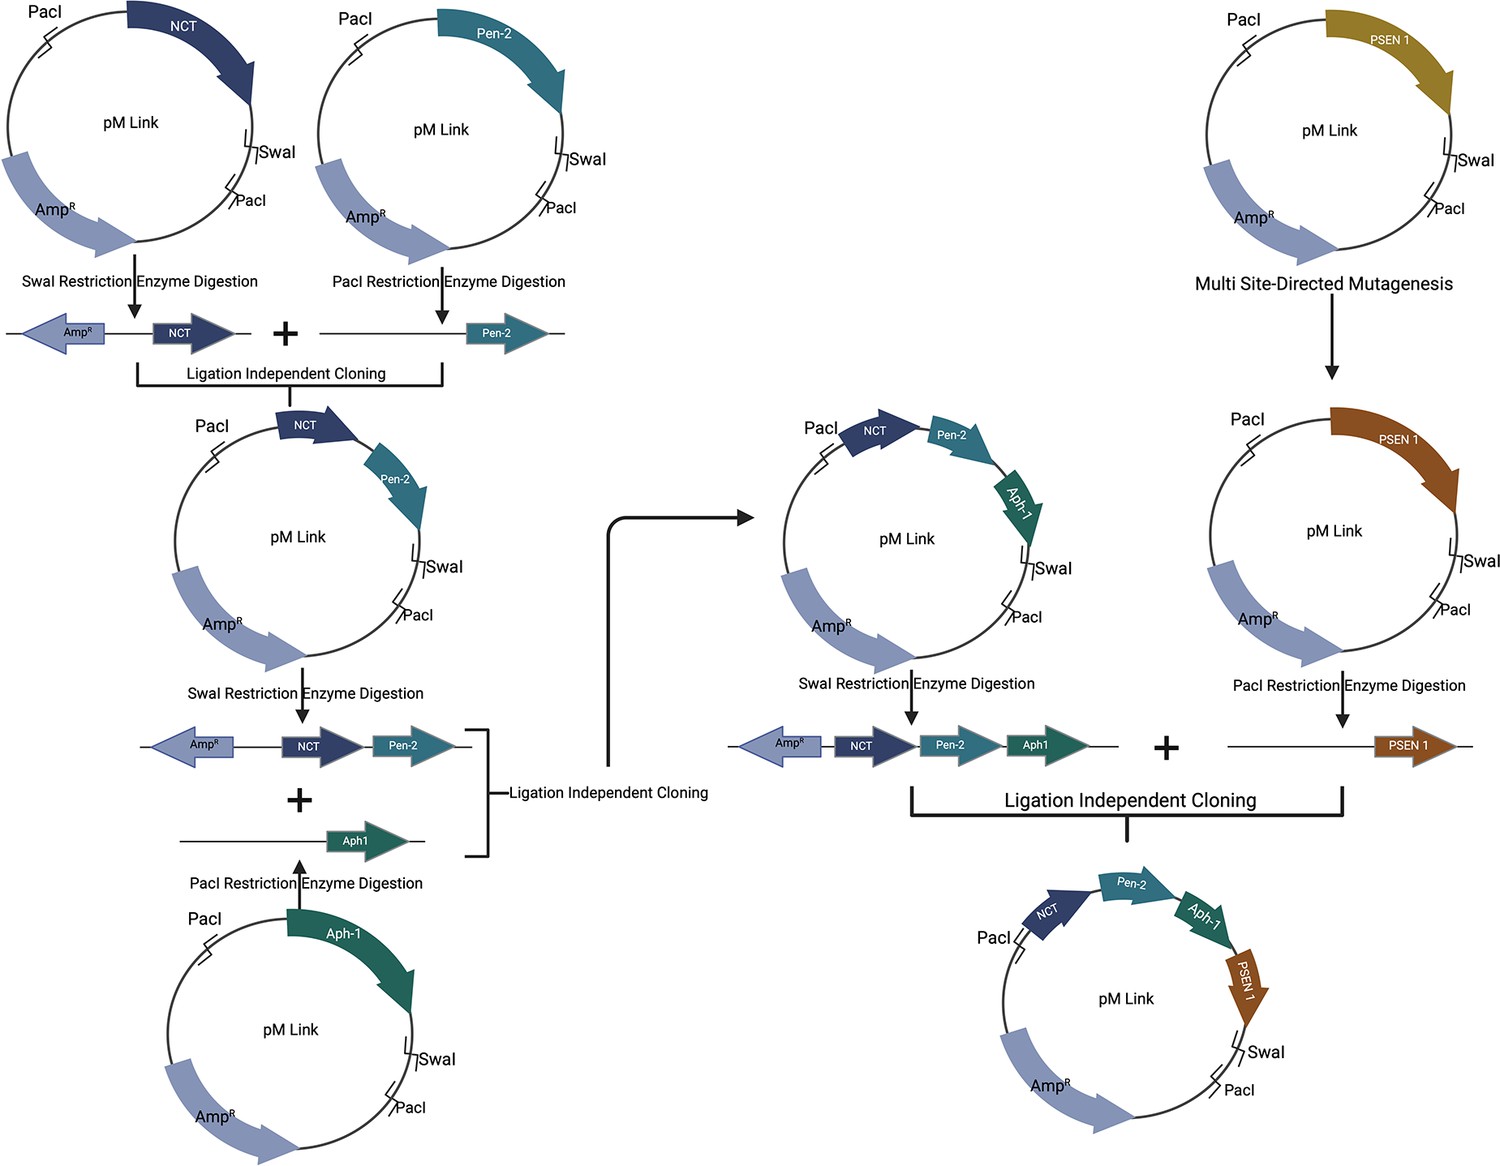
Process of installing PSEN-1 mutations into full γ-secretase plasmid.
Step-by-step ligation-independent cloning (LIC) was developed in Escherichia coli, along with restriction digestion of both the insert and vector, enabling the successful insertion of mutations. A tricistronic plasmid containing genetic codes for three membrane protein components of the γ-secretase complex, including nicastrin, presenilin enhancer (Pen2), and anterior pharynx-defective 1 (Aph1) was prepared. This plasmid was created in two steps: initially, nicastrin and Pen2 were combined using LIC in E. coli and restriction digestion, forming a bicistronic plasmid. Subsequently, the bicistronic plasmid was further modified by including Aph1 through another round of restriction digestion and LIC in E. coli, resulting in a tricistronic plasmid. Finally, multi-site-directed mutagenesis was used to mutate PSEN1, and this monocistronic construct was incorporated into the tricistronic plasmid through additional rounds of restriction digestion and LIC in E. coli. Figure 1 illustrates the details of this process.
Figure 1—figure supplement 2
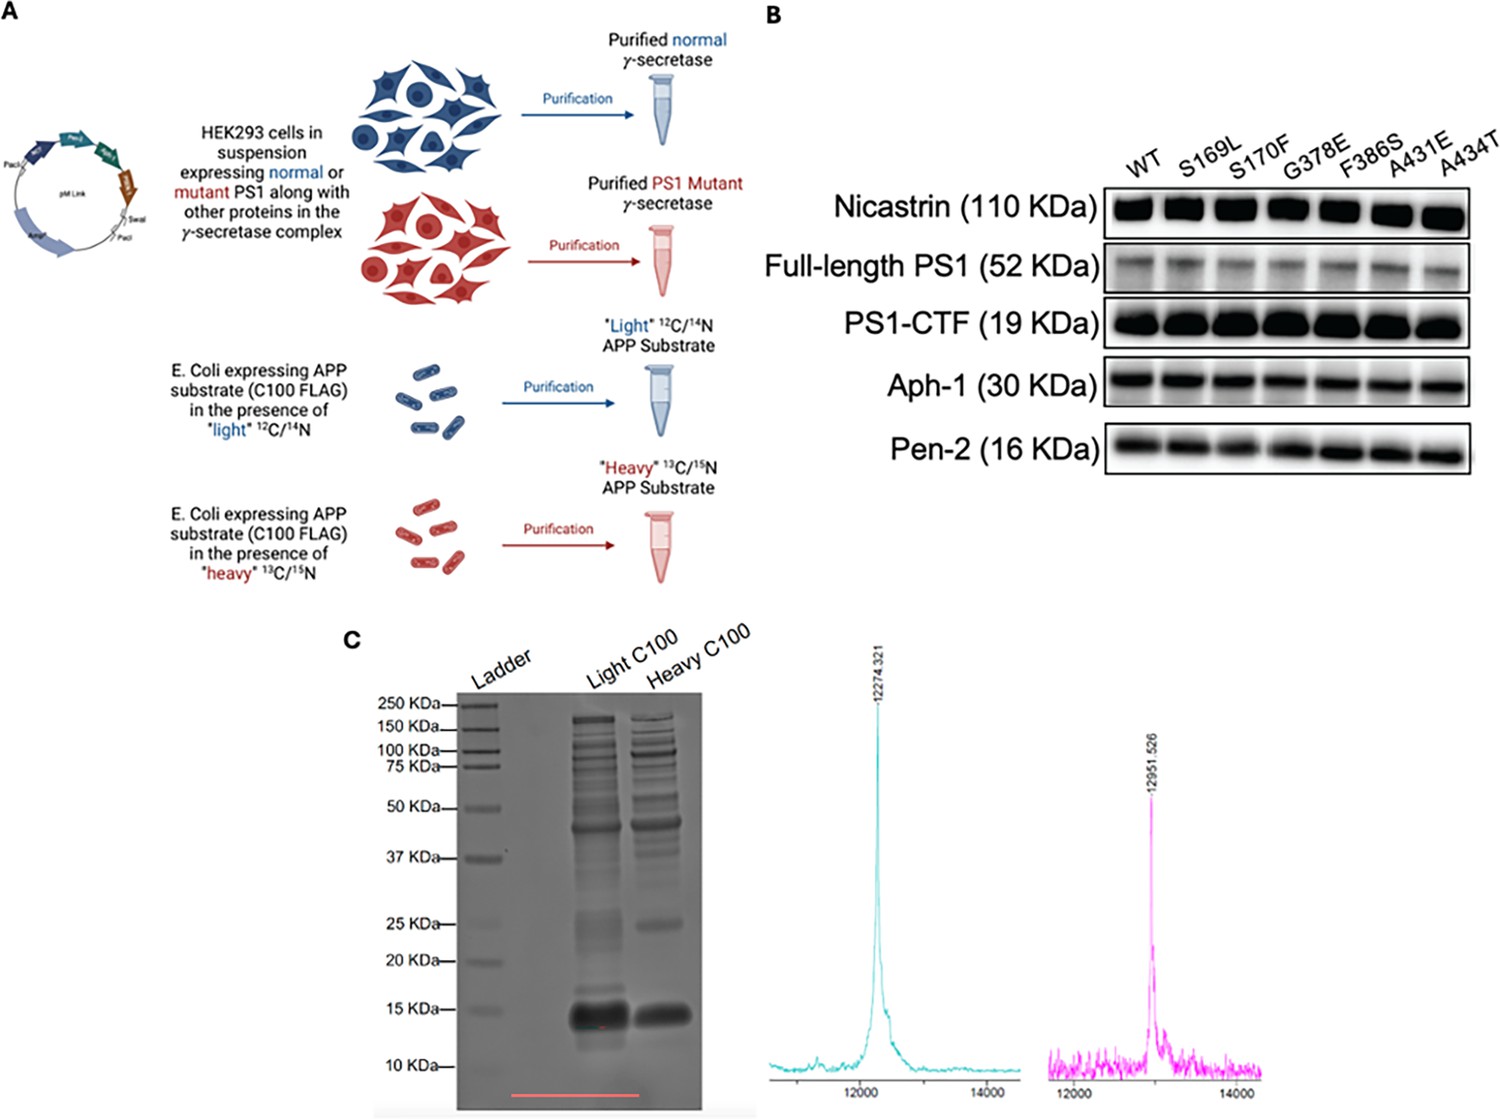
Expression, purification, and quality control of C100 substrate and γ-secretase.
(A) Schematic of expression and purification of γ-secretase and C100. (B) Western blot analysis of all components within expressed and purified wild-type (WT) and familial Alzheimer’s disease (FAD)-mutant γ-secretase complexes, normalized to protein concentration using Pen2 intensity. (C) Characterization of light and heavy isotopic C100-FLAG substrates. The identity and purity of both C100-FLAG variants were assessed using SDS-PAGE with silver staining and matrix-assisted laser desorption/ionization time-of-flight (MALDI-TOF) mass spectrometry. The theoretical masses are 12272.89 for the light C100-FLAG and 12951.6 for the heavy C100-FLAG. Prior to reactions, concentrations were normalized based on band intensity in western blotting.
-
Figure 1—figure supplement 2—source data 1
Zip file contains images of western blots for gamma-secretase components.
- https://cdn.elifesciences.org/articles/102274/elife-102274-fig1-figsupp2-data1-v1.zip
-
Figure 1—figure supplement 2—source data 2
Zip file contains a powerpoint file of western blots for gamma-secretase components, with labeling of molecular weight markers.
- https://cdn.elifesciences.org/articles/102274/elife-102274-fig1-figsupp2-data2-v1.zip
Figure 1—figure supplement 3
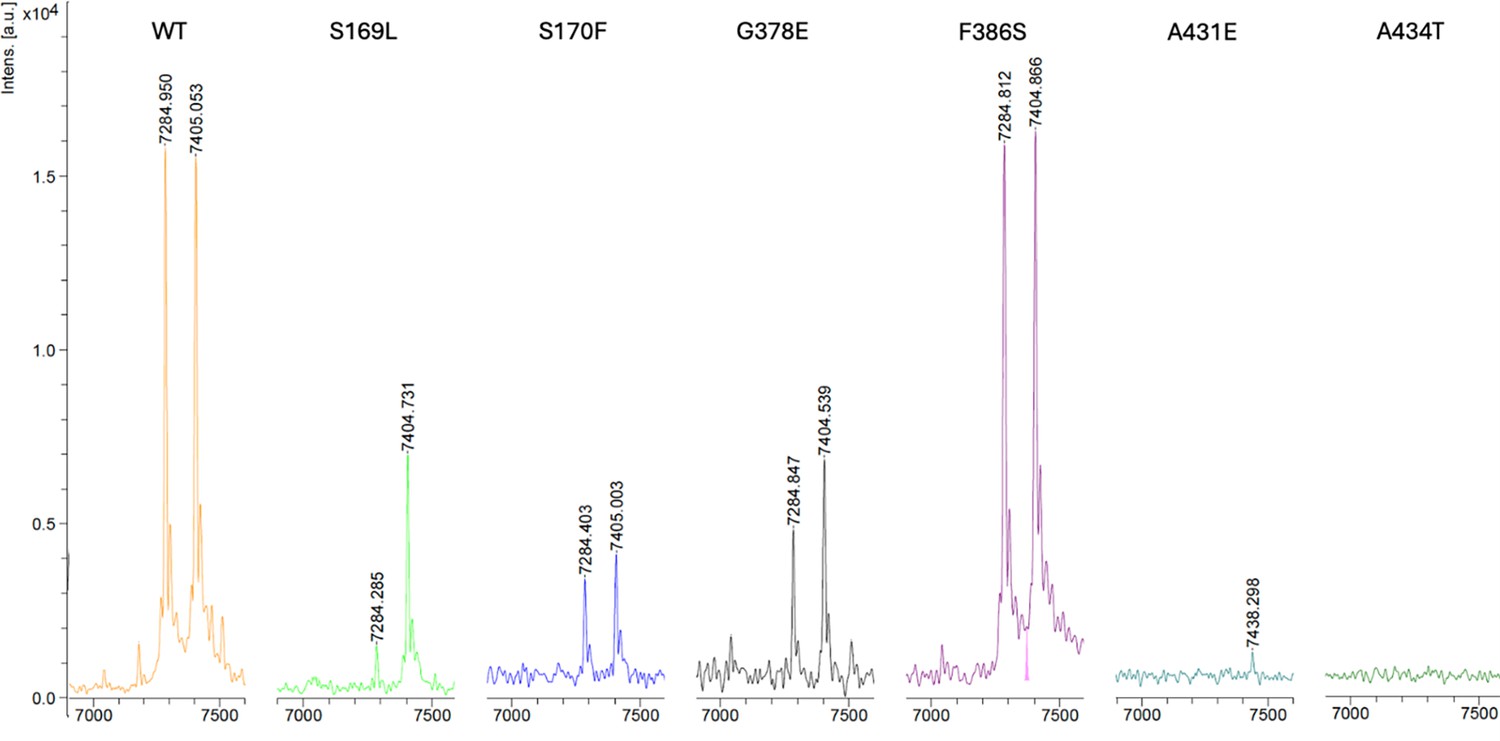
Matrix-assisted laser desorption/ionization time-of-flight mass spectrometry (MALDI-TOF MS) detection of APP intracellular domain (AICD) 50–99 and AICD 49–99 products from wild-type (WT) and six PSEN1 familial Alzheimer’s disease (FAD)-mutant γ-secretase.
The theoretical mass for AICD 50–99 is 7286.02 Da, and for AICD 49–99 is 7406.12 Da.
Figure 2 with 1 supplement
Alzheimer-mutant PSEN-1 affects the processive proteolysis of C99 by γ-secretase.
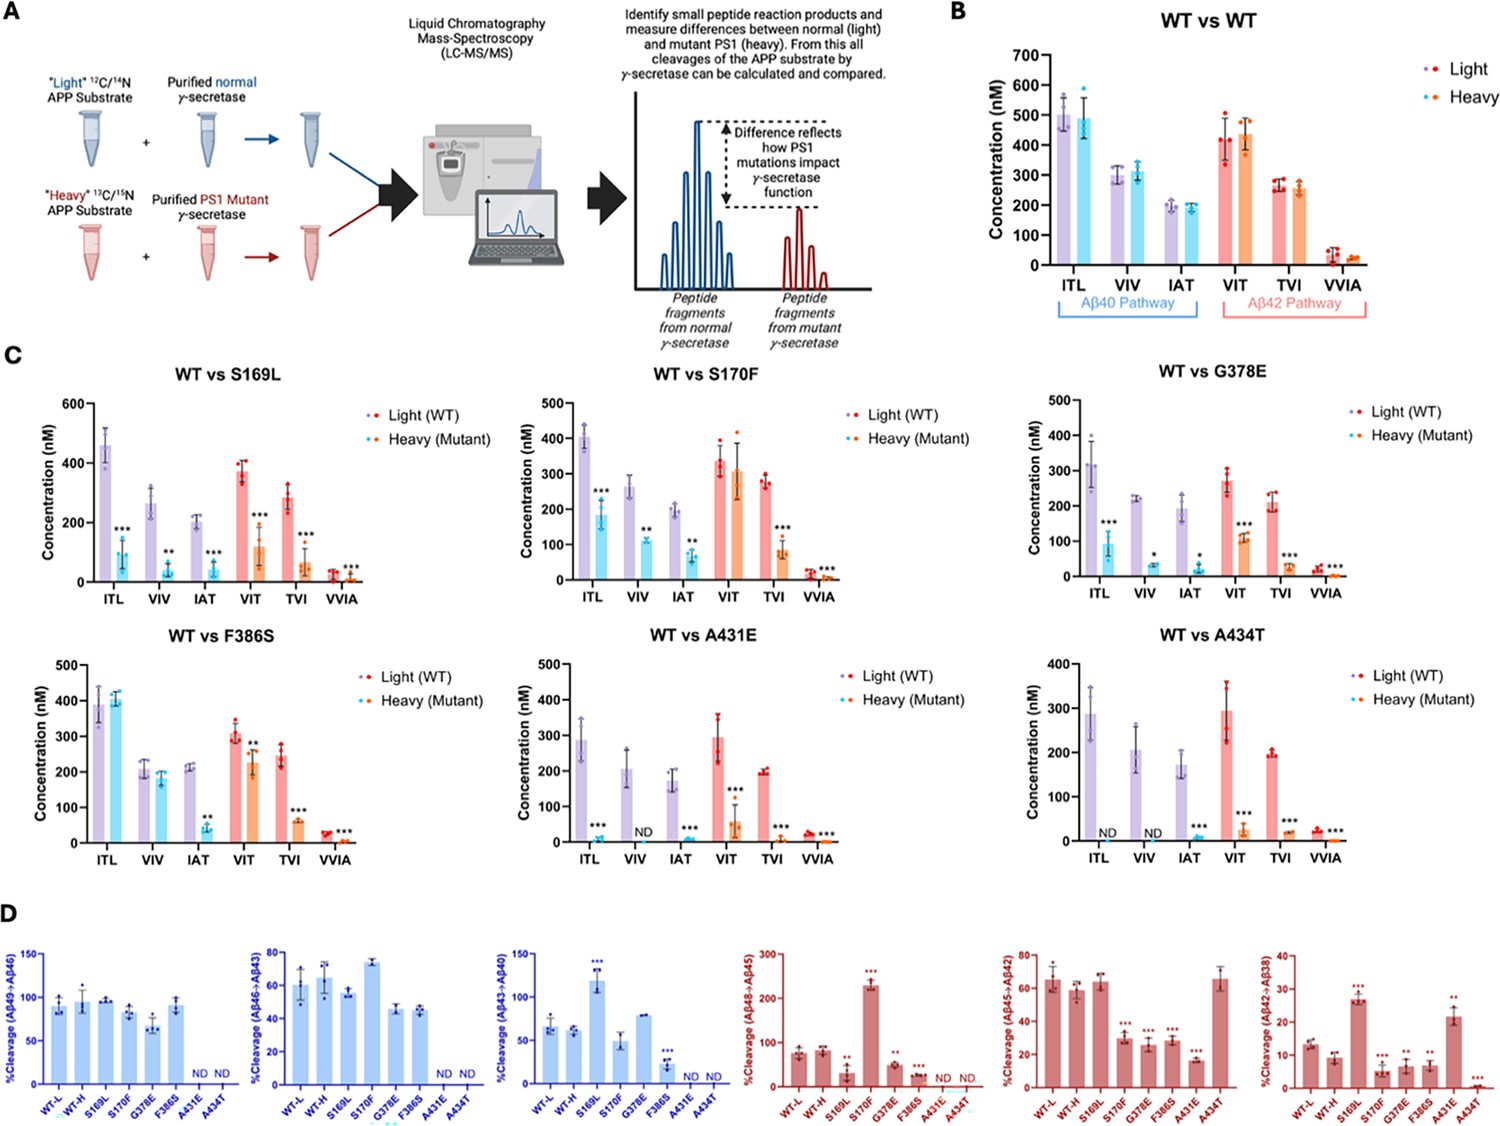
(A) Schematic representation of the reaction mixtures and their preparation, analyzed by liquid chromatography coupled with tandem mass spectrometry (LC-MS/MS) for the detection of tri- and tetrapeptide coproducts. (B) Comparison of tri- and tetrapeptide coproduct concentrations between wild-type (WT) enzyme incubated with light-isotope substrate and WT enzyme incubated with heavy-isotope substrate, as analyzed by LC-MS/MS. (C) Bar graphs illustrating all coproduct formation for specific mutations. For the Aβ49→Aβ40 pathway, blue and purple bars represent the first, second, and third trimming steps. Red and orange bars denote trimming steps for the Aβ48→Aβ38 pathway. Purple and red bars indicate coproducts formed by WT γ-secretase, while blue and orange bars indicated coproducts formed by familial Alzheimer’s disease (FAD)-mutant enzyme. (D) Bar graphs showing the percentage cleavage efficiency for each trimming step for mutant enzyme compared to WT enzyme. Cleavage events where the precursor Aβ peptide level was zero (i.e. no detected coproduct) are marked as not determined (nd). For each graph, n=4 and error bars represent s.d. Statistical significance was determined using unpaired two-tailed t-tests comparing FAD-mutant with WT enzyme reactions (*p<0.05, **p<0.01, ***p<0.001).
-
Figure 2—source data 1
Spreadsheet contains mass spectrometry data for peptide products associated with panels B and C as well as calculations from these data associated with panel D.
- https://cdn.elifesciences.org/articles/102274/elife-102274-fig2-data1-v1.xlsx
Figure 2—figure supplement 1
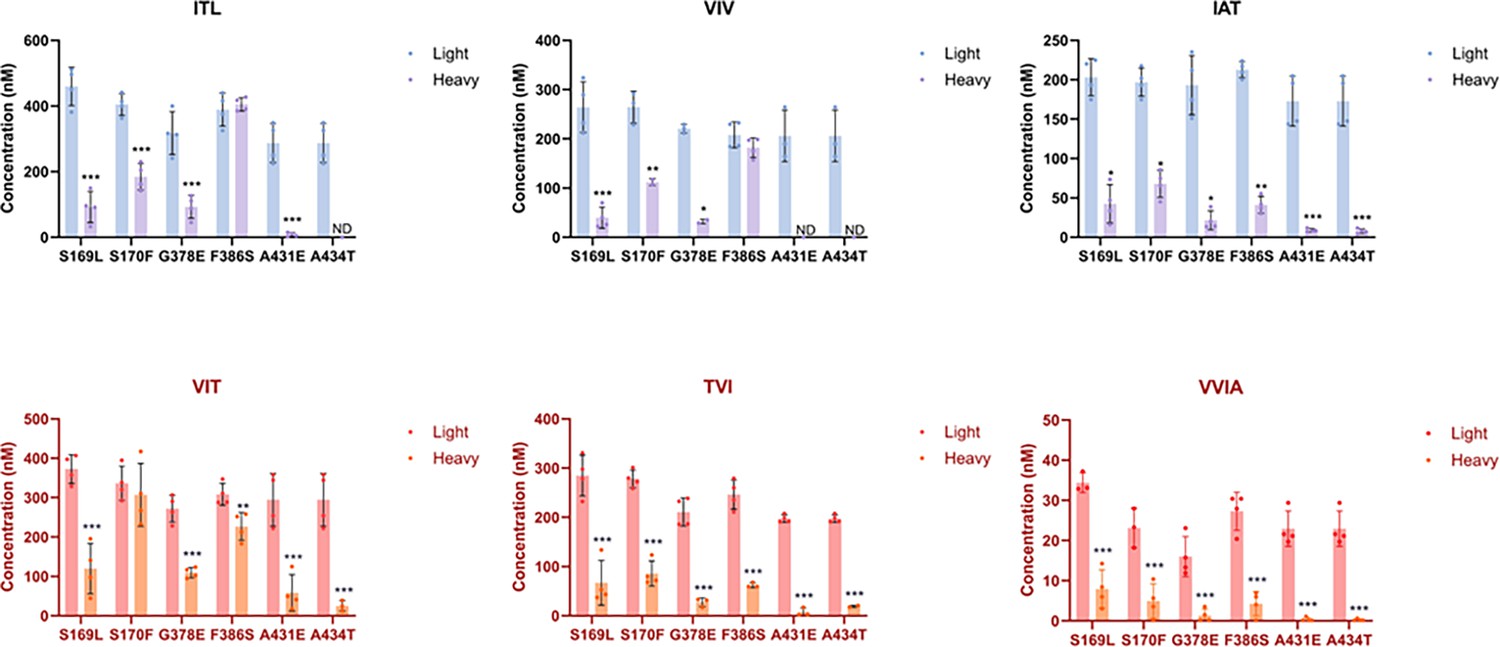
Alzheimer-mutant PSEN-1 affects the processive proteolysis of C99 by γ-secretase.
Bar graphs illustrating coproduct formation at each trimming step. For the Aβ49/Aβ40 pathway, blue and purple bars represent the first, second, and third trimming steps. Red and orange bars denote trimming steps for the Aβ48/Aβ38 pathway. Blue/red and purple/orange bars indicate coproducts formed by wild-type (WT) and familial Alzheimer’s disease (FAD)-mutant γ-secretase, respectively. For each graph, n=4 and error bars represent s.d. Statistical significance was determined using unpaired two-tailed t-tests comparing FAD mutants with WT (*p<0.05, **p<0.01, ***p<0.001). All data describe biological replicates, and experiments were replicated in two independent experiments. (Note: This figure is another representation of Figure 2C.)
Figure 3
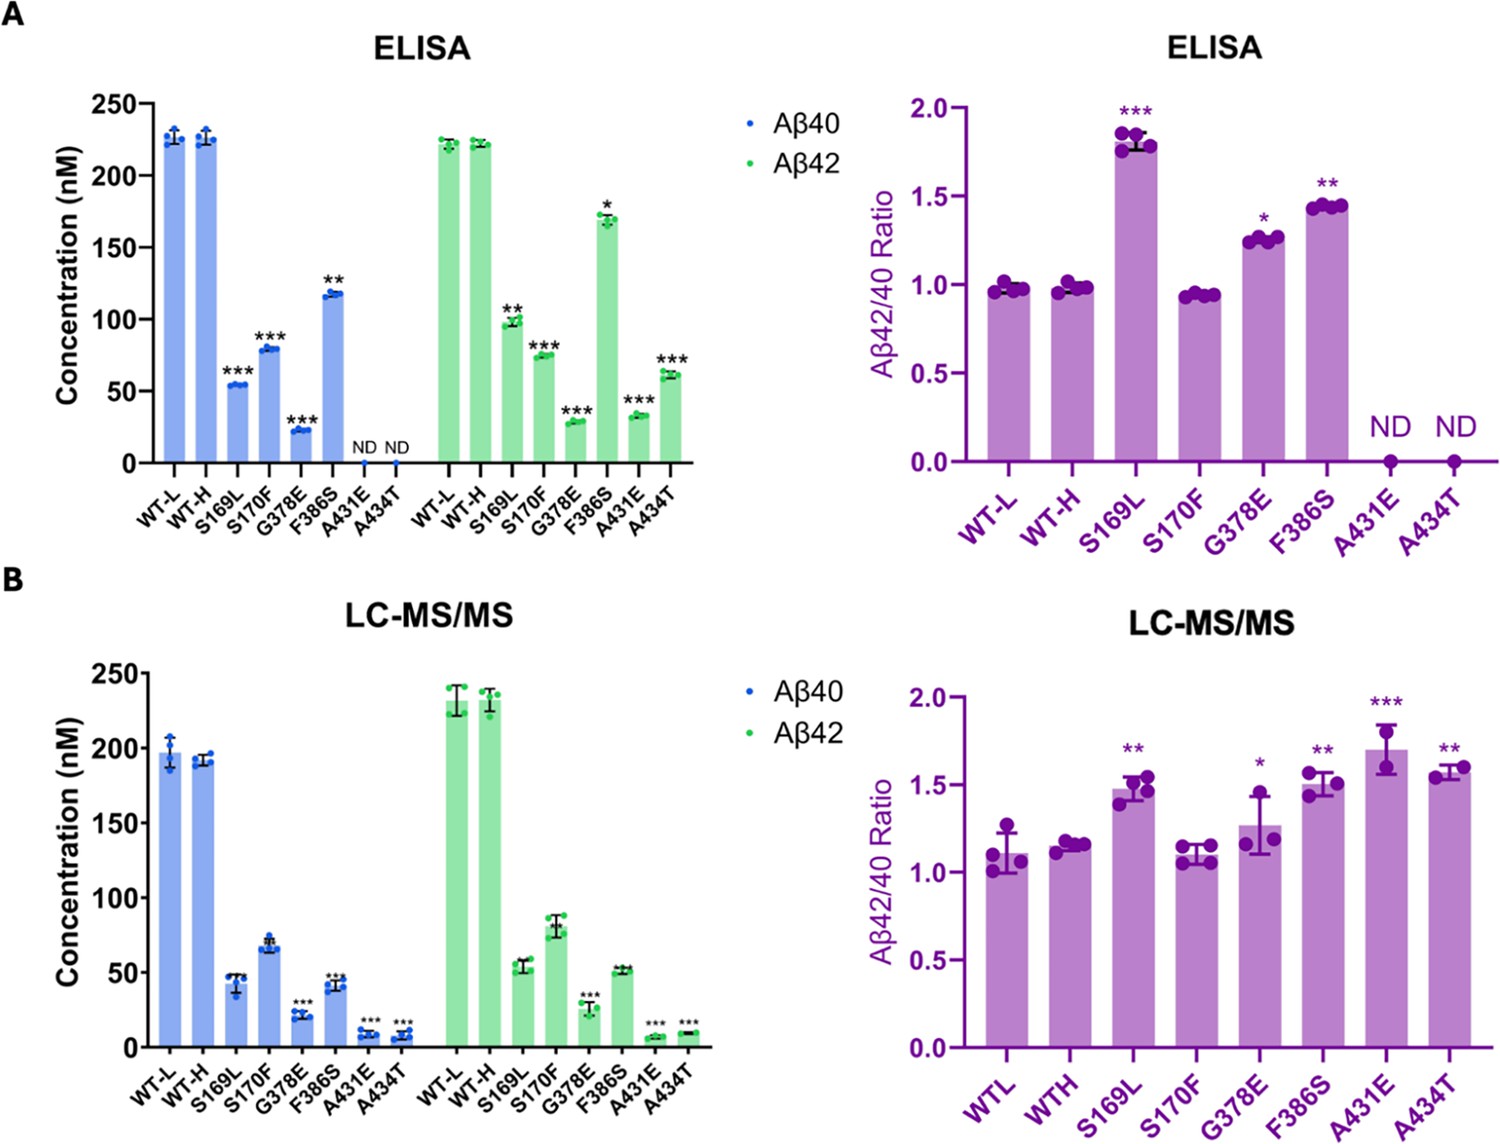
Comparison of Aβ40 and Aβ42 concentrations determined by liquid chromatography coupled with tandem mass spectrometry (LC-MS/MS) vs. ELISA.
Final Aβ40 and Aβ42 concentrations upon incubation of purified γ-secretase with C100-Flag and the resulting Aβ42/Aβ40 ratios assessed by (A) ELISAs and (B) LC-MS/MS calculations. n=4; error bars represent s.d.; unpaired two-tailed t-tests comparing familial Alzheimer’s disease (FAD)-mutant to wild-type (WT) enzyme reactions (*p≤0.05, **p≤0.01, ***p≤0.001). All data describe biological replicates, and experiments were replicated in two independent experiments.
-
Figure 3—source data 1
Spreadsheet contains ELISA data for Abeta40 and Abeta42 associated with panel A.
- https://cdn.elifesciences.org/articles/102274/elife-102274-fig3-data1-v1.xlsx
Figure 4 with 1 supplement
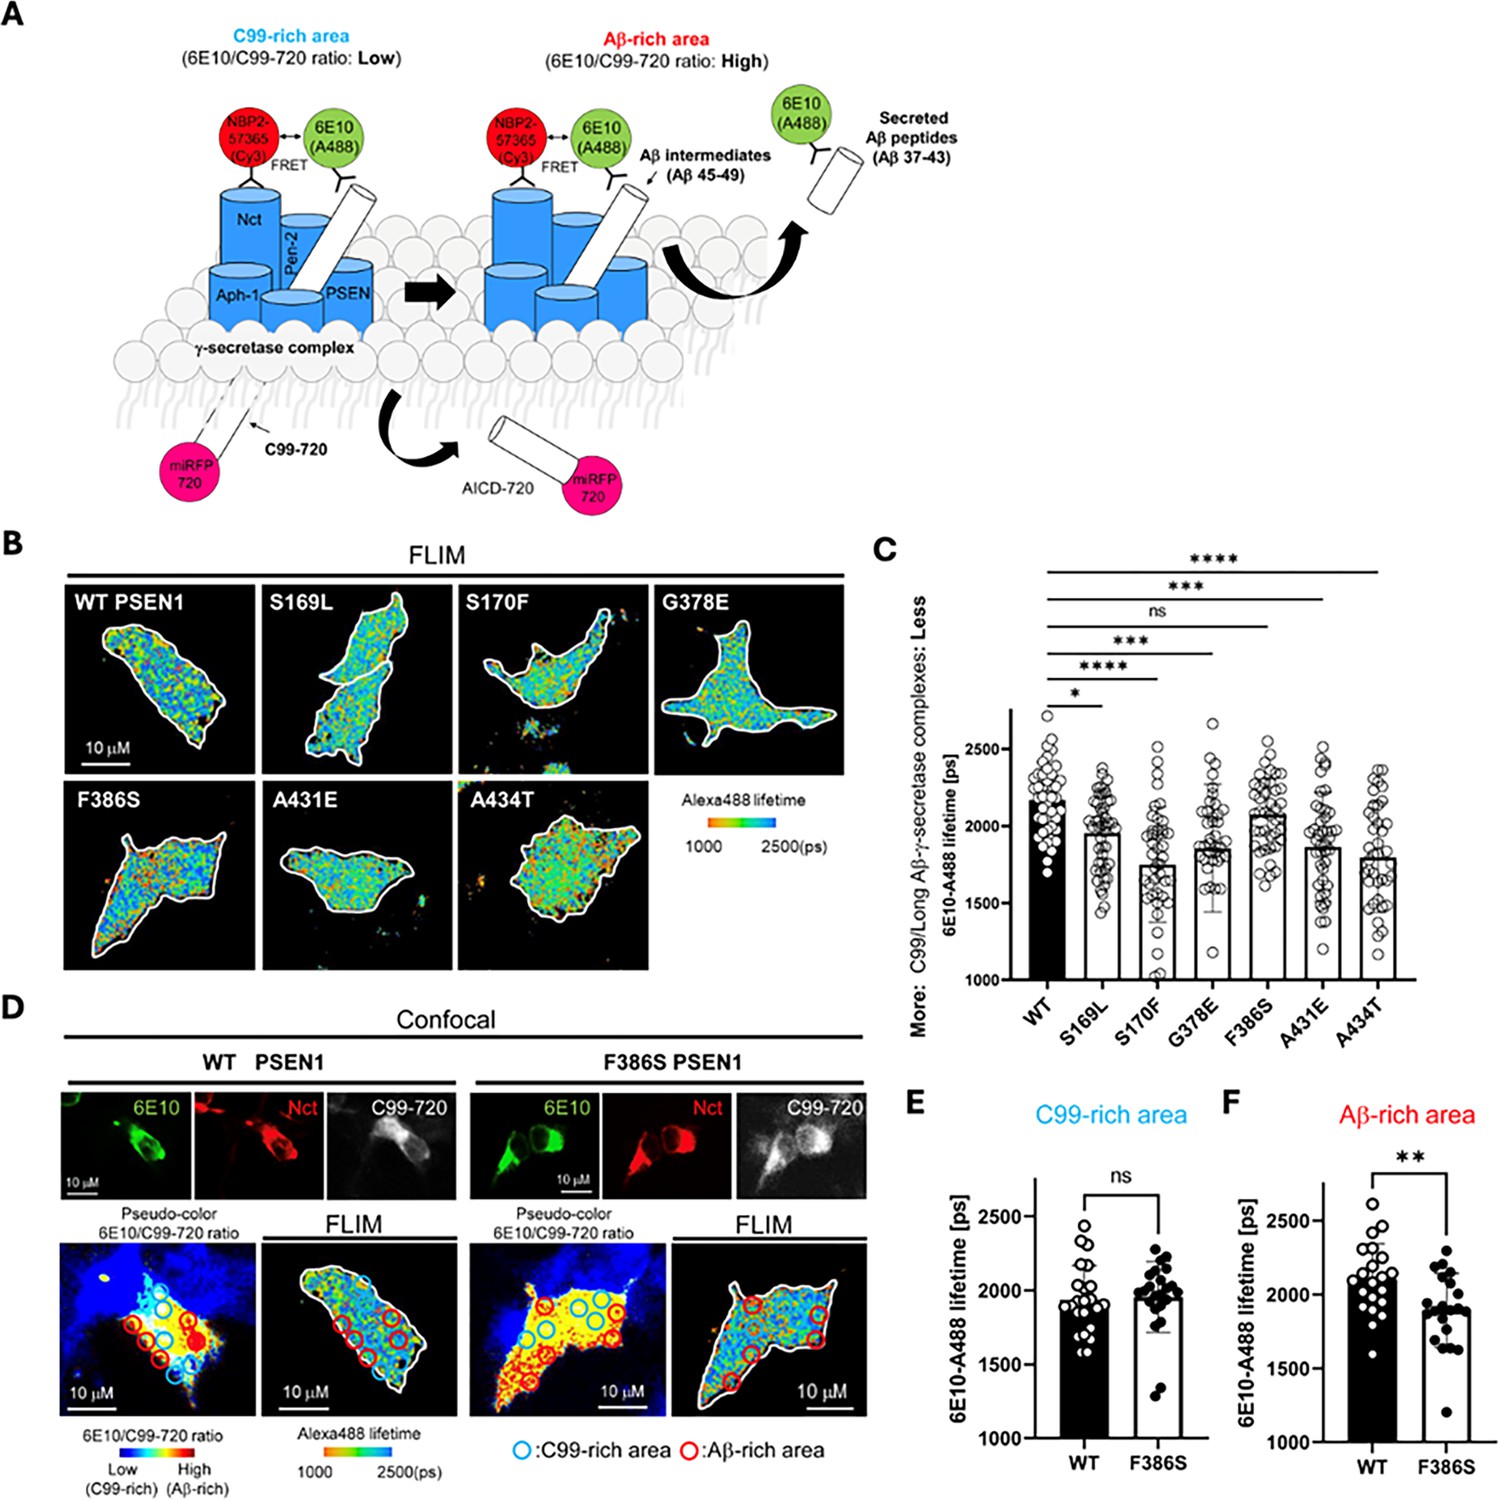
Familial Alzheimer’s disease (FAD)-mutant PS1 stabilizes γ-secretase enzyme-substrate (E-S) interaction.
(A) Design of fluorescence lifetime imaging microscopy (FLIM) set-up to detect E-S complexes of γ-secretase and C99/Aβ intermediates. 6E10-Alexa Fluor 488 over C99-720 fluorescence ratio (6E10-A488/C99-720 ratio) enables distinguishing C99-rich and Aβ-rich subcellular compartments. (B) PSEN1/2 dKO human embryonic kidney (HEK)293 cells were co-transfected with C99-720 and wild-type (WT) or FAD-mutant PSEN1. Transfected cells were immunostained with anti-C99/Aβ (mouse 6E10) and anti-nicastrin (rabbit NBP2-57365) primary antibodies and Alexa Fluor 488 (FRET donor) or Cy3 (acceptor)-conjugated anti-mouse and anti-rabbit IgG secondary antibodies, respectively. The donor 6E10-Alexa Fluor 488 (6E10-A488) lifetime was measured by FLIM. Energy transfer from the donor to the acceptor results in shortening of the donor lifetime. Scale bars, 10 µm. (C) 6E10-A488 lifetimes were analyzed in randomly selected regions of interest (ROIs) (n=40–47 from 6 to 8 cells), highlighting increased E-S complexes in the cells with FAD PSEN1 mutants, except F386S, compared to WT controls. One-way ANOVA and Tukey’s multiple comparisons test; n.s., p>0.05; *p<0.05; **p<0.01; ***p<0.001; ****p<0.0001. (D) Representative images of confocal, pseudo-color analysis to identify C99 or Aβ-rich subcellular areas and corresponding FLIM in WT or F386S PSEN1 expressing cells. Scale bars, 10 µm. (E) In the areas with lower 6E10-A488/C99-720 ratios (i.e. C99-rich areas), 6E10-A488 lifetimes were not different between the cells with WT PSEN1 and those with F386S mutant. n=21 ROIs. (F) On the other hand, 6E10-A488 lifetimes were significantly shorter in the cells expressing F386S mutant PSEN1 compared to WT controls in Aβ-rich ROIs (n=23). Unpaired t-test **p<0.01. All data describe biological replicates, and experiments were replicated in three independent experiments. Error bars represent s.d. in all cases.
-
Figure 4—source data 1
Spreadsheet contains fluorescence lifetime data associated with panels C, E and F.
- https://cdn.elifesciences.org/articles/102274/elife-102274-fig4-data1-v1.xlsx
Figure 4—figure supplement 1
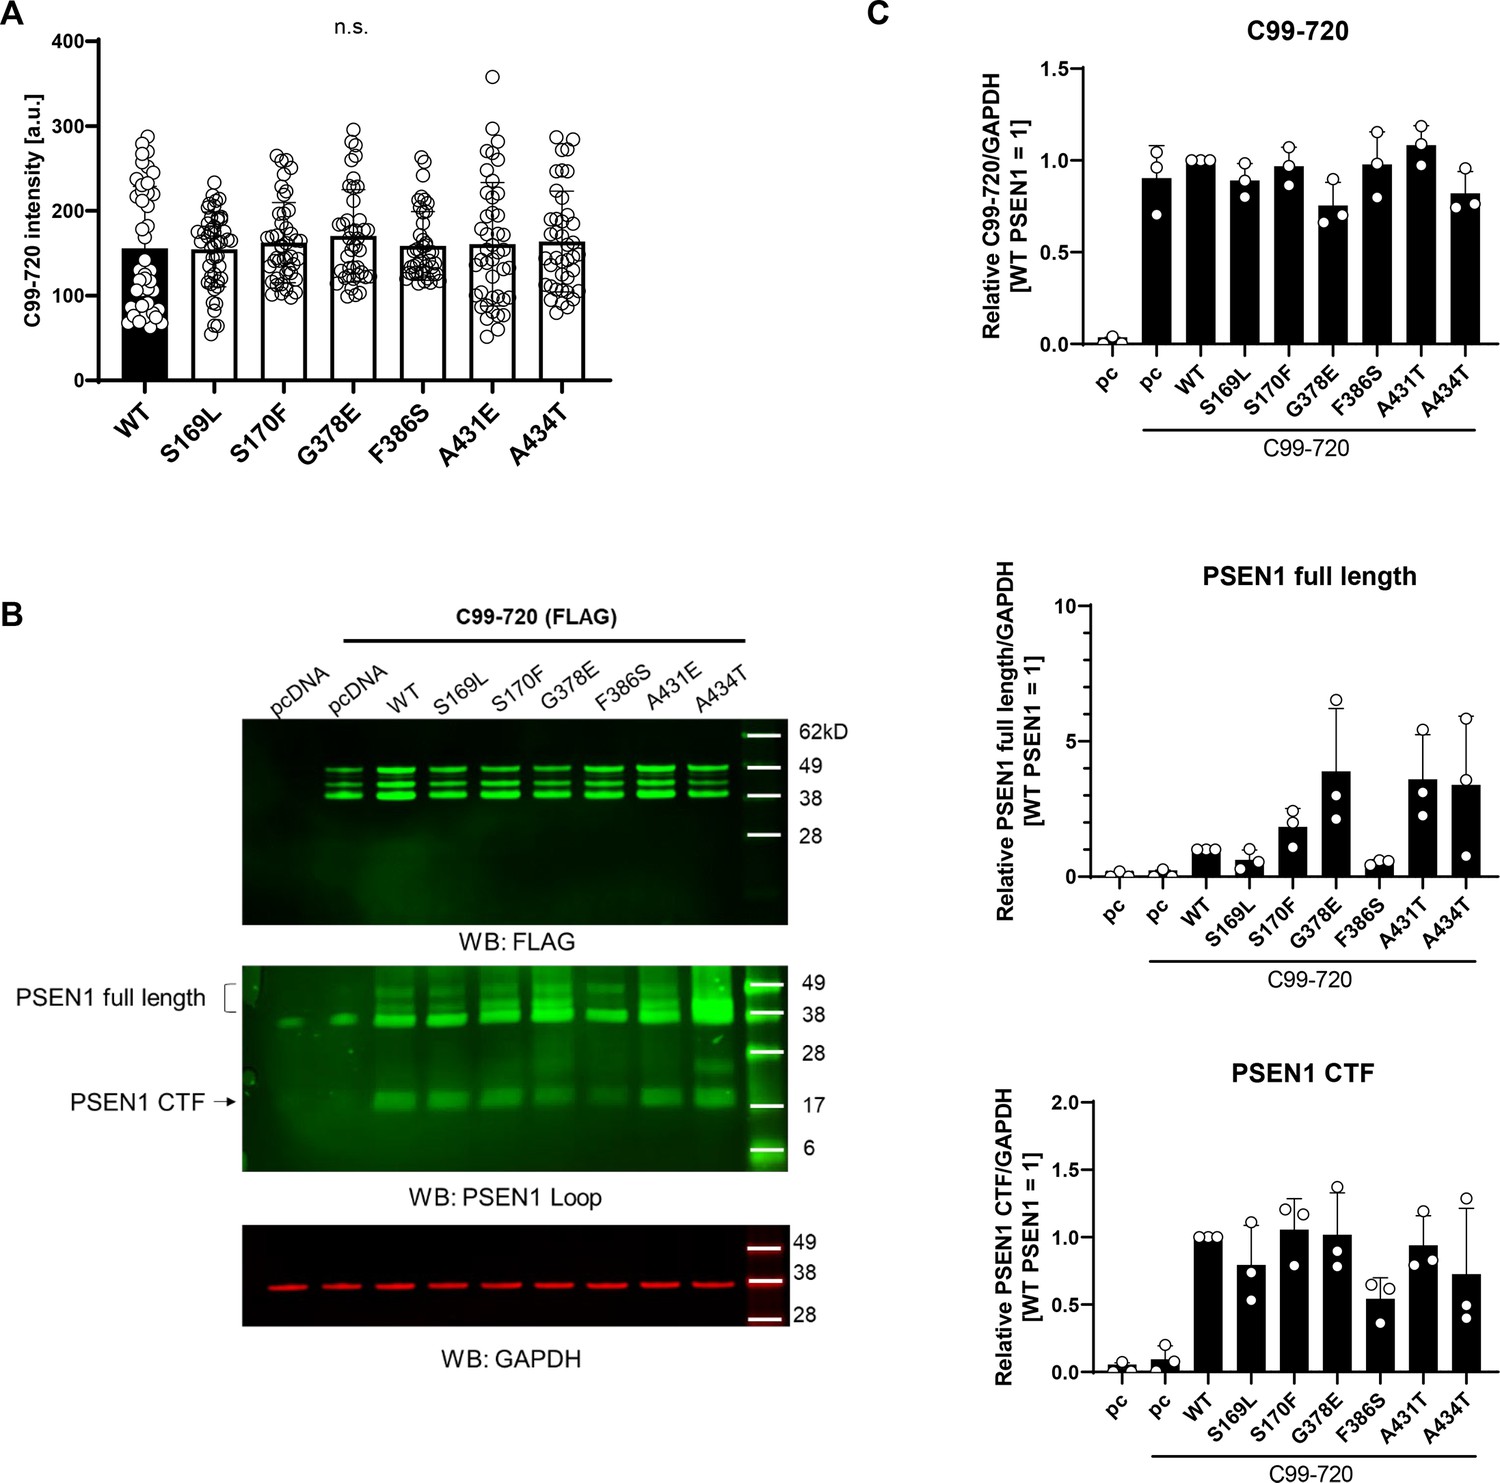
Protein expression of human embryonic kidney (HEK)293 cells cotransfected with C99-720 and PSEN1 variants.
(A) C99-720 fluorescence intensities in regions of interest as depicted in Figure 4D. (B) Representative western blots for expression of C99-720, PSEN1, and GAPDH control. (C) Quantification of band intensities relative to GAPDH as determined by densitometry (n=3). All data describe biological replicates, and experiments were replicated in three independent experiments. Error bars represent s.d. in all cases.
-
Figure 4—figure supplement 1—source data 1
Spreadsheet contains fluorescence lifetime data associated with panel A.
- https://cdn.elifesciences.org/articles/102274/elife-102274-fig4-figsupp1-data1-v1.xlsx
-
Figure 4—figure supplement 1—source data 2
Original images of western blots for panel B.
- https://cdn.elifesciences.org/articles/102274/elife-102274-fig4-figsupp1-data2-v1.zip
-
Figure 4—figure supplement 1—source data 3
Powerpoint file of images of western blots for panel B with labeling.
- https://cdn.elifesciences.org/articles/102274/elife-102274-fig4-figsupp1-data3-v1.zip
Figure 5
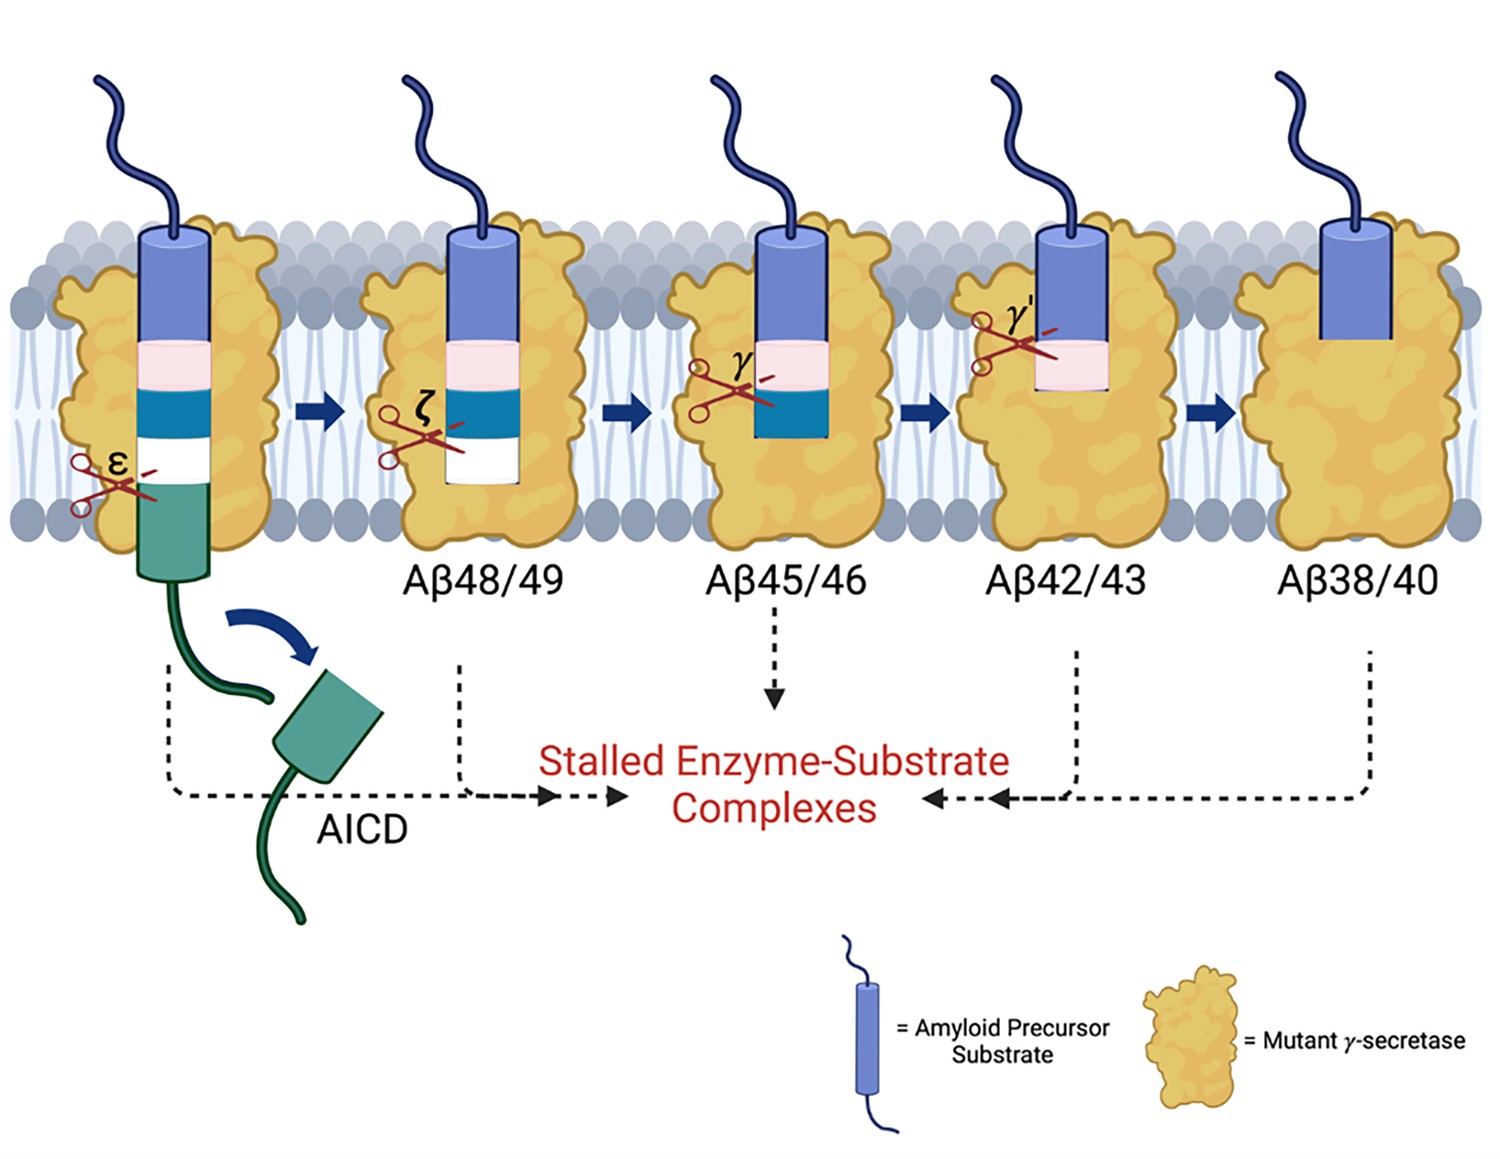
Familial Alzheimer’s disease (FAD) mutations lead to stalled processive proteolysis of APP substrate by γ-secretase.
PSEN1 FAD-mutant γ-secretase complexes are deficient in specific cleavage steps. Enzyme-substrate/intermediate complexes are stalled at these stages.
Tables
Table 1
Calculated concentration (nM) of each Aβ variant resulting from processing APP substrate by wild-type (WT) vs. familial Alzheimer’s disease (FAD)-mutant γ-secretase*.
| PSEN-1 | Aβ49 | Aβ46 | Aβ43 | Aβ40 | Aβ48 | Aβ45 | Aβ42 | Aβ38 |
|---|---|---|---|---|---|---|---|---|
| WT-L | 56.0 | 201.7 | 103.3 | 196.9 | 131.5 | 153.3 | 231.6 | 34.2 |
| WT-H | 26.3 | 176.3 | 121.0 | 191.8 | 91.2 | 180.9 | 232.0 | 23.7 |
| S169L | 3.7 | 52.7 | –2.8 | 42.5 | 264.6 | 52.8 | 53.8 | 12.9 |
| S170F | 38.4 | 128.3 | –2.8 | 67.9 | –173.5 | 221.2 | 80.8 | 4.9 |
| G378E | 44.2 | 76.7 | –5.5 | 21.6 | 112.2 | 88.9 | 19.2 | 1.3 |
| F386S | 41.4 | 222.9 | 140.9 | 41.2 | 634.8 | 180.1 | 43.3 | 4.3 |
| A431E | ND | 8.3 | –8.8 | 8.8 | ND | 52.6 | 5.1 | 0.4 |
| A434T | ND | 0 | –7.9 | 7.9 | ND | 9.2 | 9.4 | 0.3 |
-
*
Calculated Aβ species produced from reaction mixtures containing 5 μM C100-Flag incubated at 37°C for 16 hr with 30 nM of either WT or FAD-mutant γ-secretase complexes. Calculations were based on concentrations of coproducts, where [Aβx] = [coproduct of Aβx production] – [coproduct of Aβx degradation] (e.g. [Aβ48] = [APP intracellular domain [AICD] 49–99] – [VIT]).
Key resources table
| Reagent type (species) or resource | Designation | Source or reference | Identifiers | Additional information |
|---|---|---|---|---|
| Antibody | Mouse anti-Flag M2 | Sigma-Aldrich | Cat. No. F1804; RRID:Ab_262044 | |
| Antibody | Mouse anti-FLAG M2-agarose beads | Sigma-Aldrich | Cat. No. A2220; RRID:AB_10063035 | |
| Antibody | Mouse anti-PSEN1-NTF | Bio-Legend | Cat. No. 823401; RRID:AB_2564868 | |
| Antibody | Rabbit anti-nicastrin | Novus Biologicals | Cat. No. NBP2-57365 | |
| Antibody | Presenilin 1 (D39D1) Rabbit mAb-CTF | Cell Signaling | Cat. No. 5643 | |
| Antibody | Rabbit anti-Aph-1a, 245–265 (C-terminus) Antibody | Bio-Legend | Cat. No. 823101 | |
| Antibody | Goat anti-Mouse IgG (H+L) Secondary Antibody, HRP | Invitrogen | Cat. No. 62–6520 | |
| Antibody | Anti-rabbit IgG, HRP-linked Antibody | Cell Signaling | Cat. No. 7074 | |
| Antibody | Precision Plus Protein WesternC Blotting Standards | Bio-Rad | Cat. No. 1610376 | |
| Antibody | Precision Protein StrepTactin-HRP Conjugate | Bio-Rad | Cat. No. 1610381 | |
| Strain, strain background (Escherichia coli) | NEB 5-alpha Competent E. coli (DH5α) | New England Biolabs | Cat. No. C2987H | |
| Strain, strain background (Escherichia coli) | E. coli BL21 DE3 | New England Biolabs | Cat. No. C2530H | |
| Chemical compound, drug | Expi293 Expression Medium | Thermo Fisher Scientific | Cat. No. A1435101 | |
| Chemical compound, drug | 13C glucose | Cambridge Isotope Laboratories | Cat. No. CLM-1396 | |
| Chemical compound, drug | 15NH4Cl | Cambridge Isotope Laboratories | Cat. No. NLM-467 | |
| Chemical compound, drug | PacI restriction enzyme | New England Biolabs | Cat. No. R0547S | |
| Chemical compound, drug | SwaI restriction enzyme | New England Biolabs | Cat. No. R0604S | |
| Chemical compound, drug | T4 DNA Polymerase | New England Biolabs | Cat. No. M0203L | |
| Chemical compound, drug | DOPC (1,2-dioleoyl-sn-glycerol-3-phosphocholine) | Avanti Polar Lipids | Cat. No. 850375 | |
| Chemical compound, drug | DOPE (1,2-dioleoyl-sn-glycero-3-phosphoethanolamine) | Avanti Polar Lipids | Cat. No. 850725 | |
| Chemical compound, drug | Digitonin | Goldbio | Cat. No. D-180–5 | |
| Chemical compound, drug | Opti-MEM I Reduced Serum Medium | Gibco | Cat. No. 31985062 | |
| Chemical compound, drug | SuperSignal West Femto Maximum Sensitivity Substrate | Thermo Fisher Scientific | Cat. No. 34094 | |
| Chemical compound, drug | ExpiFectamine 293 Transfection Kit | Gibco | Cat. No. A14524 | |
| Chemical compound, drug | LB Broth | Fisher Scientific | Cat. No. BP1426-2 | |
| Chemical compound, drug | UltraPure Ethidium Bromide | Invitrogen | Cat. No. 15585011 | |
| Chemical compound, drug | MES SDS Running Buffer | Invitrogen | Cat. No. B0002 | |
| Chemical compound, drug | Western Blot Stripping Buffer | Thermo Fisher Scientific | Cat. No. 21059 | |
| Chemical compound, drug | NuPAGE Transfer Buffer | Invitrogen | Cat. No. NP00061 | |
| Chemical compound, drug | TAE Buffer, Molecular Biology Grade (Tris-acetate-EDTA) | Promega | Cat. No. V4271 | |
| Chemical compound, drug | SimplyBlue SafeStain | Invitrogen | Cat. No. LC6060 | |
| Chemical compound, drug | NuPAGE Bis-Tris Mini Protein Gels, 10%, 1.0–1.5 mm | Invitrogen | Cat. No. NP0315BOX | |
| Chemical compound, drug | NuPAGE LDS Sample Buffer (4×) | Invitrogen | Cat. No. NP0007 | |
| Chemical compound, drug | NuPAGE Sample Reducing Agent (10×) | Invitrogen | Cat. No. NP0009 | |
| Chemical compound, drug | EDTA (0.5 M), pH 8.0 | Thermo Fisher Scientific | Cat. No. R1021 | |
| Chemical compound, drug | TriTrack DNA Loading Dye (6×) | Thermo Fisher Scientific | Cat. No. R1161 | |
| Chemical compound, drug | Penicillin-Streptomycin | Gibco | Cat. No. 15140122 | |
| Peptides, recombinant proteins | Peptides VIT, ITL, VIV, TVI, IAT, and VVIAA | New England Peptide | Custom synthesized | |
| Peptides, recombinant proteins | beta-Amyloid Peptide (1–43) (Aß43) | Abcam | Cat. No. 134500-80-4 | |
| Peptides, recombinant proteins | AICD 50–99 | Chemical Biology Synthetic Core at The University of Kansas | N/A | |
| Peptides, recombinant proteins | AICD 49–99 | Chemical Biology Synthetic Core at The University of Kansas | N/A | |
| Peptides, recombinant proteins | ProteoMass Insulin MALDI-MS | Sigma-Aldrich | Cat. No. 11070-73-8 | |
| Commercial assay or kit | QuikChange Lightning Multi-Site Directed Mutagenesis kit | Agilent | Cat. No. 210513 | |
| Commercial assay or kit | Amyloid b-peptide 1–40 ELISA kit | Invitrogen | Cat. No. KHB3481 | |
| Commercial assay or kit | Amyloid b-peptide 1–42 ELISA kit | Invitrogen | Cat. No. KHB3441 | |
| Commercial assay or kit | Pierce BCA Protein Assay Kits | Thermo Fisher Scientific | Cat. No. 23225 | |
| Commercial assay or kit | PureLink HiPure Plasmid Filter Maxiprep Kit | Invitrogen | Cat. No. K210017 | |
| Commercial assay or kit | QIAwave Plasmid Miniprep Kit | QIAGEN | Cat. No. 27204 | |
| Commercial assay or kit | QIAquick Gel Extraction Kit | QIAGEN | Cat. No. 28704 | |
| Cell line (human embryonic kidney cells) | Expi293F cells | Thermo Fisher Scientific | Cat. No. A14527 | |
| Sequence-based reagent | DNA primers for S169L PSEN1 mutagenesis | Invitrogen | Custom synthesized | catgcctggcttattatattatctctattgttgctgttc |
| Sequence-based reagent | DNA primers for S170F PSEN1 mutagenesis | Invitrogen | Custom synthesized | catgcctggcttattatatcatttctattgttgctgttc |
| Sequence-based reagent | DNA primers for G378E PSEN1 mutagenesis | Invitrogen | Custom synthesized | gacccagaggaaagggaagtaaaacttggattg |
| Sequence-based reagent | DNA primers for F386S PSEN1 mutagenesis | Invitrogen | Custom synthesized | cttggattgggagattccattttctacagtgttctg |
| Sequence-based reagent | DNA primers for A431E PSEN1 mutagenesis | Invitrogen | Custom synthesized | gccattttcaagaaagaattgccagctcttccaatc |
| Sequence-based reagent | DNA primers for A434T PSEN1 mutagenesis | Invitrogen | Custom synthesized | aagaaagcattgccaactcttccaatctccatc |
| Recombinant DNA reagent | pMLINK-PSEN1 | Coauthor Y Shi | Lu et al., 2014 | |
| Recombinant DNA reagent | pMLINK-Aph1 (with C-terminal HA epitope tag) | Coauthor Y Shi | Lu et al., 2014 | |
| Recombinant DNA reagent | pMLINK-NCT (with C-terminal V5 and 6XHIS epitope tags) | Coauthor Y Shi | Lu et al., 2014 | |
| Recombinant DNA reagent | pMLINK-Pen-2 (with N-terminal STREP and FLAG epitope tags) | Coauthor Y Shi | Lu et al., 2014 | |
| Recombinant DNA reagent | pMLINK-PSEN1-Aph1-NCT-Pen-2 | This study | Lu et al., 2014 | |
| Recombinant DNA reagent | pMLINK-PSEN1(S169L)-Aph1-NCT-Pen-2 | This study | N/A | |
| Recombinant DNA reagent | pMLINK-PSEN1(S170F)-Aph1-NCT-Pen-2 | This study | N/A | |
| Recombinant DNA reagent | pMLINK-PSEN1(G378E)-Aph1-NCT-Pen-2 | This study | N/A | |
| Recombinant DNA reagent | pMLINK-PSEN1(F386S)-Aph1-NCT-Pen-2 | This study | N/A | |
| Recombinant DNA reagent | pMLINK-PSEN1(A431E)-Aph1-NCT-Pen-2 | This study | N/A | |
| Recombinant DNA reagent | pMLINK-PSEN1(A434T)-Aph1-NCT-Pen-2 | This study | N/A | |
| Recombinant DNA reagent | pET22b-C100-FLAG | In-house | Lu et al., 2014 | |
| Software, algorithms | Prism 9 version 9.5.1 | GraphPad | https://www.graphpad.com | |
| Software, algorithms | Fiji ImageJ 1.53c | NIH | https://imagej.nih.gov/ | |
| Software, algorithms | AzureSpot | Azure Biosystems | https://azurebiosystems.com/ | |
| Software, algorithms | MassLynx | Waters | https://www.waters.com |
Additional files
-
Supplementary file 1
Table of cross-reactivity of Aβ43 peptide with Aβ42 ELISA kit.
Cross-reactivity of Aβ43 with Aβ42 in ELISAs. Various concentrations of Aβ43 (ranging from 15.63 pg/mL to 1,000,000 pg/mL) were tested using Aβ42-specific ELISA kits. The instrument readings for each concentration are displayed, indicating significant cross-reactivity starting at 250 pg/mL (0.06 nM) of Aβ43. (Note: ‘OF’ stands for overflow.)
- https://cdn.elifesciences.org/articles/102274/elife-102274-supp1-v1.docx
-
Supplementary file 2
Table of cross-reactivity of Aβ43 peptide with Aβ40 ELISA kit.
Cross-reactivity of Aβ43 with Aβ40 in ELISAs. Different concentrations of Aβ43 (ranging from 7.8 to 1,000,000 pg/mL) were assessed using ELISA kits specific for Aβ40. The resulting instrument readings for each concentration are presented, revealing cross-reactivity beginning at 500 pg/mL (0.12 nM) of Aβ43.
- https://cdn.elifesciences.org/articles/102274/elife-102274-supp2-v1.docx
-
MDAR checklist
- https://cdn.elifesciences.org/articles/102274/elife-102274-mdarchecklist1-v1.docx
Download links
A two-part list of links to download the article, or parts of the article, in various formats.
Downloads (link to download the article as PDF)
Open citations (links to open the citations from this article in various online reference manager services)
Cite this article (links to download the citations from this article in formats compatible with various reference manager tools)
Alzheimer-mutant γ-secretase complexes stall amyloid β-peptide production
eLife 13:RP102274.
https://doi.org/10.7554/eLife.102274.3


