Impaired fatty acid import or catabolism in macrophages restricts intracellular growth of Mycobacterium tuberculosis
- Department of Microbiology and Immunology, College of Veterinary Medicine, Cornell University, United States
- Department of Microbiology, UMass Chan Medical School, United States
Figures
Figure 1 with 2 supplements

Knockout of fatty acid import and metabolism genes restricts Mycobacterium tuberculosis (Mtb) growth in macrophages.
(A) Schematic of lipid import and metabolism genes in macrophages. Genes targeted for CRISPR-Cas9-mediated knockout are highlighted in red. (B) Scramble or indicated mutant macrophages were infected with the Mtb Erdman strain at a multiplicity of infection (MOI) of 0.4. Intracellular Mtb growth was measured by plating and counting colony-forming units (CFUs) in lysed macrophages 5 days post infection (PI). (C) CFUs from lysed macrophages were also plated on day 0, 3 hours PI to measure bacterial uptake differences. n = 6 biological replicates; ****p<0.0001, one-way ANOVA alongside Dunnett’s multiple comparison test. Data are presented as mean values ± SD.
-
Figure 1—source data 1
Numerical source data for Figure 1B and C.
- https://cdn.elifesciences.org/articles/102980/elife-102980-fig1-data1-v1.xlsx
Figure 1—figure supplement 1
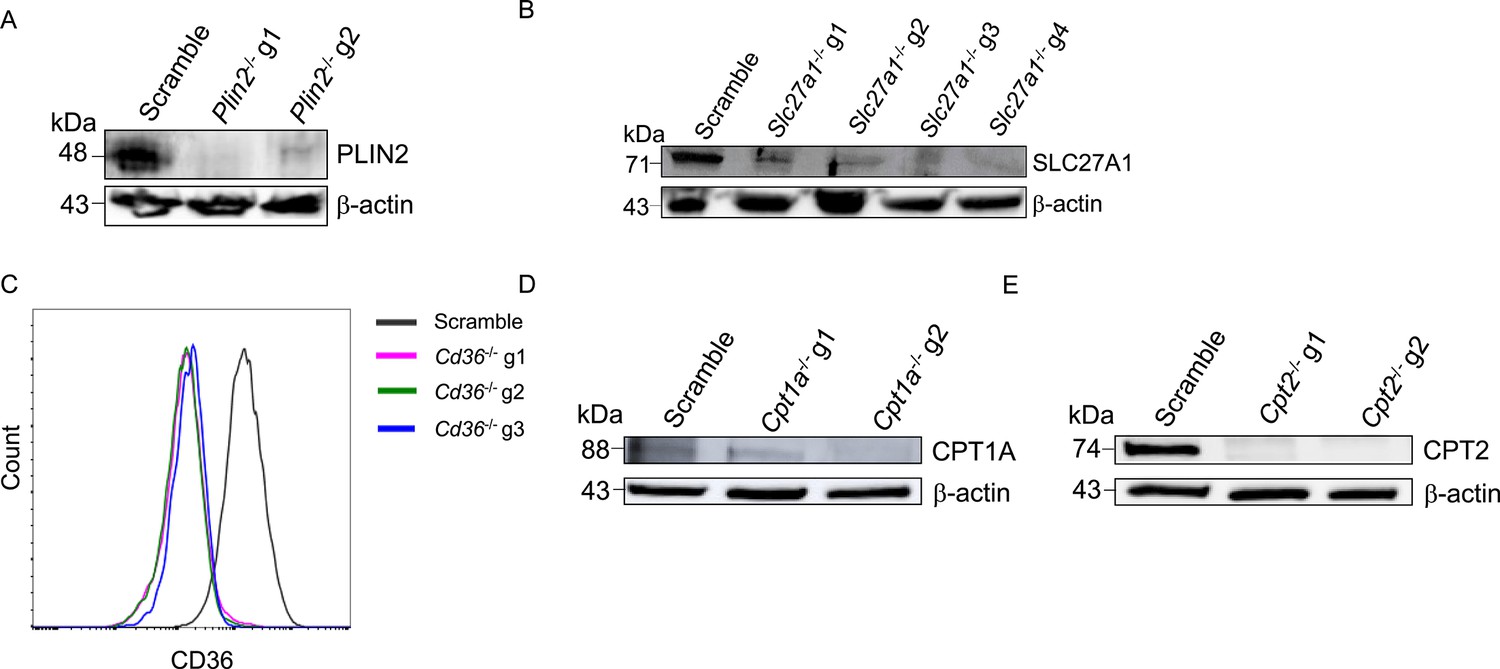
Flow cytometry and western blot analysis of CRISPR knockout macrophages.
(A–E) Western blot and flow cytometry analysis of protein depletion in fatty acid import and metabolism genes in macrophages derived from Hoxb8 parental lines (Supplementary file 1). Each gene was targeted with at least two sgRNAs; PLIN2 (A), SLC27A1 (B), CD36 (C), CPT1A (D), and CPT2 (E).
-
Figure 1—figure supplement 1—source data 1
Original western blots for Figure 1—figure supplement 1A, B, D and E, indicating the relevant bands.
- https://cdn.elifesciences.org/articles/102980/elife-102980-fig1-figsupp1-data1-v1.pdf
-
Figure 1—figure supplement 1—source data 2
Original files for western blot analysis displayed in Figure 1—figure supplement 1A, B, D and E.
- https://cdn.elifesciences.org/articles/102980/elife-102980-fig1-figsupp1-data2-v1.zip
Figure 1—figure supplement 2
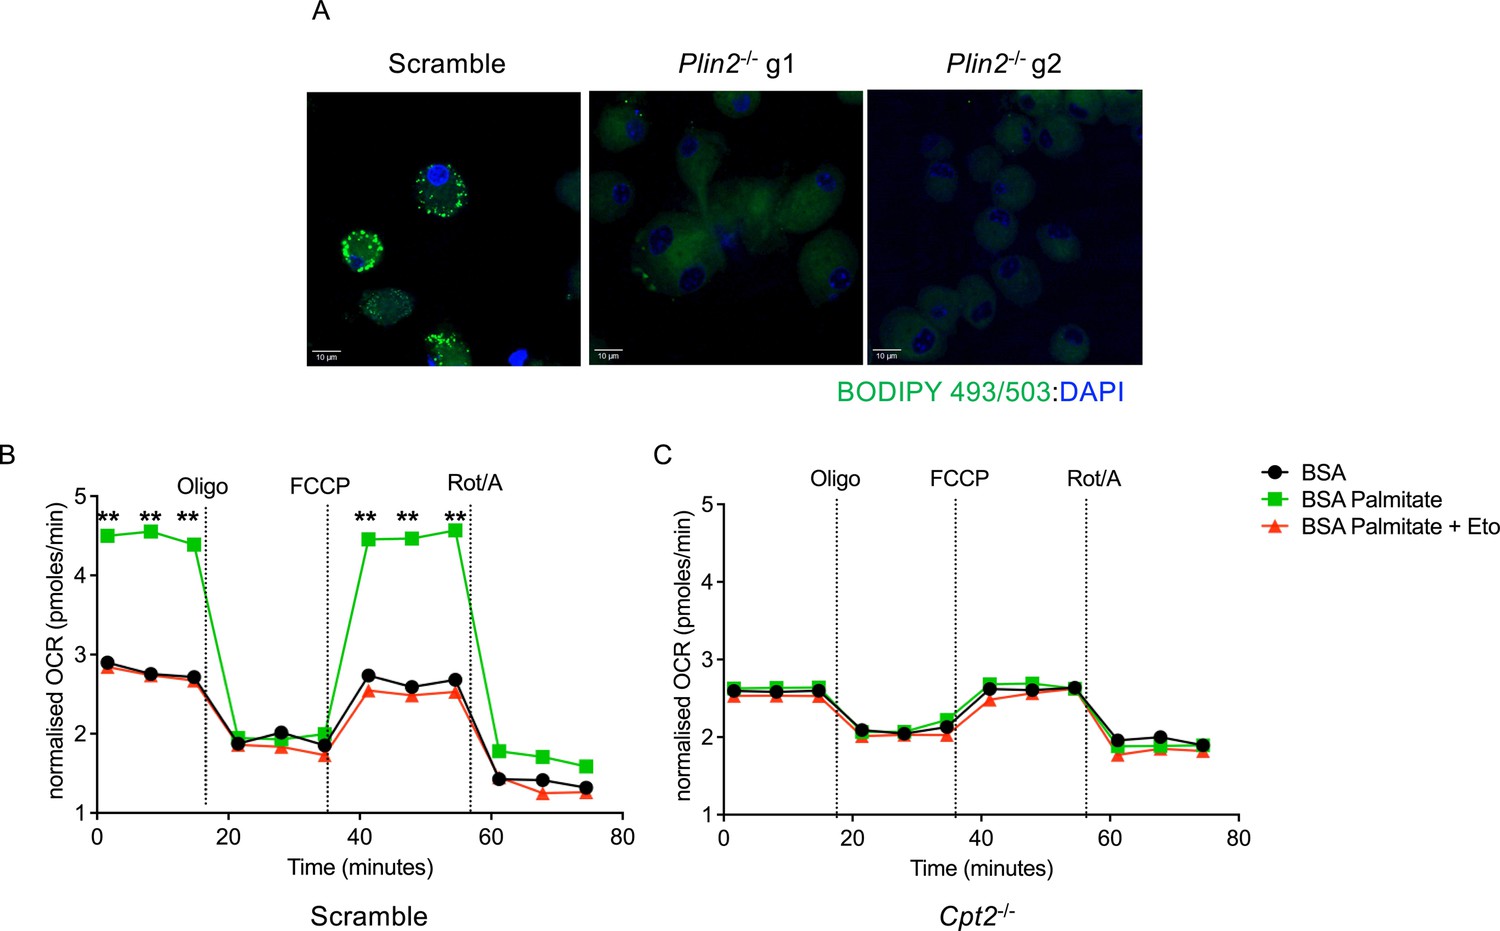
Lipid droplet formation and fatty acid oxidation in Plin2-/- and Cpt2-/- macrophages.
(A) Phenotypic characterization of lipid droplet biogenesis in Plin2-/- macrophages. Uninfected macrophages were supplemented with 400 μM oleate for 24 hours. Cells were fixed for 20 minutes and stained for lipid droplet inclusions using the Bodipy 493/503 dye. DAPI was used as a counterstain to detect nuclei. (B,C) Seahorse fatty acid oxidation analyses of uninfected scramble or Cpt2-/- macrophages. Cells were cultured in substrate-limiting conditions for 24 hours and supplied with exogenous palmitate. Oxygen consumption rates (OCRs) were measured as in the Cell Mito Stress Test Kit (Agilent). Oligo, oligomycin; FCCP, fluoro-carbonyl cyanide phenylhydrazone; Rot/A, rotenone and antimycin A; BSA, bovine serum albumin; Eto, etomoxir. n = 3 biological replicates; **p<0.01, one-way ANOVA alongside Dunnett’s multiple comparison test. Data are presented as mean values ± SD.
-
Figure 1—figure supplement 2—source data 1
Numerical source data for Figure 1—figure supplement 2B and C.
- https://cdn.elifesciences.org/articles/102980/elife-102980-fig1-figsupp2-data1-v1.xlsx
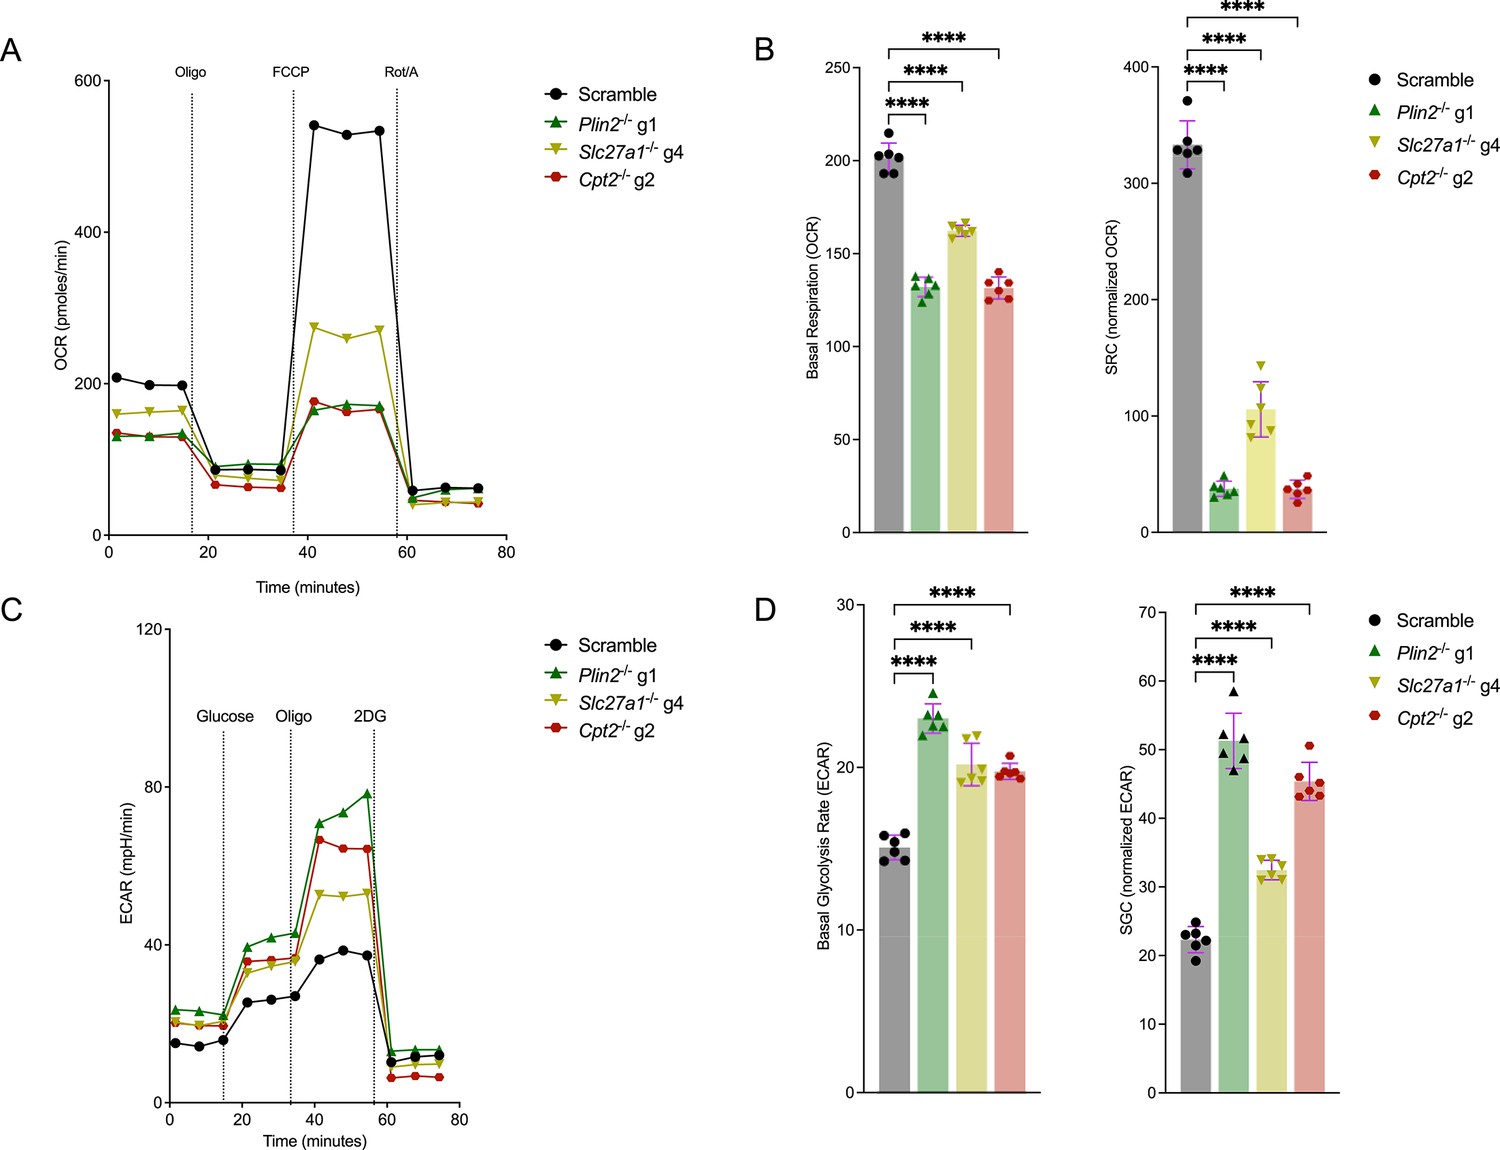
Figure 2 with 1 supplement

Mycobacterium tuberculosis (Mtb)-infected macrophages with impaired fatty acid import and metabolism display reduced mitochondrial activities and are more glycolytic.
(A) Seahorse flux analyses of scramble or Plin2-/-, Slc27a1-/-, and Cpt2-/- macrophages infected with Mtb Erdman strain at a multiplicity of infection (MOI) of 1 24 hours post infection. Oxygen consumption rates (OCRs) were measured using the Cell Mito Stress Test Kit (Agilent). Oligo, oligomycin; FCCP, fluoro-carbonyl cyanide phenylhydrazone; Rot/A, rotenone and antimycin A. (B) Comparison of basal respiration and spare respiratory capacity (SRC) from (A). SRC was calculated by subtracting the normalized maximal OCR from basal OCR. n = 3 biological replicates (two technical repeats per replicate); ****p<0.0001, one-way ANOVA alongside Dunnett’s multiple comparison test. Data are presented as mean values ± SD. (C) Extracellular acidification rates (ECARs) of scramble or Plin2-/-, Slc27a1-/-, and Cpt2-/- macrophages infected with Mtb as in (A). ECARs were measured using the Agilent Seahorse Glycolysis Stress Test kit. 2DG, 2-deoxy-d-glucose. (D) Comparison of basal glycolysis and spare glycolytic capacity (SGC) in the indicated mutant macrophages. SGC was calculated as SRC above. n = 3 biological replicates (two technical repeats per replicate); *p<0.05, ****p<0.0001, one-way ANOVA alongside Dunnett’s multiple comparison test. Data are presented as mean values ± SD.
-
Figure 2—source data 1
Numerical source data for Figure 2A–D.
- https://cdn.elifesciences.org/articles/102980/elife-102980-fig2-data1-v1.xlsx
Figure 2—figure supplement 1
Flux analyses of mitochondrial activities and glycolysis in Plin2-/-, Slc27a1-/-, and Cpt2-/- macrophages.
(A,B) Seahorse flux analyses in uninfected scramble or Plin2-/-, Slc27a1-/-, and Cpt2-/- macrophages using the Cell Mito Stress Kit as in Figure 2A and B. (C,D) Seahorse flux analyses in uninfected scramble or Plin2-/-, Slc27a1-/-, and Cpt2-/- macrophages using the Glycolysis Stress Test kit as in Figure 2C and D.
-
Figure 2—figure supplement 1—source data 1
Numerical source data for Figure 2—figure supplement 1A–D.
- https://cdn.elifesciences.org/articles/102980/elife-102980-fig2-figsupp1-data1-v1.xlsx
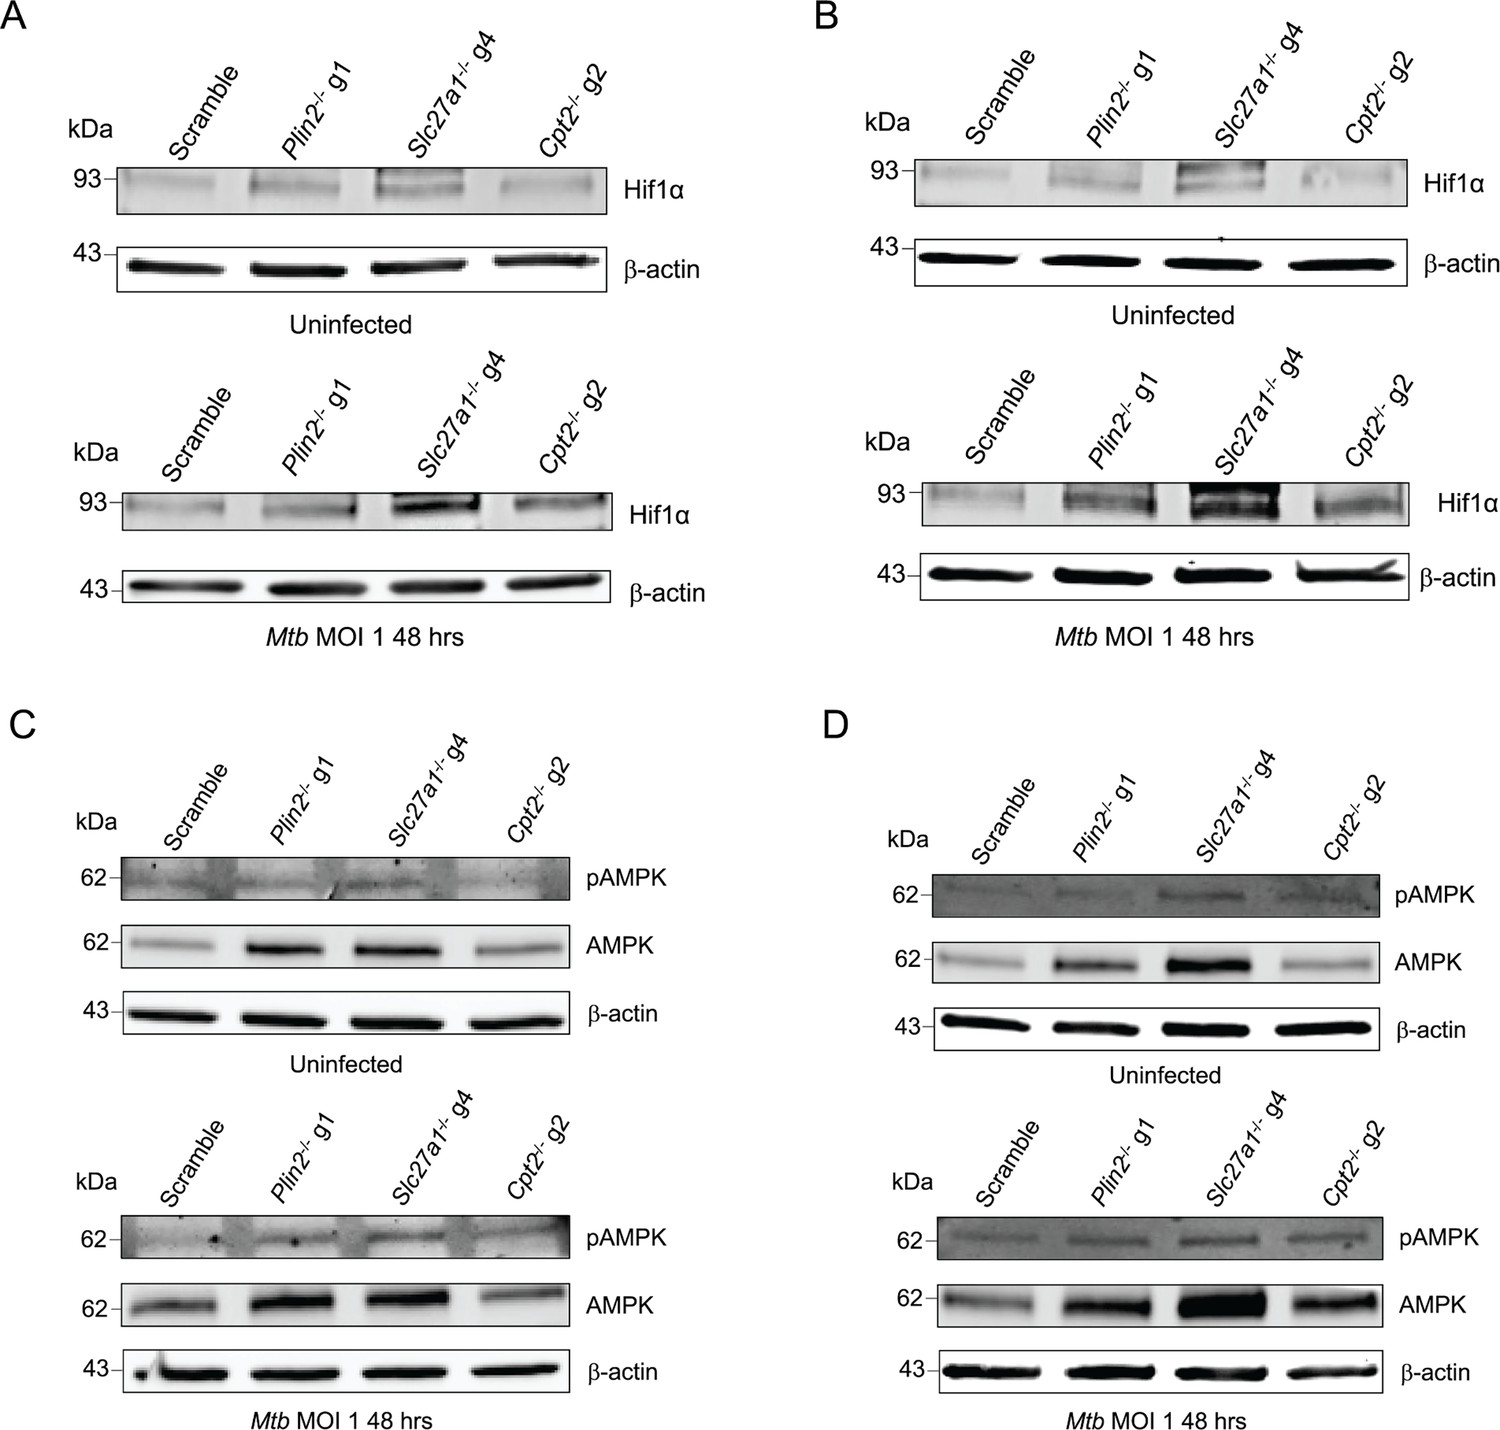
Figure 3 with 2 supplements

Knockout of fatty acid import and metabolism genes in macrophages activate AMPK and stabilizes HIF1α.
(A) Western blot analysis of HIF1α in uninfected and Mycobacterium tuberculosis (Mtb)-infected scramble or Plin2-/-, Slc27a1-/-, and Cpt2-/- macrophages. In Mtb-infected conditions, cells were infected with the bacteria at a multiplicity of infection (MOI) of 1 for 48 hours before preparation of cell lysates. (B) Quantification of relative expression of HIF1α in (A) and in Figure 3—figure supplement 1A and B normalized to β-actin; n = 3 biological replicates. *p<0.05; ***p<0.001, two-way ANOVA alongside Dunnett’s multiple comparison test. Data are presented as mean values ± SD. (C) Western blot analysis of total and phosphorylated AMPK in uninfected and Mtb-infected scramble or Plin2-/-, Slc27a1-/-, and Cpt2-/- macrophages. Cell lysates were prepared as in (A). (D, E) Quantification of relative expression of pAMPK and AMPK in (C) and in Figure 3—figure supplement 1C and D normalized to β-actin; n = 3 biological replicates. **p<0.01; ***p<0.001, ****p<0.0001, two-way ANOVA alongside Dunnett’s multiple comparison test. Data are presented as mean values ± SD.
-
Figure 3—source data 1
Original western blots for Figure 3A and C, indicating the relevant bands.
- https://cdn.elifesciences.org/articles/102980/elife-102980-fig3-data1-v1.pdf
-
Figure 3—source data 2
Original files for western blot analysis displayed in Figure 3A and C.
- https://cdn.elifesciences.org/articles/102980/elife-102980-fig3-data2-v1.zip
-
Figure 3—source data 3
Numerical source data for Figure 3B, D, and E.
- https://cdn.elifesciences.org/articles/102980/elife-102980-fig3-data3-v1.xlsx
Figure 3—figure supplement 1
Replicate western blot analyses of HIF1α (A, B), AMPK and pAMPK (C, D) in uninfected and Mtb-infected scramble or Plin2-/-, Slc27a1-/-, and Cpt2-/- macrophages as in Figure 3.
-
Figure 3—figure supplement 1—source data 1
Original western blots for Figure 3—figure supplement 1A–D, indicating the relevant bands.
- https://cdn.elifesciences.org/articles/102980/elife-102980-fig3-figsupp1-data1-v1.pdf
-
Figure 3—figure supplement 1—source data 2
Original files for western blot analysis displayed in Figure 3—figure supplement 1A–D.
- https://cdn.elifesciences.org/articles/102980/elife-102980-fig3-figsupp1-data2-v1.zip
Figure 3—figure supplement 2
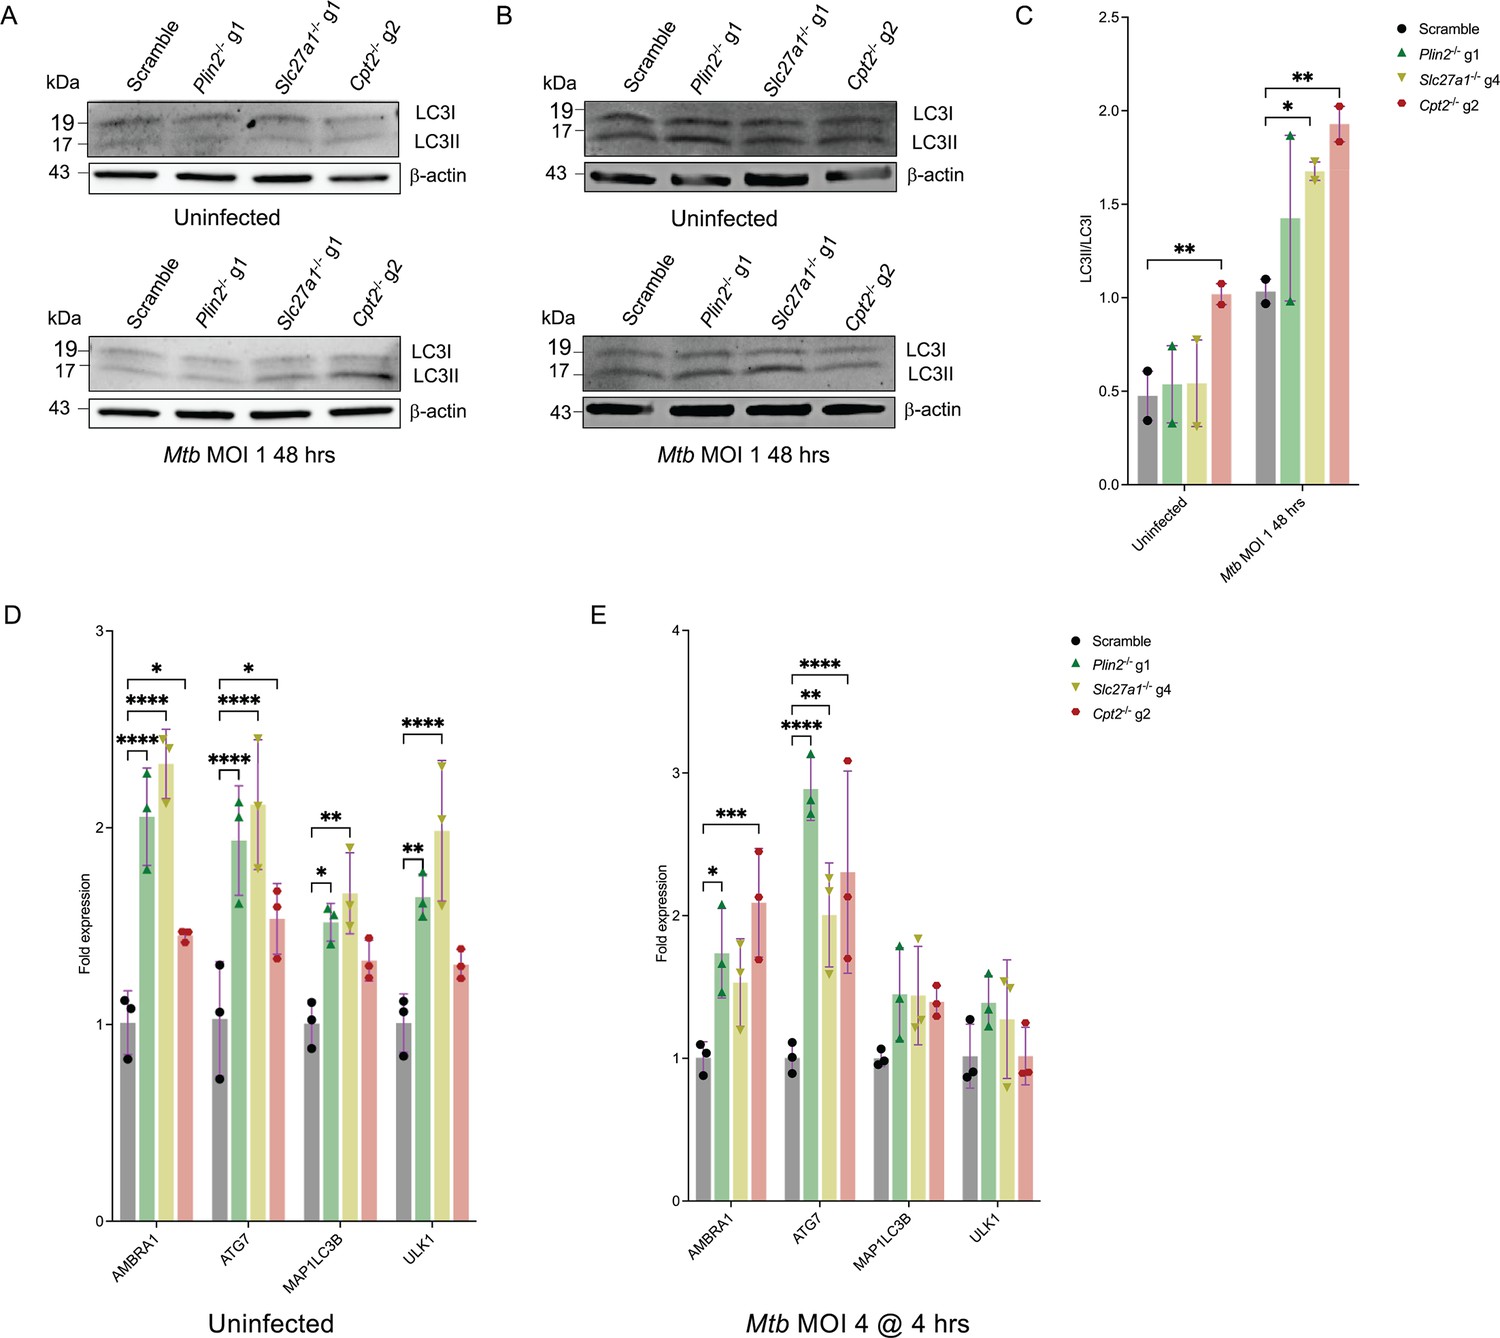
Increased autophagy in Plin2-/-, Slc27a1-/-, and Cpt2-/- macrophages.
(A, B) Independent western blot analyzes of autophagic LC3I to LC3II conversion in uninfected and Mycobacterium tuberculosis (Mtb)-infected scramble or Plin2-/-, Slc27a1-/-, and Cpt2-/- macrophages. (C) Densitometry quantification of LC3I to LC3II turnover ratios (LC3II/LC3I ratio) in (A) and (B) after normalization to β-actin; n = 2 biological replicates. *p<0.05; **p<0.01, two-way ANOVA alongside Dunnett’s multiple comparison test. Data are presented as mean values ± SD. (D, E) qPCR analysis of the indicated autophagy genes in uninfected (D) and Mtb-infected (E) scramble or Plin2-/-, Slc27a1-/-, and Cpt2-/- macrophages. The Mtb Erdman strain was used for bacterial infections. *p<0.05; **p<0.01; ***p<0.001; ****p<0.0001, two-way ANOVA alongside Dunnett’s multiple comparison test. Data are presented as mean values ± SD.
-
Figure 3—figure supplement 2—source data 1
Original western blots for Figure 3—figure supplement 2A and B, indicating the relevant bands.
- https://cdn.elifesciences.org/articles/102980/elife-102980-fig3-figsupp2-data1-v1.pdf
-
Figure 3—figure supplement 2—source data 2
Original files for western blot analysis displayed in Figure 3—figure supplement 2A and B.
- https://cdn.elifesciences.org/articles/102980/elife-102980-fig3-figsupp2-data2-v1.zip
-
Figure 3—figure supplement 2—source data 3
Numerical source data for Figure 3—figure supplement 2C, D, and E.
- https://cdn.elifesciences.org/articles/102980/elife-102980-fig3-figsupp2-data3-v1.xlsx
Figure 4

Supplementation with exogenous oleate fails to rescue the Mycobacterium tuberculosis (Mtb) Δicl1 mutant in Plin2-/-, Slc27a1-/-, and Cpt2-/- macrophages.
(A) Scramble or indicated mutant macrophages were infected with the Mtb H37Rv Δicl1 mutant expressing mCherry at a multiplicity of infection (MOI) of 5. Oleate supplementation (400 μM) was commenced 24 hours before infection in the treatment group, removed during Mtb infection and readded 3 hours post infection for the entire duration of the experiment. Growth kinetics of Mtb were measured by monitoring mCherry fluorescence using a plate reader. n = 4 biological replicates; ****p<0.0001, two-way ANOVA alongside Dunnett’s multiple comparison test. Data are presented as mean values ± SD. (B) Uninfected scramble or Slc27a1-/- and Cpt2-/- macrophages were supplemented with 400 μM oleate for 24 hours. Cells were then fixed for 20 minutes and stained for lipid droplet inclusions using the Bodipy 493/503 dye. DAPI was used as a counterstain to detect nuclei.
-
Figure 4—source data 1
Numerical source data for Figure 4A.
- https://cdn.elifesciences.org/articles/102980/elife-102980-fig4-data1-v1.xlsx
Figure 5

Dual RNA sequencing to identify host and bacterial determinants of Mycobacterium tuberculosis (Mtb) restriction in macrophages with fatty acid import and metabolism knockout genes.
(A) Principal component analysis (PCA) of scramble or Plin2-/-, Slc27a1-/-, and Cpt2-/- macrophages transcriptomes infected with the Mtb smyc’::mCherry strain at a multiplicity of infection (MOI) of 0.5 4 days post infection. (B) Venn diagram of differentially expressed (DE) gene sets (Supplementary file 2) in Plin2-/-, Slc27a1-/-, and Cpt2-/- mutant macrophages compared to scramble showing overlapping genes. DE genes cutoff; abs (log2 fold change) > 0.3, adjusted p-value<0.05.
Figure 6 with 4 supplements

Pathway enrichment analysis of upregulated genes in Mycobacterium tuberculosis (Mtb)-infected Plin2-/- and Slc27a1-/- macrophages.
Tree plots of top 80 enriched gene ontology terms (biological process) in Mtb-infected Slc27a1-/- (A) and Plin2-/- (B) upregulated genes.
Figure 6—figure supplement 1
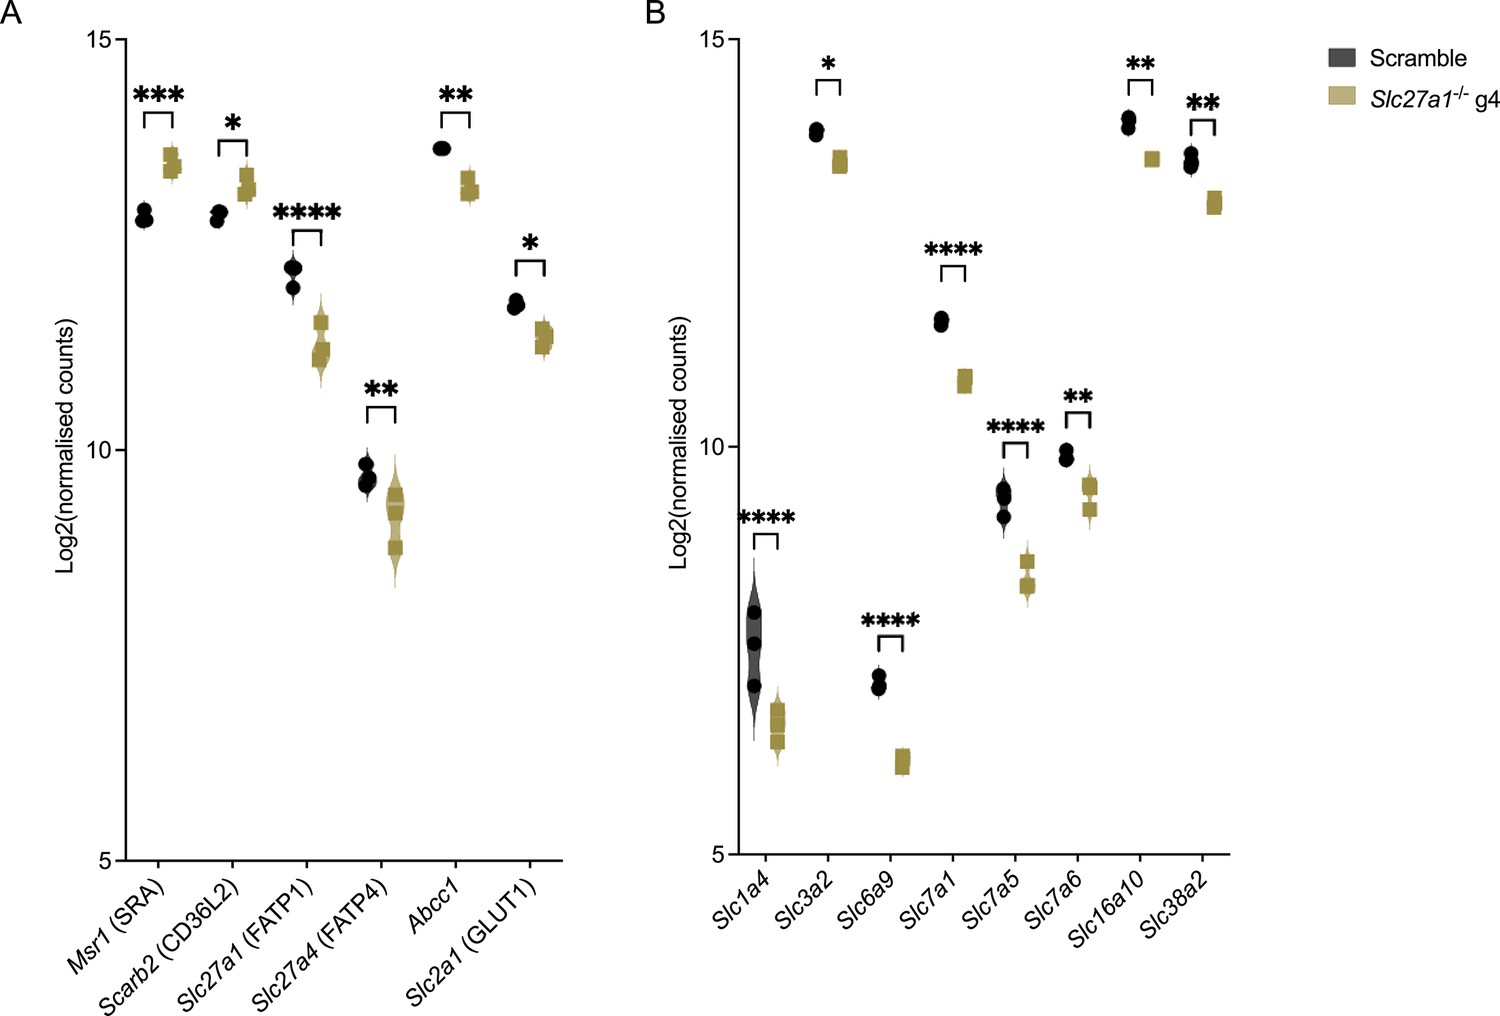
Compensatory transcriptional responses in Mycobacterium tuberculosis (Mtb)-infected Slc27a1-/- macrophages.
(A, B) Violin plots showing expression (log2 normalized counts) of fatty acid (A) and amino acid transport genes (B) in Slc27a1-/- mutant macrophages 4 days post infection (Figure 5). *p<0.05; **p<0.01; ***p<0.001; ****p<0.0001, two-way ANOVA alongside Dunnett’s multiple comparison test. Data are presented as mean values ± SD.
Figure 6—figure supplement 2
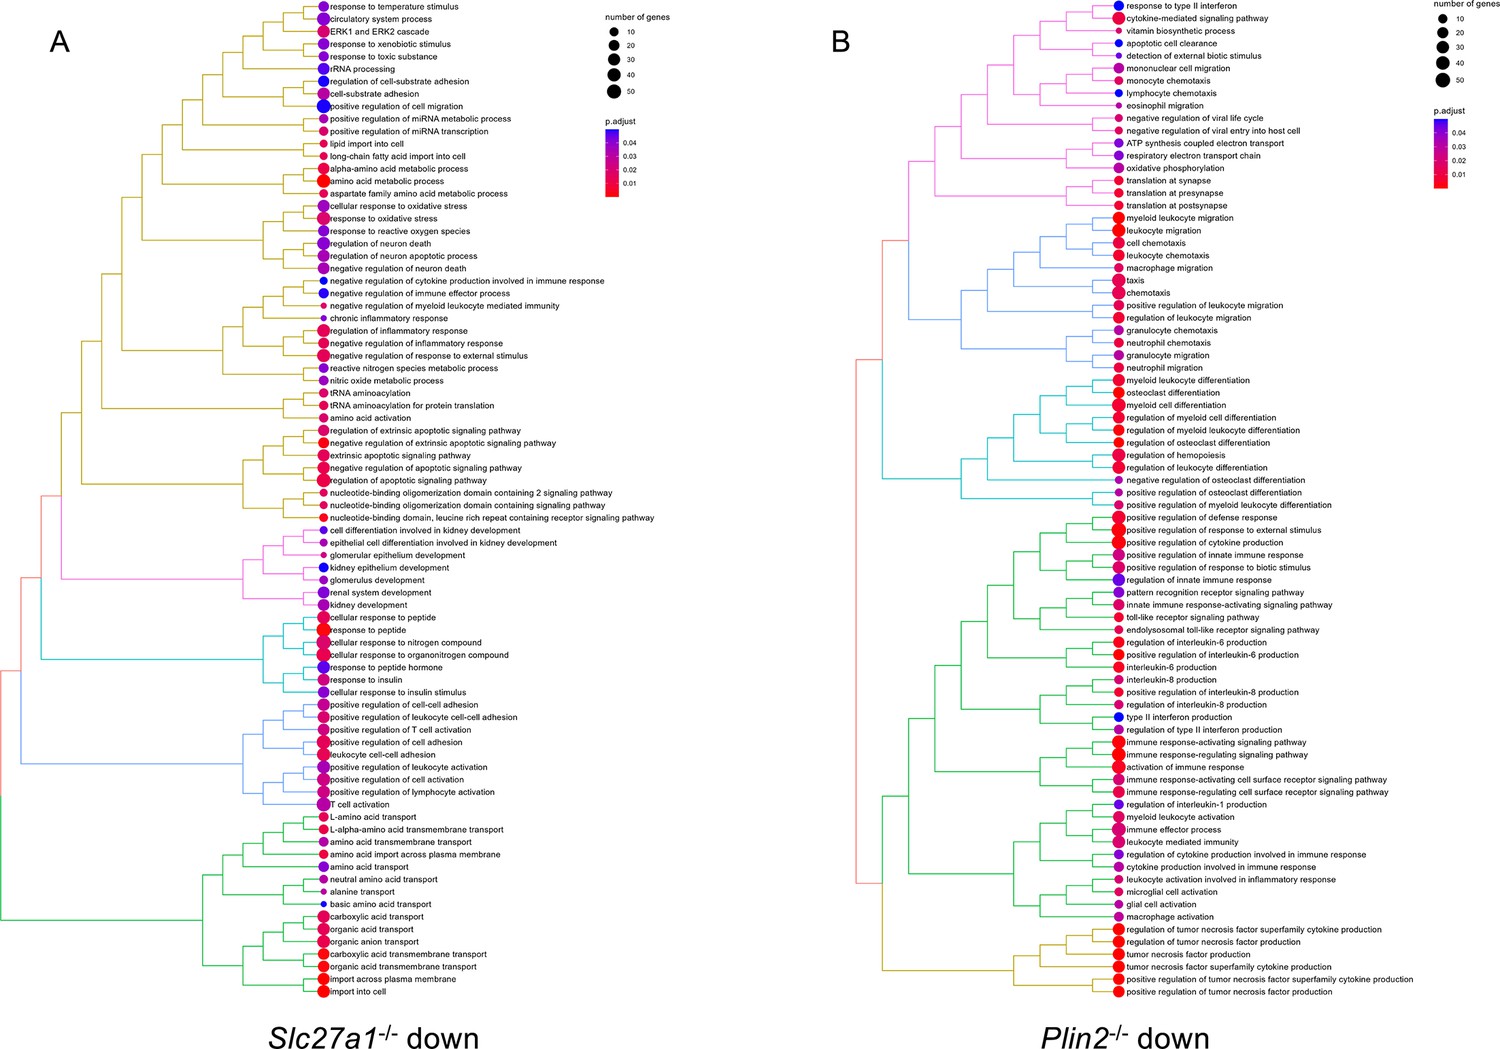
Tree plot of top 80 enriched gene ontology terms (biological process) in Slc27a1-/- (A) and Plin2-/- (B) macrophages downregulated genes.
Figure 6—figure supplement 3
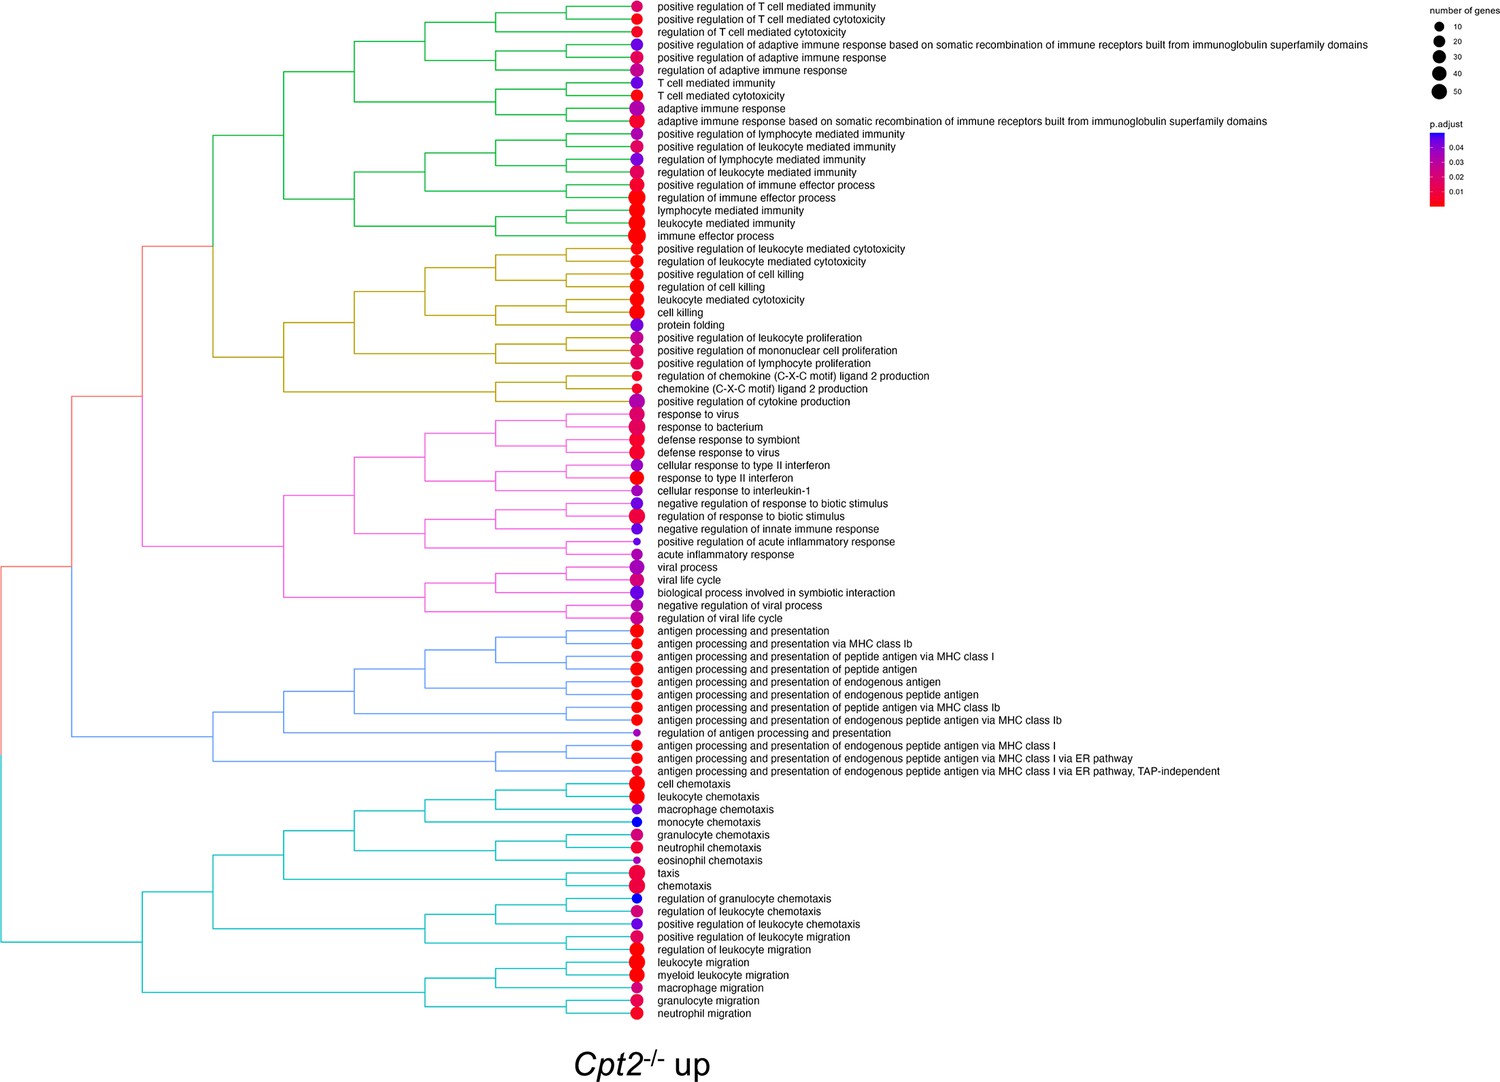
Tree plot of top 80 enriched gene ontology terms (biological process) in Cpt2-/- macrophages upregulated genes.
Figure 6—figure supplement 4
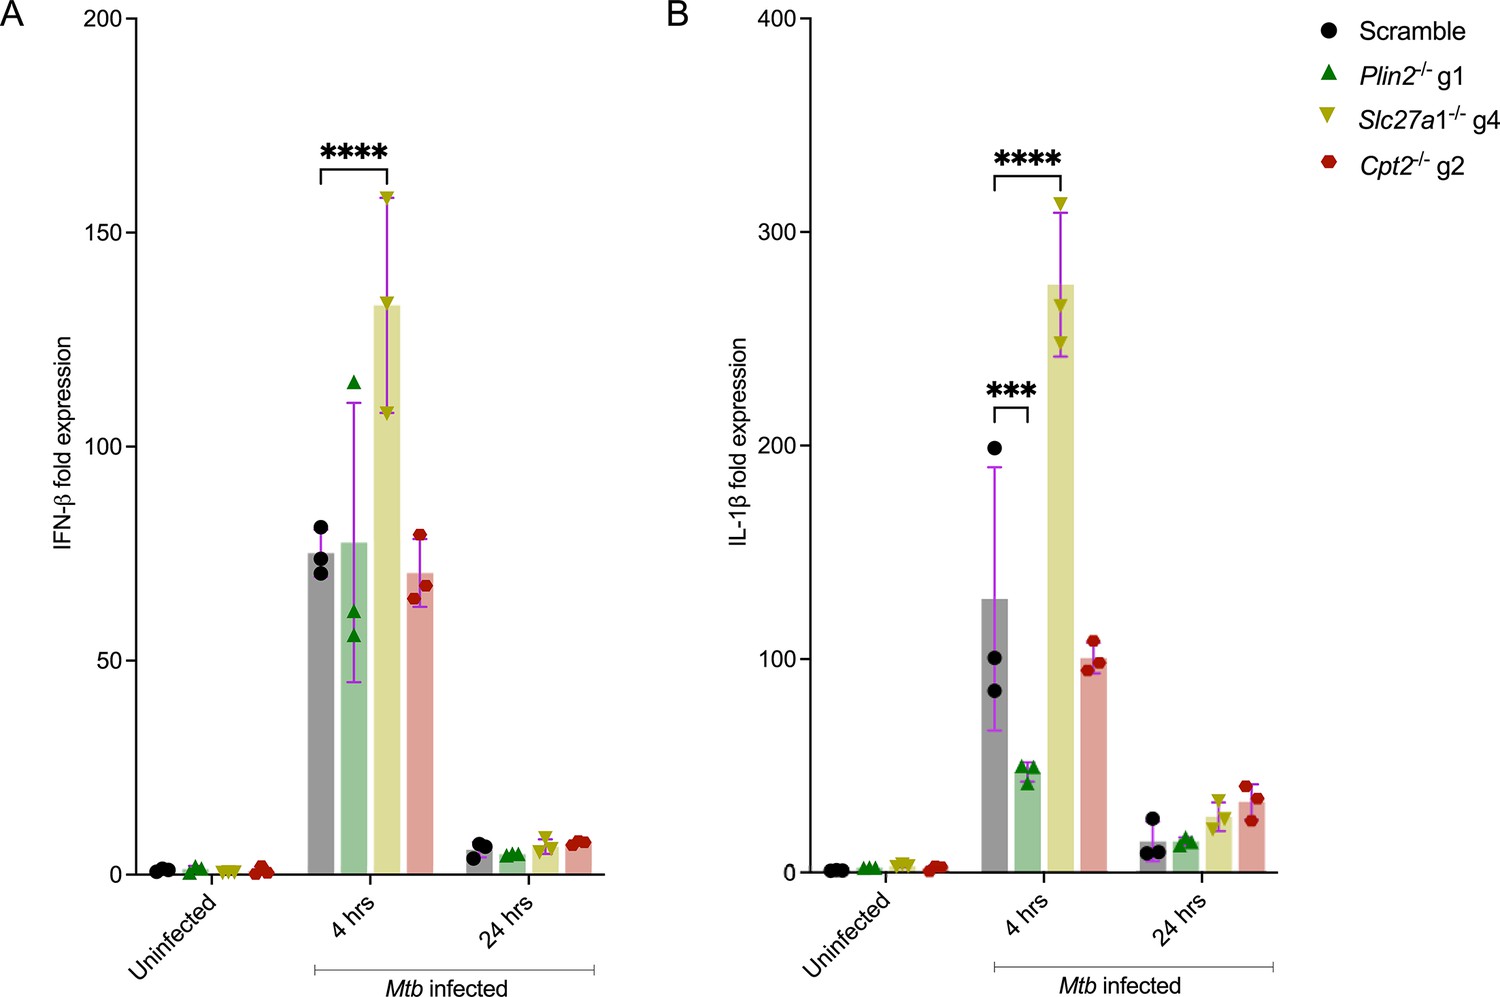
qPCR analysis of IFN-β (A) and IL-1β (B) in Plin2-/-, Slc27a1-/-, and Cpt2-/- macrophages.
Macrophages were left uninfected or infected with the Mycobacterium tuberculosis (Mtb) Erdman strain at a multiplicity of infection (MOI) of 4. RNA was extracted for qPCR at 4 and 24 hours post infection. ***p<0.001; ****p<0.0001, two-way ANOVA alongside Dunnett’s multiple comparison test. Data are presented as mean values ± SD.
-
Figure 6—figure supplement 4—source data 1
Numerical source data for Figure 6—figure supplement 4.
- https://cdn.elifesciences.org/articles/102980/elife-102980-fig6-figsupp4-data1-v1.xlsx
Figure 7 with 1 supplement

Nutritional and oxidative stress define the core transcriptome response of Mycobacterium tuberculosis (Mtb) inside Plin2-/- macrophages.
Heatmaps of nutritional (A) and oxidative stress (B) differentially expressed (DE) genes in Plin2-/- macrophages. Arrows show genes that are also DE in Cpt2-/- macrophages in a similar trend (Supplementary file 4).
Figure 7—figure supplement 1
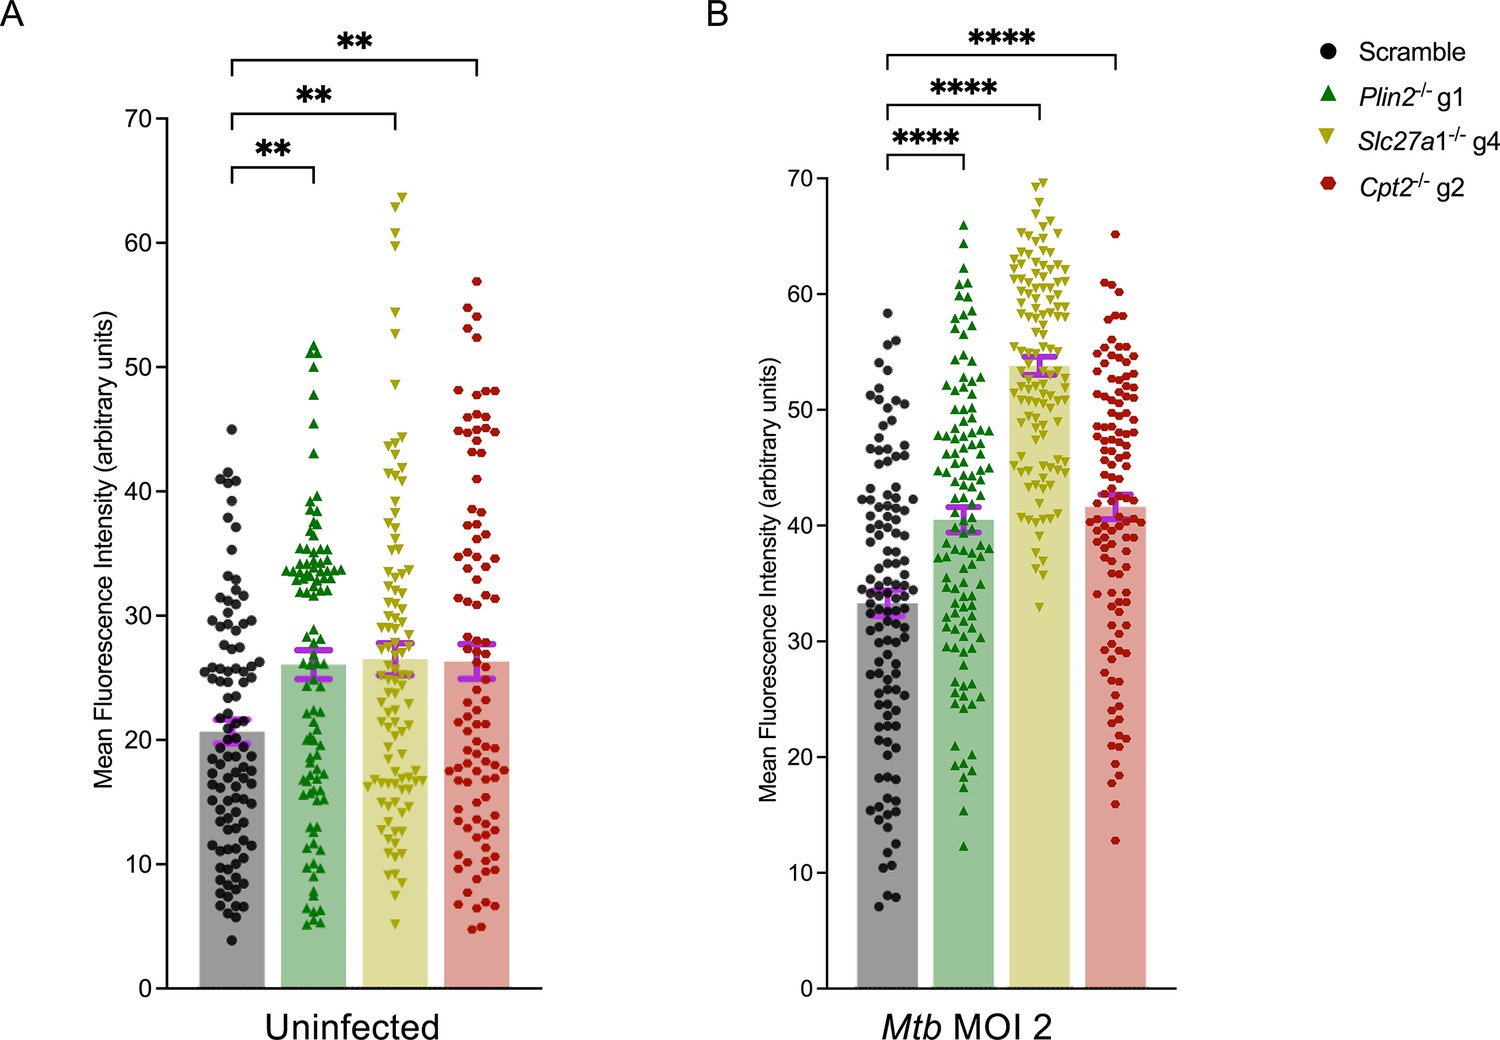
Total cellular reactive oxygen species (ROS) in Plin2-/-, Slc27a1-/-, and Cpt2-/- macrophages.
(A, B) Scramble or Plin2-/-, Slc27a1-/-, and Cpt2-/- macrophages were left uninfected (A) or infected (B) with the Mycobacterium tuberculosis (Mtb) Erdman strain at a multiplicity of infection (MOI) of 1 for 24 hours. Live cells were stained with the Invitrogen CellROX Deep Red dye and imaged using a confocal microscope. Mean fluorescence intensities (MFI) per individual cell were quantified using ImageJ in at least 100 cells for every mutant across three biological replicates. **p<0.01; ****p<0.0001, one-way ANOVA alongside Dunnett’s multiple comparison test. Data are presented as mean values ± SD.
-
Figure 7—figure supplement 1—source data 1
Numerical source data for Figure 7—figure supplement 1.
- https://cdn.elifesciences.org/articles/102980/elife-102980-fig7-figsupp1-data1-v1.xlsx
Figure 8

Inhibitors of fatty acid transport and metabolism block intracellular growth of Mycobacterium tuberculosis (Mtb) in macrophages.
(A) Growth of Mtb in liquid broth in the absence of drug (DMSO) or presence of metformin, SLC27A1 inhibitor (FATP1 In, 10 μM) and the β-oxidation of fatty acid inhibitor, trimetazidine (TMZ, 500 nM). Mtb Erdman was grown to log phase and diluted to OD600 0.01 in 7H9 media in the presence of the above inhibitors. Growth kinetics were monitored by OD600 measurements using a plate reader. Rifampicin (RIF) at 0.5 μg/ml was used as a total killing control. (B) Scramble macrophages were infected with Mtb Erdman at MOI 0.5. Inhibitors were added 3 hours post infection following which CFUs were plated 4 days post infection. n = 5 biological replicates; **p<0.01; ****p<0.0001, one-way ANOVA alongside Dunnett’s multiple comparison test. Data are presented as mean values ± SD.
-
Figure 8—source data 1
Numerical source data for Figure 8A and B.
- https://cdn.elifesciences.org/articles/102980/elife-102980-fig8-data1-v1.xlsx
Additional files
-
Supplementary file 1
sgRNAs primers and ICE scores for lipid import and metabolism gene targets in this study.
- https://cdn.elifesciences.org/articles/102980/elife-102980-supp1-v1.xlsx
-
Supplementary file 2
Differentially expressed genes in Plin2-/-, Slc27a1-/-, and Cpt2-/- Mtb-infected macrophages.
- https://cdn.elifesciences.org/articles/102980/elife-102980-supp2-v1.xlsx
-
Supplementary file 3
Enriched GO terms in upregulated and downregulated genes in Plin2-/-, Slc27a1-/-, and Cpt2-/- Mtb-infected macrophages.
- https://cdn.elifesciences.org/articles/102980/elife-102980-supp3-v1.xlsx
-
Supplementary file 4
Mtb differentially expressed genes in Plin2-/- and Cpt2-/- infected macrophages.
- https://cdn.elifesciences.org/articles/102980/elife-102980-supp4-v1.xlsx
-
MDAR checklist
- https://cdn.elifesciences.org/articles/102980/elife-102980-mdarchecklist1-v1.docx
Download links
A two-part list of links to download the article, or parts of the article, in various formats.
Downloads (link to download the article as PDF)
Open citations (links to open the citations from this article in various online reference manager services)
Cite this article (links to download the citations from this article in formats compatible with various reference manager tools)
Impaired fatty acid import or catabolism in macrophages restricts intracellular growth of Mycobacterium tuberculosis
eLife 13:RP102980.
https://doi.org/10.7554/eLife.102980.3


