Integrator complex subunit 12 knockout overcomes a transcriptional block to HIV latency reversal
- Department of Microbiology, University of Washington, United States
- Division of Infectious Diseases, Department of Medicine, University of North Carolina at Chapel Hill, United States
- UNC HIV Cure Center, University of North Carolina at Chapel Hill, United States
- Division of Basic Sciences, Fred Hutchinson Cancer Center, United States
- Molecular and Cellular Biology Graduate Program, University of Washington, United States
- Division of Human Biology, Fred Hutchinson Cancer Center, United States
- Department of Microbiology and Immunology, University of North Carolina at Chapel Hill, United States
Figures
Figure 1 with 1 supplement
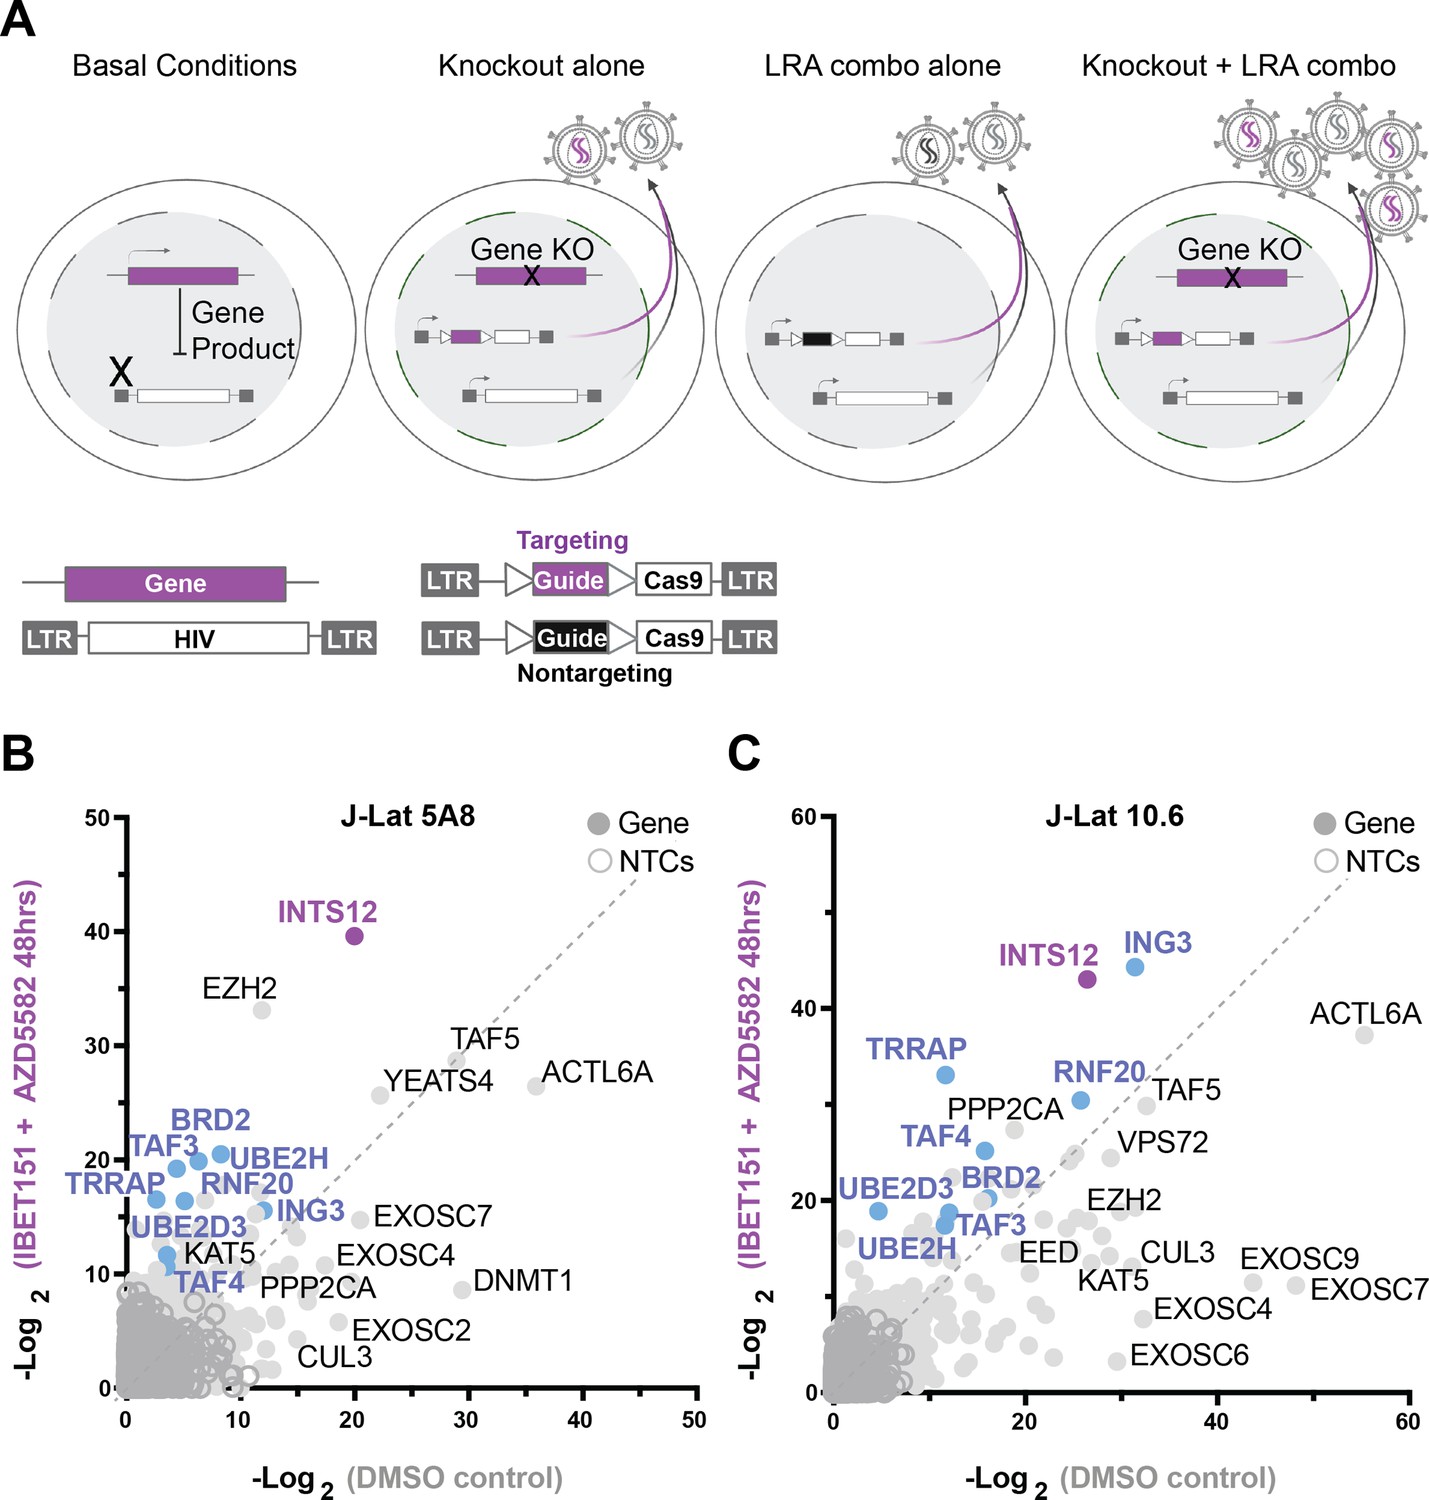
A screen to predict gene knockouts that will improve HIV reactivation from the combination of AZD5582 & I-BET151.
(A) Basal J-Lat conditions (left panel) followed by screen scenarios (middle to right panels). Screen overview: J-Lat cells containing an internal provirus are transduced with the HIV-CRISPR vector to generate a library of knockout cells for the human epigenetic library. Knockout cells are selected by puromycin and then either treated with latency reversal agents (LRAs) or untreated (DMSO). The HIV-CRISPR vector is packageable and will accumulate in the supernatant if the internal HIV provirus is reactivated. Sequencing the supernatant and cells allows for measurement of how enriched a guide is. (A, from left to right) Basal conditions show a gene product can block reactivation of HIV at the transcriptional level. Knockout alone shows that upon introducing the HIV-CRISPR some gene knockouts will result in latency reversal in the absence of LRA treatment. LRA combo alone shows the effect of LRA stimulation alone and how this will result in non-targeting guides (black) accumulating in the supernatant. Knockout + LRA combo shows that some gene knockouts will improve reactivation with LRA treatment and result in more virus accumulation. (B, C) are the results of the screens in J-Lat 5A8 (B) and J-Lat 10.6 (C). Each is graphed as a comparison of the LRA combination AZD5582 & I-BET151 (Y-axis) treated screens to the untreated (DMSO) screens (X-axis) as the -Log2 MAGeCK gene scores for each gene target. Purple and blue genes are genes in common between J-Lat 10.6 and 5A8 that are predicted to improve AZD5582 & I-BET151 treatment specifically, and purple is the top gene hit in common. NTC = nontargeting control guide.
Figure 1—figure supplement 1

Validation of HIV-CRISPR screen with inhibitors.
J-Lat 5A8 cells were knocked out for AAVS1 and then treated with DMSO, 100 nM I-BET151 (IBET) for 48 hr, 10 nM AZD5582 (AZD) for 48 hr, or 10 uM EZH2i Tazemetostat (Taz) for 96 hr. HIV reverse transcriptase activity was measured from the supernatant (reported in mU/mL). n=3 replicates for each condition.
Figure 2 with 3 supplements
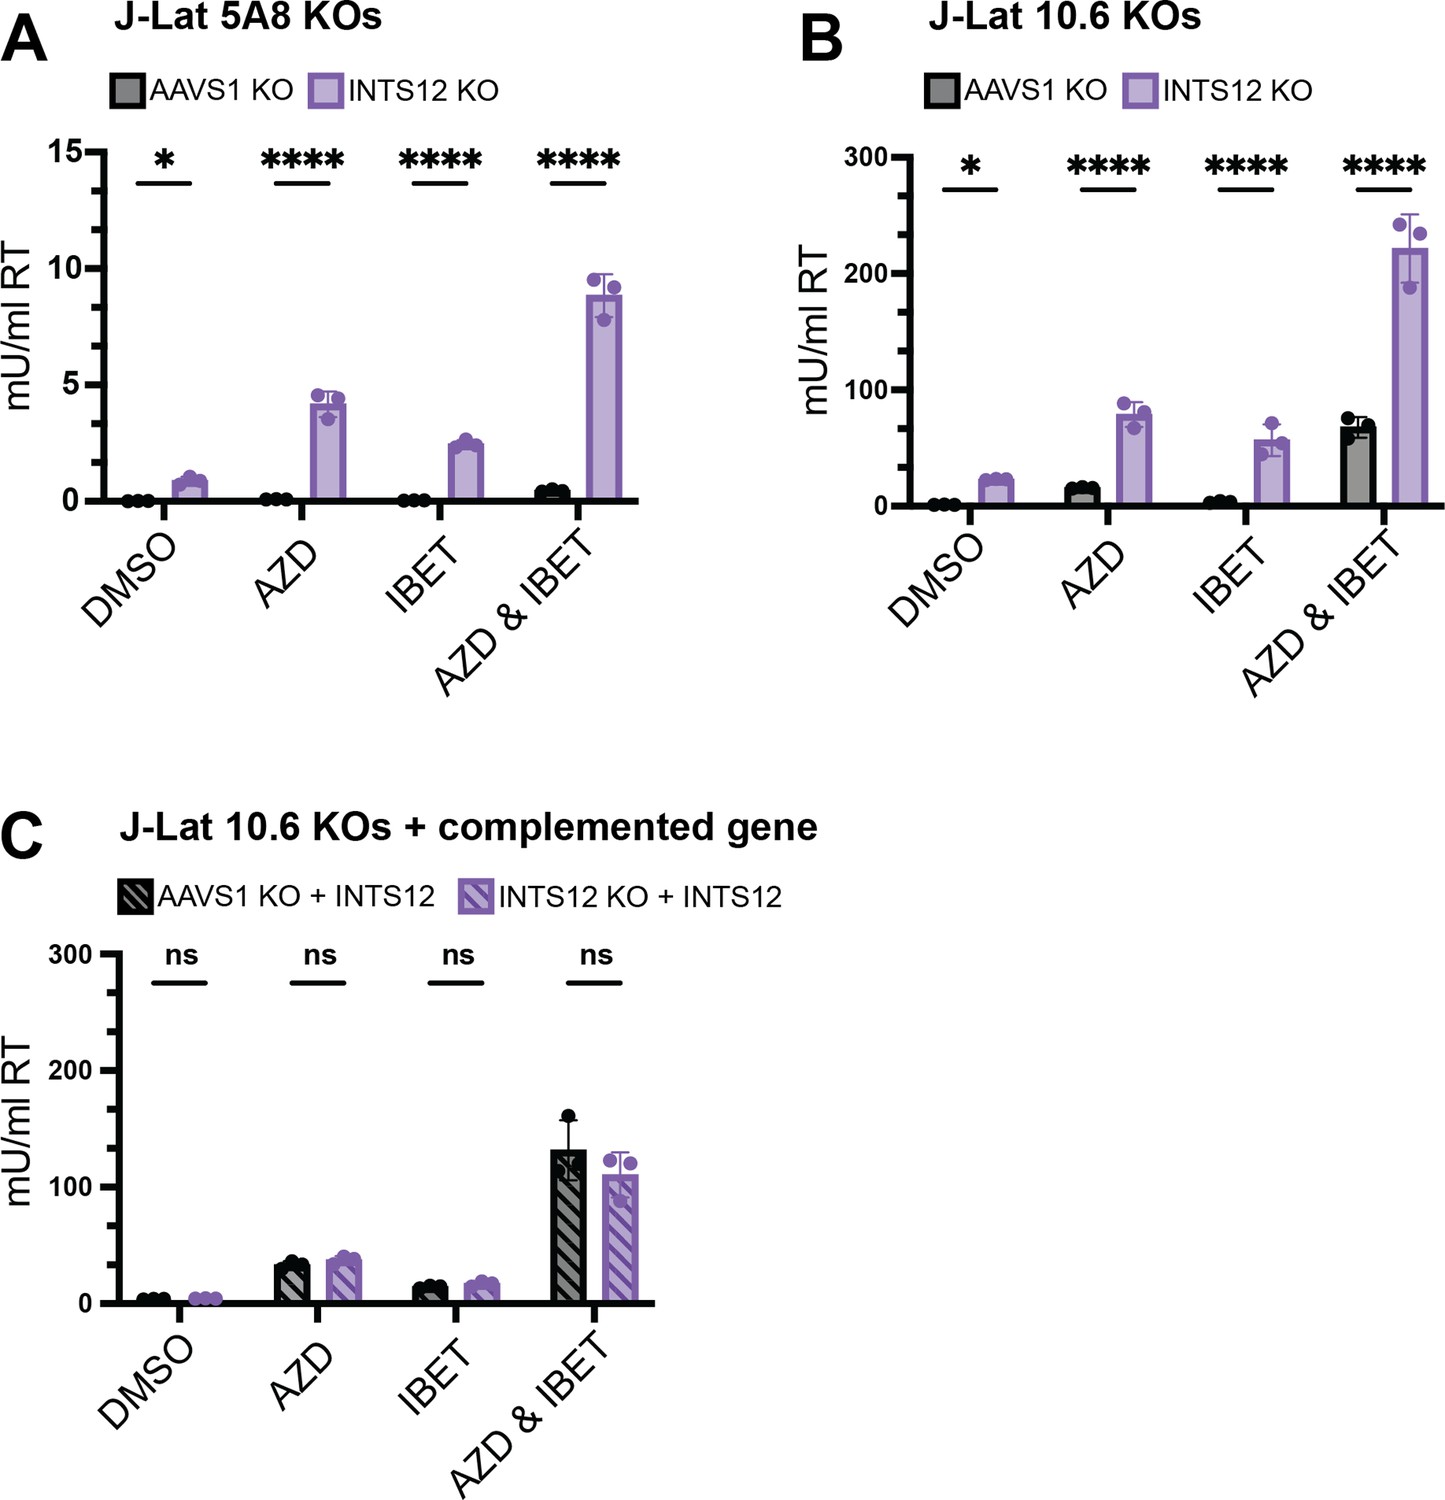
Validation of INTS12 knockout in HIV latency reversal both on its own and in the presence of AZD5582 & I-BET151.
J-Lat 5A8 (A) and J-Lat 10.6 (B) cells were knocked out for INTS12 or control locus, AAVS1. With a calculated INTS12 knockout score of 76% (for the one guide used) and 69% (for one of three guides used), respectively. Cells were then treated with 10 nM AZD5582 and or 100 nM I-BET151 for 48 hr (or an equivalent volume of DMSO), and HIV reverse transcriptase activity was measured from the supernatant (reported in mU/mL). (C) Complementation of cells knocked out for INTS12 or AAVS1 was transduced with a vector containing INTS12 before latency reversal agent (LRA) treatments. These cells had an INTS12 knockout score of 55% for one of three guides used. Untreated = DMSO, AZD = AZD5582, IBET = I-BET151. For statistical analysis, all conditions are compared to the AAVS1 control. n=3 replicates for each condition. Two-way ANOVA, (A, B) uncorrected Fisher’s LSD (C), Šídák’s multiple comparisons test, *p-value<0.05, **<0.01, ***<0.001, ****<0.0001.
Figure 2—figure supplement 1

Validation of INTS12 knockout in HIV latency reversal both on its own and in the presence of AZD5582 & I-BET151.
J-Lat 10.6 cells were knocked out for INTS12 using the HIV-CRISPR vector with 1 guide targeting INTS12 (cells generated at the same time as Figure 2A). Cells were then treated with 10 nM AZD5582 and or 0.1 μMI-BET151 for 48 hr (or an equivalent volume of DMSO), and HIV reverse transcriptase activity was measured from the supernatant (reported n mU/mL). Untreated = DMSO, AZD = AZD5582, IBET = I-BET151. For statistical analysis, all conditions are compared to the AAVS1 control. n=3 replicates for each condition. Two-way ANOVA, uncorrected Fisher’s LSD, *p-value<0.05, **<0.01, ***<0.001, ****<0.0001.
Figure 2—figure supplement 2
Validation of INTS12 knockout in HIV latency reversal both on its own and in the presence of AZD5582 & I-BET151.
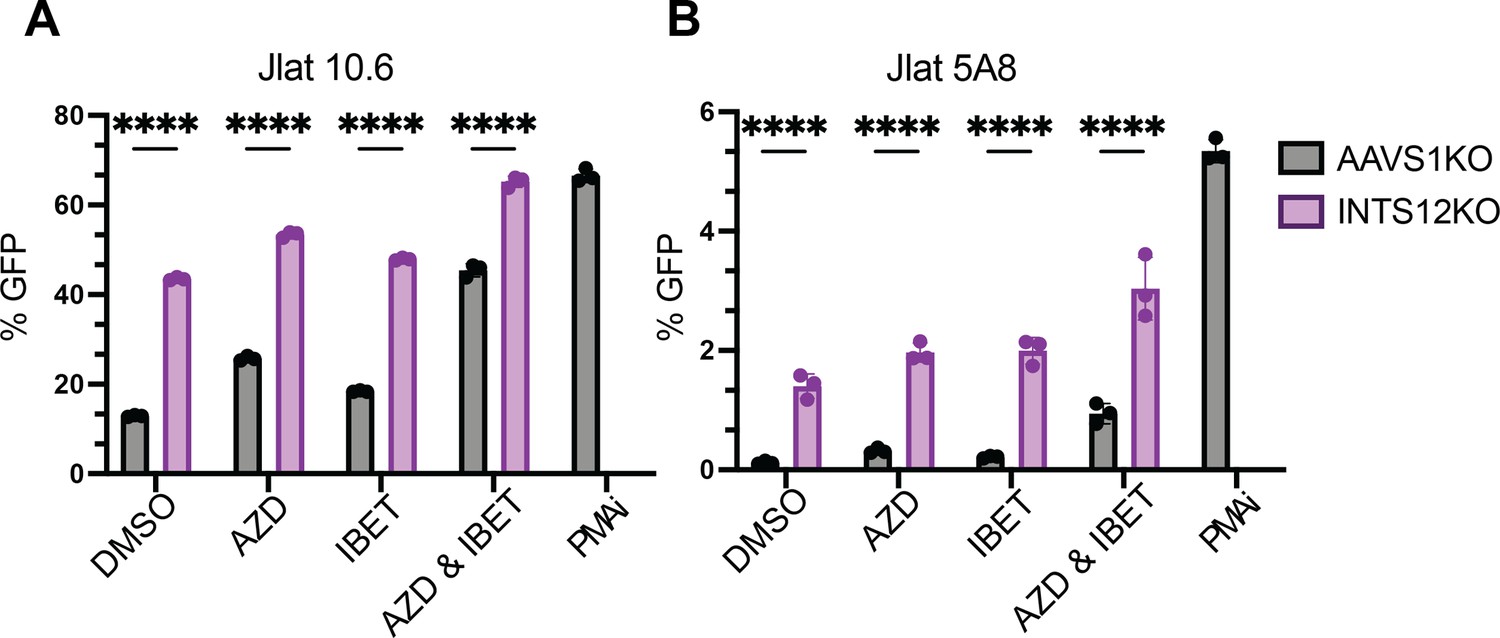
J-Lat 5A8 (A) and J-Lat 10.6 (B) cells were knocked out for INTS12 using the HIV-CRISPR vector with 1 guide targeting INTS12. Cells were then treated with 10 nM AZD5582 and or 0.1 µM I-BET151 for 48 hr (or an equivalent volume of DMSO), and flow cytometry was done to measure % GFP. Untreated = DMSO, AZD = AZD5582, IBET = I-BET151. For statistical analysis, all conditions are compared to the AAVS1 control. n=3 replicates for each condition. Two-way ANOVA, uncorrected Fisher’s LSD, *p-value<0.05, **<0.01, *** <0.001, ****<0.0001.
Figure 2—figure supplement 3
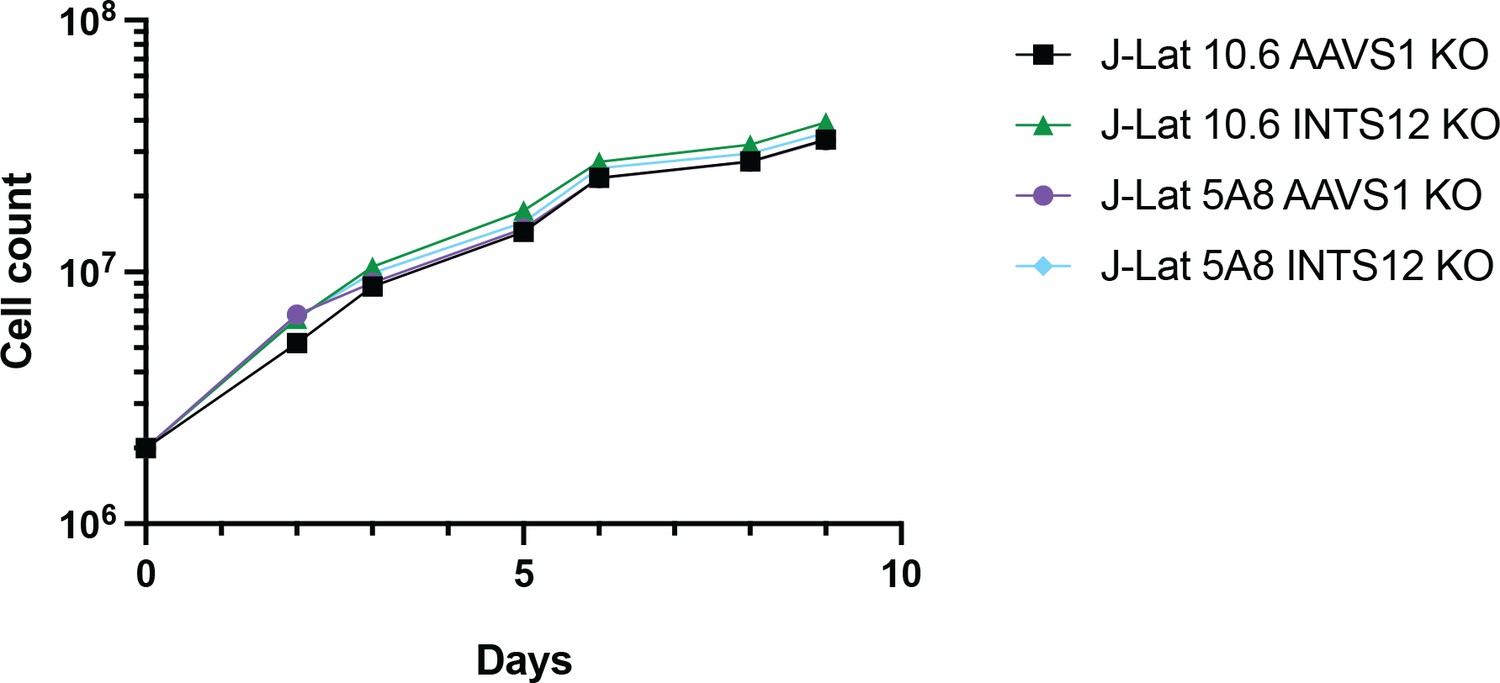
Growth curve of INTS12 knockout cells.
Figure 3
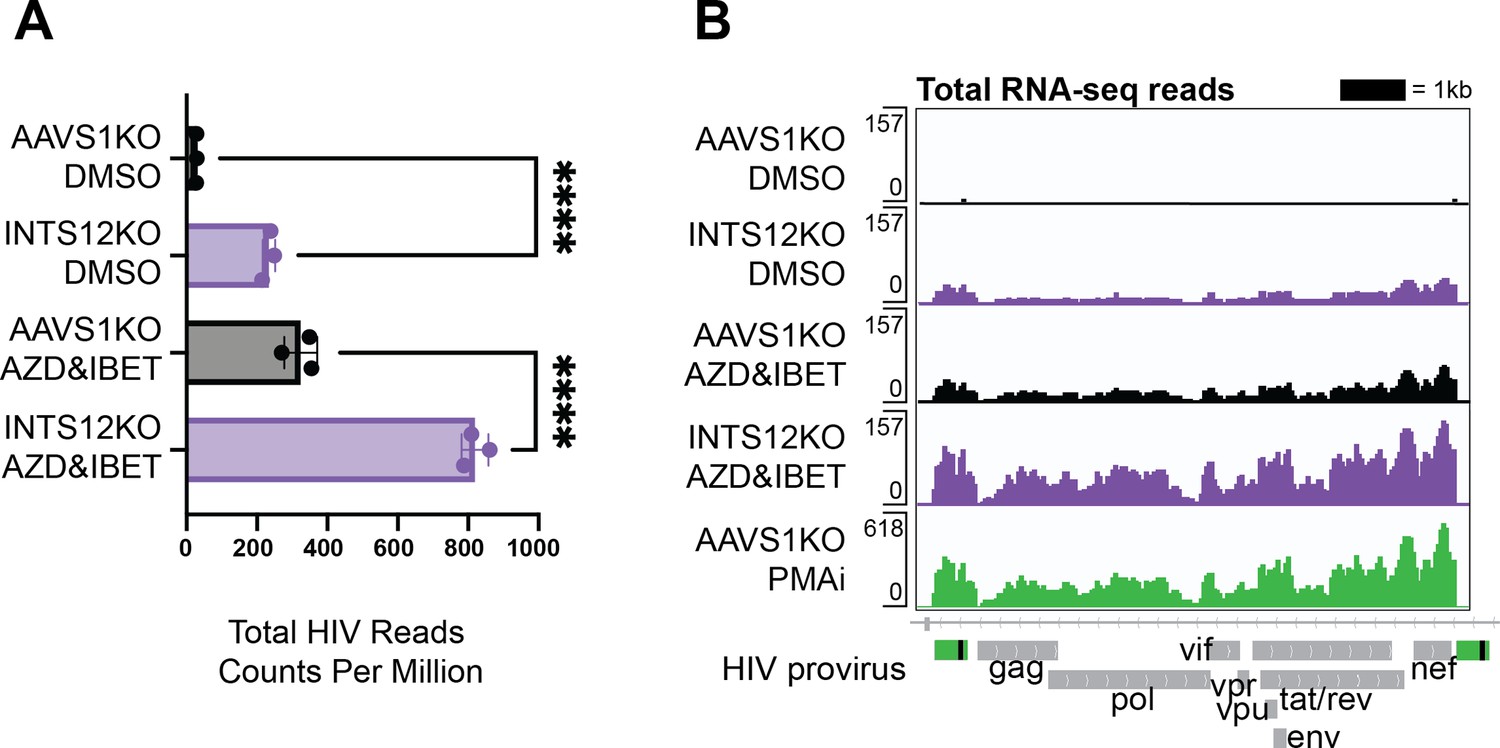
INTS12 KO reactivates HIV alone and in combination with AZD5582 & I-BET151 at the level of steady-state viral transcripts.
(A) Total RNA-seq reads mapping to the HIV provirus were averaged for biological triplicates normalized to copies per million reads (CPM). One way ANOVA, Šídák’s multiple comparisons tests, *p-value<0.05, **<0.01, ***<0.001, ****<0.0001. Read counts of the HIV-1 provirus in the AAVS1 KO treated with DMSO average about 30 CPM while read counts of the HIV-1 provirus in the INTS12 KO treated with AZD5582 and IBET-151 average about 800 CPM. (B) Pileup graphs corresponding to each of the conditions represent averaged reads from biological triplicates that have been normalized to CPM, and the peaks correspond in location to the integrated provirus with viral genes labeled below. The scale of the pileups is on the top left of each row. Note that PMAi has a different scale than the other samples. The 3’ LTR is masked so that LTR-containing reads will only map to the 5’ LTR. AZD = AZD5582, IBET = I-BET151, PMAi = PMA and ionomycin. All chromosome locations and quantified regions can be found in the ‘Materials and methods’. The INTS12 cell pools used in this figure have an INTS12 knockout score of 75%.
Figure 4
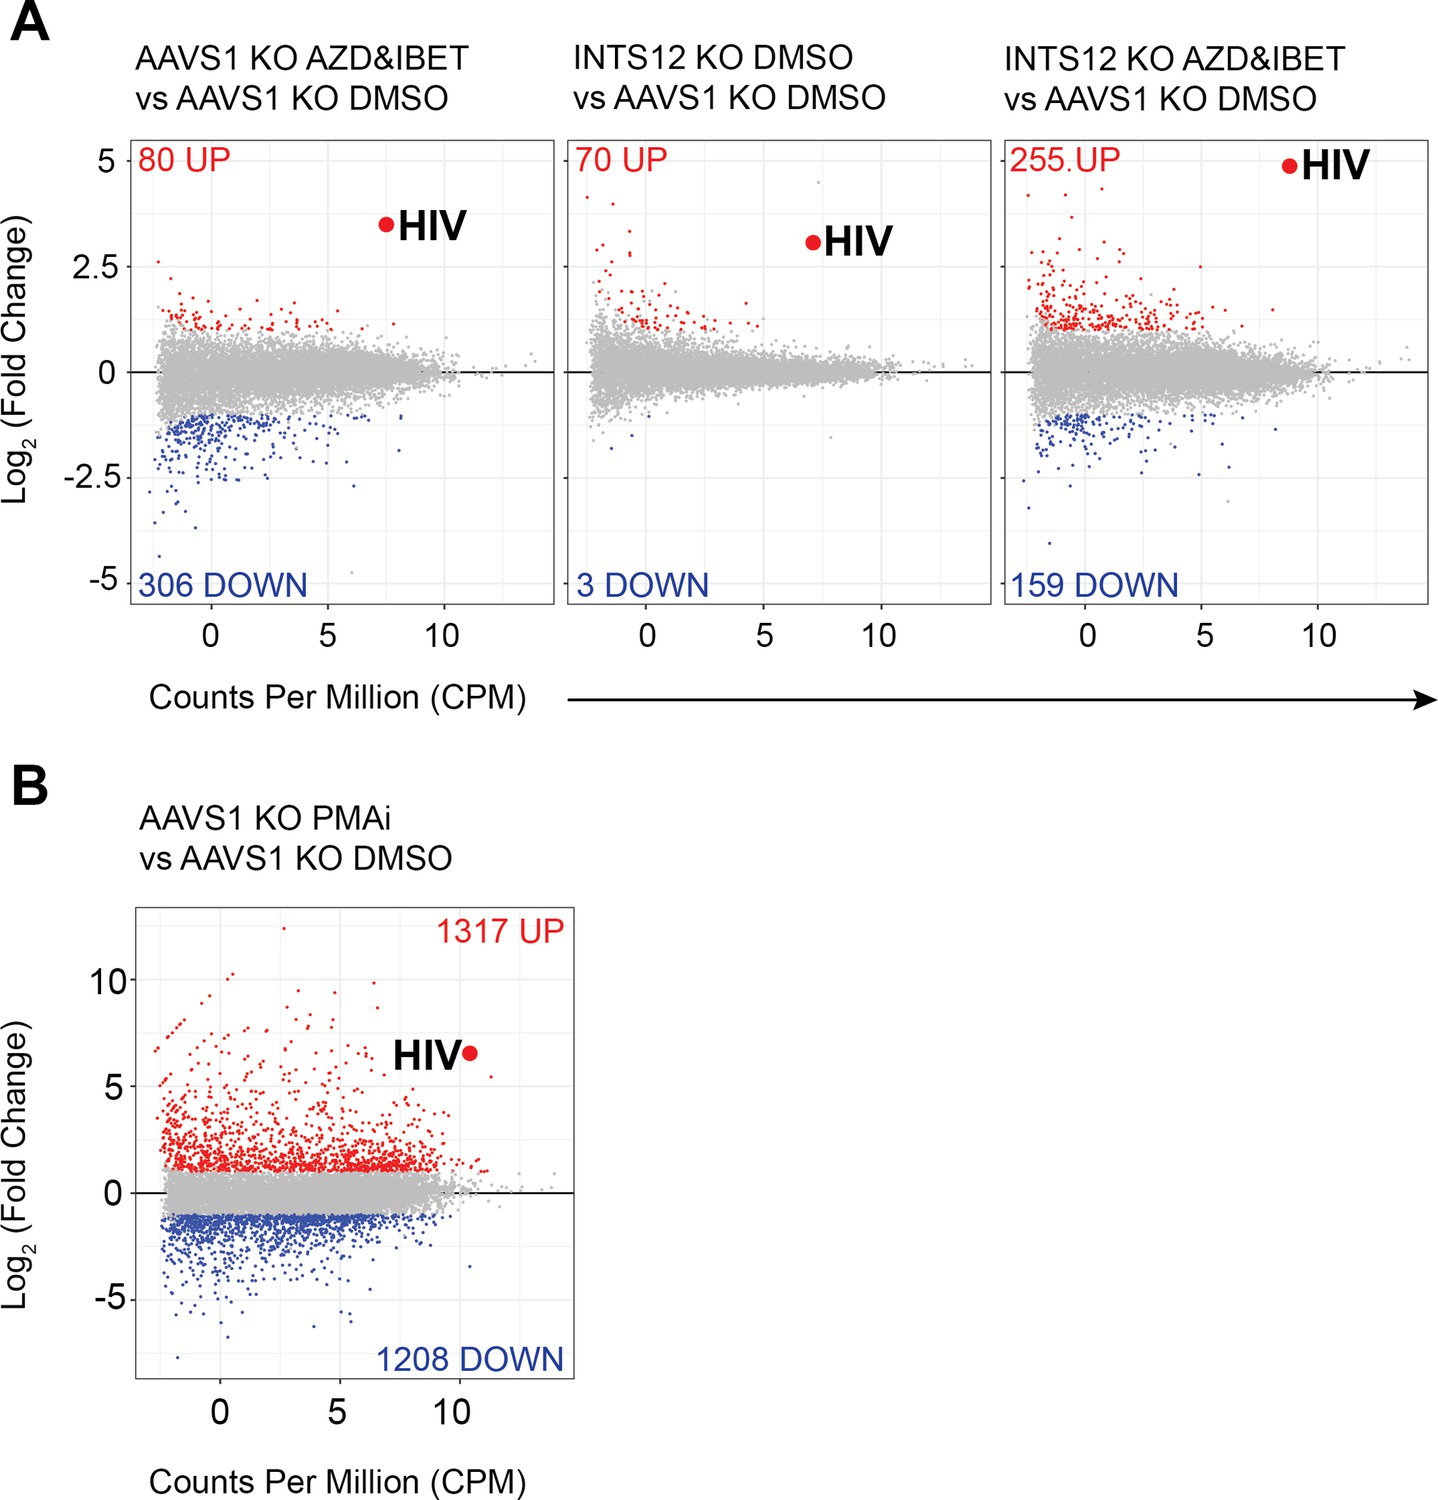
Specificity of INTS12 KO for reactivation of HIV on its own and in combination with AZD5582 & I-BET151.
Differentially expressed genes are graphed by Log2 (fold change) on the y-axis, denoting how upregulated (red) or downregulated (blue), a gene is, and the average counts per million (CPM) on the x-axis, denoting the expression of each gene. The big red dot denotes the average of all reads mapping to the HIV provirus. The red number at the top of each graph corresponds to the number of significantly upregulated genes in a comparison and the blue number at the bottom corresponds to number of significantly downregulated genes in a comparison. Gray genes are not statistically significant and not up or downregulated. (A left panel) shows the effect of AZD5582 & I-BET151 treatment alone compared to the DMSO control. (A, middle panel) shows the effect of the INTS12 KO on gene expression compared to the AAVS1 KO control. (A, right panel) shows the effect of both AZD5582 & I-BET151 treatment of INTS12 KO cells compared to the control DMSO-treated AAVS1 KO cells. (B) is graphed using a different scale than (A) and shows the effect of PMAi treatment compared to the DMSO control. The INTS12 cell pools used in this figure have an INTS12 knockout score of 75%.
Figure 5 with 2 supplements
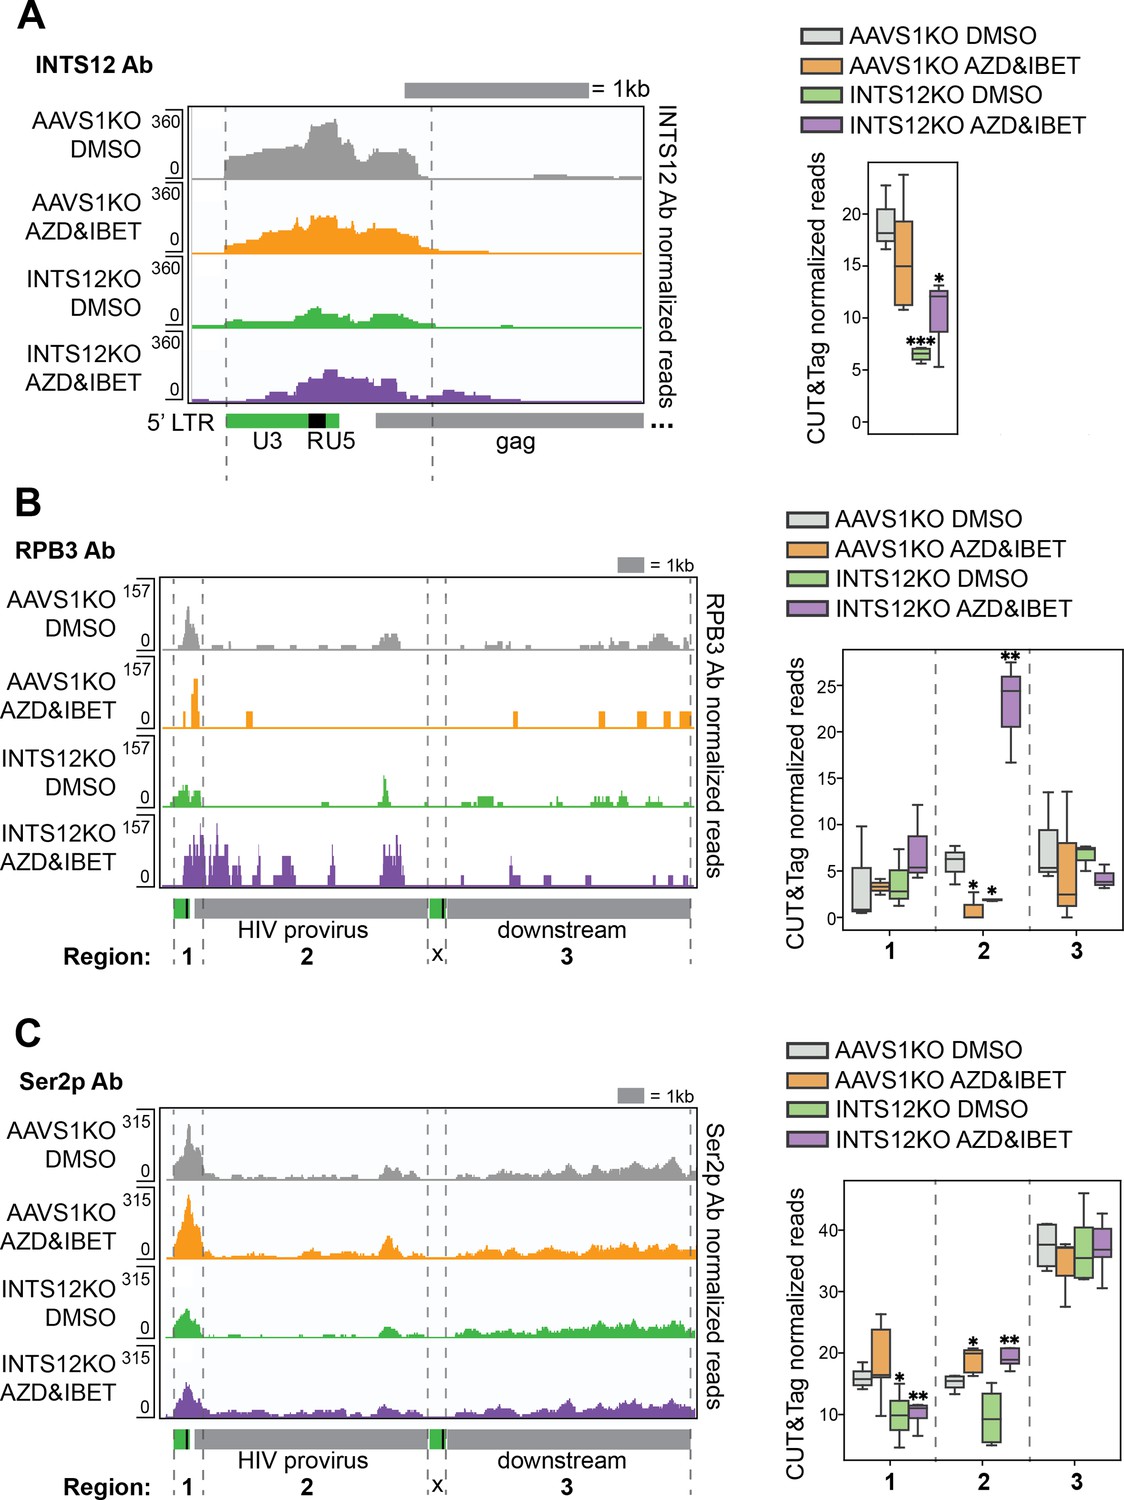
INTS12 binds the HIV promoter, and INTS12 KO paired with latency reversal agents (LRAs) increases occupancy of elongation-competent RNAPII throughout the provirus.
CUT&Tag using antibodies to INTS12 (A), total RNAPII (RPB3) (B), or RNAPII Ser2 phosphorylation (Ser2p) (C) were used to generate pileup graphs that show where each are binding chromatin. The location of where reads are mapping is denoted below the tracks, and the scale are the numbers on the left of each row. Each row represents three to five technical replicates averaged together. The 3’ LTR is masked so that LTR-containing reads will only map to the 5’ LTR. (A, left panel) shows a zoom-in of the HIV LTR and where INTS12 is binding. (A, right panel) quantifies total reads of INTS12 in the area denoted by the gray dashed lines in the left panel. (B, left panel) shows where RPB3 is binding across the HIV provirus and downstream. (B, right panel) quantifies total reads of RPB3 in the regions denoted by the gray dashed lines in the left panel, regions 1–3. (C, left panel) shows where RNAPII Ser2p is found across the HIV provirus and downstream. (B, right panel) quantifies total reads of RNAPII Ser2p in the regions denoted by the gray dashed lines in the left panel, regions 1–3. All chromosome locations and quantified regions can be found in the ‘Materials and methods’. Two-tailed independent samples t-test *p-value<0.05, **<0.01, ***<0.001, ****<0.0001. Cells used in this figure have an INTS12 knockout score of 80%.
Figure 5—figure supplement 1
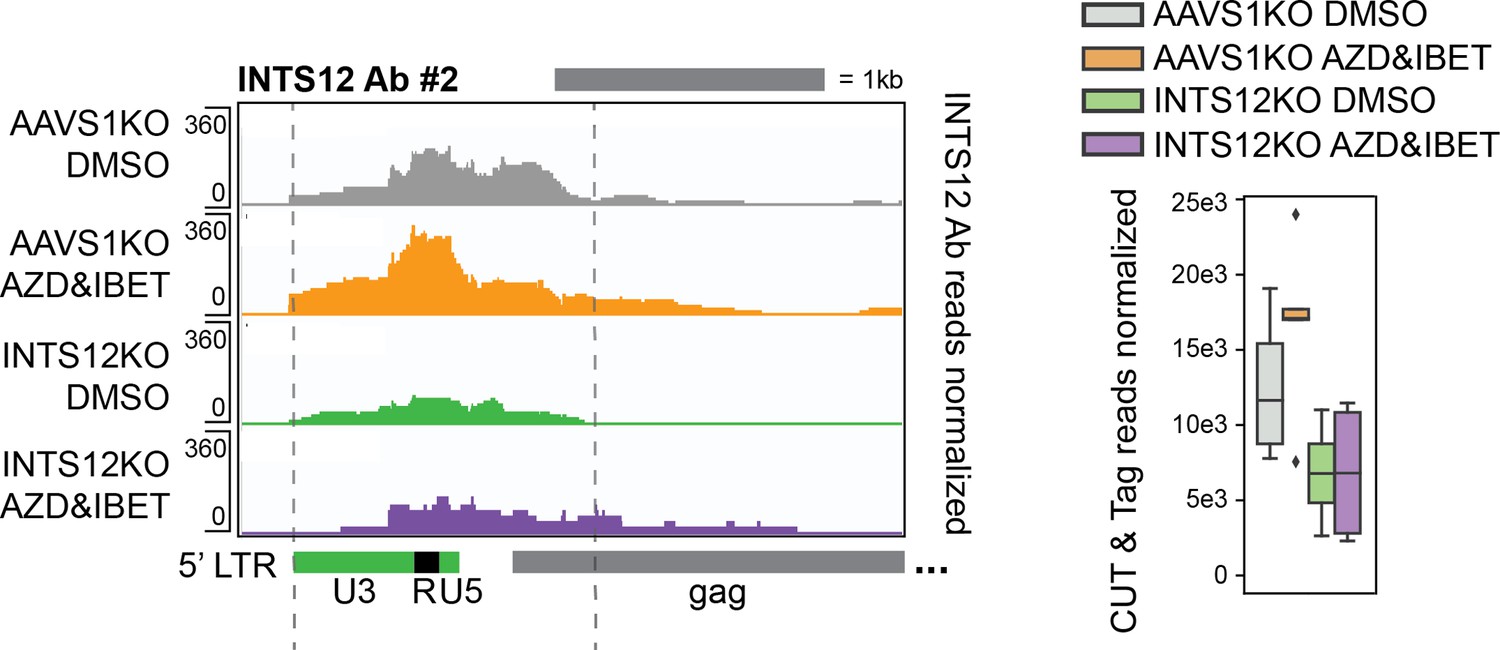
INTS12 localization with a second antibody.
Left panel represents pileup graphs of sequencing reads corresponding to INTS12 binding corresponding to the genome location specified below. Right panel is the quantification of all reads between the gray dotted lines on the left. This region matches the same region quantified in Figure 5A for INTS12 Ab #1. n=3-5 technical replicates. All chromosome locations and quantified regions can be found in the ‘Materials and methods’.
Figure 5—figure supplement 2
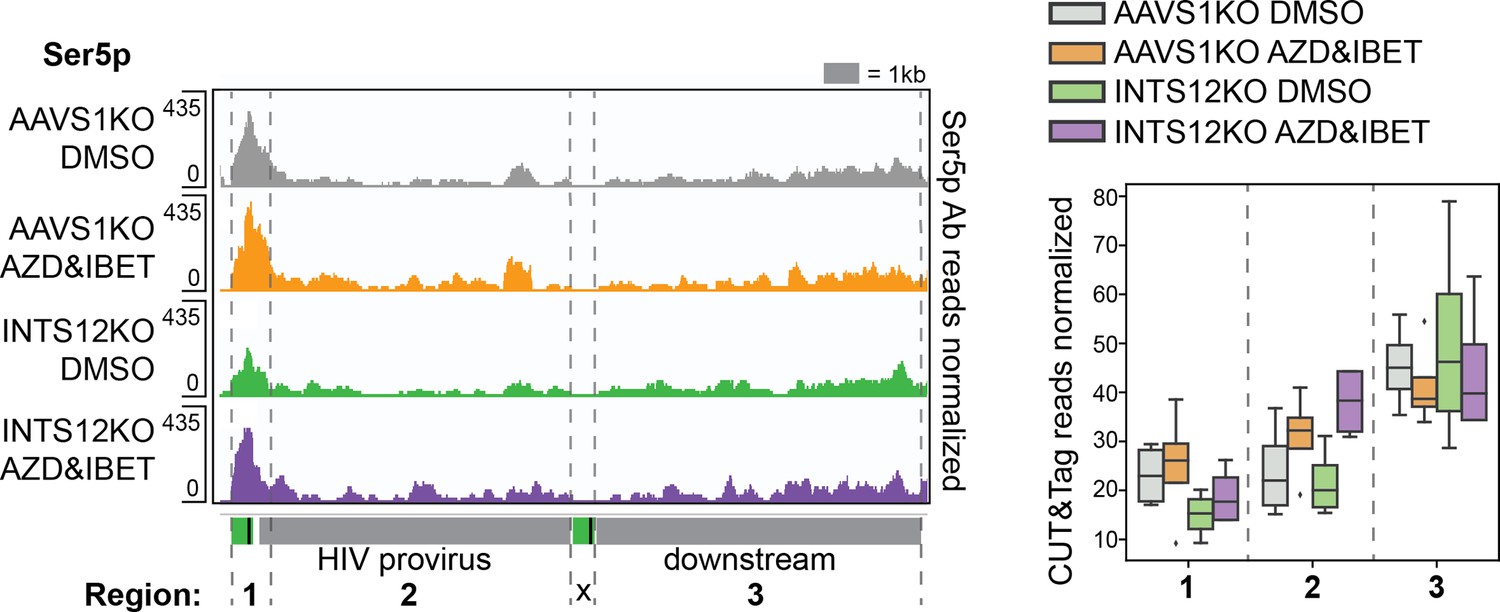
Ser5 phosphorylation localization.
Left panel represents pileup graphs of sequencing reads corresponding to Ser5 phosphorylation corresponding to the genome location specified below. Right panel is the quantification of all reads between the gray dotted lines on the left. n=3-5 technical replicates. All chromosome locations and quantified regions can be found in the ‘Materials and methods.
Figure 6
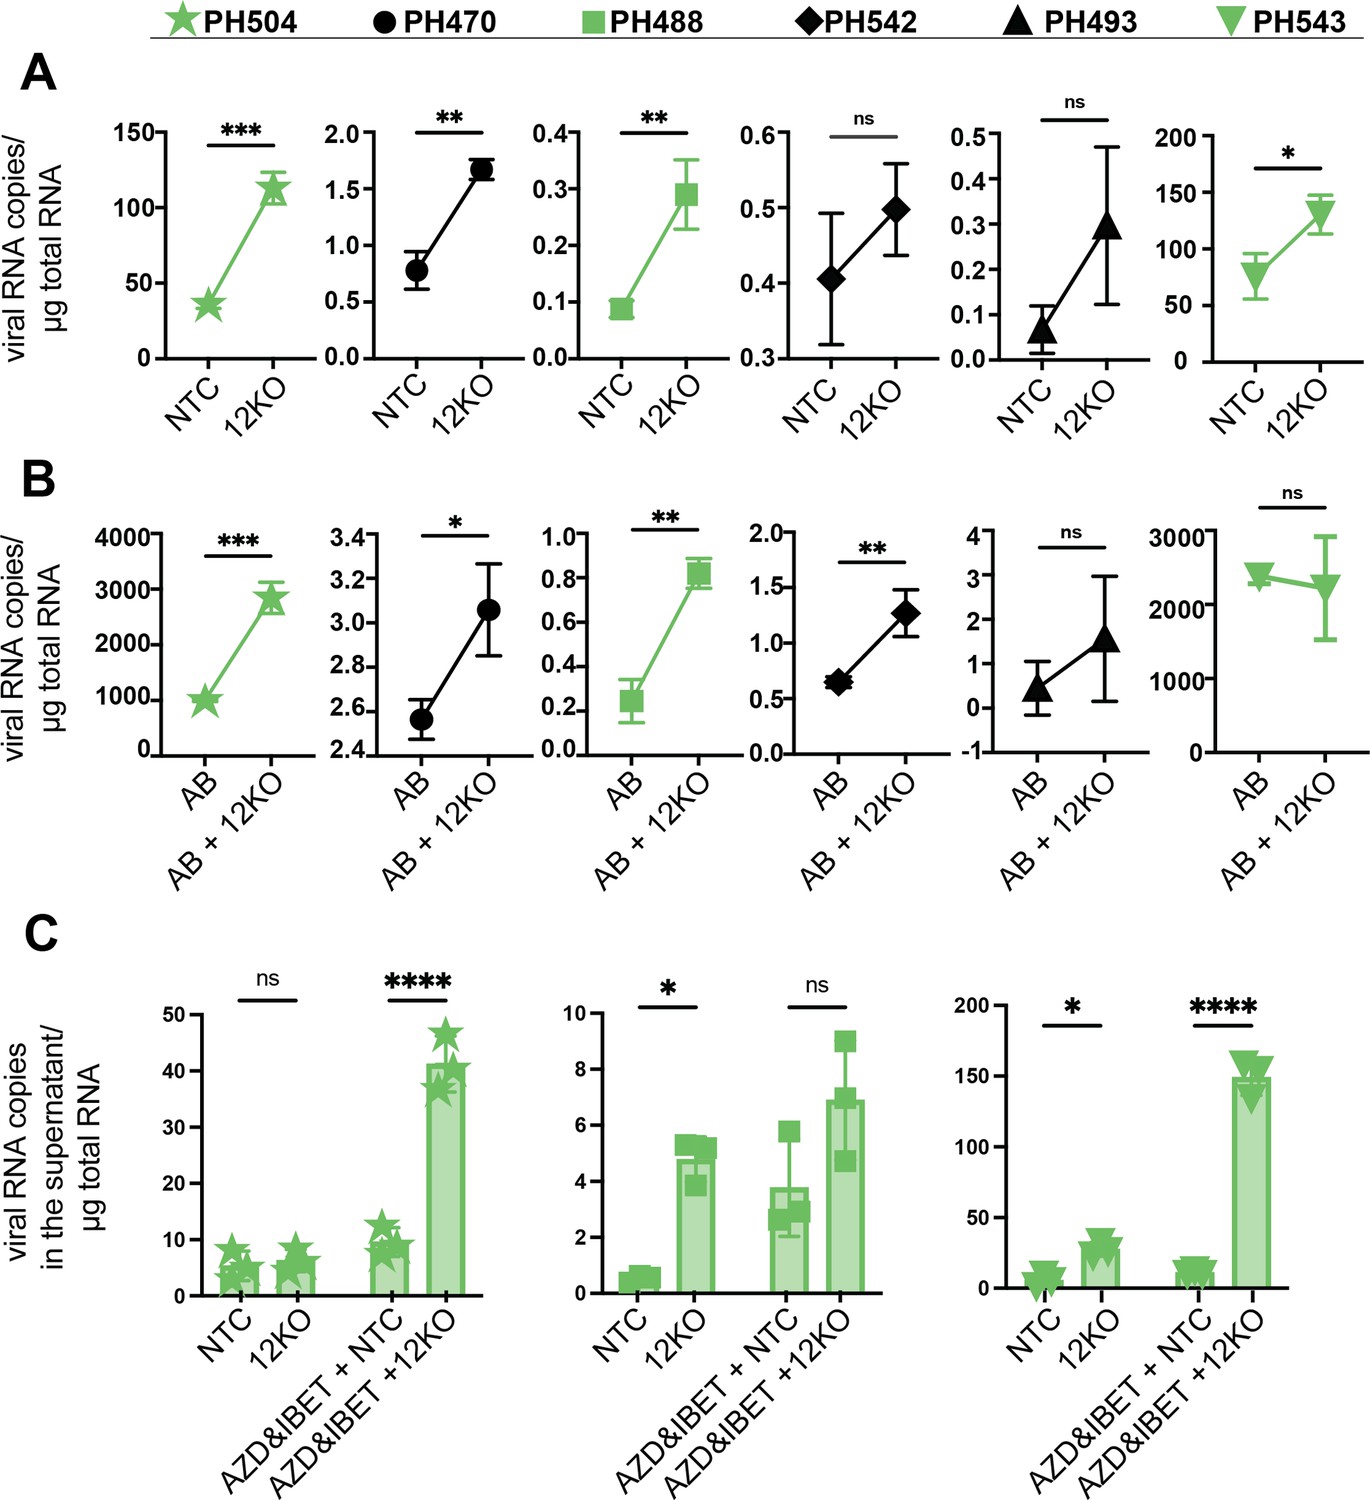
INTS12 knockout in an ex vivo primary cell system shows reactivation from knockout alone and in combination with AZD5582 & I-BET151.
The number of gag copies/ug of RNA was measured from the cell (A, B) or the supernatant (C) for different donors, marked by different symbols, above. (A) INTS12KO (12KO) was compared to a non-targeting control (NTC). (B) AZD5582 & I-BET151-treated INTS12 KO (AB + 12 KO) was compared to AZD5582 & I-BET151 treatment (AB). n=3 replicates for each condition. Unpaired t-test, *p-value<0.05, **<0.01, ***<0.001, ****<0.0001. The green coloration denotes samples that are in common between (A–C). (C) Viral RNA in the supernatant was measured for three different donors. n=3 replicates for each condition. Two-way ANOVA *p-value<0.05, **<0.01, ***<0.001, ****<0.0001.
Figure 7
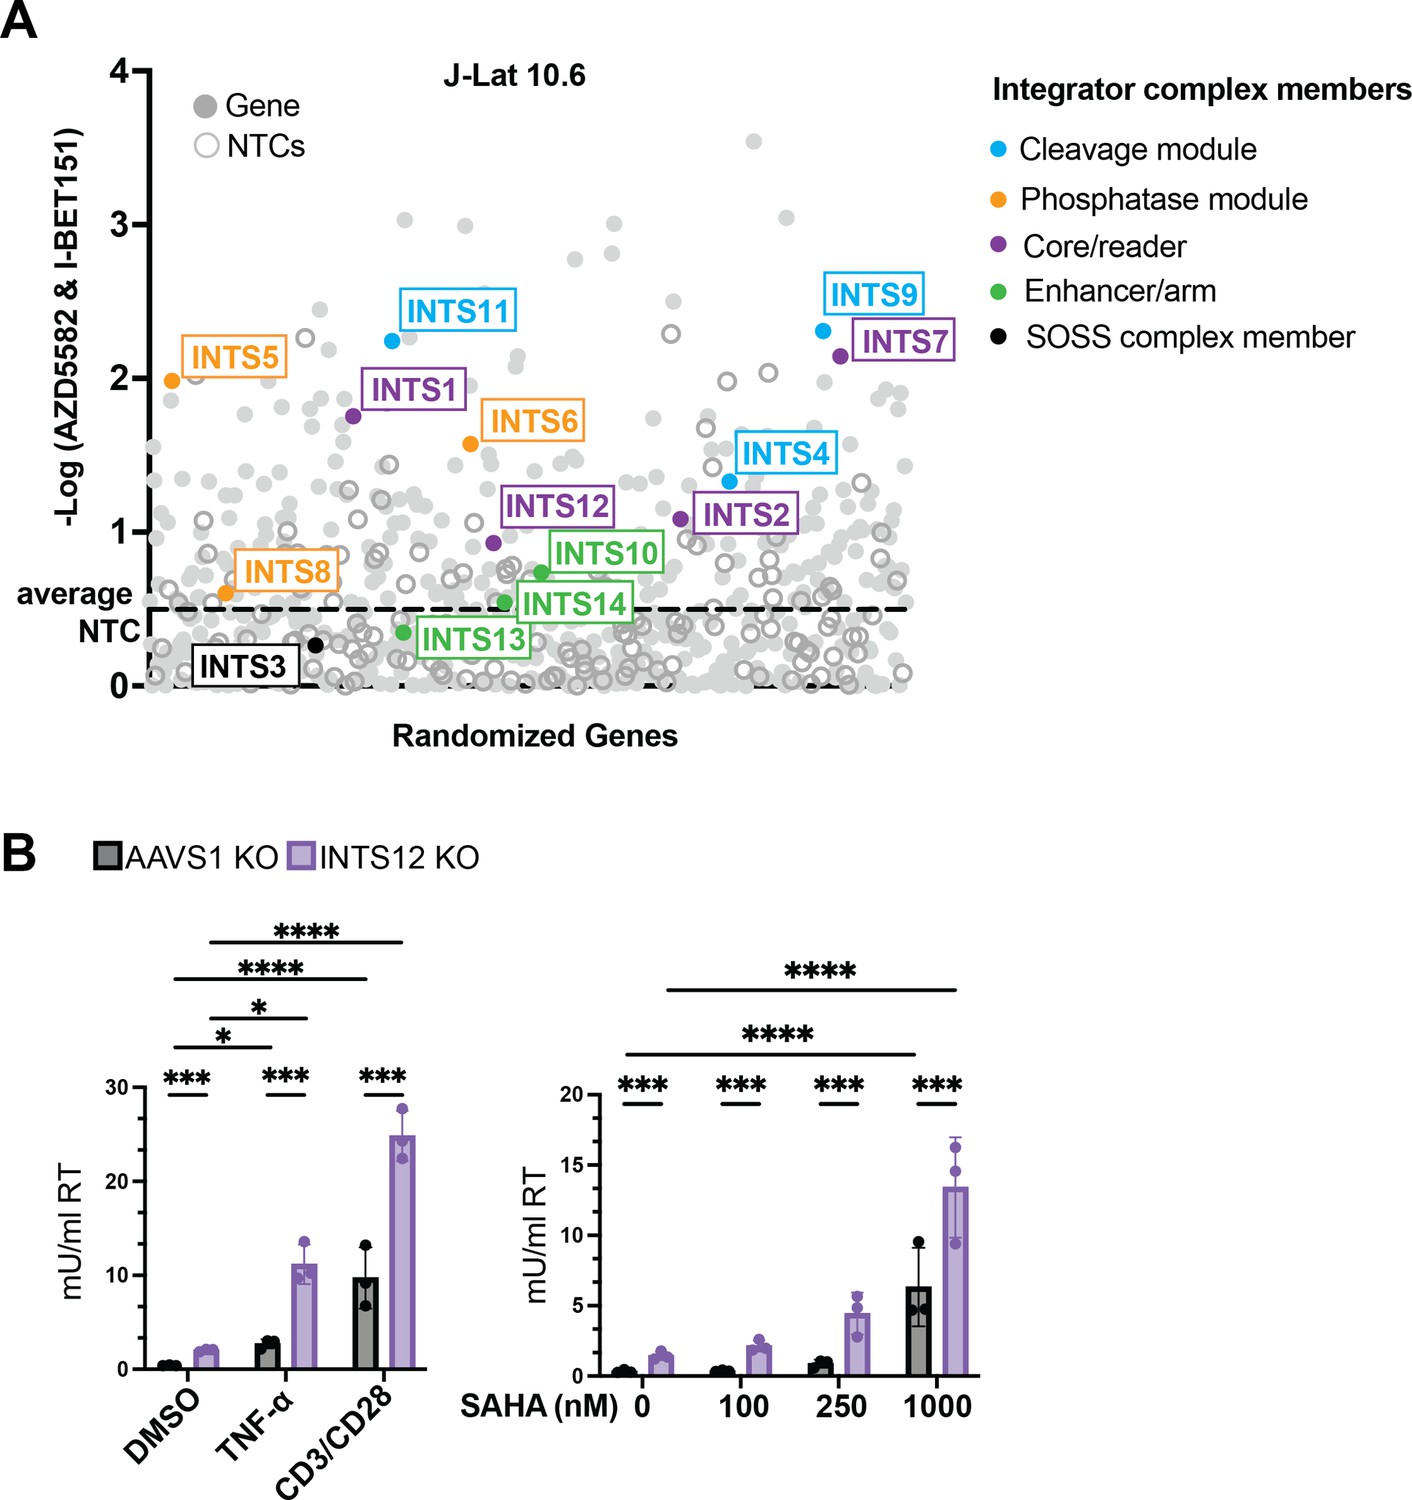
Most of the Integrator complex contributes to a block to HIV reactivation and INTS12 can be targeted to increase HIV reactivation with a broad spectrum of stimuli.
(A) Screen #2 was performed in J-Lat 10.6 cells of a library of NF-kB-related factors where all Integrator complex members were added. The y-axis is the -log (MAGeCK gene score) that denotes how enriched a gene is. INTS12 has been shown to bind INTS1 (Fianu et al., 2021), so INTS12 was included in the core group coloration. The average NTCs are marked by a dotted line. (B) J-Lat 10.6 cells were knocked out for INTS12 or control locus, AAVS1. Cells were then treated with TNF-α or stimulated with anti-CD3/anti-CD28 antibodies for 20 hr (left panel), or SAHA for 24 hr (right panel). HIV reverse transcriptase activity was measured from the supernatant (reported in mU/mL). For statistical analysis, all conditions are compared to the AAVS1 control. n=3 replicates. Two-way ANOVA, (B) uncorrected Fisher’s LSD, *p-value<0.05, **<0.01, ***<0.001, ****<0.0001. All cells used have an INTS12 knockout score of 75%.
Additional files
-
Supplementary file 1
HuEpi Screen 1 results.
- https://cdn.elifesciences.org/articles/103064/elife-103064-supp1-v1.xlsx
-
Supplementary file 2
Guides and ICE primers.
- https://cdn.elifesciences.org/articles/103064/elife-103064-supp2-v1.xlsx
-
Supplementary file 3
RNA-seq files and Integrator complex expression compilation.
- https://cdn.elifesciences.org/articles/103064/elife-103064-supp3-v1.xlsx
-
Supplementary file 4
PLWH reservoir information.
- https://cdn.elifesciences.org/articles/103064/elife-103064-supp4-v1.xlsx
-
Supplementary file 5
NFkB-related Screen 2 containing all Integrator members.
- https://cdn.elifesciences.org/articles/103064/elife-103064-supp5-v1.xlsx
-
MDAR checklist
- https://cdn.elifesciences.org/articles/103064/elife-103064-mdarchecklist1-v1.pdf
Download links
A two-part list of links to download the article, or parts of the article, in various formats.
Downloads (link to download the article as PDF)
Open citations (links to open the citations from this article in various online reference manager services)
Cite this article (links to download the citations from this article in formats compatible with various reference manager tools)
Integrator complex subunit 12 knockout overcomes a transcriptional block to HIV latency reversal
eLife 13:RP103064.
https://doi.org/10.7554/eLife.103064.3


