Glucokinase activity controls peripherally located subpopulations of β-cells that lead islet Ca2+ oscillations
- Department of Medicine, Division of Endocrinology, Diabetes & Metabolism, University of Wisconsin-Madison, United States
- Department of Bioengineering, University of Colorado Anschutz Medical Campus, United States
- Barbara Davis Center for Childhood Diabetes, University of Colorado Anschutz Medical Campus, United States
Figures
Figure 1 with 2 supplements

Engineering of a light-sheet microscope to image intact islets in 3D.
(A) Schematic of the light-sheet microscope showing the optical configuration. (B) Representative light-sheet (upper panel) and spinning disk confocal images (lower panel) of a mouse pancreatic islet expressing β-cell-specific H2B-mCherry fluorophore at different two-dimensional (2D) focal planes, emphasizing the superior depth penetration of the light-sheet microscope. (C) 3D imaging of β-cells expressing GCaMP6s Ca2+ biosensors and nuclei mCherry biosensors. (D) Using Ins1-Cre:ROSA26GCaMP6s/H2B-mCherry islets, the software-identified center of β-cell nuclei (yellow dots) was used to generate GCaMP6s regions of interest (gray spheres). A representative Ca2+ time course is displayed in the right panel for an islet stimulated with glucose and amino acids.
Figure 1—figure supplement 1
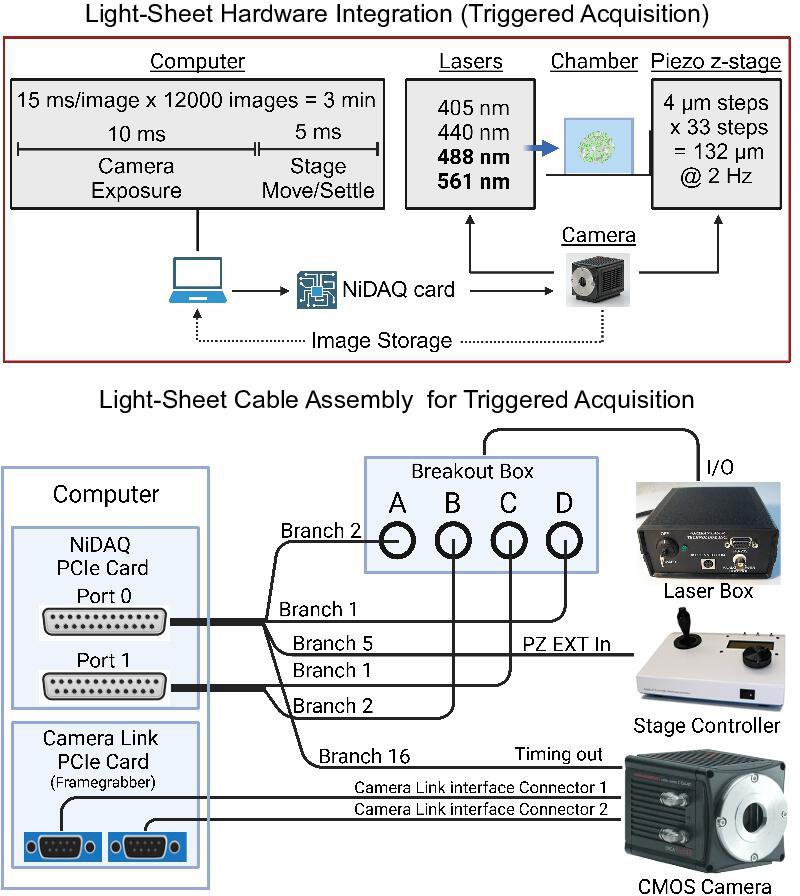
Hardware wiring diagram of the light-sheet microscope.
Hardware integration (top panel) for camera-triggered activation of the excitation lasers and piezo z-stage that limits communication to a single instruction from the computer every 3 min. Wiring diagram (bottom panel): two Nikon ‘standard cables’ connect to the NiDAQ card installed in the computer. These two cables link to the laser control box, stage controller, and camera. The images captured are received by the computer through a camera link PCIe card.
Figure 1—figure supplement 2
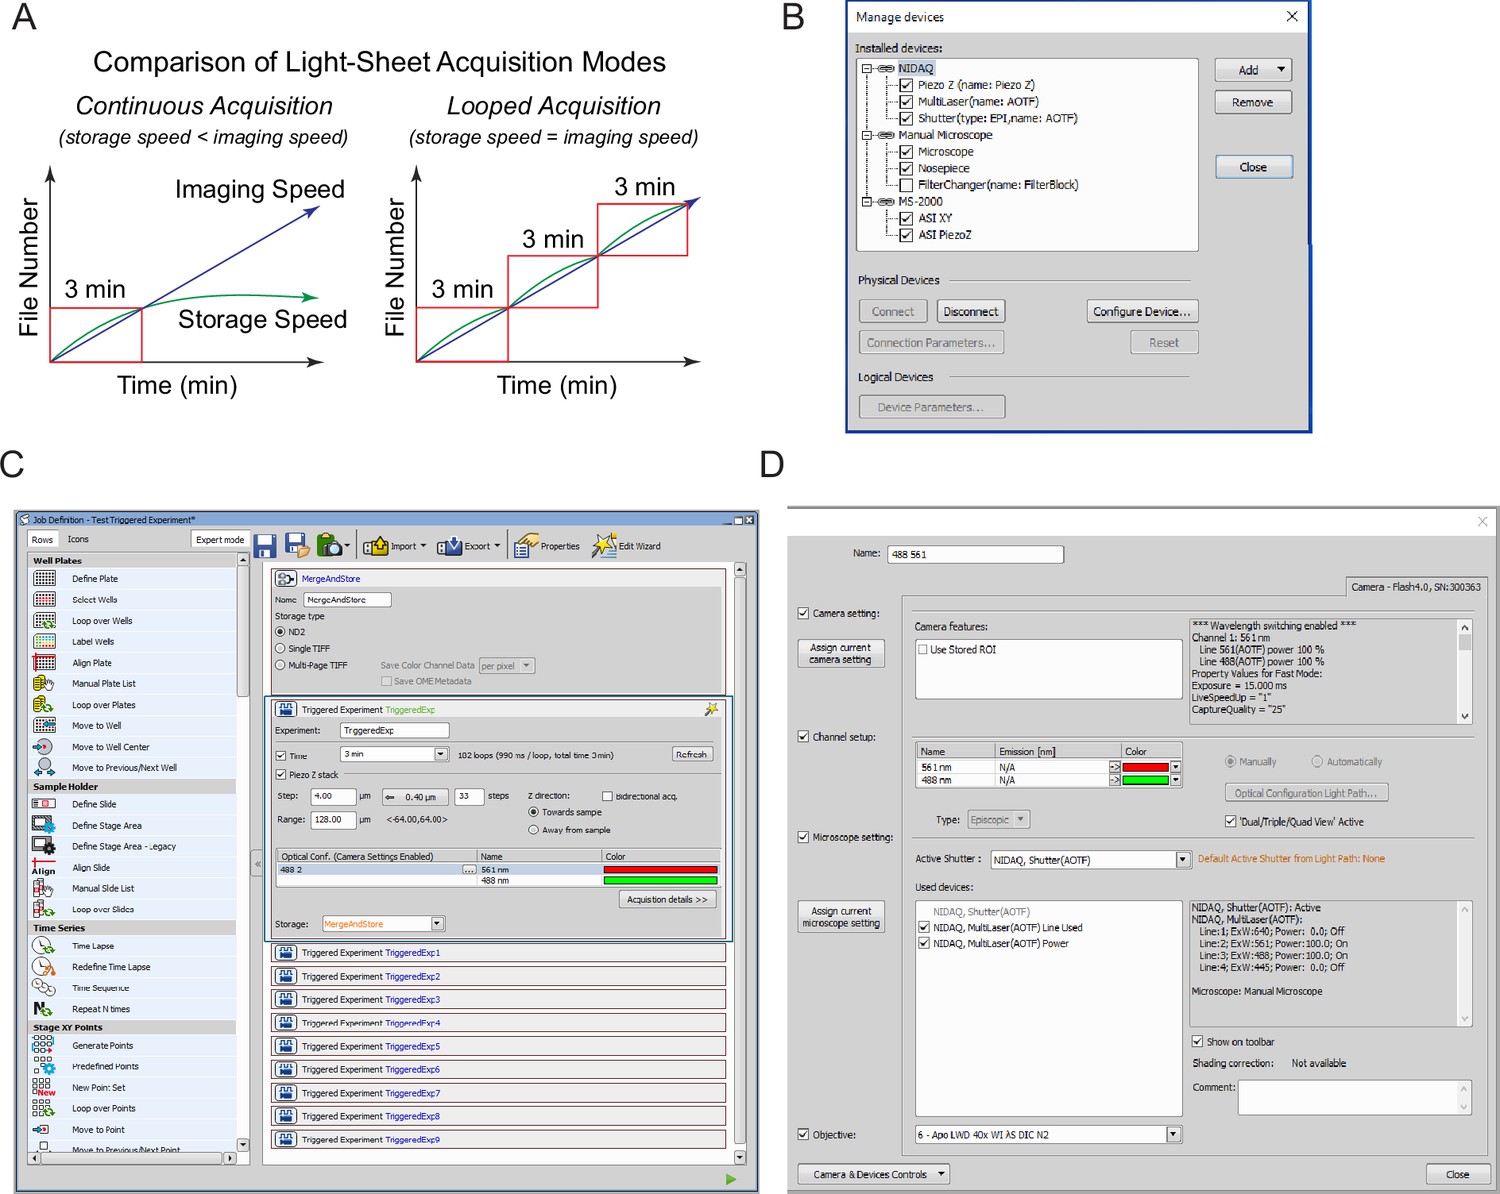
NIS-Elements software configuration.
(A) Schematic for comparing continuous acquisition and looped acquisition. The red box indicates the 3-min window where storage speed is higher than imaging speed. (B) Devices linked to NIS-Elements. (C) NIS-Elements JOBS module configured for looped acquisition. (D) Optical configuration for simultaneous GCaMP6s/H2B-mCherry excitation.
Figure 2
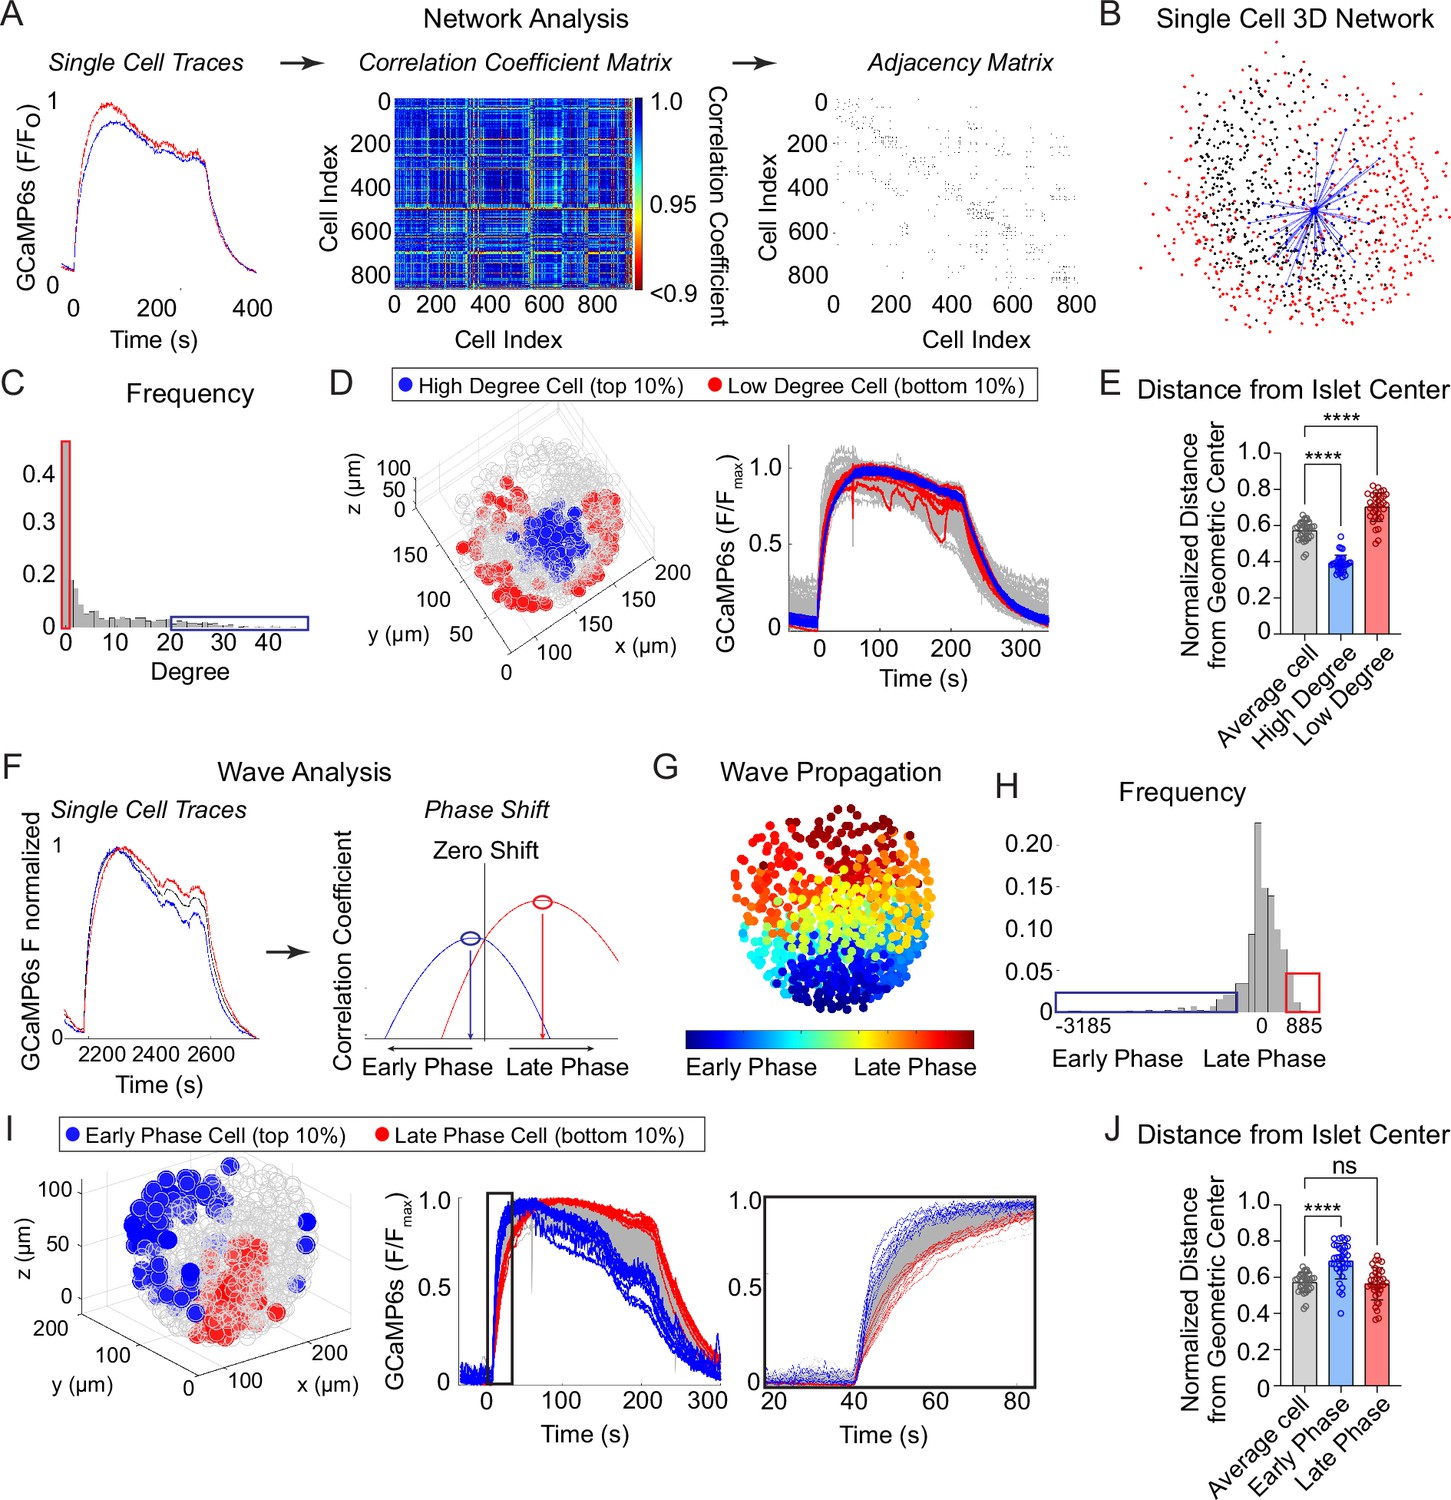
Characterization of single β-cells using three-dimensional (3D) network and phase analysis.
(A) Flow diagram illustrating the calculation of cell degree from pairwise comparisons between single β-cells. (B) An example 3D network for a single β-cell within a representative islet is shown with synchronized cell pairs in blue, cells that have other synchronized pairs in black, and cells that are asynchronous in red. This analysis is repeated for all cells in the islet. (C) Frequency distribution of cell degree for all β-cells analyzed. Top 10% (blue box) and bottom 10% (red box) are high and low degree cells. (D) Representative 3D illustration and Ca2+ traces showing the location of high degree cells (blue) and low degree cells (red). (E) Quantification of the normalized distance from the islet center for average degree cells (gray), high degree cells (blue), and low degree cells (red). (F) Flow diagram illustrating the calculation of cell phase, calculated from the correlation coefficient and phase shift. (G) Wave propagation from early phase cells (blue) to late phase cells (red) in 3D space. (H) Frequency distribution of cell phase for all β-cells analyzed. Top 10% (blue box) and bottom 10% (red box) are early and late phase cells. (I) Representative 3D illustration and Ca2+ traces showing the location and traces of high phase cells (blue) and low degree cells (red). (J) Quantification of the normalized distance from the islet center for average phase cells (gray), early phase cells (blue), and late phase cells (red). Data represent n = 28,855 cells, 33 islets, 7 mice. Data are displayed as mean ± SEM. ****p < 0.0001 by one-way ANOVA.
-
Figure 2—source data 1
Source data for distance from center measurement for network and wave analysis.
- https://cdn.elifesciences.org/articles/103068/elife-103068-fig2-data1-v1.xlsx
Figure 3 with 1 supplement
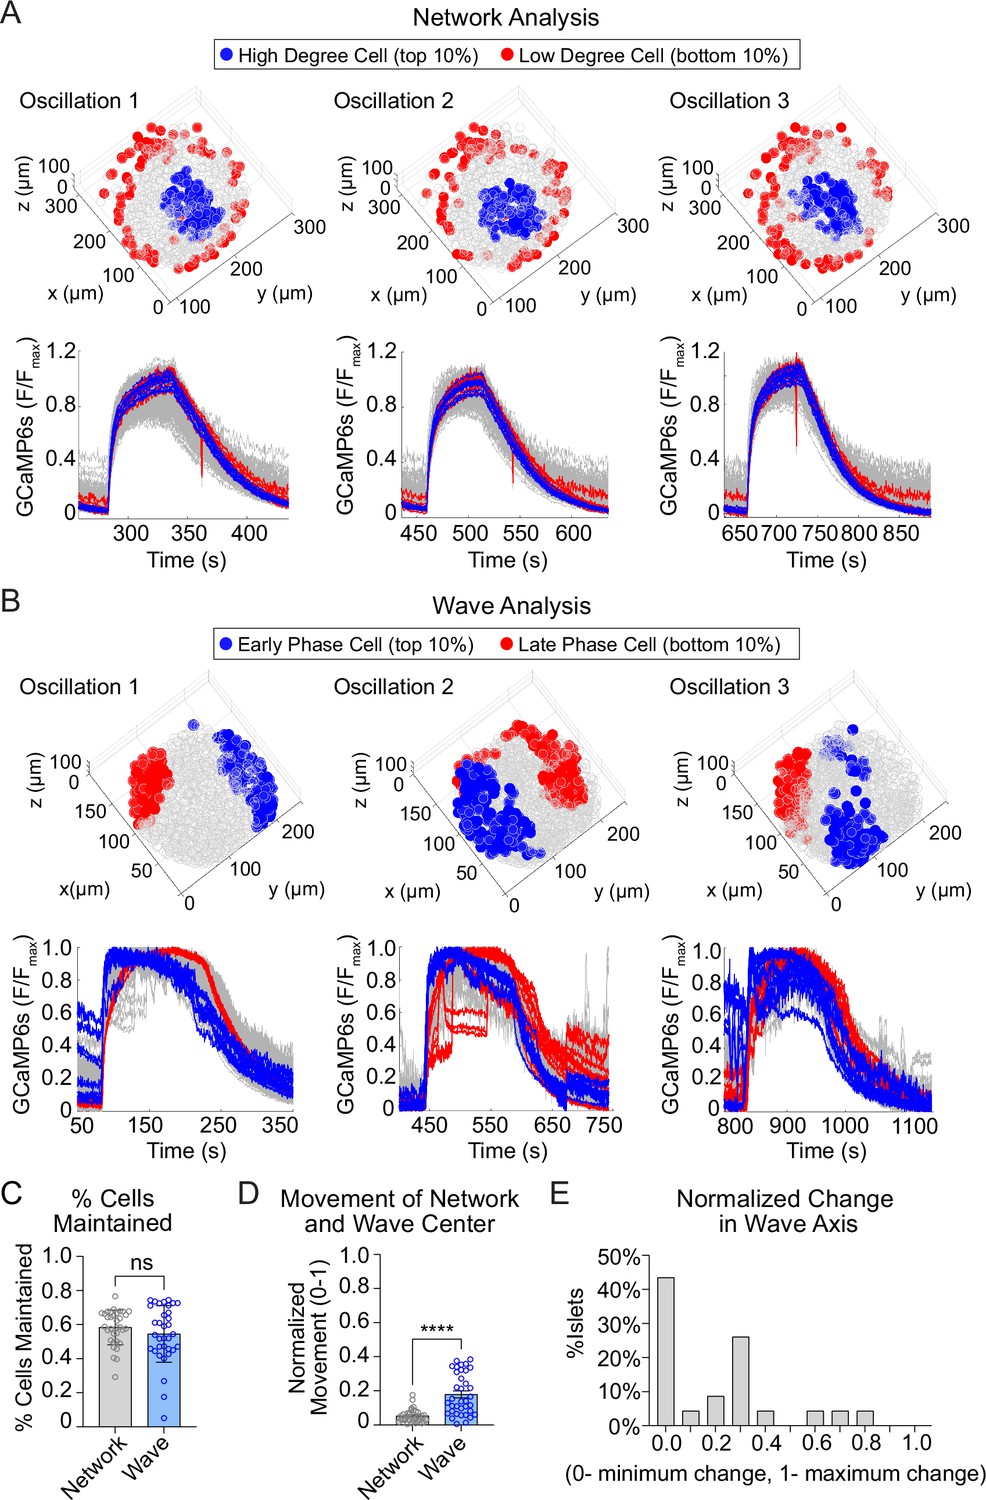
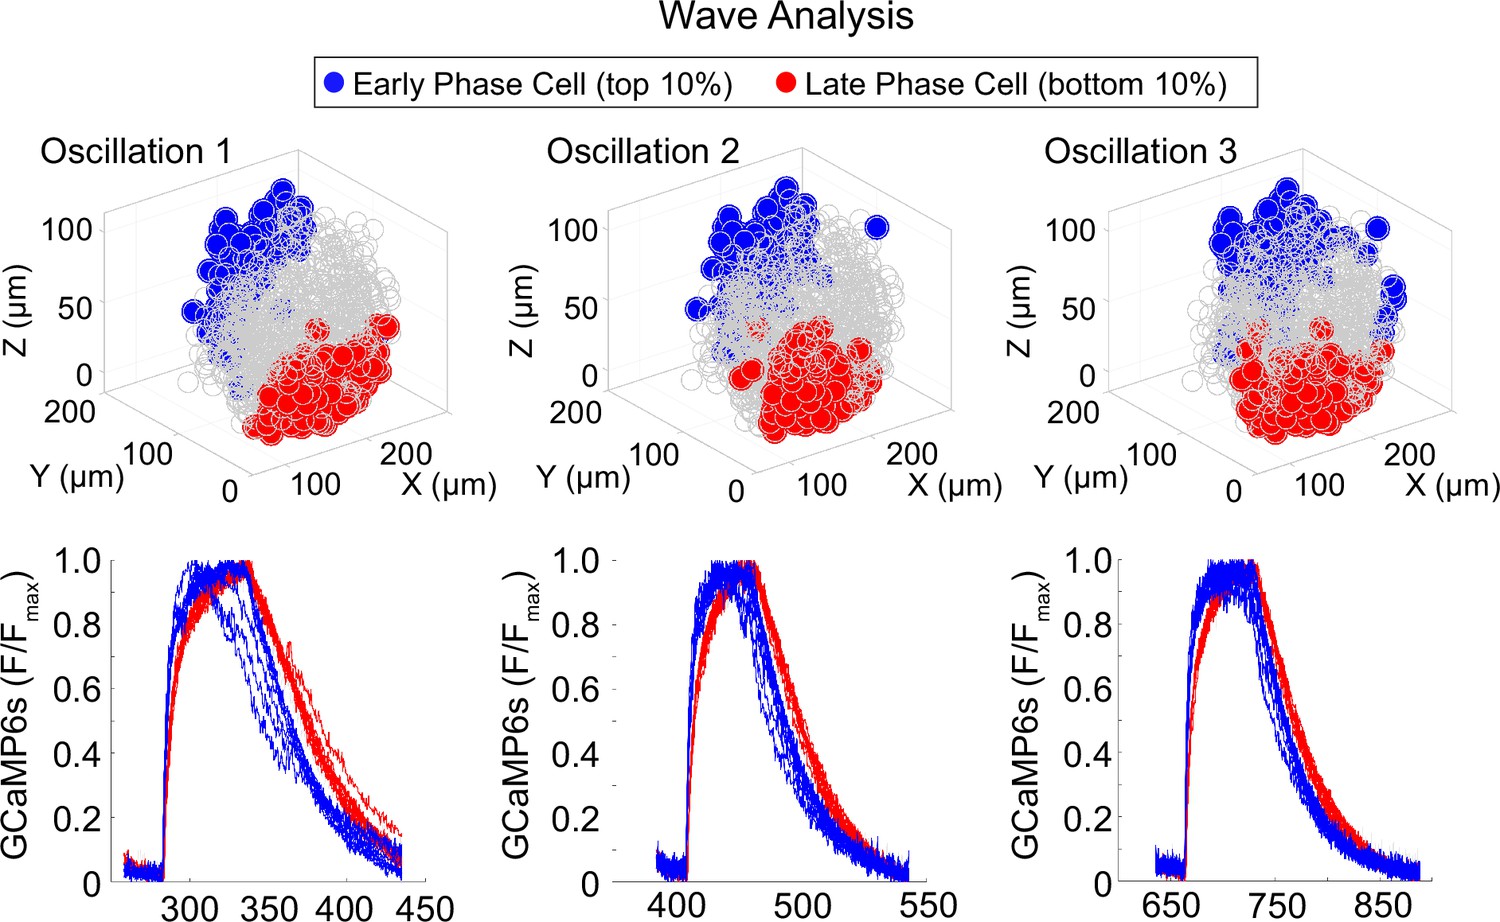
The network of highly synchronized β-cells is consistent between oscillations, while the Ca2+ wave axis rotates.
(A) Three-dimensional (3D) representation of the islet showing the location of high degree cells (blue) and low degree cells (red) over three consecutive oscillations (top panel) and their corresponding Ca2+ traces (bottom panel). (B) 3D representation of the islet showing the location of early phase cells (blue) and late phase cells (red) over three consecutive oscillations (top panel) and their corresponding Ca2+ traces (bottom panel). (C) Quantification of the retention rate of high degree and early phase cells. (D) Relative spatial change in the center of gravity of β-cell network versus the β-cell Ca2+ wave. (E) Frequency distribution showing the normalized change in Ca2+ wave axis for all islets. Data are displayed as mean ± SEM. ****p < 0.0001 by normality test followed by Paired Student’s t-test or Wilcoxon Signed-Rank Test.
-
Figure 3—source data 1
Source data for % cells maintained, movement of network/wave center and wave axis change analysis.
- https://cdn.elifesciences.org/articles/103068/elife-103068-fig3-data1-v1.xlsx
Figure 3—figure supplement 1
Location of early and late phase cells in an islet with stable wave axis.
Three-dimensional (3D) representation of the islet showing the location of early phase cells (blue) and late phase cells (red) over three consecutive oscillations (top panel) and their corresponding Ca2+ traces (bottom panel).
Figure 4
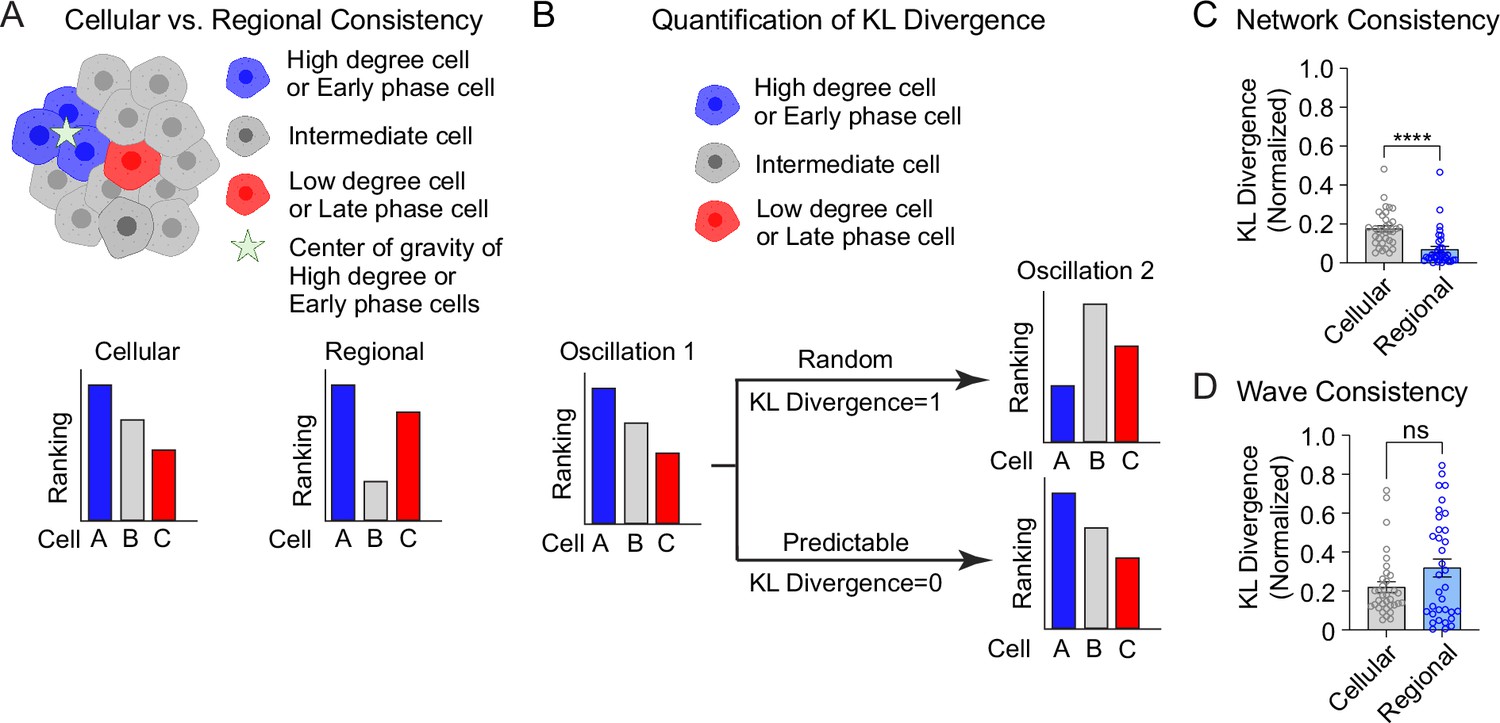
Cellular and regional consistency of the β-cell network and Ca2+ wave quantified by Kullback–Leibler (KL) divergence.
(A) Schematic showing cellular and regional consistency analyses. (B) Schematic depicting the use of KL divergence to determine consistency between consecutive oscillations. Every β-cell in the islet is ranked, with near-zero KL divergence values indicating high consistency between oscillations and near-unity KL divergence indicating randomness. Comparison of cellular versus regional consistency of the network (C) and wave (D) by KL divergence. Data are displayed as mean ± SEM. ****p < 0.0001 by normality test followed by Paired Student’s t-test or Wilcoxon Signed-Rank Test.
-
Figure 4—source data 1
Source for network and wave consistency analysis.
- https://cdn.elifesciences.org/articles/103068/elife-103068-fig4-data1-v1.xlsx
Figure 5
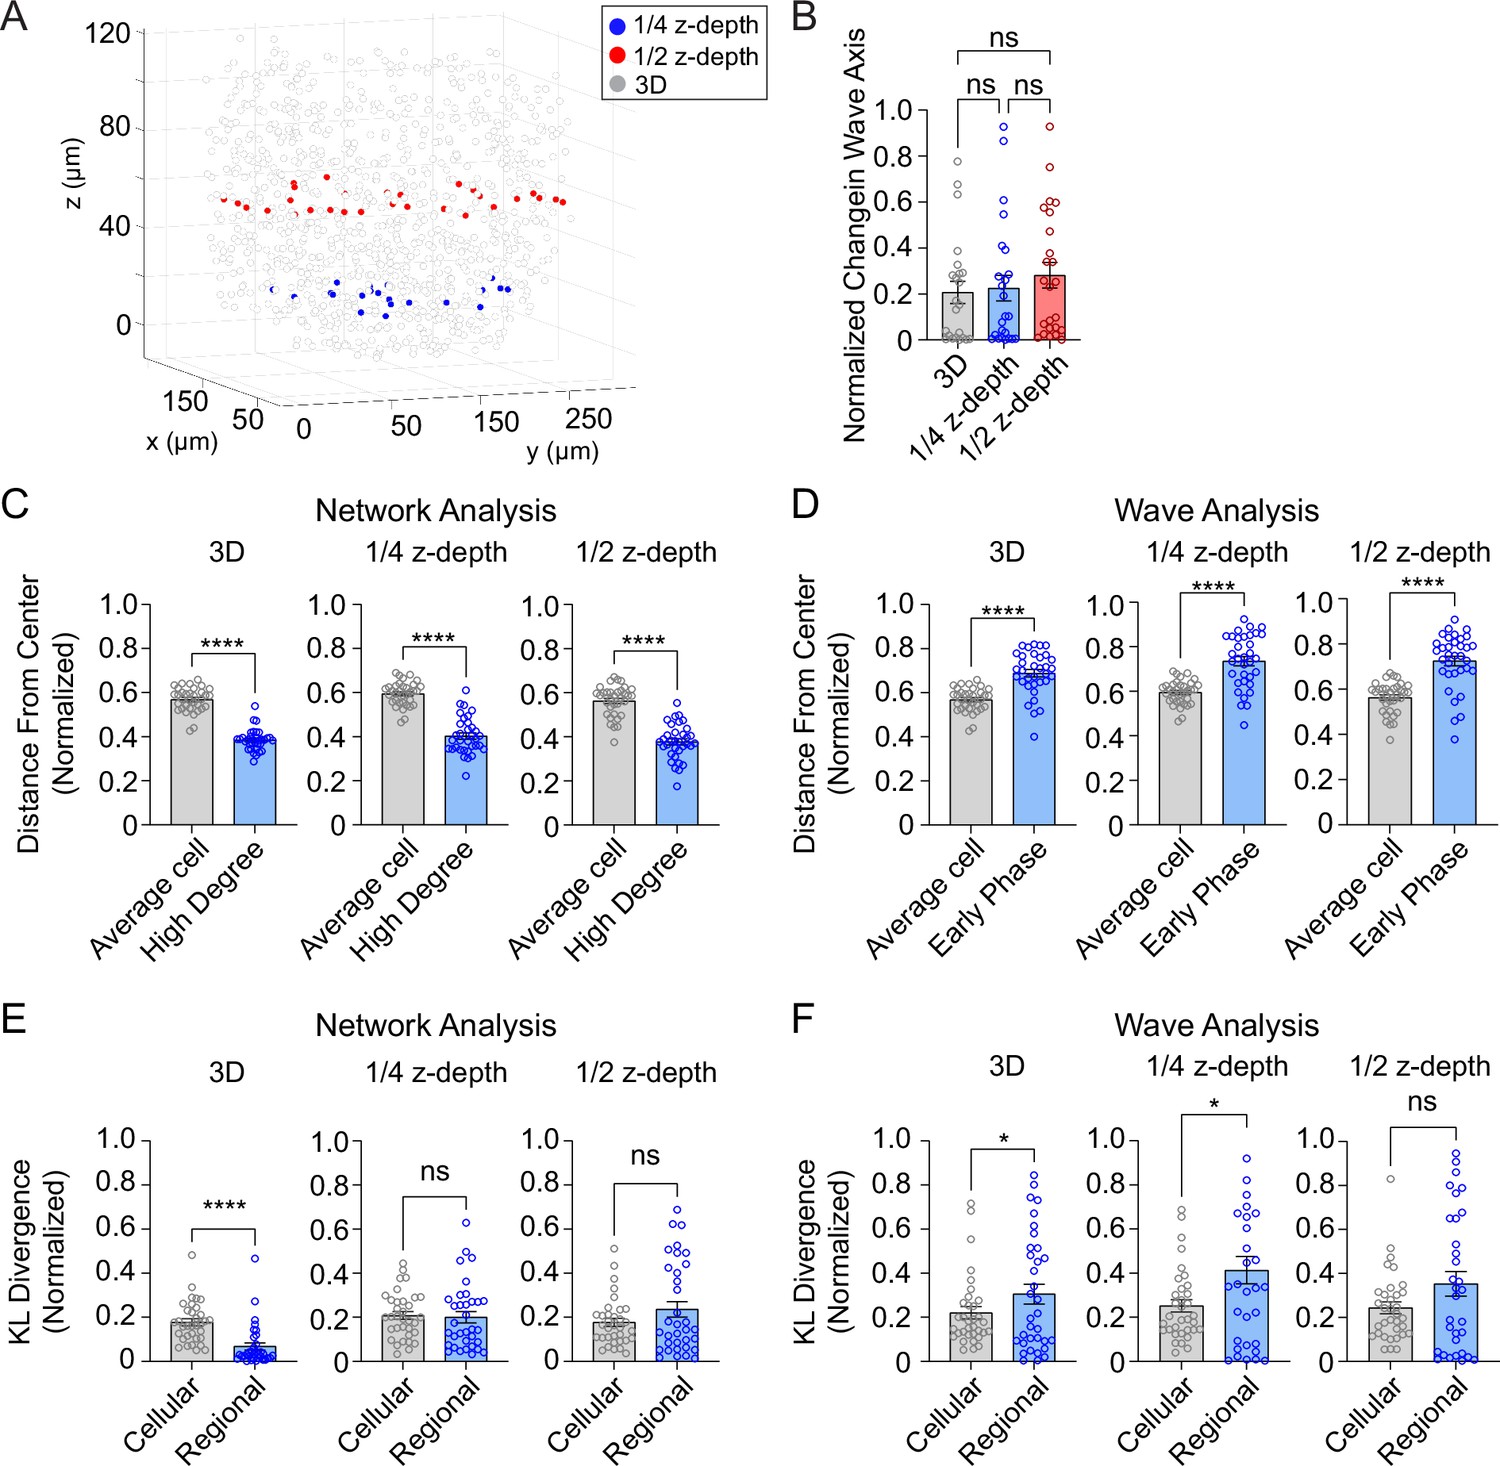
Three-dimensional (3D) analysis is more robust than two-dimensional (2D) analysis.
(A) Example islet showing the locations of the ¼-depth (red) and ½-depth (blue) 2D planes used for analysis. (B) Comparison of wave axis change from 2D and 3D analyses. (C) Comparison of distance from center for average and high degree cells based on either 3D (left panel) or 2D planes (middle and right panels). (D) Comparison of distance from center for average and early phase cells based on either 3D (left panel) or 2D planes (middle and right panels). (E, F) Comparison of cellular and regional consistency of the network (E) and Ca2+ wave (F) based on either 3D (left panel) or 2D planes (middle and right panels). Data are displayed as mean ± SEM. *p < 0.05, ****p < 0.0001 by normality test followed by parametric or non-parametric one-way ANOVA (B) or Student’s t-test or Wilcoxon Signed-Rank Test (C–F).
-
Figure 5—source data 1
Source data for 3D and 2D analysis comparison.
- https://cdn.elifesciences.org/articles/103068/elife-103068-fig5-data1-v1.xlsx
Figure 6
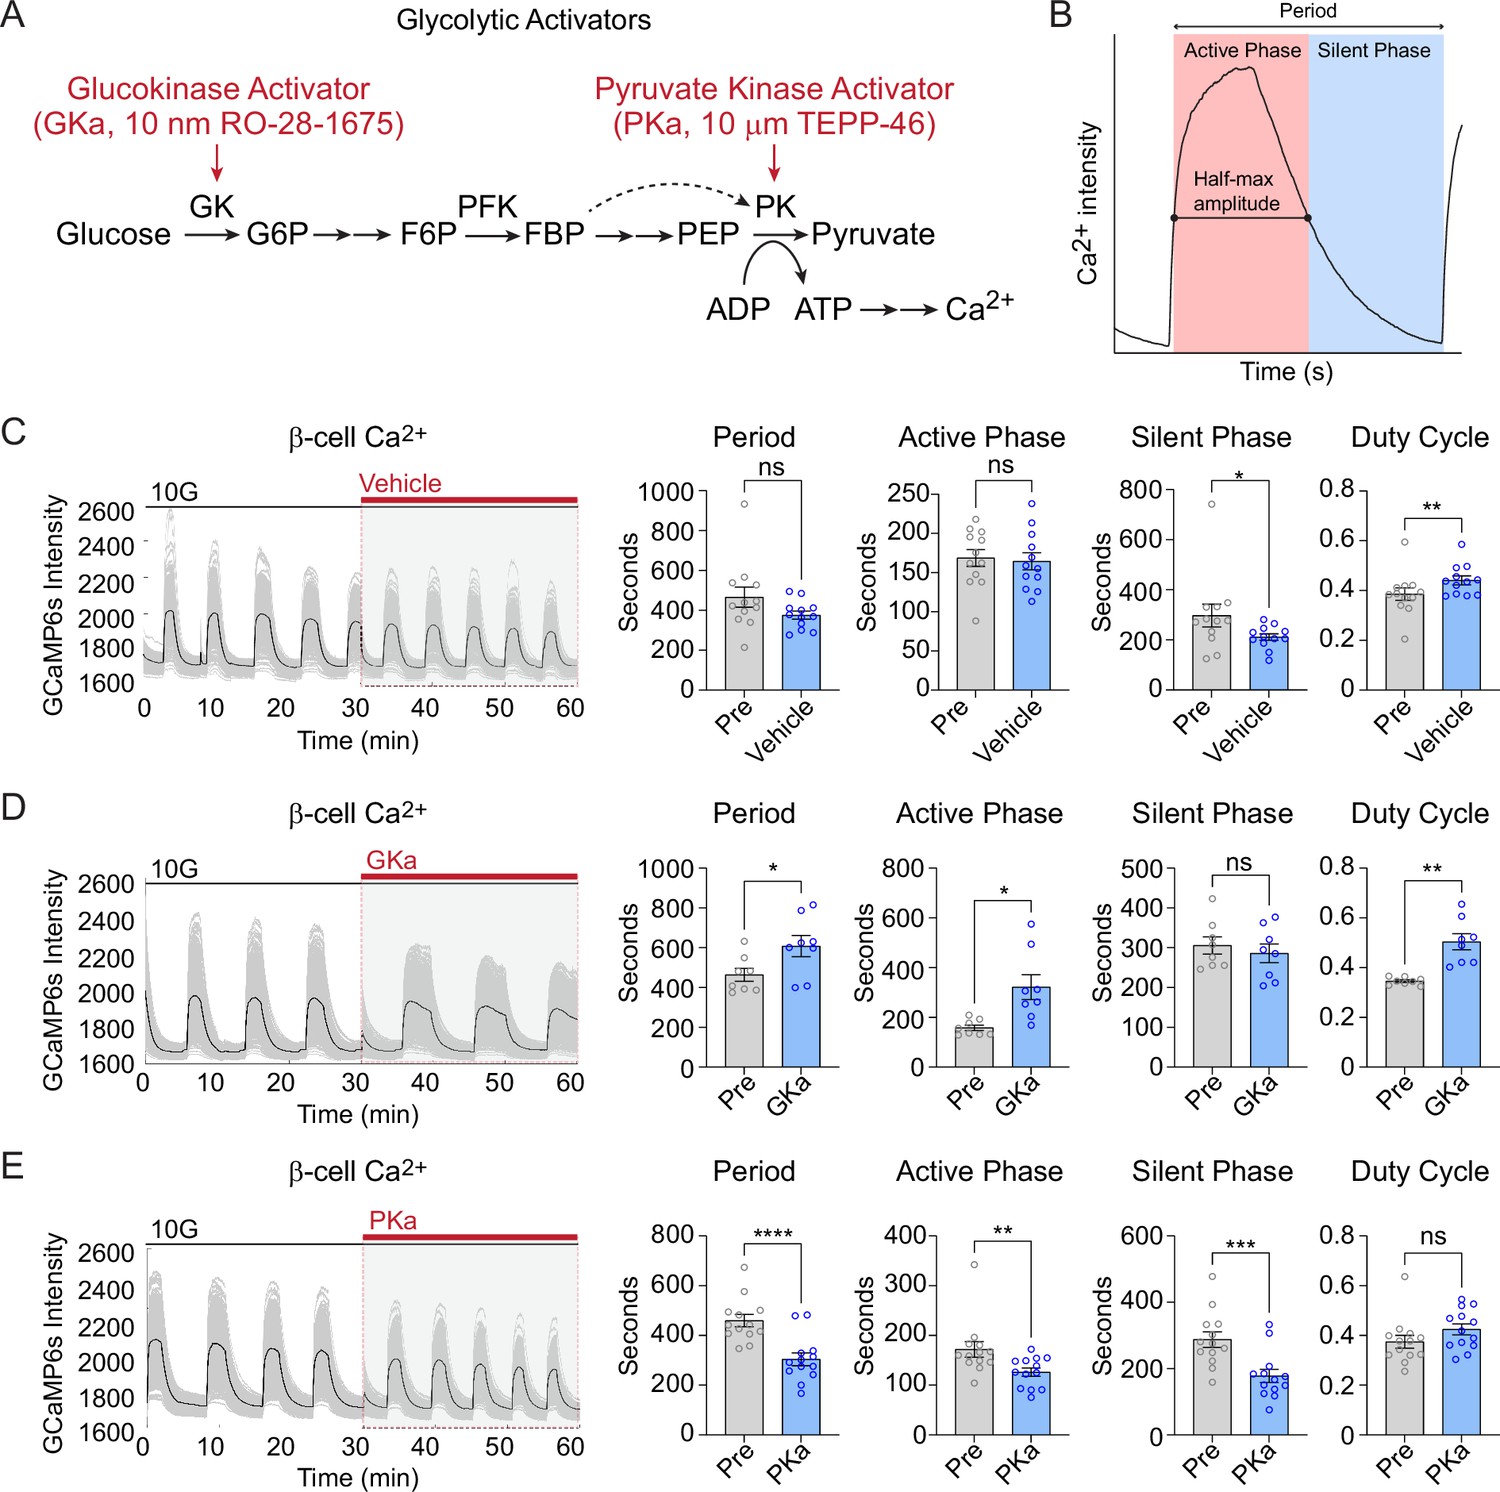
Effect of glycolytic activators on β-cell oscillations.
(A) Schematic of glycolysis showing the targets of glucokinase activator (GKa) and pyruvate kinase activator (PKa). (B) Illustration indicating the oscillation period, active phase duration, silent phase duration, and duty cycle (active phase/period) calculated at half-maximal Ca2+. Sample traces and comparison of period, active phase duration, silent phase duration, and duty cycle before and after vehicle (0.1% DMSO) (n = 11,284 cells, 13 islets, 7 mice) (C), GKa (50 nM RO-28-1675) (n = 6871 cells, 8 islets, 7 mice) (D), and PKa (n = 10,700 cells, 13 islets, 7 mice) (10 µM TEPP-46) (E). Data are displayed as mean ± SEM. *p < 0.05, **p < 0.01, ***p < 0.001, ****p < 0.0001 normality test followed by Paired Student’s t-test or Wilcoxon Signed-Rank Test.
-
Figure 6—source data 1
Source data for period, active phase, silent phase and duty cycle analysis.
- https://cdn.elifesciences.org/articles/103068/elife-103068-fig6-data1-v1.xlsx
Figure 7 with 2 supplements
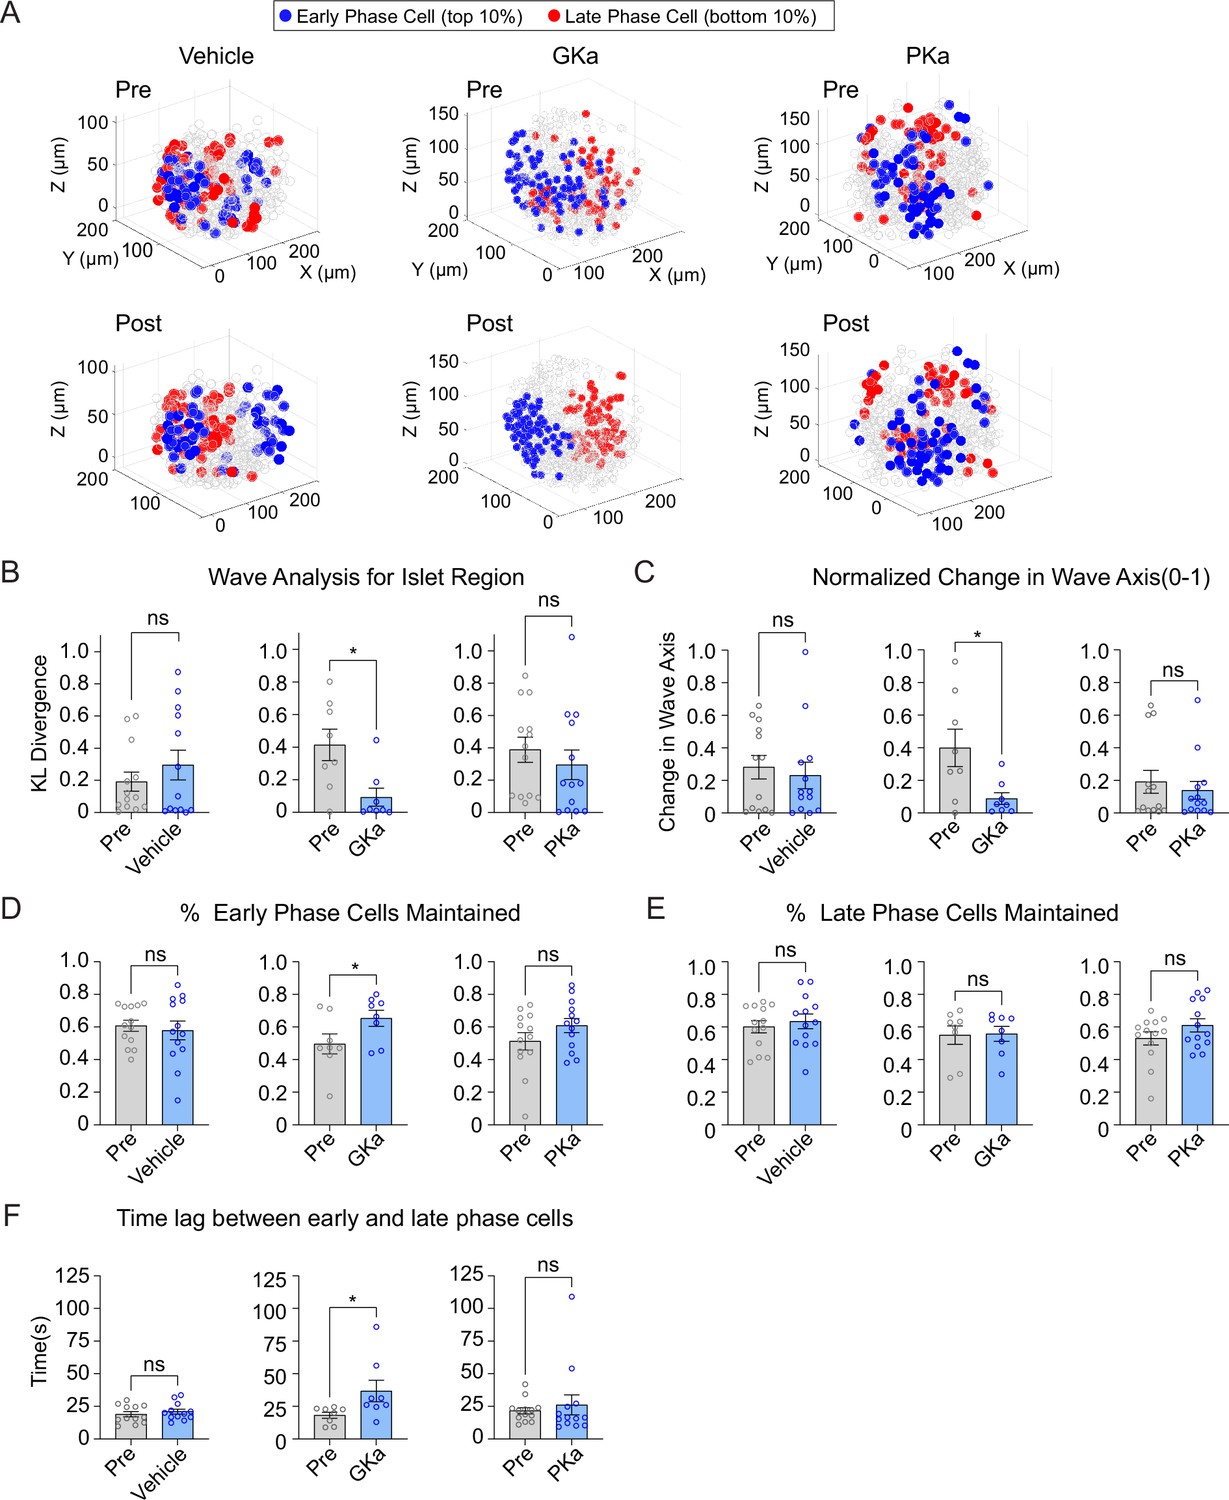
Glucokinase activity determines the origin of Ca2+ waves in three-dimensional (3D) space.
(A) Illustrations showing the location change of early phase cells (blue) and late phase cells (red) before and after vehicle (left panel), GKa (middle panel), and PKa (right panel). Effect of vehicle, GKa, and PKa on regional consistency of the Ca2+ wave (B), wave axis change (C), early phase cell retention (D), late phase cell retention (E), and the time lag between early and late phase cells (F). Data are displayed as mean ± SEM. *p < 0.05 by Student’s t-test.
-
Figure 7—source data 1
Source data for islet region, wave axis, % early/late phase cells maintained and time lag.
- https://cdn.elifesciences.org/articles/103068/elife-103068-fig7-data1-v1.xlsx
Figure 7—figure supplement 1
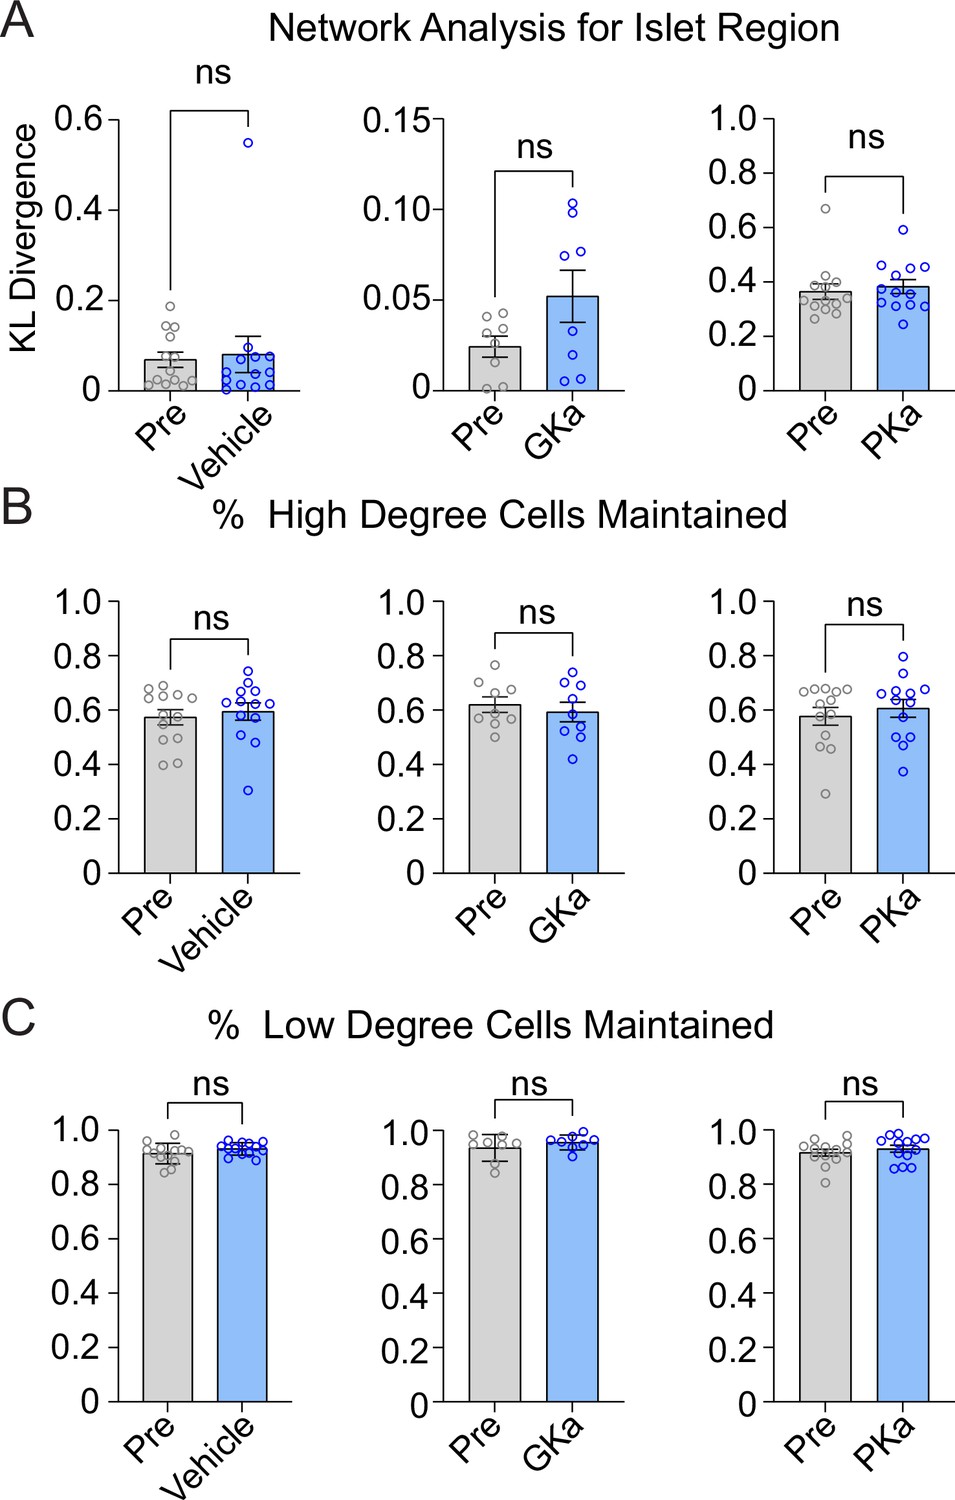
Effect of glycolytic activators on the β-cell network.
Effect of vehicle, glucokinase activator (GKa), and pyruvate kinase activator (PKa) on regional consistency of the β-cell network (A), high degree cell retention (B), and low degree cells retention (C). Data are displayed as mean ± SEM. *p < 0.05 by Student’s t-test.
-
Figure 7—figure supplement 1—source data 1
Source data for islet region, % high/low degree cells maintained.
- https://cdn.elifesciences.org/articles/103068/elife-103068-fig7-figsupp1-data1-v1.xlsx
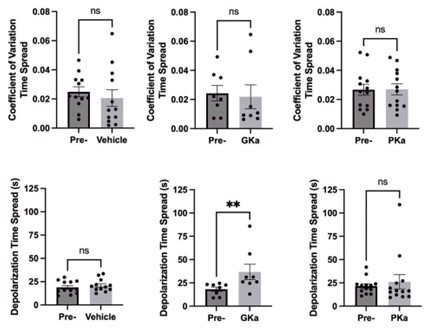
Figure 7—figure supplement 2
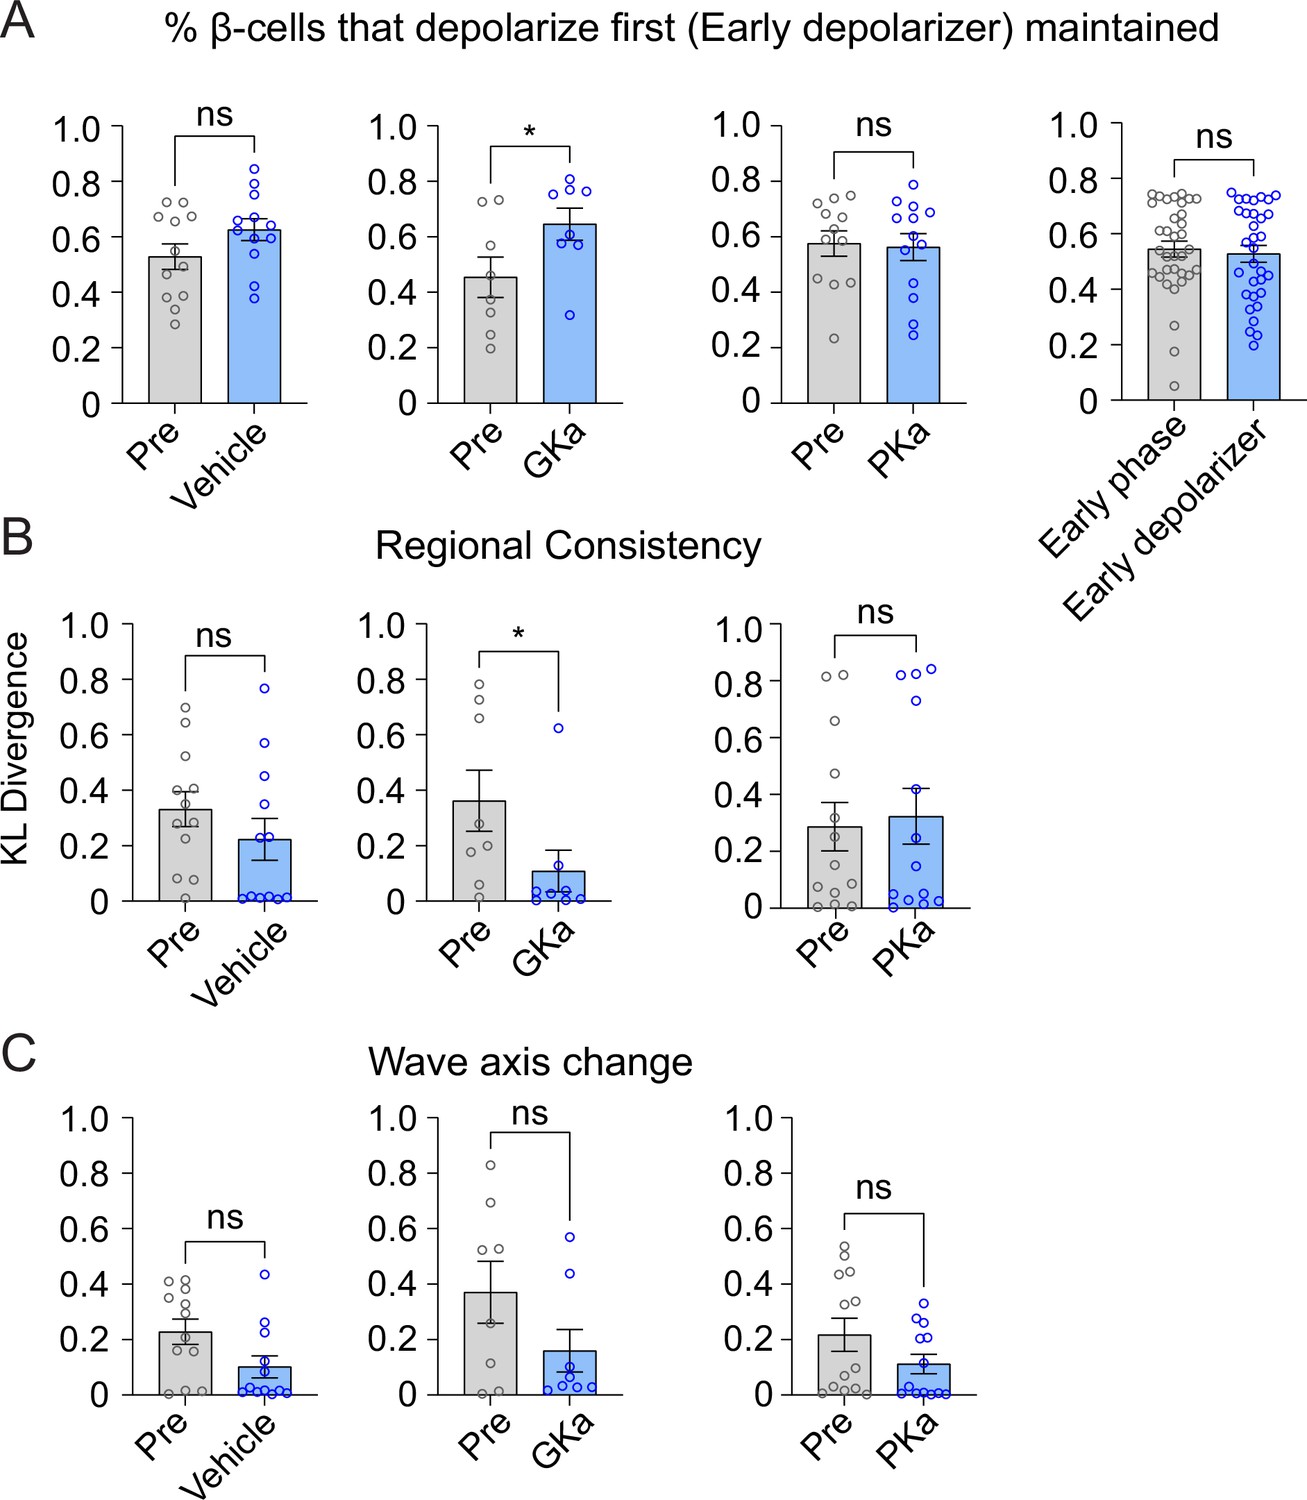
Effect of glycolytic activators on the β-cells that depolarize first.
Effect of vehicle, glucokinase activator (GKa), and pyruvate kinase activator (PKa) on the retention (A), regional consistency (B), and wave axis change (C) of the β-cells that depolarize first (Early depolarizer). The retention of β-cells that depolarize first (Early depolarizer) is similar to cells that depolarize and repolarize first (Early phase). Data are displayed as mean ± SEM. *p < 0.05 by Student’s t-test.
-
Figure 7—figure supplement 2—source data 1
Source data for % early depolarizer maintained, regional consistency and wave axis change.
- https://cdn.elifesciences.org/articles/103068/elife-103068-fig7-figsupp2-data1-v1.xlsx
Author response image 1
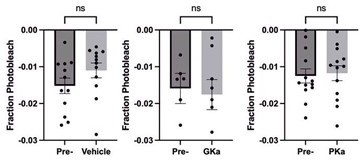
Author response image 2
Additional files
-
MDAR checklist
- https://cdn.elifesciences.org/articles/103068/elife-103068-mdarchecklist1-v1.pdf
-
Source data 1
Raw data for single cell traces (10G 1/3).
- https://cdn.elifesciences.org/articles/103068/elife-103068-data1-v1.zip
-
Source data 2
Raw data for single cell traces (10G 2/3).
- https://cdn.elifesciences.org/articles/103068/elife-103068-data2-v1.zip
-
Source data 3
Raw data for single cell traces (10G 3/3).
- https://cdn.elifesciences.org/articles/103068/elife-103068-data3-v1.zip
-
Source data 4
Raw data for single cell traces (10G-10GGKa 1/2).
- https://cdn.elifesciences.org/articles/103068/elife-103068-data4-v1.zip
-
Source data 5
Raw data for single cell traces (10G-10GGKa 2/2).
- https://cdn.elifesciences.org/articles/103068/elife-103068-data5-v1.zip
-
Source data 6
Raw data for single cell traces (10G-10GPKa 1/3).
- https://cdn.elifesciences.org/articles/103068/elife-103068-data6-v1.zip
-
Source data 7
Raw data for single cell traces (10G-10GPKa 2/3).
- https://cdn.elifesciences.org/articles/103068/elife-103068-data7-v1.zip
-
Source data 8
Raw data for single cell traces (10G-10GPKa 3/3).
- https://cdn.elifesciences.org/articles/103068/elife-103068-data8-v1.zip
Download links
A two-part list of links to download the article, or parts of the article, in various formats.
Downloads (link to download the article as PDF)
Open citations (links to open the citations from this article in various online reference manager services)
Cite this article (links to download the citations from this article in formats compatible with various reference manager tools)
Glucokinase activity controls peripherally located subpopulations of β-cells that lead islet Ca2+ oscillations
eLife 13:RP103068.
https://doi.org/10.7554/eLife.103068.3


