FtsK is critical for the assembly of the unique divisome complex of the FtsZ-less Chlamydia trachomatis
- Department of Microbiology, Immunology, and Biochemistry. University of Tennessee Health Science Center, United States
- Department of Pathology, Microbiology, and Immunology, University of Nebraska Medical Center, United States
- Department of Microbiology, Immunology, and Molecular Genetics, University of Texas Health San Antonio, United States
Figures
Figure 1 with 1 supplement
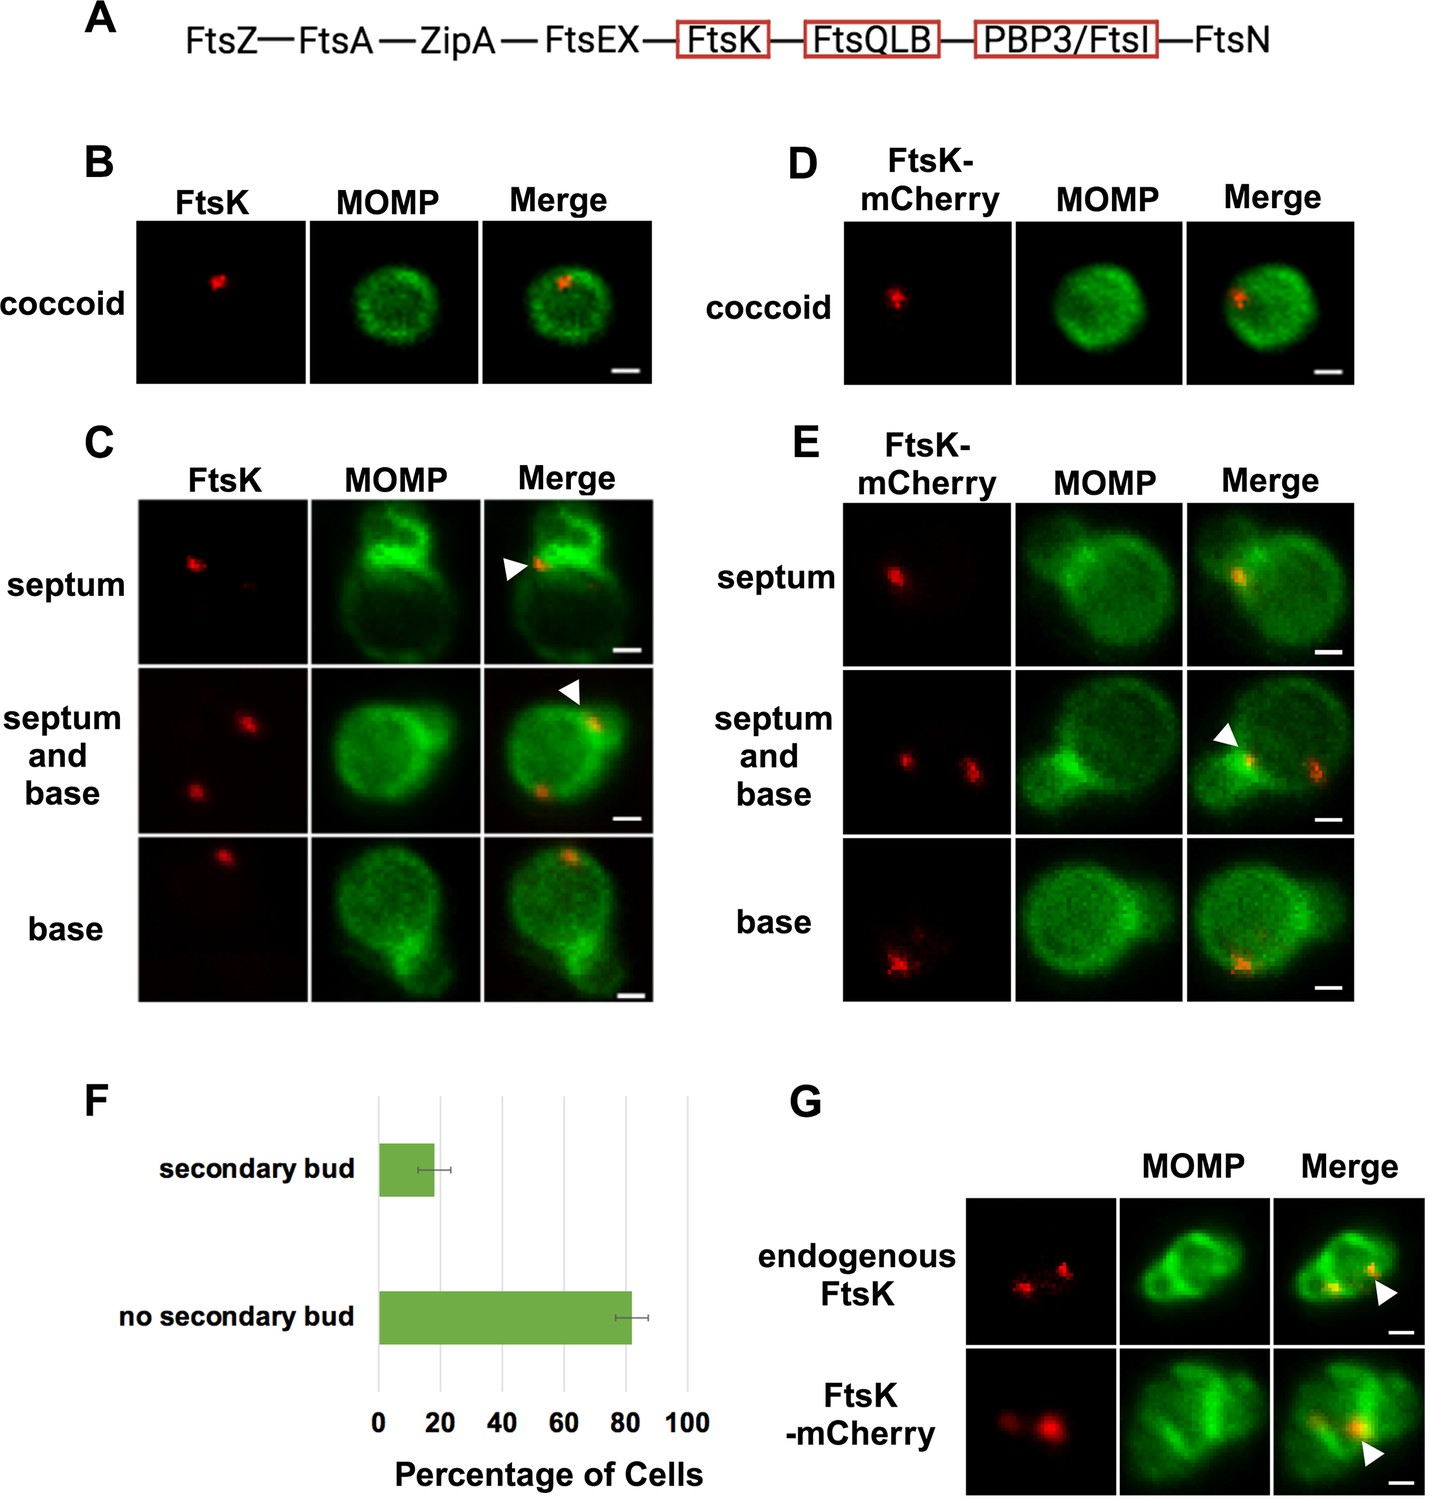
Localization of FtsK and FtsK-mCherry in coccoid cells and in dividing Ct.
(A) The linear divisome assembly pathway of E. coli is shown. Chlamydia trachomatis (Ct) encodes the divisome proteins boxed in red. HeLa cells were infected with Ct L2 and reticulate bodies (RBs) were prepared at 21 hpi. The cells were fixed and stained with major outer membrane protein (MOMP) (green) and FtsK (red) antibodies. The distribution of FtsK in (B) coccoid cells and in (C) cell division intermediates that had not initiated secondary bud formation is shown. Bars are 1 μm. HeLa cells were infected with Ct transformed with the pBOMB4 -Tet (-GFP) plasmid encoding FtsK-mCherry. The fusion was induced with 10 nM aTc for 1 hr. and RBs were prepared from infected HeLa cells at 21 hpi and stained with MOMP antibodies (green). The distribution of MOMP relative to the mCherry fluorescence (D) in coccoid cells and in (E) cell division intermediates that had not initiated secondary bud formation is shown. Bars are 1 μm. Arrowheads in C and E denote foci of FtsK above or below the MOMP-stained septum. (F) HeLa cells were infected with Ct L2. At 21 hpi, the cells were harvested and RBs were stained with MOMP antibodies. The number of dividing cells that had initiated secondary bud formation was quantified in 150 cells. Three independent replicates were performed, and the values shown are the average of the three replicates. (G) Endogenous FtsK and FtsK-mCherry accumulate in foci at the septum of secondary buds (marked with arrowheads).
Figure 1—figure supplement 1
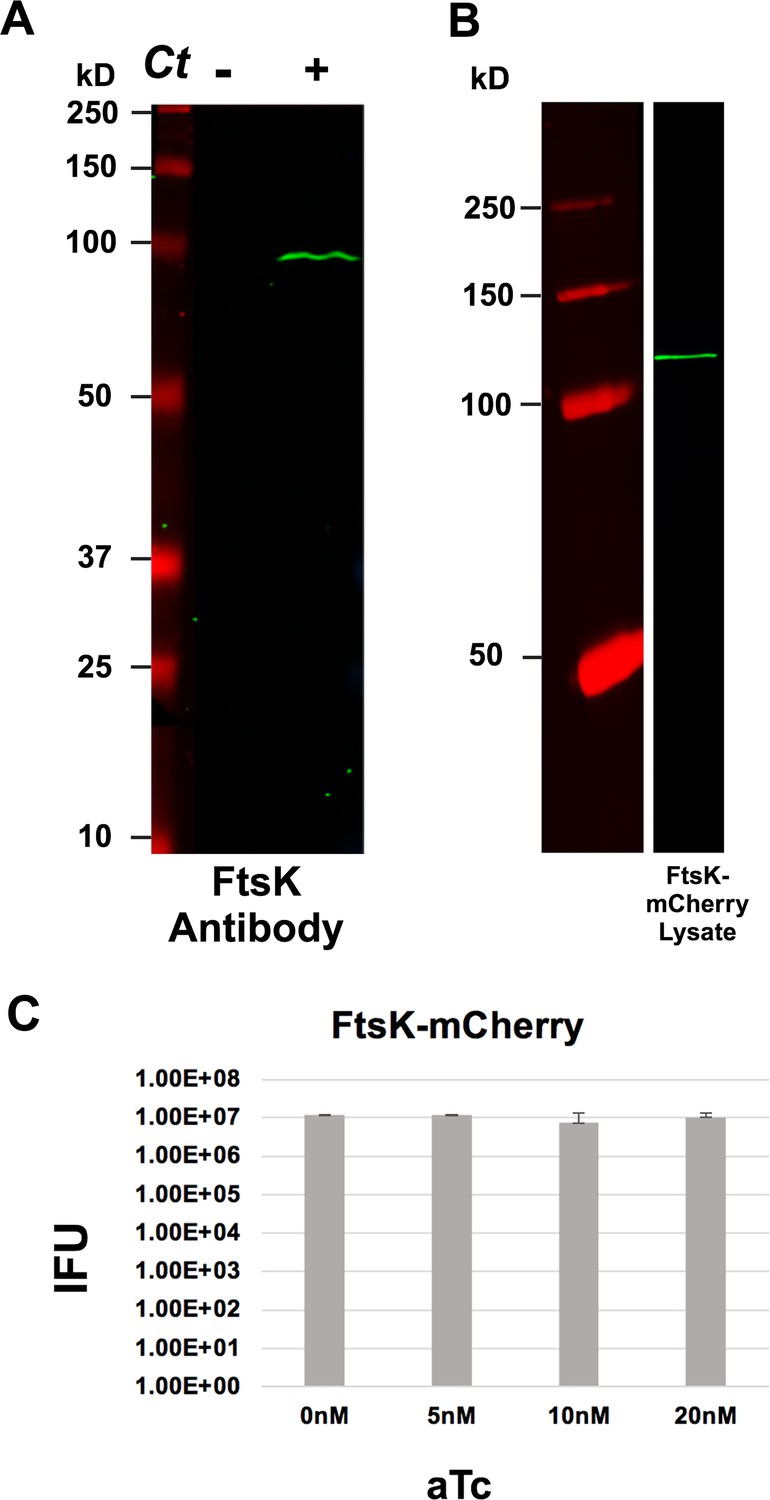
Blotting analysis of endogenous FtsK and FtsK-mCherry, and the effect of FtsK-mCherry overexpression on the production of infectious Ct.
(A) Lysates were prepared from uninfected HeLa cells and HeLa cells infected with Ct L2. At 21 hpi, lysates were prepared and characterized by immunoblotting with FtsK-specific antibodies. (B) HeLa cells were infected with Ct transformed with FtsK-mCherry (molecular mass - 114,664 Da). The fusion was induced with 10 nM aTc at 17 hpi. HeLa cells were harvested at 21 hpi and a lysate was prepared and characterized by immunoblotting analysis with a rabbit polyclonal mCherry antibodies. (C) HeLa cells were infected with Ct transformed with FtsK-mCherry. The fusion was uninduced or induced by the addition of varying amounts of aTc to the media of the infected cells at 8 hpi. The cells were harvested at 48 hpi and Ct were isolated. The number of infectious Ct in the lysates was measured by an inclusion forming unit (IFU) assay. Chi-squared analysis revealed that induction of FtsK-mCherry did not have a statistically significant effect on the growth of Ct and the production of infectious elementary bodies (EBs).
Figure 2 with 5 supplements
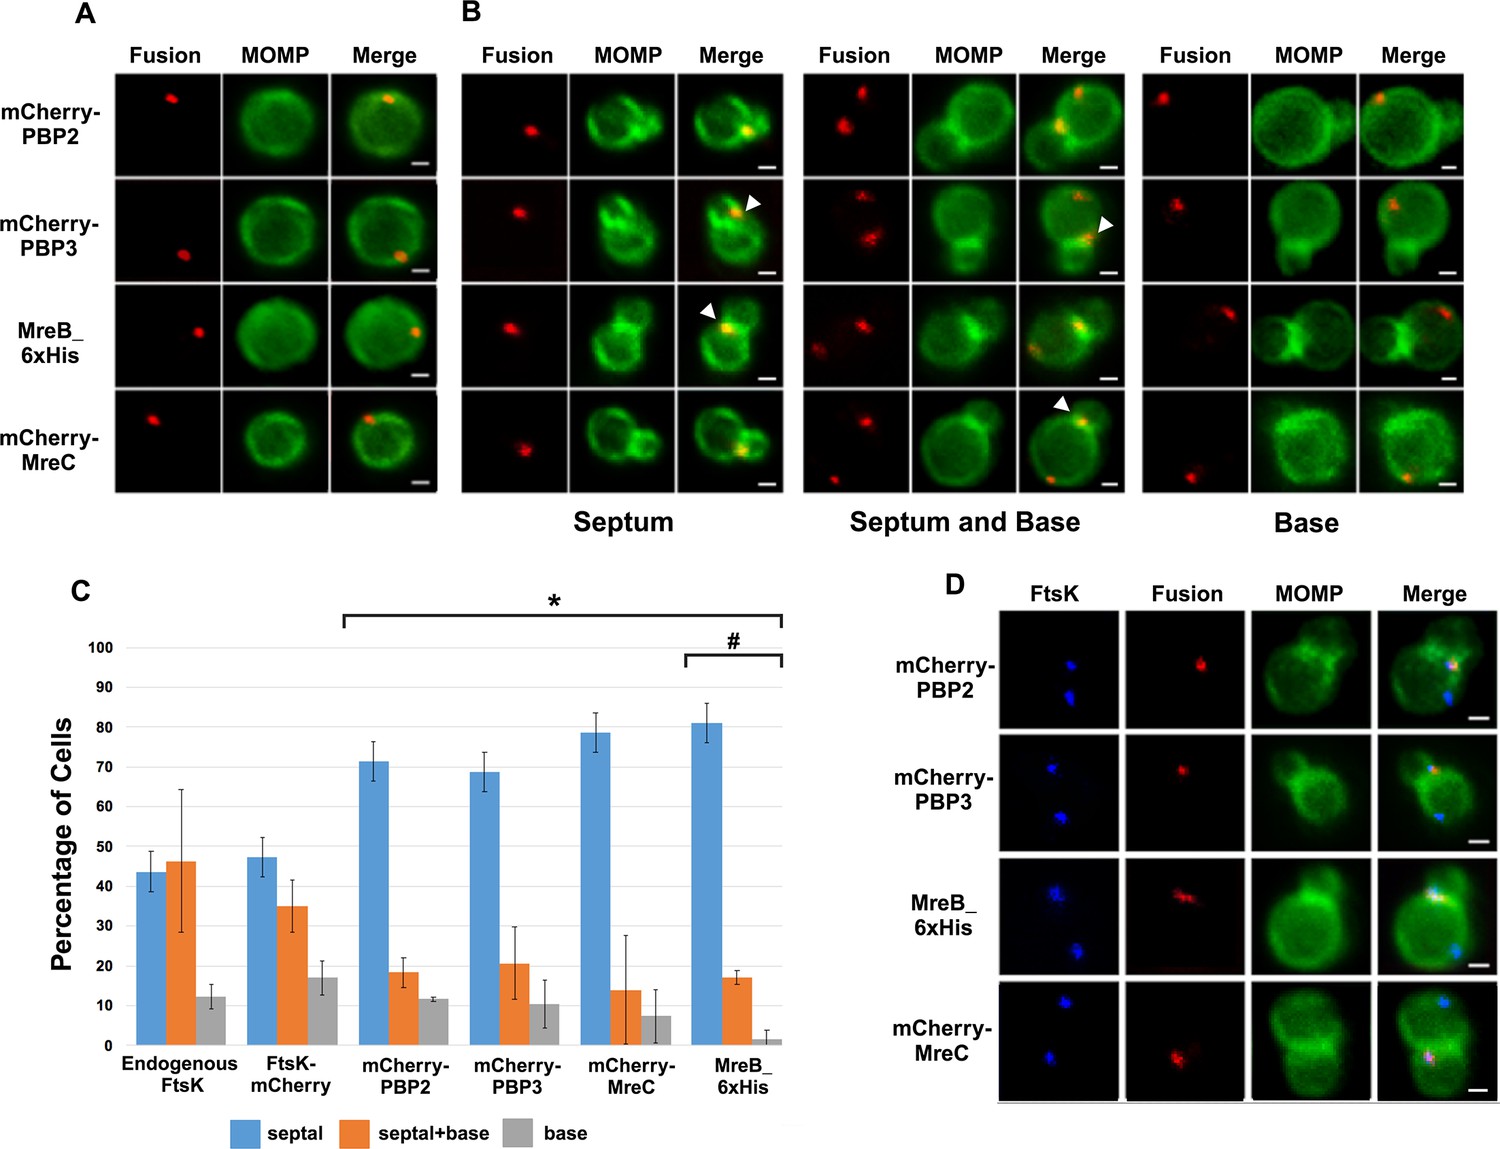
Localization of the fusions of PBP2, PBP3, MreC, and MreB in Ct and a comparison of their localization to the localization of endogenous FtsK.
HeLa cells were infected with Ct transformed with PBP2, PBP3, or MreC with an N-terminal mCherry tag, or with Ct transformed with a MreB_6xHis fusion (Lee, 2020). Each of the fusions was induced by adding 10 nM aTc to the media at 17 hpi. Lysates were prepared at 21 hpi and the cells were fixed and stained with a major outer membrane protein (MOMP) antibody. The distribution of the mCherry fluorescence in (A) coccoid cells and in (B) dividing cells that had not initiated secondary bud formation is shown. Cells expressing the MreB_6xHis fusion were stained with rabbit anti-6x His antibody (red) and MOMP antibodies (green). Dividing cells with foci at the septum, foci at the septum, and foci at the base of the mother cell, or foci at the base alone are shown for each of the fusions. Arrowheads in B denote foci of the divisome proteins above or below the plane of the MOMP-stained septum. (C) HeLa cells were infected with Ct L2. Alternatively, cells were infected with Ct that were transformed with FtsK-mCherry, mCherry-PBP2, mCherry-PBP3, mCherry-MreC, or MreB_6xHis. The cells expressing the fusions were induced with aTc for 1.5 hr then fixed at 21 hpi and the distribution of endogenous FtsK, or the mCherry fluorescence in cells inducibly expressing the mCherry fusions, or the distribution of MreB in cells where the MreB_6xHis fusion was inducibly expressed was quantified. A small fraction (2%) of dividing cells contained multiple foci of each of the divisome proteins at the septum and/or the base of the cell. Since these cells were relatively rare, we included these cells with cells that contained a single foci in the quantification. The localization profiles were quantified in 100 cells. Three independent replicates were performed, and the values shown are the average of the three replicates. Chi-squared analysis revealed that the localization profiles of endogenous FtsK and FtsK-mCherry are not statistically different from each other, but they are statistically different than the PBP2, PBP3, MreC, and MreB localization profiles (*p<0.009). The localization profile of the MreB fusion is also statistically different than the localization profiles of the mCherry fusions of PBP2 and PBP3 (#p=0.05). (D) Hela cells were infected with Ct transformed with PBP2, PBP3, or MreC with a N-terminal mCherry tag, or with Ct transformed with an MreB_6xHis fusion (Lee et al., 2020). The fusions were induced by adding 10 nM aTc to the media at 17 hpi. The cells were harvested at 21 hpi and Ct were harvested and stained with FtsK and MOMP antibodies. The cells expressing the MreB fusion were stained with FtsK, MOMP, and 6xHis antibodies. Imaging analyses revealed that FtsK was present in foci at the septum and in foci at the base in these cells, while each of the fusions was only detected at the septum where they overlapped the distribution of septal FtsK (Bars are1 μm).
Figure 2—figure supplement 1
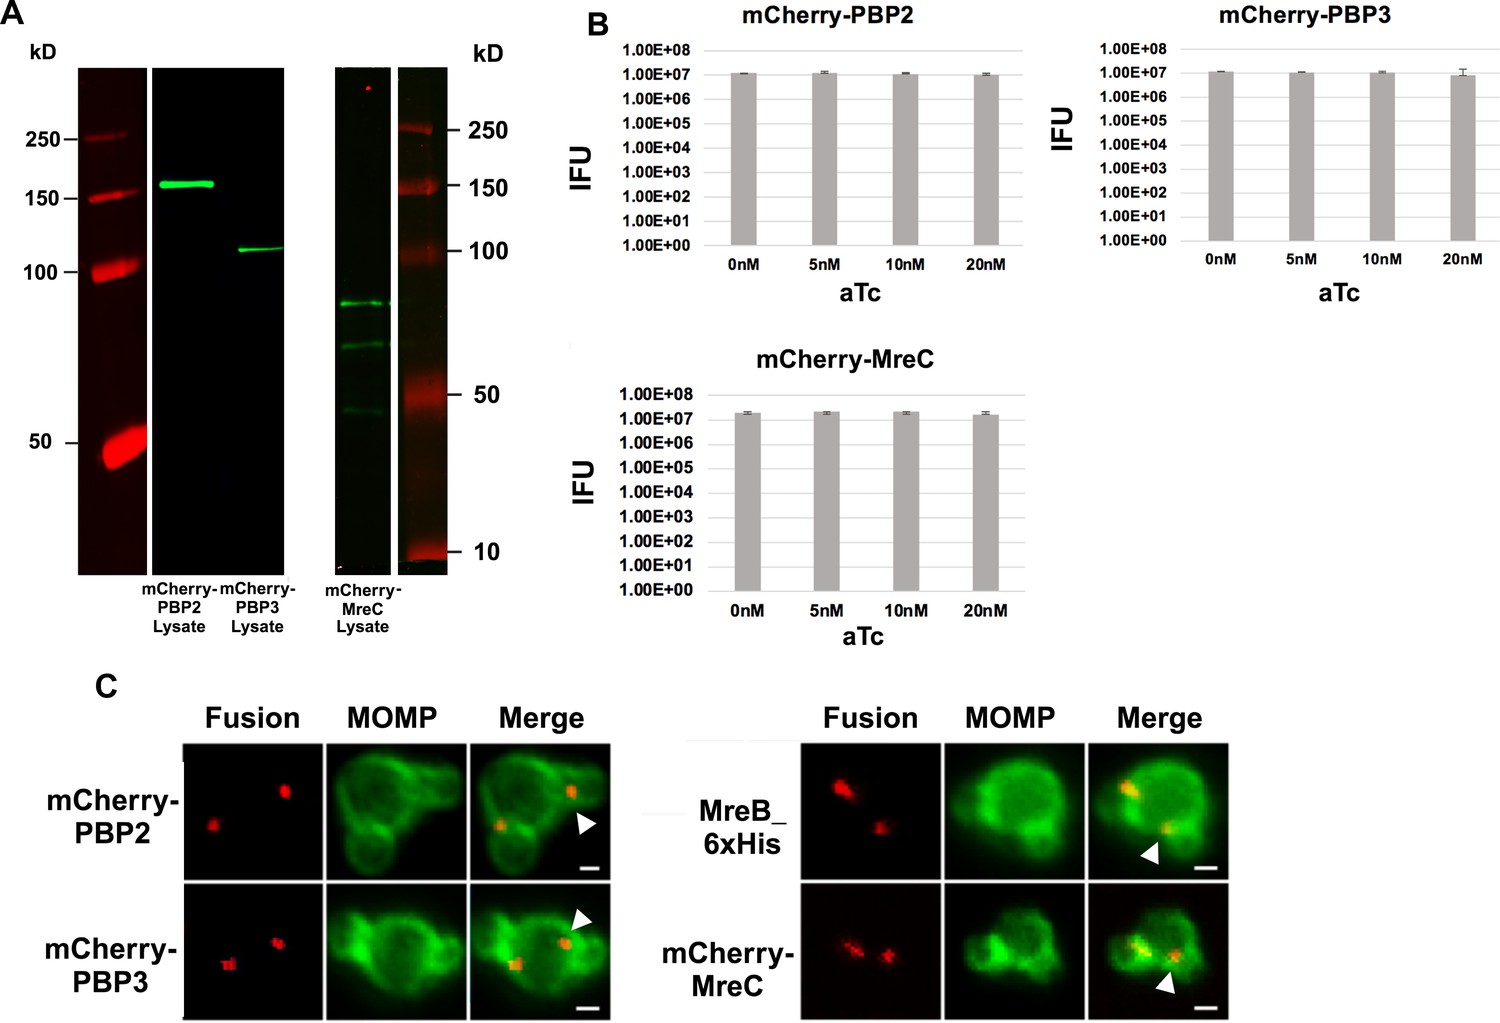
Characterization of the fusions of PBP2, PBP3, MreC and MreB expressed in chlamydial cells.
(A) HeLa cells were infected with Chlamydia trachomatis (Ct) transformed with mCherry-PBP2 (molecular mass - 150,842 Da), mCherry-PBP3 (molecular mass - 100,150 Da), or mCherry-MreC (molecular mass - 63,906 Da).The fusions were induced with 10 nM aTc at 17 hpi. HeLa cells were harvested at 21 hpi and lysates were prepared and characterized by immunoblotting analysis with a rabbit polyclonal mCherry antibodies. (B) HeLa cells were infected with Ct transformed with mCherry-PBP2, mCherry-PBP3, or mCherry-MreC. The fusions were uninduced or induced by the addition of varying amounts of aTc to the media of the infected cells at 8 hpi. The cells were harvested at 48 hpi and Ct were isolated. The number of infectious Ct in the lysates was measured by an inclusion forming unit (IFU) assay. Chi-squared analysis revealed that the induction of mCherry-PBP2, mCherry-PBP3, or mCherry-MreC did not have a statistically significant effect on the growth of Ct and the production of infectious elementary bodies (EBs). (C) HeLa cells were infected with Ct transformed with mCherry-PBP2, mCherry-PBP3, mCherry-MreC, or MreB_6xHis. The fusions were induced with +aTc at17 hpi and the cells were harvested at 21 hpi and imaging analyses revealed that each of the fusions accumulate in foci at the septum and in foci at the base (marked with arrowheads) of dividing cells with secondary buds. Bars are 1 μm.
Figure 2—figure supplement 2
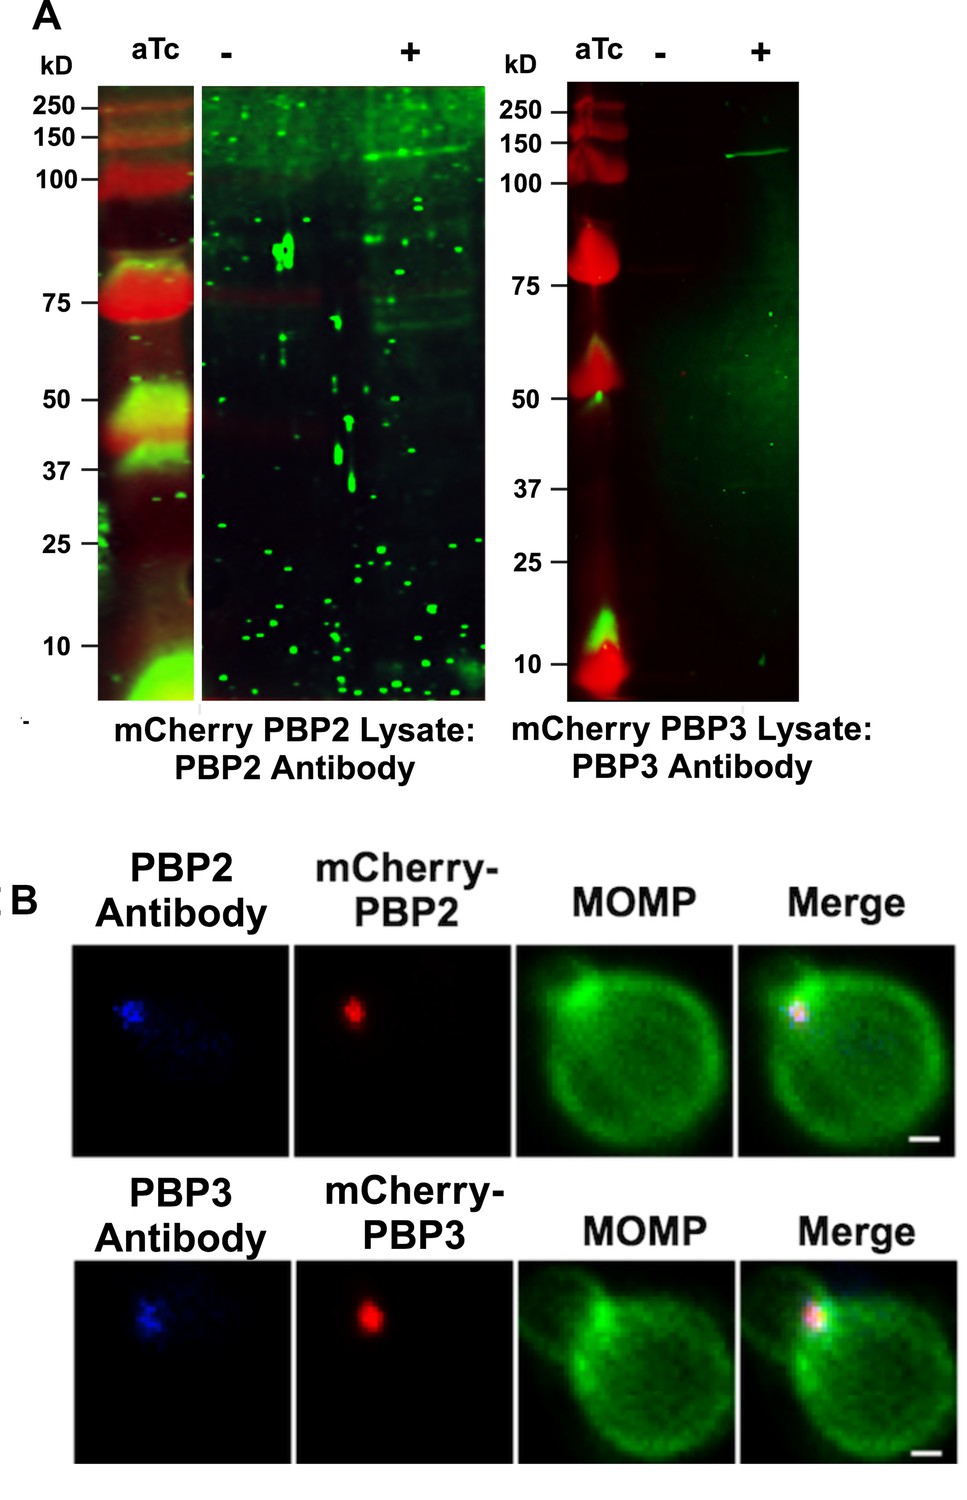
Characterization mCherry-PBP2 and mCherry-PBP3 expressed in Ct.
HeLa cells were infected with Chlamydia trachomatis (Ct) transformed with N-terminal fusions of PBP2 or PBP3. N-terminal fusions of PBP2 or PBP3. The fusions were induced (+aTc) at17 hpi or were uninduced. The induced and uninduced cells were harvested at 21 hpi and lysates were prepared and characterized by immunoblotting analysis with rabbit antibodies raised against peptides derived from chlamydial PBP2 or PBP3. The PBP3 antibody primarily detects a single species with the predicted molecular mass of mCherry-PBP3 in the induced sample. The PBP2 antibody primarily detects a species of ~120 kD in the induced sample, which is smaller than the predicted molecular mass of mCherry-PBP2 (~150 kD). The failure to detect full-length mCherry-PBP2 may be due to the masking of the epitope recognized by the PBP2 antibody by the N-terminal mCherry tag in the full-length protein. (B) HeLa cells were infected with Ct transformed with mCherry-PBP2 or mCherry-PBP3. The fusions were induced by the addition of 10 nM aTc to the media of the infected cells at 19 hpi. Infected cells were harvested at 21 hpi and lysates were prepared and stained with the PBP2 or PBP3 antibodies. The staining with the PBP2 and PBP3 antibodies completely overlaps the mCherry fluorescence from the mCherry-PBP2 and mCherry-PBP3 fusions. (Bars are 3 μm).
Figure 2—figure supplement 3
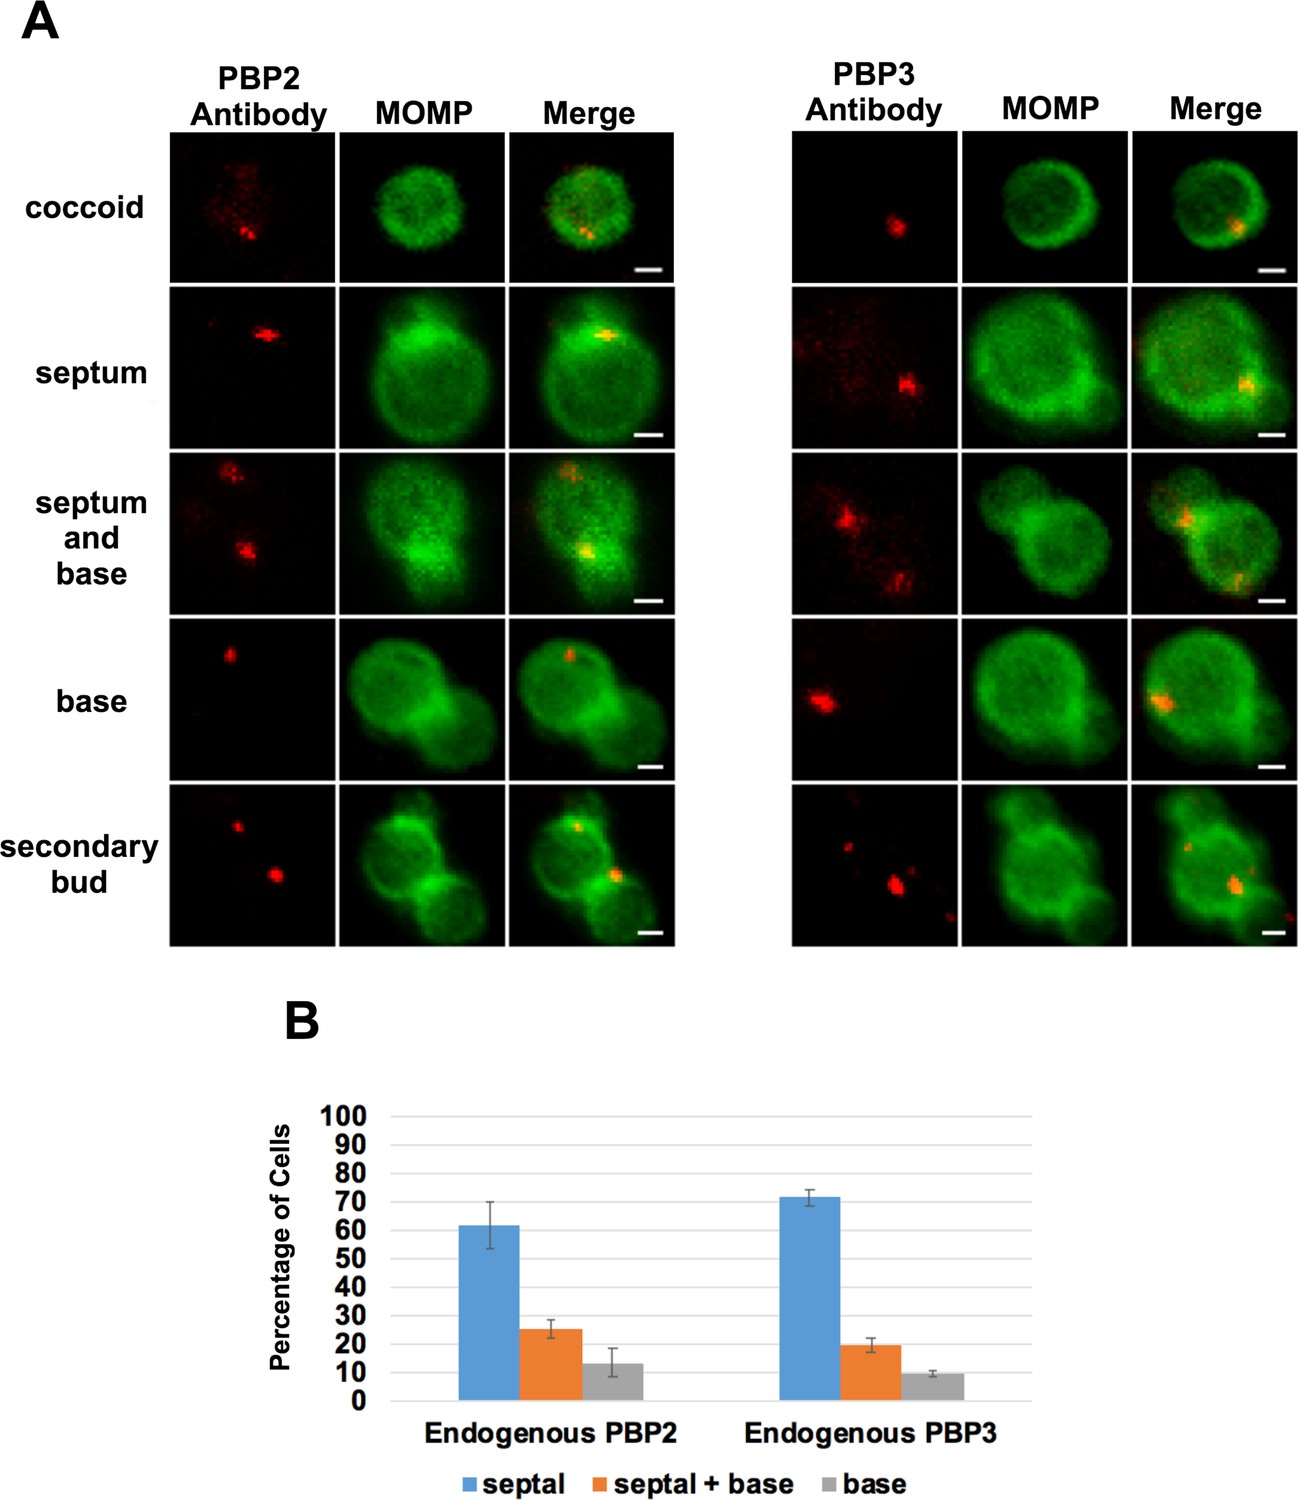
Characterization of endogenous PBP2 and PBP3 localization in coccoid cells and in dividing Ct.
(A) Localization analyses with rabbit polyclonal antibodies that recognize endogenous PBP2 or PBP3. These analyses revealed that endogenous PBP2 and PBP3 accumulate in foci in coccoid cells, and in foci at the septum, foci at the septum and base, or in foci at the base alone in cell division intermediates in Chlamydia trachomatis (Ct). PBP2 and PBP3 foci are also detected at the base of secondary buds. Bars are1 μm (B) Quantification revealed that the localization profiles of endogenous PBP2 and PBP3 were not statistically different than the localization profiles of the mCherry-PBP2 and mCherry-PBP3 fusions shown in Figure 2C.
Figure 2—figure supplement 4
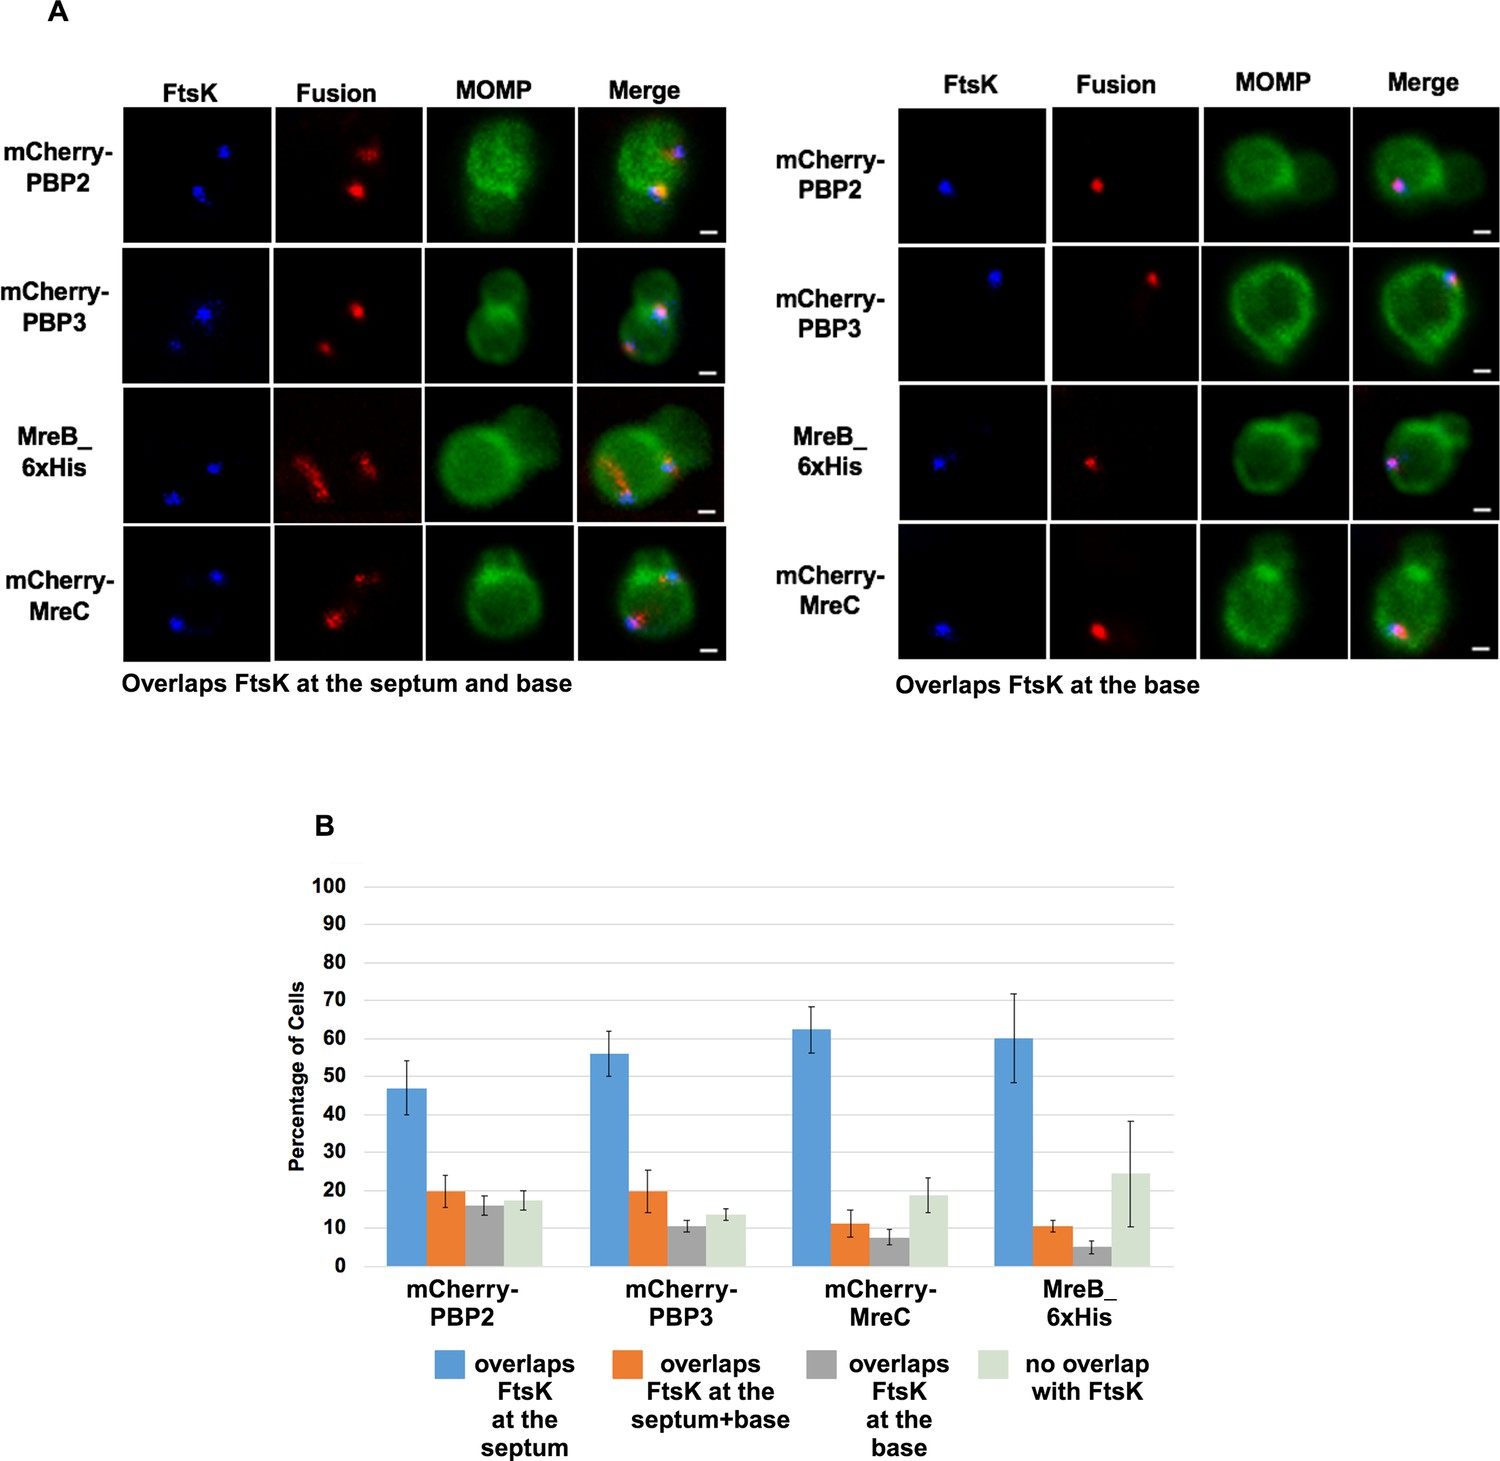
mCherry tagged versions of PBP2, PBP3, and MreC, and the 6xHis tagged version of MreB accumulate in foci at the septum and base or the base alone in some dividing Ct that overlap the localization of endogenous FtsK.
HeLa cells were infected with Ct transformed with mCherry-PB2, mCherry-PBP3, MreB_6xHis, or mCherry-MreC. Each of the fusions was induced by adding 10 nM aTc to the media at 17 hpi. Lysates were prepared at 21 hpi and the cells were fixed and stained with major outer membrane protein MOMP (green) and FtsK (blue) antibodies. The distribution of the mCherry fluorescence in dividing cells that had not initiated secondary bud formation is shown for mCherry-PBP2, mCherry-PBP3, and mCherry-MreC. Cells expressing the MreB_6xHis fusion were stained with rabbit anti-6xHis antibodies (red), FtsK antibodies (blue), and MOMP antibodies (green). In the dividing cells shown there are (A) foci of the fusions at the septum and at the base of the mother cell or foci at the base of the mother cell only that overlap the distribution of FtsK. Bars are 1μm (B) The percentage of dividing cells in which the fusions overlapped the distribution of FtsK at the septum, at the septum and at the base, and at the base alone was quantified in 100 cells. Three independent replicates were performed and the values shown are the average of the three replicates.
Figure 2—figure supplement 5
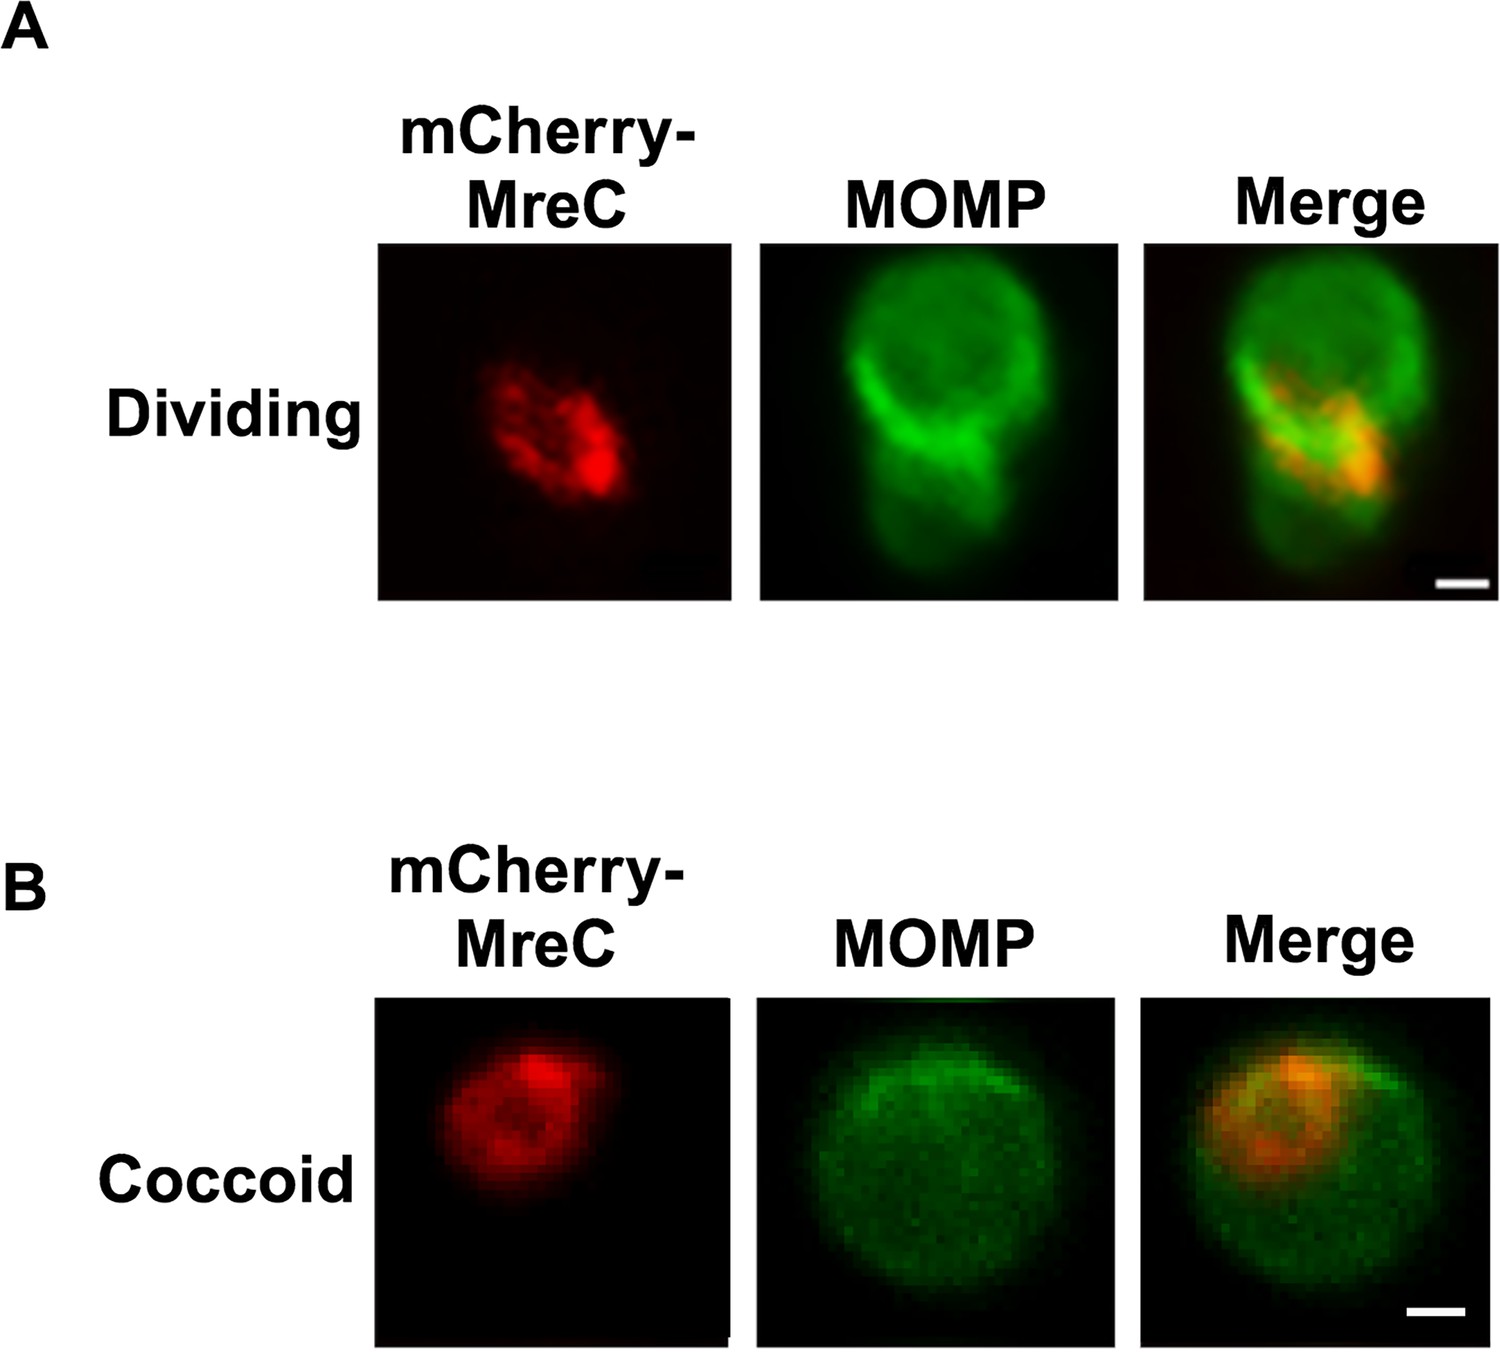
MreC rings in (A) dividing Ct and in (B) coccoid Ct. Bars are 1 μm.
Figure 3
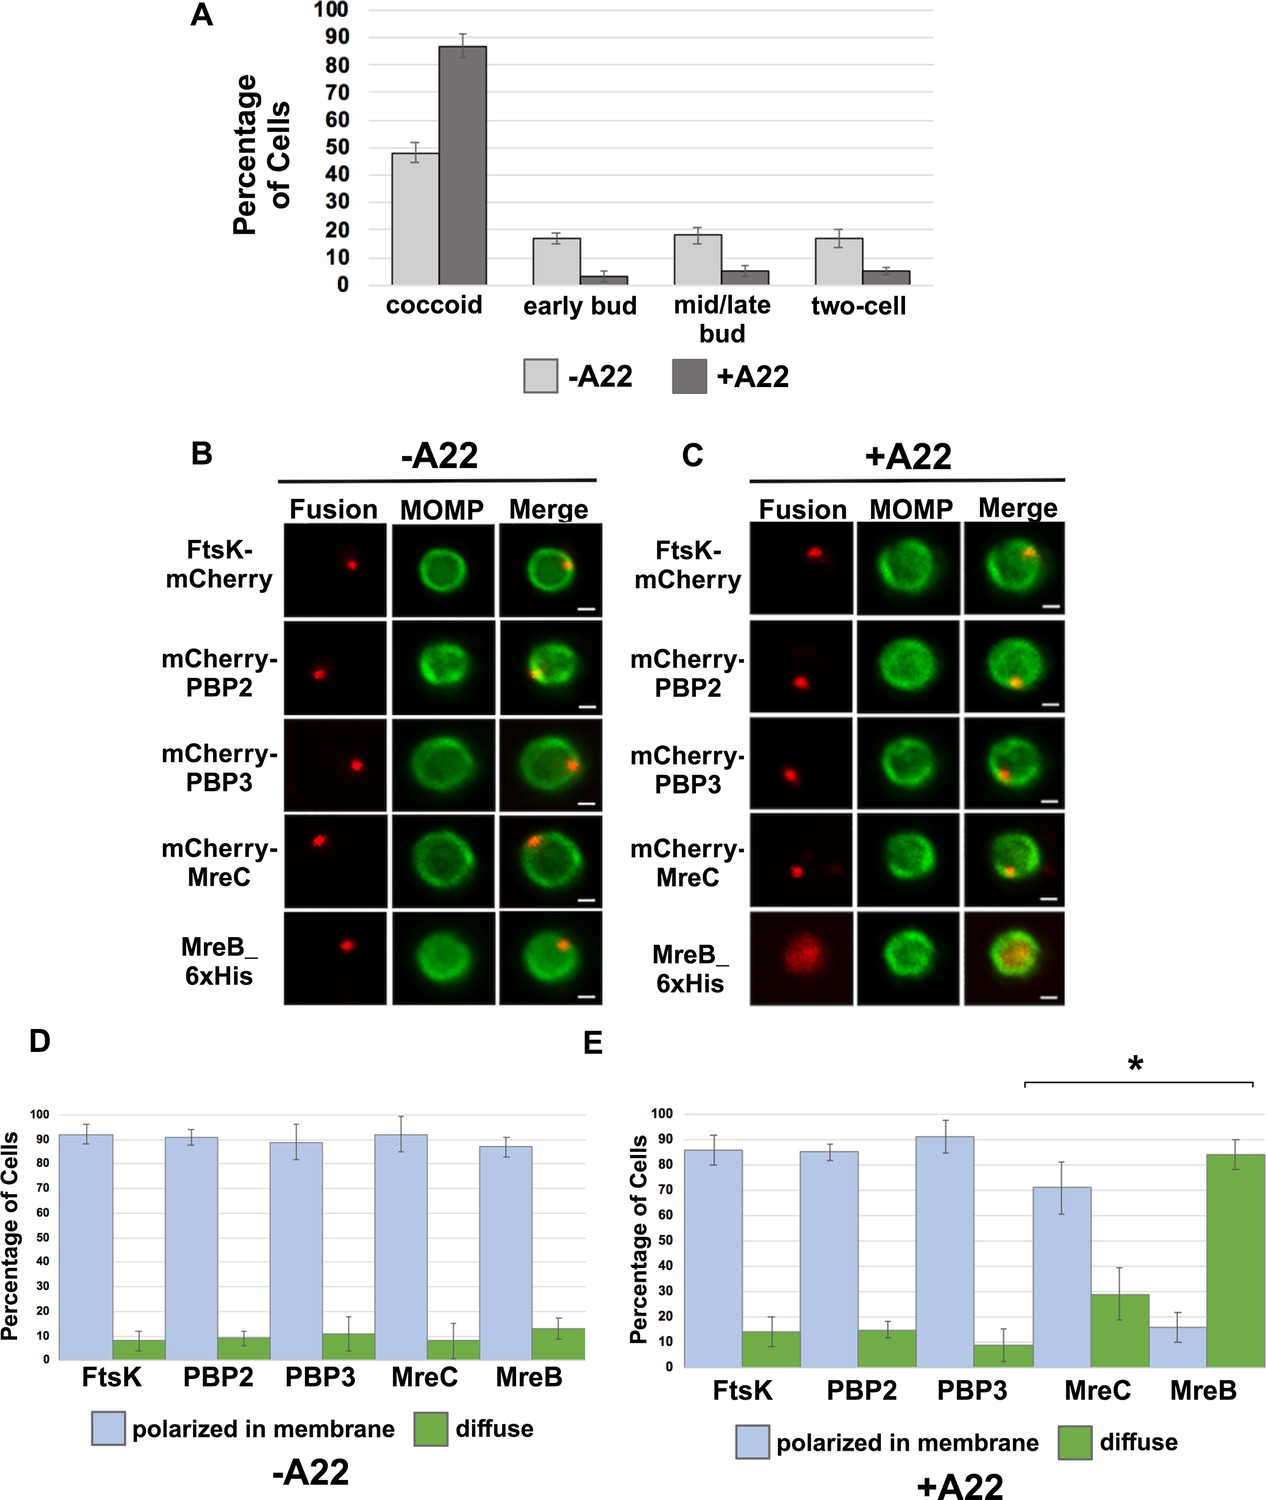
Effect of A22 on cell morphology and foci formation by mCherry tagged FtsK, PBP2, PBP3 and MreC, and foci formation by MreB_6xHis.
(A) HeLa cells infected with Chlamydia trachomatis (Ct) were treated with 75 μM A22 for 1 hr. Control cells were not treated with A22. Lysates were prepared form A22 treated and untreated cells at 21 hpi and the number of coccoid and dividing cells in the population were quantified in 100 cells. Three independent replicates were performed, and the values shown are the average of the three replicates. (B–E) Alternatively, HeLa cells were infected with Ct transformed with plasmids encoding FtsK-mCherry, mCherry-PBP2, mCherry-PBP3, mCherry-MreC, or MreB-6xHis. The fusions were induced at 20 hpi with 10 nM aTc for 1 hr in the absence (B and D) or presence (C and E) of 75 μM A22. Coccoid cells prepared from the infected cells at 21 hpi were stained with major outer membrane protein (MOMP) antibodies (green). The MreB-6xHis fusion was also stained with 6xHis antibodies (red). Panel B shows the distribution of the fusions in untreated coccoid cells. Panel C illustrates the effect of A22 on the localization of the fusions in coccoid cells. Bars in B and C are 1 μm. The distribution of FtsK-mCherry, mCherry-PBP2, mCherry-PBP3, mCherry-MreC, and MreB-6xHis was quantified in (D) control coccoid cells and in (E) A22-treated cells coccoid cells (n=50) is shown. Three replicates were performed, and the values shown in D and E are the averages of the three replicates. Student T-test indicated that A22 had a statistically significant effect on the localization of MreB and MreC (*p<0.01).
Figure 4
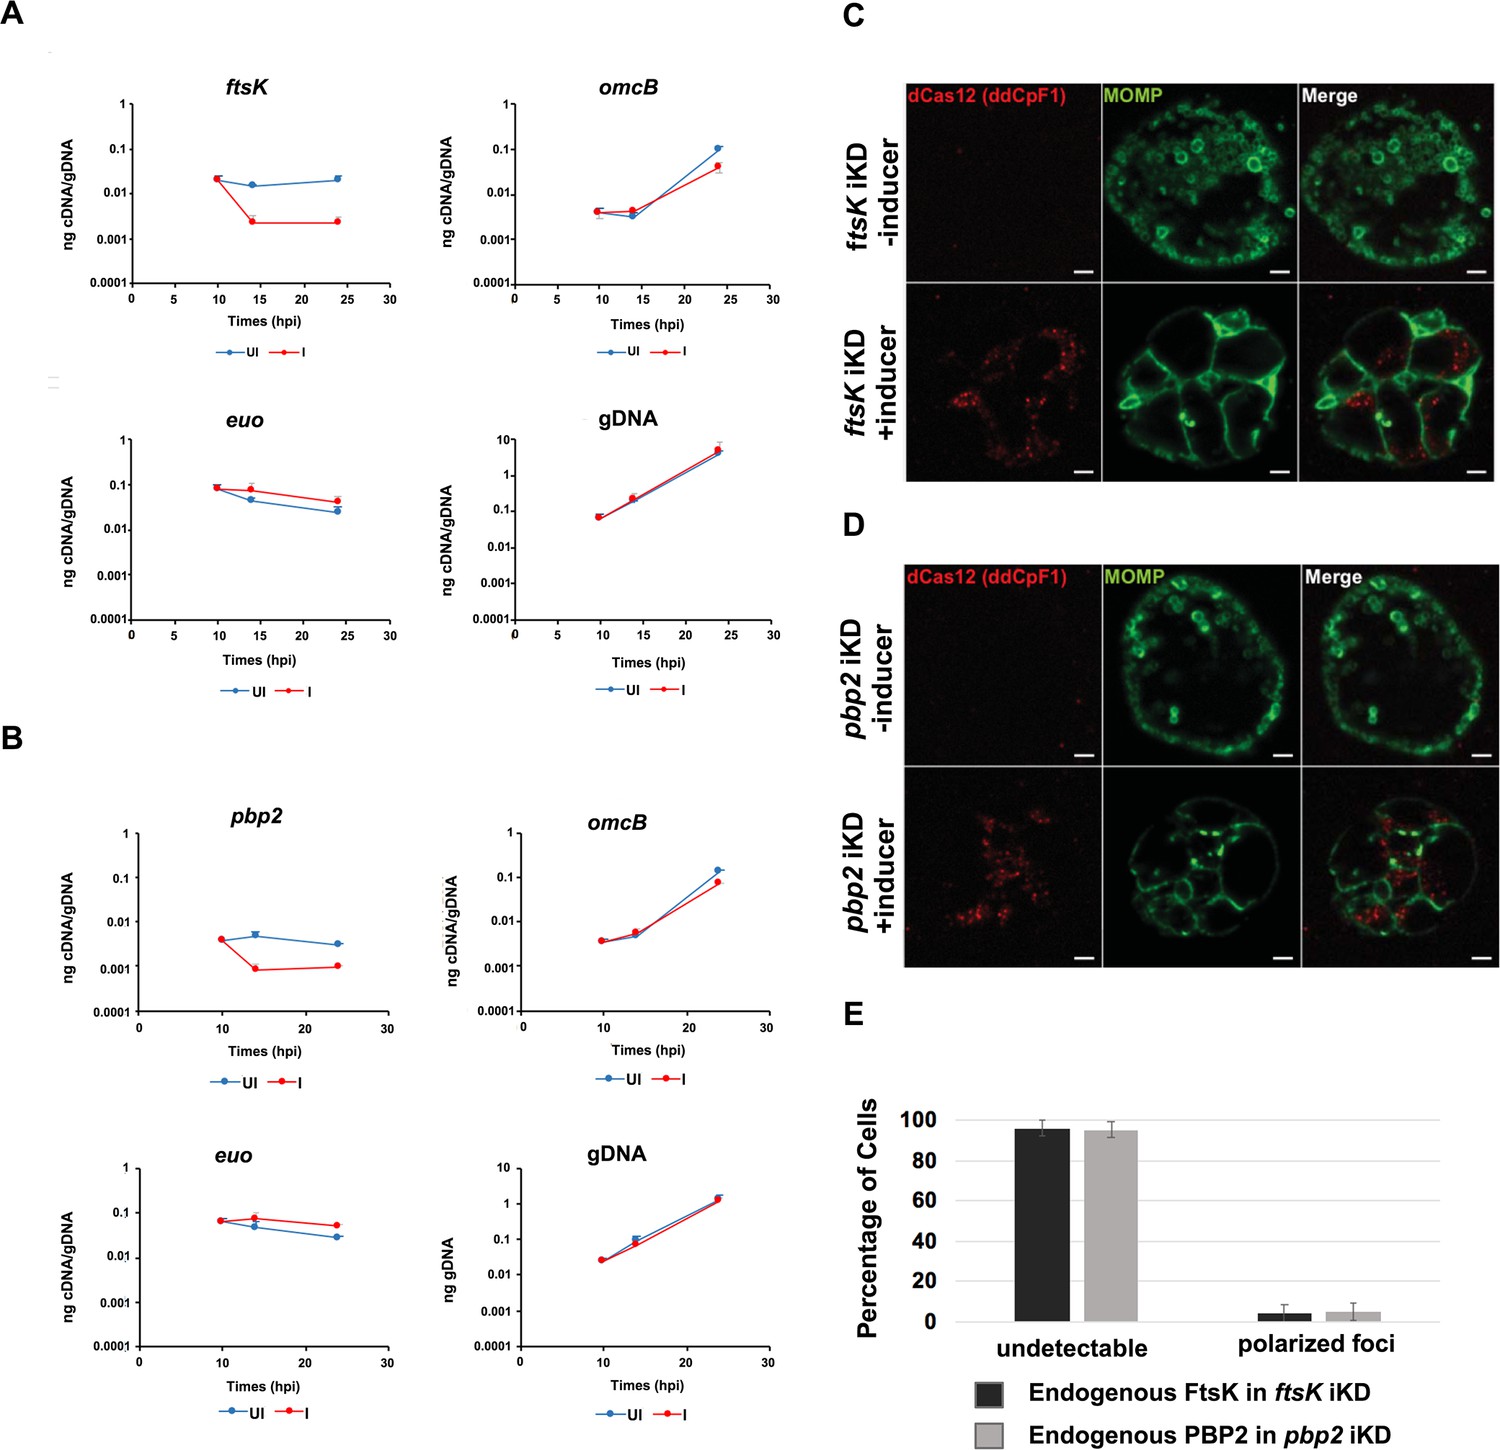
Effect of CRISPRi knock down of ftsK or pbp2 on gene expression, cell morphology and foci formation by FtsK and PBP2.
HeLa cells were infected with Chlamydia trachomatis (Ct) transformed with the pBOMBL12CRia plasmid that constitutively expresses ftsK or pbp2-targeting crRNAs. dCas12 expression was induced by the addition of 5 nM aTc to the media of infected cells at 8 hpi. Control cells were not induced. Nucleic acids were isolated from induced cells and from uninduced controls at various times post-infection, and RT-qPCR was used to measure ftsK or pbp2 transcript levels. (A) The induction of dCas12 resulted in ~10 fold reduction in ftsK transcript levels in cells expressing the ftsK-targeting crRNA, (B) and ~ eightfold reduction in pbp2 transcript levels in cells expressing the pbp2-targeting crRNA, while these crRNAs had minimal or no effect on chlamydial euo and omcB transcript levels. HeLa cells were infected with Ct transformed pBOMBL12CRia plasmid that constitutively expresses a (C) ftsK or (D) pbp2-targeting crRNA. dCas12 expression was induced by the addition of 5 nM aTc to the media of infected cells at 8 hpi. Control cells were not induced. The infected cells were fixed at 24 hpi and stained with MOMP and Cas12 antibodies. Ct morphology was normal and dCas12 was undetectable in the inclusions of uninduced control cells. Foci of dCas12 were observed in induced cells, and Ct in the inclusion exhibited an enlarged aberrant morphology. Bars in C and D are 2 μm. (E) HeLa cells were infected with Ct transformed with the pBOMBL12CRia plasmid that constitutively expresses a ftsK or pbp2-targeting crRNA. dCas12 was induced at 17 hpi by the addition of 10 nM aTc to the media. Control cells were not induced. The cells were harvested at 21 hpi, and Ct were prepared and stained with antibodies that recognize that endogenous FtsK or PBP2. Quantification shows that polarized foci of FtsK and PBP2 were almost undetectable when ftsK or pbp2 were transiently knocked down.
Figure 5
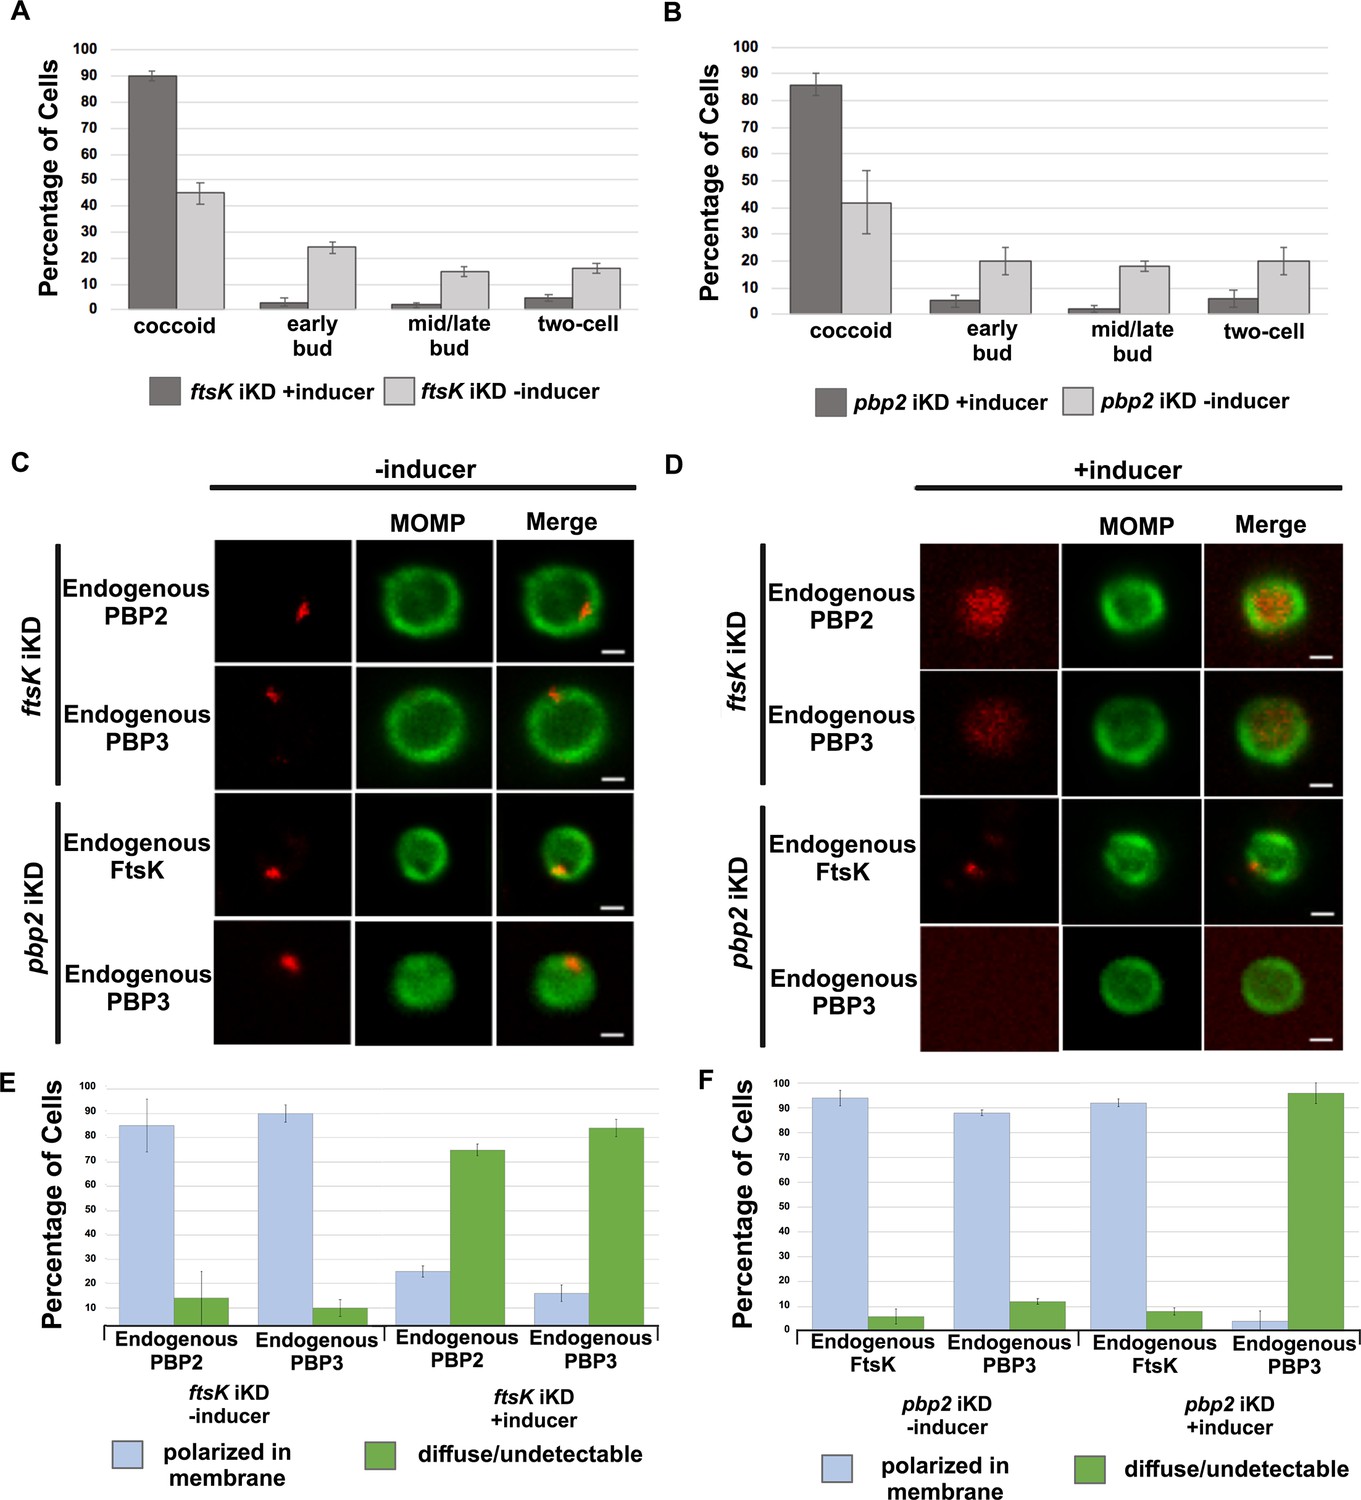
Effect of ftsK or pbp2 inducible knockdown on cell morphology and foci formation by FtsK, PBP2, and PBP3.
HeLa cells were infected with Ct transformed with the pBOMBLcRia plasmid, which constitutively expresses a ftsK or pbp2 crRNA and dCas12 under the control of an aTc-inducible promoter. dCas12 was induced at 17 hpi by adding 5 nM aTc to the media. In a control infection, the expression of dCas12 was not induced. Cells were harvested at 24 hpi and the morphology of Ct in induced and uninduced control cells was assessed in 250 cells. Three replicates were performed, and the values shown are the averages of the three replicates (A and B). The localization of endogenous FtsK, endogenous PBP2, and endogenous PBP3 was assessed in cells transformed with the pBOMBL-12CRia plasmid that targets ftsK or pbp2. The localization is shown in coccoid cells where dCas12 expression was (C) uninduced or (D) induced. White bars are 1 μm. (E and F) The localization profiles of FtsK, PBP2, and PBP3 were quantified in uninduced and induced cells. Three replicates were performed, and the values shown are the averages of the three replicates.
Figure 6
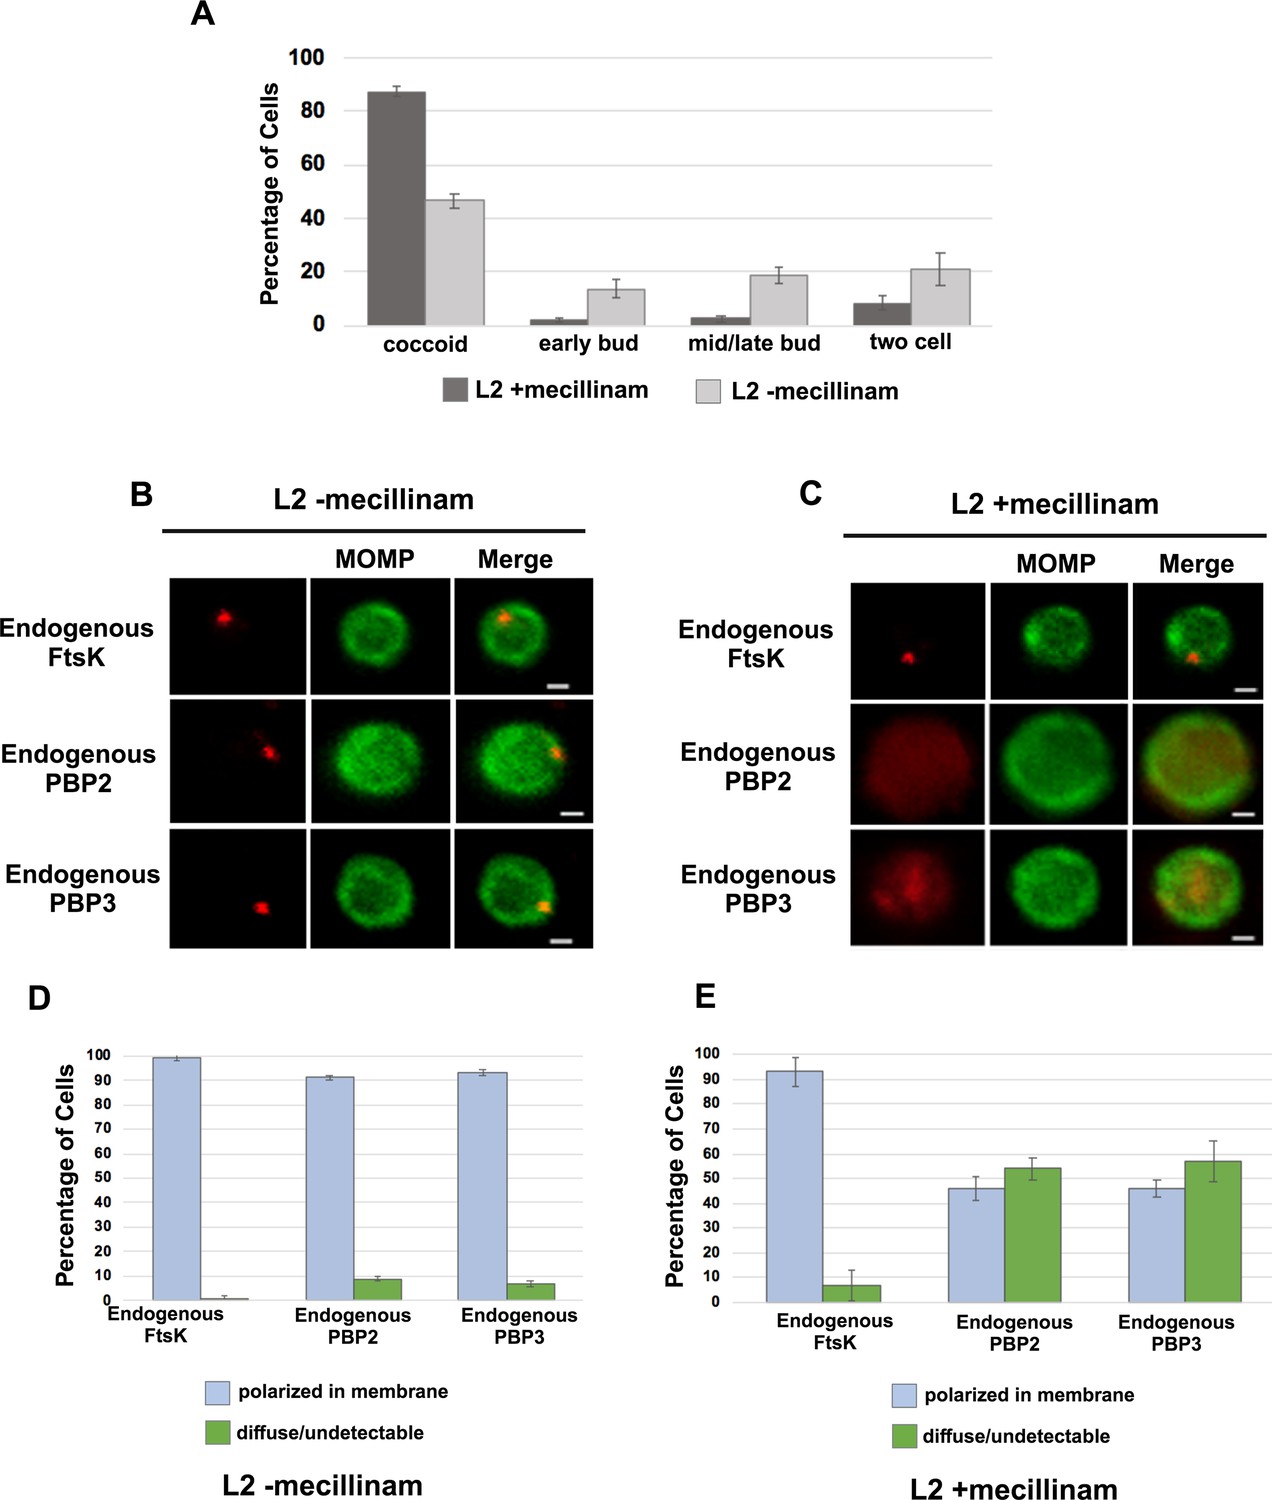
Effect of mecillinam on cell morphology and on the localization of endogenous FtsK, PBP2, and PBP3.
(A) HeLa cells were infected with Ct and 20 μM mecillinam was added to the media at 17 hpi. Untreated coccoid cells were included as a control. The cells were harvested at 21 hpi and the morphology of MOMP-stained cell was assessed in 200 cells. Three replicates were performed, and the values shown are the averages of the three replicates. (B and C) The localization of endogenous FtsK, endogenous PBP2, and endogenous PBP3 in untreated coccoid or in mecillinam-treated coccoid cells is shown. Bars are1 μM. (D and E) Localization of FtsK, PBP2, and PBP3 in untreated and mecillinam-treated coccoid cells was quantified in 50 cells. Three replicates were performed, and the values shown are the averages of the three replicates.
Figure 7
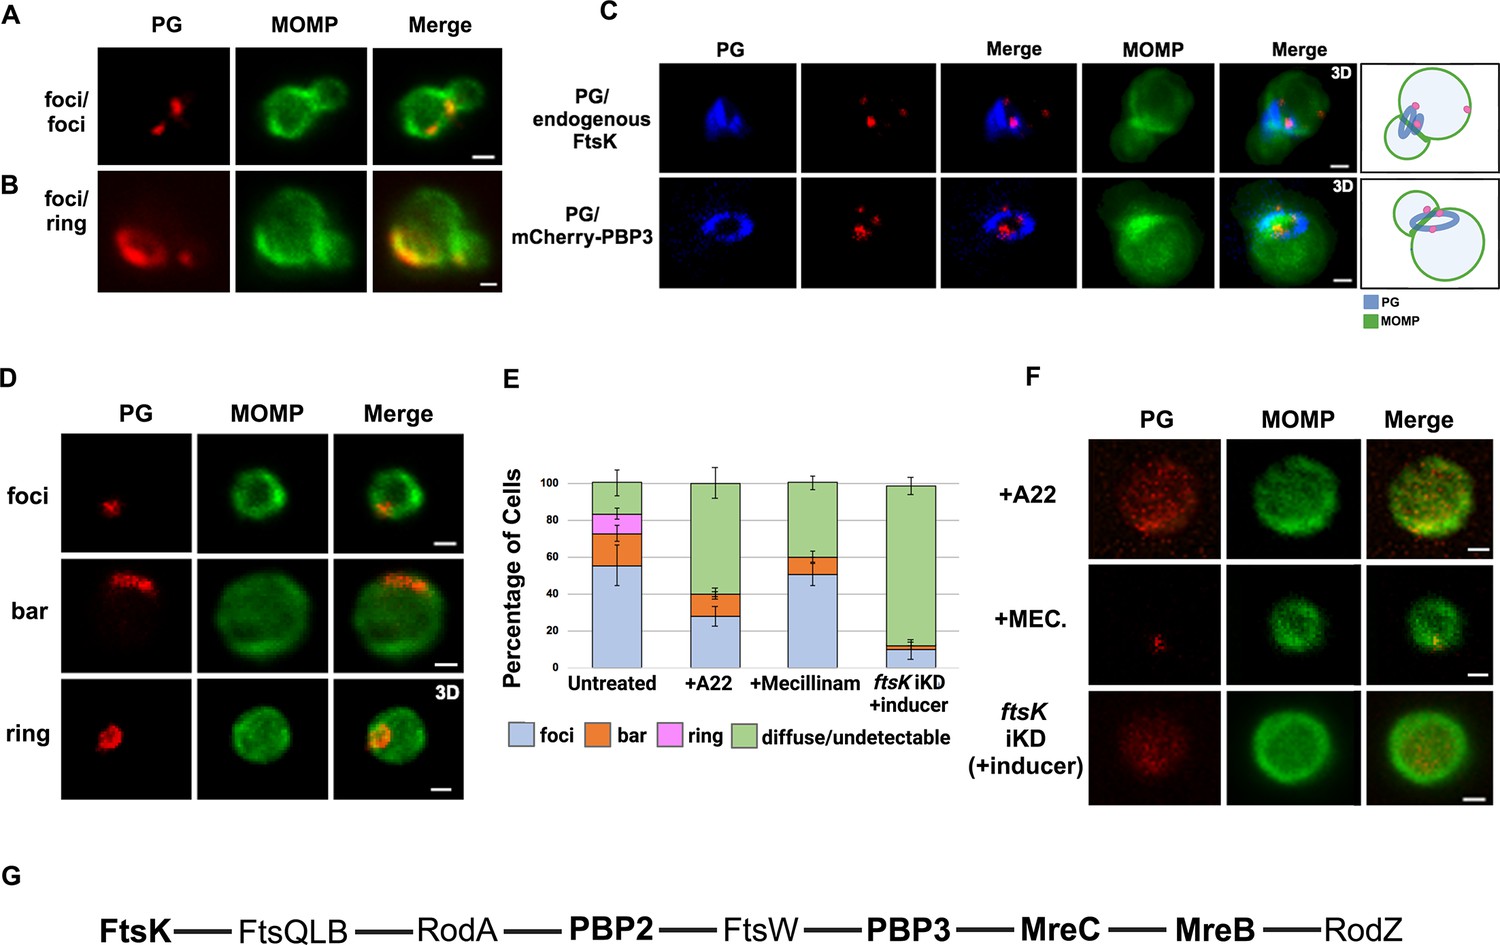
Peptidoglycan (PG) distribution in Chlamydia trachomatis (Ct).
HeLa cells were infected with Ct L2. At 17 hpi, 4 mM ethylene-DA-DA (EDA-DA) was added to the media, the cells were harvested at 21 hpi, and the ethylene-DA-DA (EDA-DA) was click labeled and compared to the distribution of major outer membrane protein (MOMP). (A) Imaging analyses revealed that PG formed foci at the septum and at the base in some dividing cells. (B) Imaging analyses revealed that PG organization at the septum and at the base of some dividing cells differed. In this example, a PG foci was detected at the septum and a PG ring was detected at the base of a dividing cell. (C) The localization of click-labeled PG was compared to the localization of endogenous FtsK and mCherry-PBP3 at the septum of dividing cells. 3D projections revealed that multiple foci of each protein are associated with PG intermediates. Cartoons are included to assist the reader in visualizing the angled orientation of PG relative to the MOMP-stained septum in the dividing cells. (D) PG organization in untreated coccoid cells. (E) Quantification of PG organization in untreated coccoid cells, A22-treated coccoid cells, mecillinam-treated coccoid cells, and in coccoid cells resulting from the inducible knockdown of ftsk. Fifty cells were counted for each condition. Three replicates were performed and the average from the three replicates is shown. (F) PG organization in A22-treated and mecillinam-treated coccoid cells, and in coccoid cells resulting from the inducible knockdown of ftsk is shown. Bars are 1 μm. (G) Putative Ct divisome assembly pathway is shown. Proteins characterized in this study are bolded. The ordering of the remaining proteins is based on the assembly of the divisome and elongasome in E. coli (Du and Lutkenhaus, 2017; Liu et al., 2020).
Additional files
-
Supplementary file 1
Primers and plasmids used in our analyses.
(A) List of primers and plasmids used for cloning mCherry fusions of FtsK, PBP2, PBP3, MreB, and MreC. (B) List of primers used for RT-qPCR.
- https://cdn.elifesciences.org/articles/104199/elife-104199-supp1-v1.xlsx
-
MDAR checklist
- https://cdn.elifesciences.org/articles/104199/elife-104199-mdarchecklist1-v1.pdf
Download links
A two-part list of links to download the article, or parts of the article, in various formats.
Downloads (link to download the article as PDF)
Open citations (links to open the citations from this article in various online reference manager services)
Cite this article (links to download the citations from this article in formats compatible with various reference manager tools)
FtsK is critical for the assembly of the unique divisome complex of the FtsZ-less Chlamydia trachomatis
eLife 13:RP104199.
https://doi.org/10.7554/eLife.104199.3


