Mechanisms of PP2A-Ankle2 dependent nuclear reassembly after mitosis
- Institute for Research in Immunology and Cancer, Université de Montréal, Canada
- Département de biochimie et médecine moléculaire, Université de Montréal, Canada
- Department of Biochemistry, McGill University, Canada
- Département de chimie, Université de Montréal, Canada
Figures
Figure 1 with 1 supplement
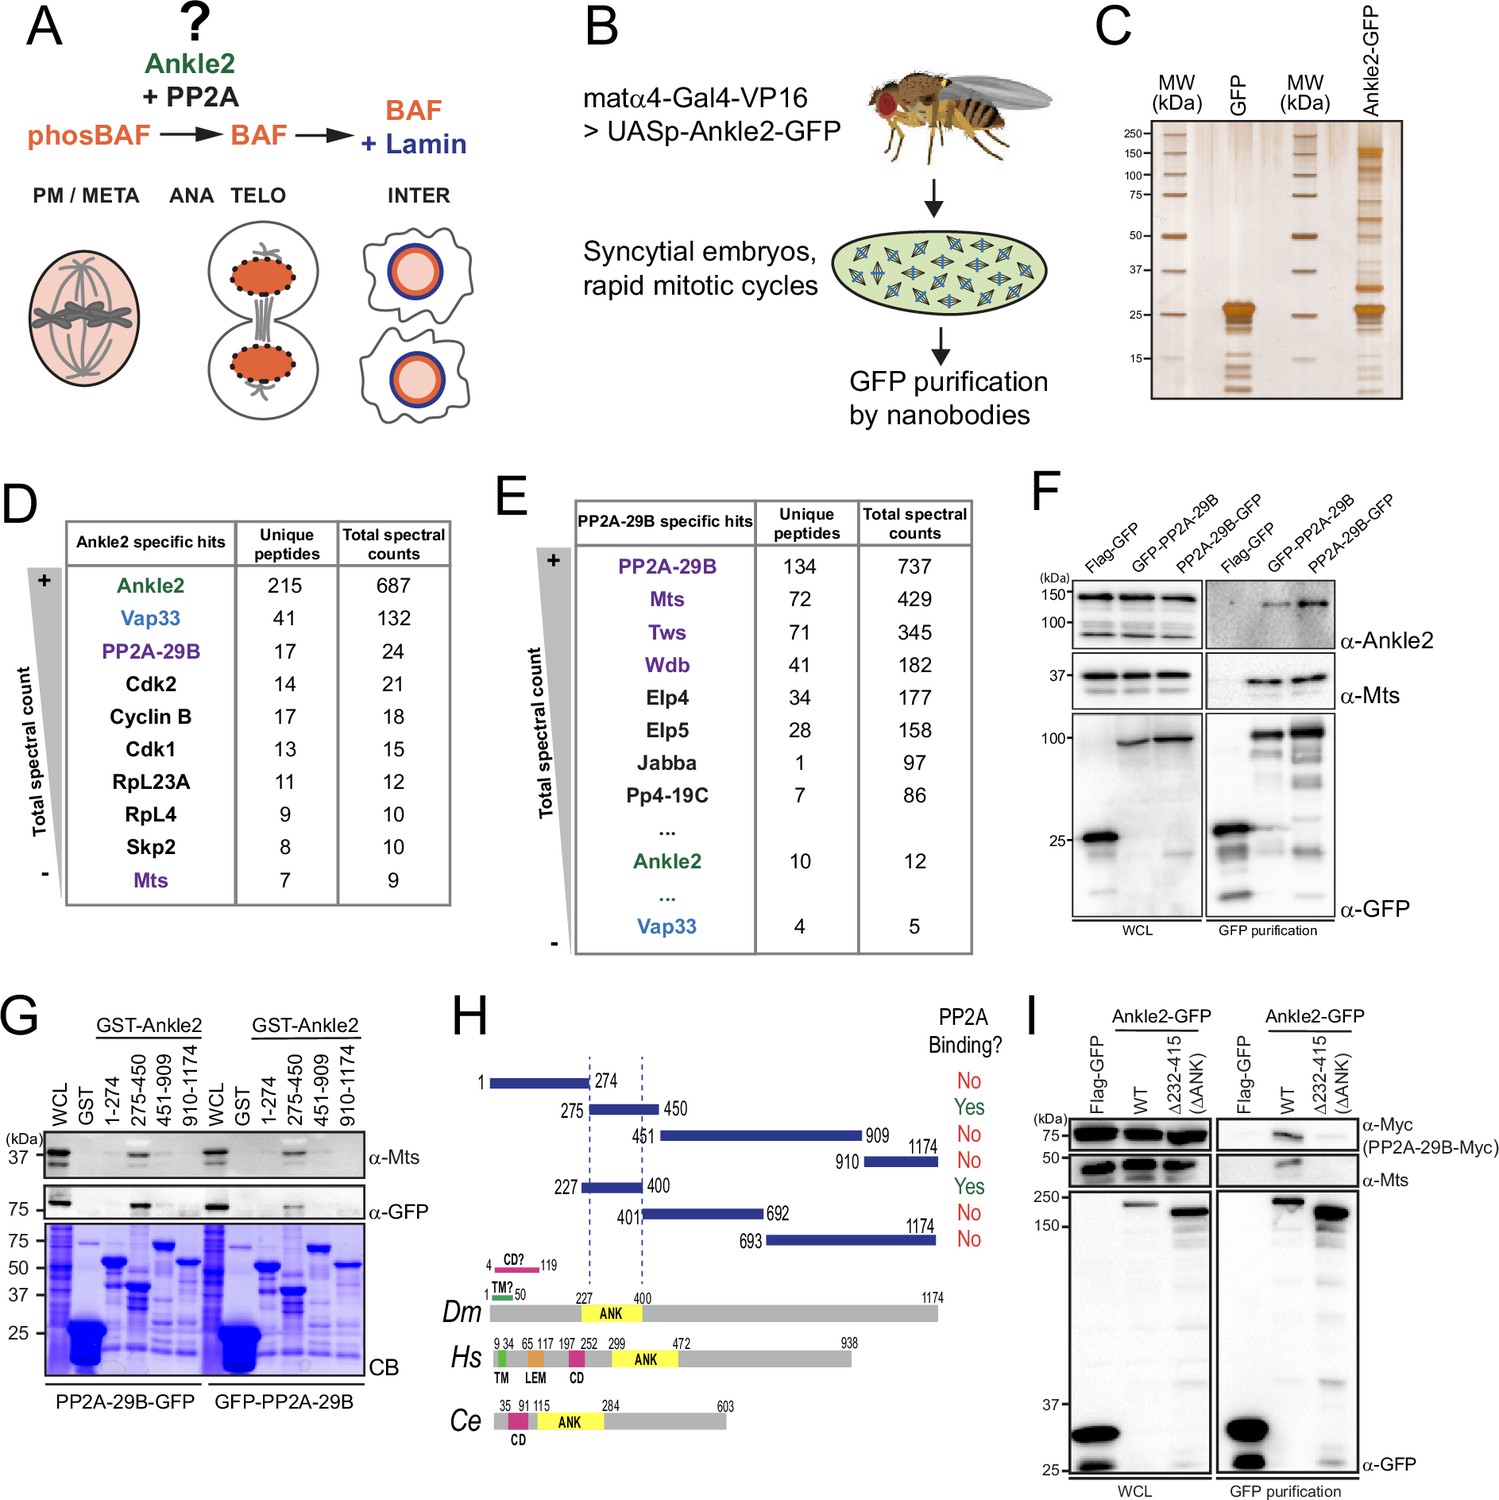
Ankle2 interacts with Protein Phosphatases 2A (PP2A) through its Ankyrin repeats region.
(A) Ankle2 functions with PP2A to allow the dephosphorylation of Barrier-to-Autointegration Factor (BAF) and its recruitment to segregated chromosomes. BAF promotes the formation of a single nucleus by cross-bridging chromosomes, and the recruitment of Lamin and endoplasmic reticulum (ER) membranes containing LEM-Domain proteins (not shown). The molecular mechanisms involving Ankle2 in this process are incompletely understood. (B) Strategy for the identification of Ankle2 interactor proteins in vivo. See text for details. (C–E) Proteins obtained after purification of Ankle2-GFP, PP2A-29B-GFP, or GFP from embryos. (C) Silver-stained gel showing a fraction of the purification products. (D) Proteins specifically identified with Ankle2-GFP. Proteins with the highest total spectral counts are shown. (E) Proteins were specifically identified with PP2A-29B-GFP after purification from embryos. Proteins with the highest total spectral counts are shown. Ankle2 and Vap33 were also identified as specific interactors further down the list. Purple names: known PP2A subunits. (F) Ankle2 is specifically co-purified with PP2A-29B. Cells were transfected with the indicated proteins and used in GFP affinity purifications. Products were analyzed by western blots. WCL: Whole cell extracts. (G) A region of Ankle2 between amino-acid residues 275–450 is sufficient for interaction with PP2A. GST-fused fragments of Ankle2 produced in bacteria were used in GST-pulldowns with extracts from D-Mel cells expressing PP2A-29B-GFP or GFP-PP2A-29B. Pulled-down proteins (PP2A-29B-GFP or GFP-PP2A-29B and Mts) were detected by western blots. CB: Coomassie Blue. (H) Top: Summary of results from GST pulldowns testing interactions of Ankle2 fragments with PP2A. Bottom: Primary structures of Ankle2 from D. melanogaster (Dm), H. sapiens (Hs), and C. elegans (Ce). showing known motifs or domains. ANK: Ankyrin domain region; TM: Trans-Membrane motif: LEM: LEM domain. CD: Caulimovirus Domain. (I) The Ankyrin domain region of Ankle2 between amino-acid residues 232–415 is required for interaction with PP2A. Cells were transfected with the indicated proteins and used in GFP affinity purifications. Products were analyzed by western blots. WCL: Whole cell extracts. Numerical data are available in Figure 1—source data 1, Figure 1—source data 2.
-
Figure 1—source data 1
Proteins identified from affinity purifications of Ankle2-GFP from embryos.
Numbers of total spectral counts and unique peptides for Ankle2-GFP or Flag-GFP (control) are indicated.
- https://cdn.elifesciences.org/articles/104233/elife-104233-fig1-data1-v1.xlsx
-
Figure 1—source data 2
Proteins identified from affinity purifications of PP2A-29B-GFP from embryos.
Numbers of total spectral counts and unique peptides for PP2A-29B-GFP or GFP (control) are indicated.
- https://cdn.elifesciences.org/articles/104233/elife-104233-fig1-data2-v1.xlsx
-
Figure 1—source data 3
Figures with uncropped western blots and gels annotated.
- https://cdn.elifesciences.org/articles/104233/elife-104233-fig1-data3-v1.zip
-
Figure 1—source data 4
Original files for western blots and gels.
- https://cdn.elifesciences.org/articles/104233/elife-104233-fig1-data4-v1.zip
Figure 1—figure supplement 1
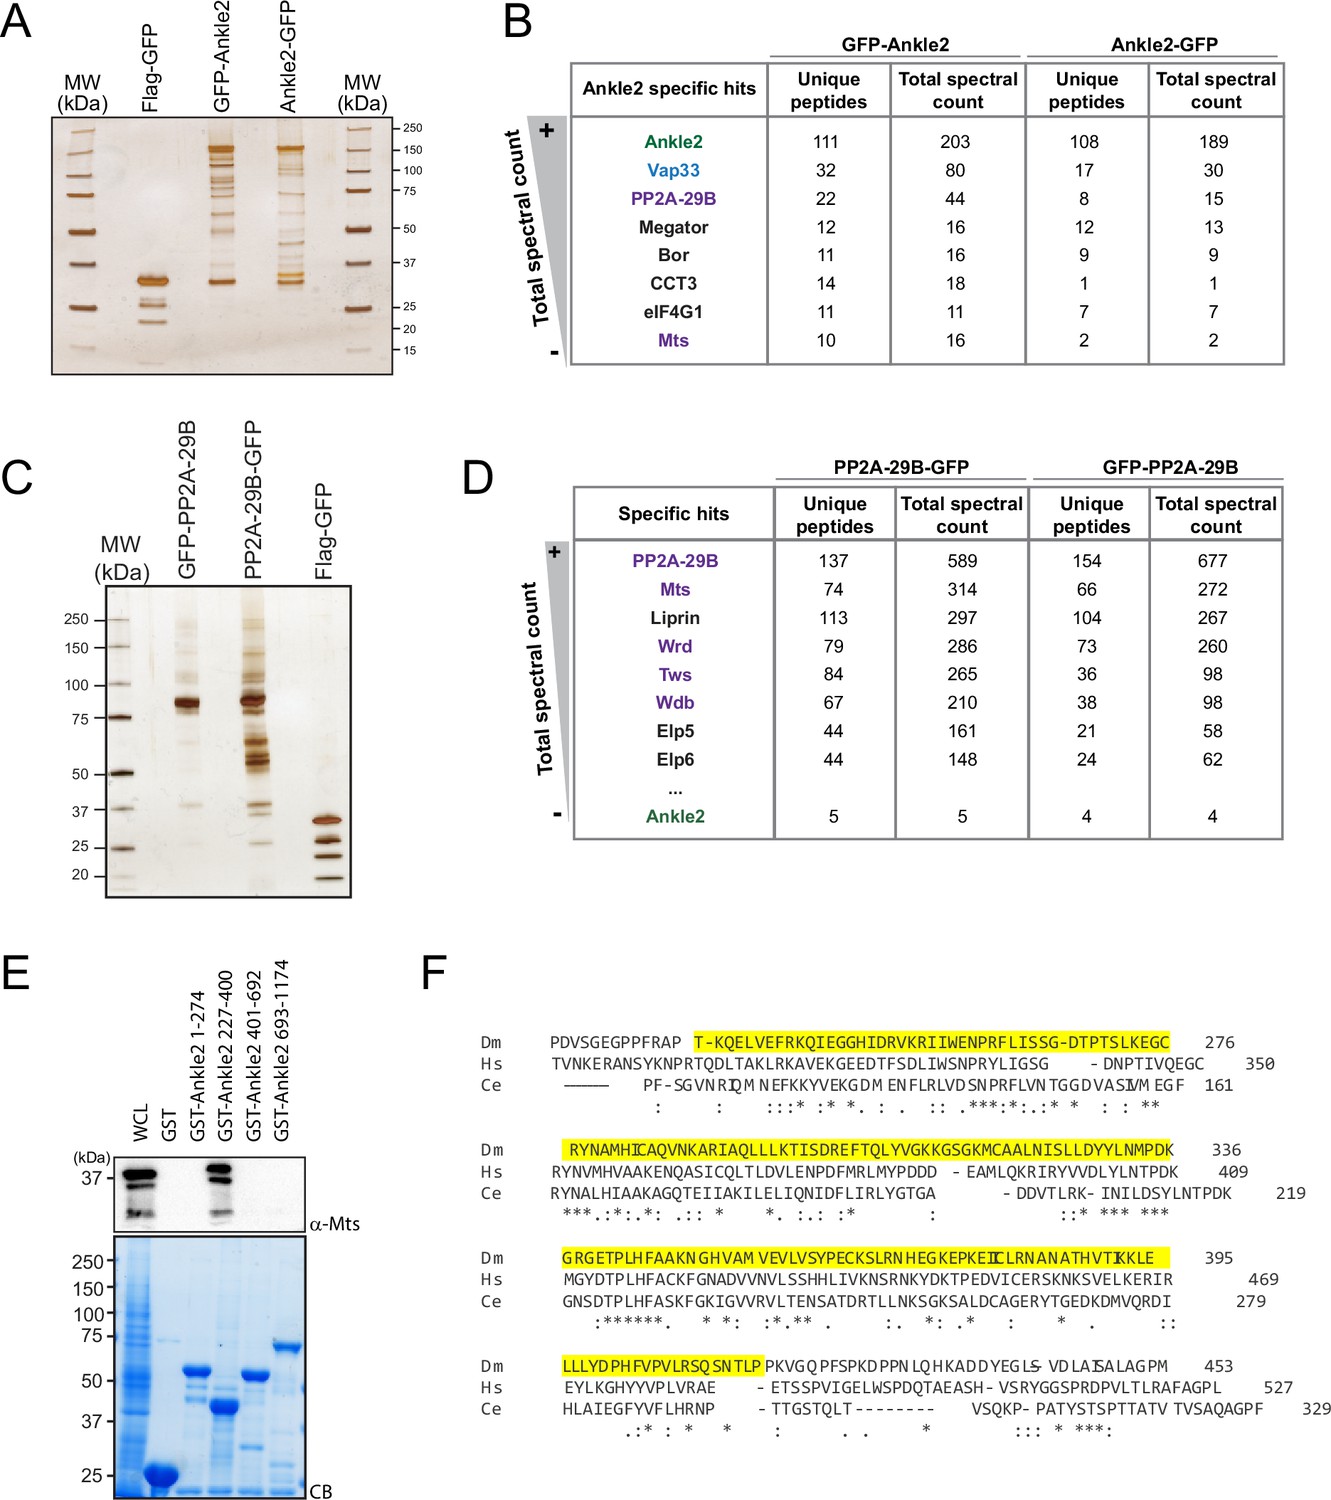
Ankle2 interacts with Protein Phosphatases 2A (PP2A) through its Ankyrin repeats region.
(A, B) Proteins obtained after purification of Ankle2-GFP, GFP-Ankle2, or Flag-GFP from D-Mel cells. (A) Silver-stained gel showing a fraction of the purification products. (B) Proteins specifically identified with GFP-Ankle2 or Ankle2-GFP. Proteins with the highest total spectral counts for GFP-Ankle2 are shown. (C, D) Proteins obtained after purification of PP2A-29B-GFP, GFP-PP2A-29B, or Flag-GFP from D-Mel cells. (C) Silver-stained gel showing a fraction of the purification products. (D) Proteins specifically identified with PP2A-29B-GFP and GFP-PP2A-29B. Proteins with the highest total spectral counts for PP2A-29B-GFP are shown. Ankle2 was also identified as a specific interactor further down the list. Purple names: known PP2A subunits. (E) A region of Ankle2 comprising amino-acid residues 227–400 is sufficient for interaction with PP2A. GST-fused fragments of Ankle2 produced in bacteria were used in GST-pulldowns with extracts from D-Mel cells. Mts was detected by western blot. CB: Coomassie Blue. (F) Alignment of the Ankyrin domain region of Ankle2 from D. melanogaster, H. sapiens, and C. elegans. The alignment was done with full-length sequences using Clustal Omega. The Ankyrin domain region of Ankle2 (a.a. 232–415) deleted in Ankle2ΔANK is shown in yellow. Numerical data are available in Figure 1—figure supplement 1—source data 1, Figure 1—figure supplement 1—source data 2.
-
Figure 1—figure supplement 1—source data 1
Proteins identified from affinity purifications of GFP-fused Ankle2 from D-Mel cells.
Numbers of total spectral counts and unique peptides for GFP-Ankle2, Ankle2-GFP, or Flag-GFP (control) are indicated.
- https://cdn.elifesciences.org/articles/104233/elife-104233-fig1-figsupp1-data1-v1.xlsx
-
Figure 1—figure supplement 1—source data 2
Proteins identified from affinity purifications of GFP-fused PP2A-29B from D-Mel cells.
Numbers of total spectral counts and unique peptides for GFP-PP2A-29B, PP2A-29B-GFP, or GFP (control) are indicated.
- https://cdn.elifesciences.org/articles/104233/elife-104233-fig1-figsupp1-data2-v1.xlsx
-
Figure 1—figure supplement 1—source data 3
Figures with uncropped western blots and gels annotated.
- https://cdn.elifesciences.org/articles/104233/elife-104233-fig1-figsupp1-data3-v1.zip
-
Figure 1—figure supplement 1—source data 4
Original files for western blots and gels.
- https://cdn.elifesciences.org/articles/104233/elife-104233-fig1-figsupp1-data4-v1.zip
Figure 2
Protein Phosphatases 2A (PP2A)-Ankle2 promotes Barrier-to-Autointegration Factor (BAF) dephosphorylation.
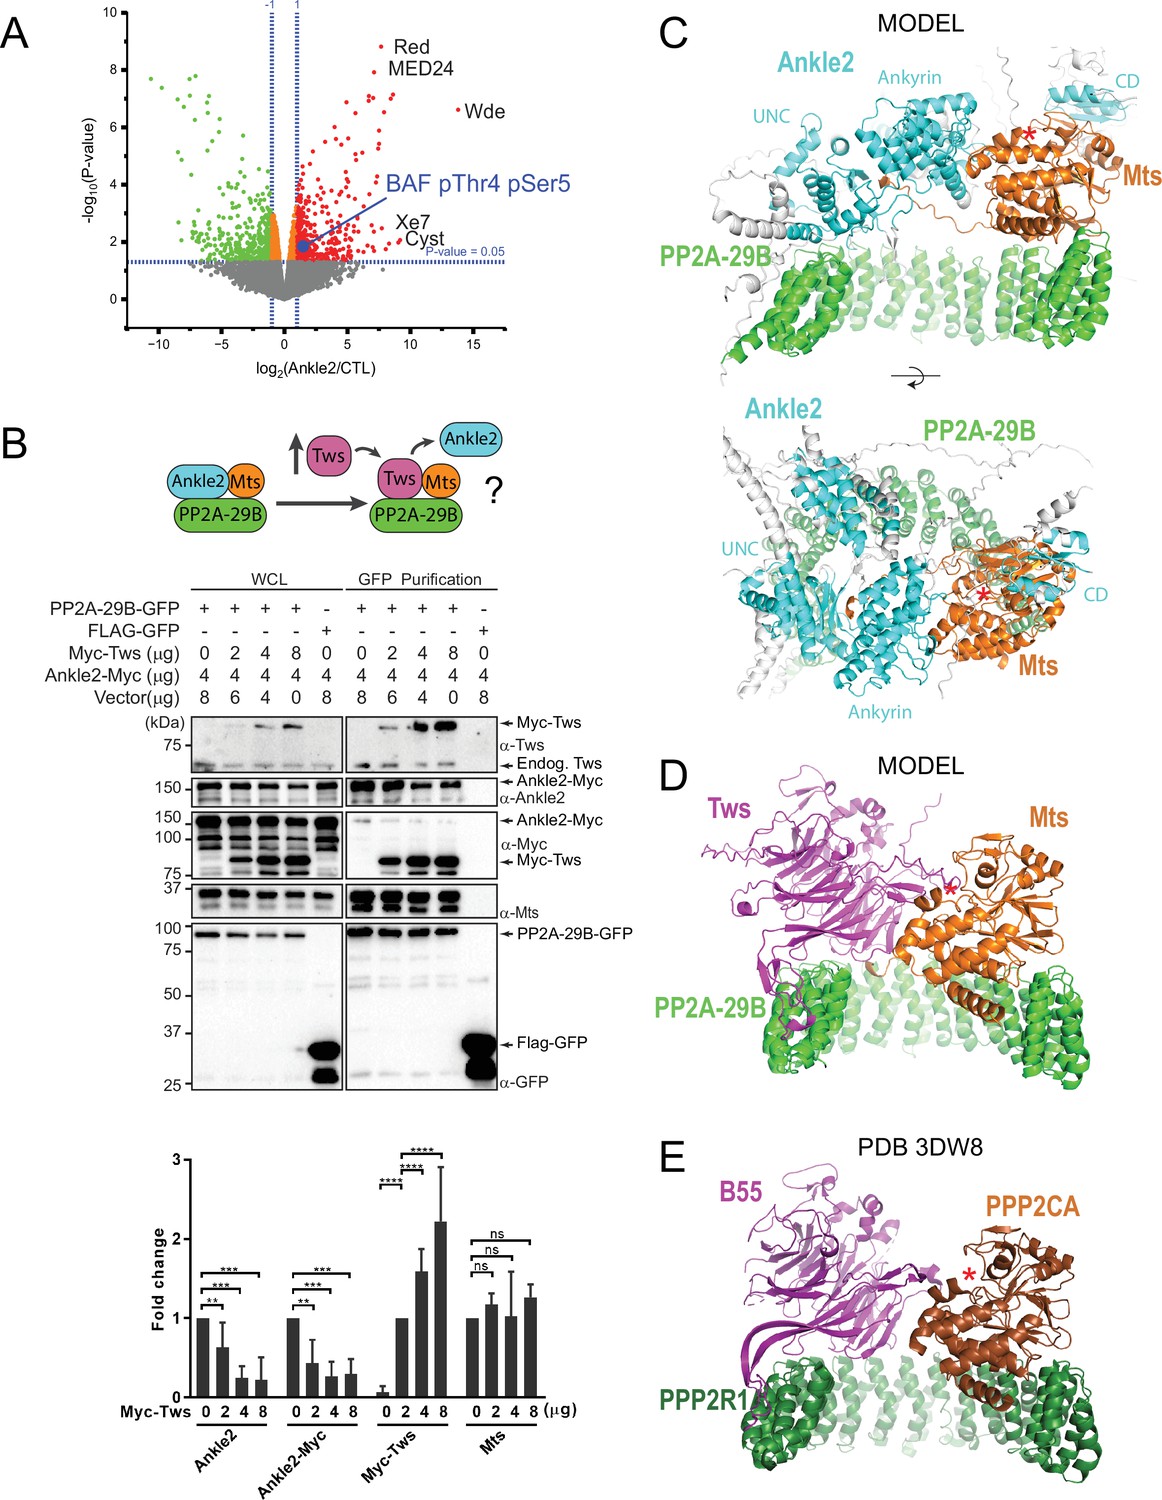
(A) Phosphoproteomic analysis identified BAF as being hyperphosphorylated at Thr4 and Ser5 upon Ankle2 depletion. D-Mel cells were transfected with dsRNA against Ankle2 or non-target dsRNA (against bacterial KAN gene). Phosphopeptides from tryptic digests were analyzed quantitatively by mass spectrometry. A few additional significantly hyperphosphorylated proteins are labeled as examples (see Figure 2—source data 1 for the full list). Red, green, and orange dots represent peptides with significant (p<0.05) hyperphosphorylation, hypophosphorylation, and little change, respectively. Gray dots indicate peptides with changes below statistical significance. (B) Competition assay. Top: schematic hypothesis. If Ankle2 occupies the position of a PP2A regulatory subunit, its presence in the PP2A holoenzyme may be outcompeted by Tws (PP2A regulatory subunit). Bottom: the interaction between PP2A-29B-GFP and Ankle2-Myc was monitored by a GFP affinity co-purification assay. Increasing amounts of Myc-Tws plasmid were co-transfected. As a result, increasing amounts of Myc-Tws, and decreasing amounts of Ankle2-Myc, are co-purified with PP2A-29B-GFP. The amounts of co-purified Mts are unchanged. Averages of three experiments are shown. All error bars: S.D. **p<0.01, ***p<0.001 **** p<0.0001, ns: non-significant from paired t-tests (C) AlphaFold3 predicted a model of a complex between Drosophila Ankle2, PP2A-29B, and Mts. Residues of Ankle2 with confidence scores below 0.8 are coloured gray. (D) Predicted model of a complex between Drosophila Tws, PP2A-29B and Mts. (E) Crystal structure of a complex between human PPP2R1A, PPP2CA, and B55 (PDB 3DW8) (Xu et al., 2008). Red asterisks denote the positions of the phosphatase catalytic site. Numerical data are available in Figure 2—source data 1, Figure 2—source data 2.
-
Figure 2—source data 1
Phosphopeptide identification and quantification from cells after Ankle2 or control RNAi.
Results are listed for four replicates in each condition, as well as the average fold-changes and p-values.
- https://cdn.elifesciences.org/articles/104233/elife-104233-fig2-data1-v1.xlsx
-
Figure 2—source data 2
Numerical data is used to make graphs.
- https://cdn.elifesciences.org/articles/104233/elife-104233-fig2-data2-v1.xlsx
-
Figure 2—source data 3
Figures with uncropped western blots annotated.
- https://cdn.elifesciences.org/articles/104233/elife-104233-fig2-data3-v1.zip
-
Figure 2—source data 4
Original files for western blots.
- https://cdn.elifesciences.org/articles/104233/elife-104233-fig2-data4-v1.zip
Figure 3 with 1 supplement
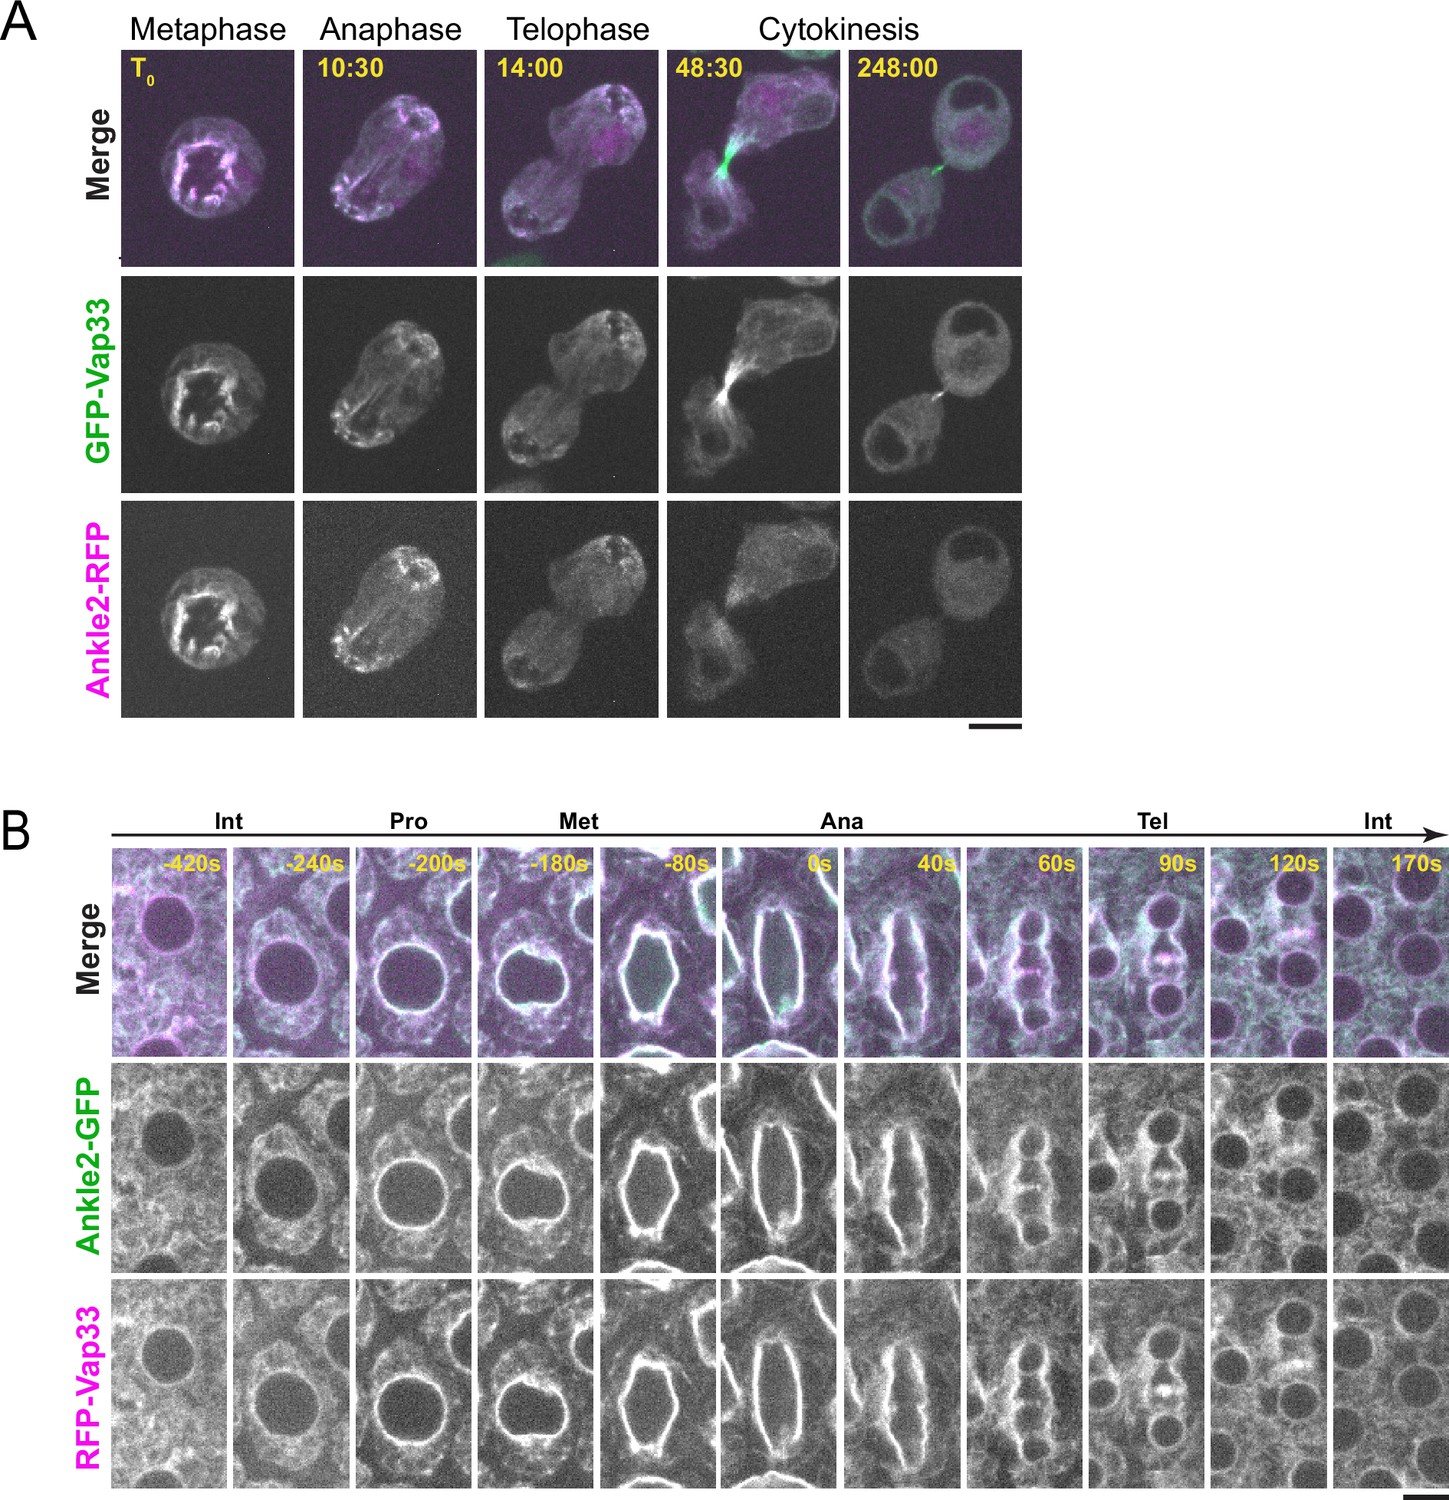
Ankle2 co-localizes with Vap33.
(A) Video images of a D-Mel cell co-expressing Ankle2-RFP and GFP-Vap33 through different stages of cell division. (B) Video images of a syncytial embryo co-expressing Ankle2-GFP and RFP-Vap33 through different stages of the cell cycle. Scale bars: 5 μm.
Figure 3—figure supplement 1

The localization of Ankle2 depends on Vap33 in egg chambers.
(A) Schematic representation of different stages of egg chamber maturation. (B) Egg chambers expressing Ankle2-GFP from the matα4-GAL-VP16 driver, with or without expression of Vap33 RNAi from the same driver, were stained for DNA with Hoechst 33342. Note that Ankle2-GFP localization around nuclei (arrowheads), the plasma membrane (arrows), and ring canals (asterisks) is abrogated upon Vap33 RNAi. Scale bar: 20 μm.
Figure 4 with 1 supplement
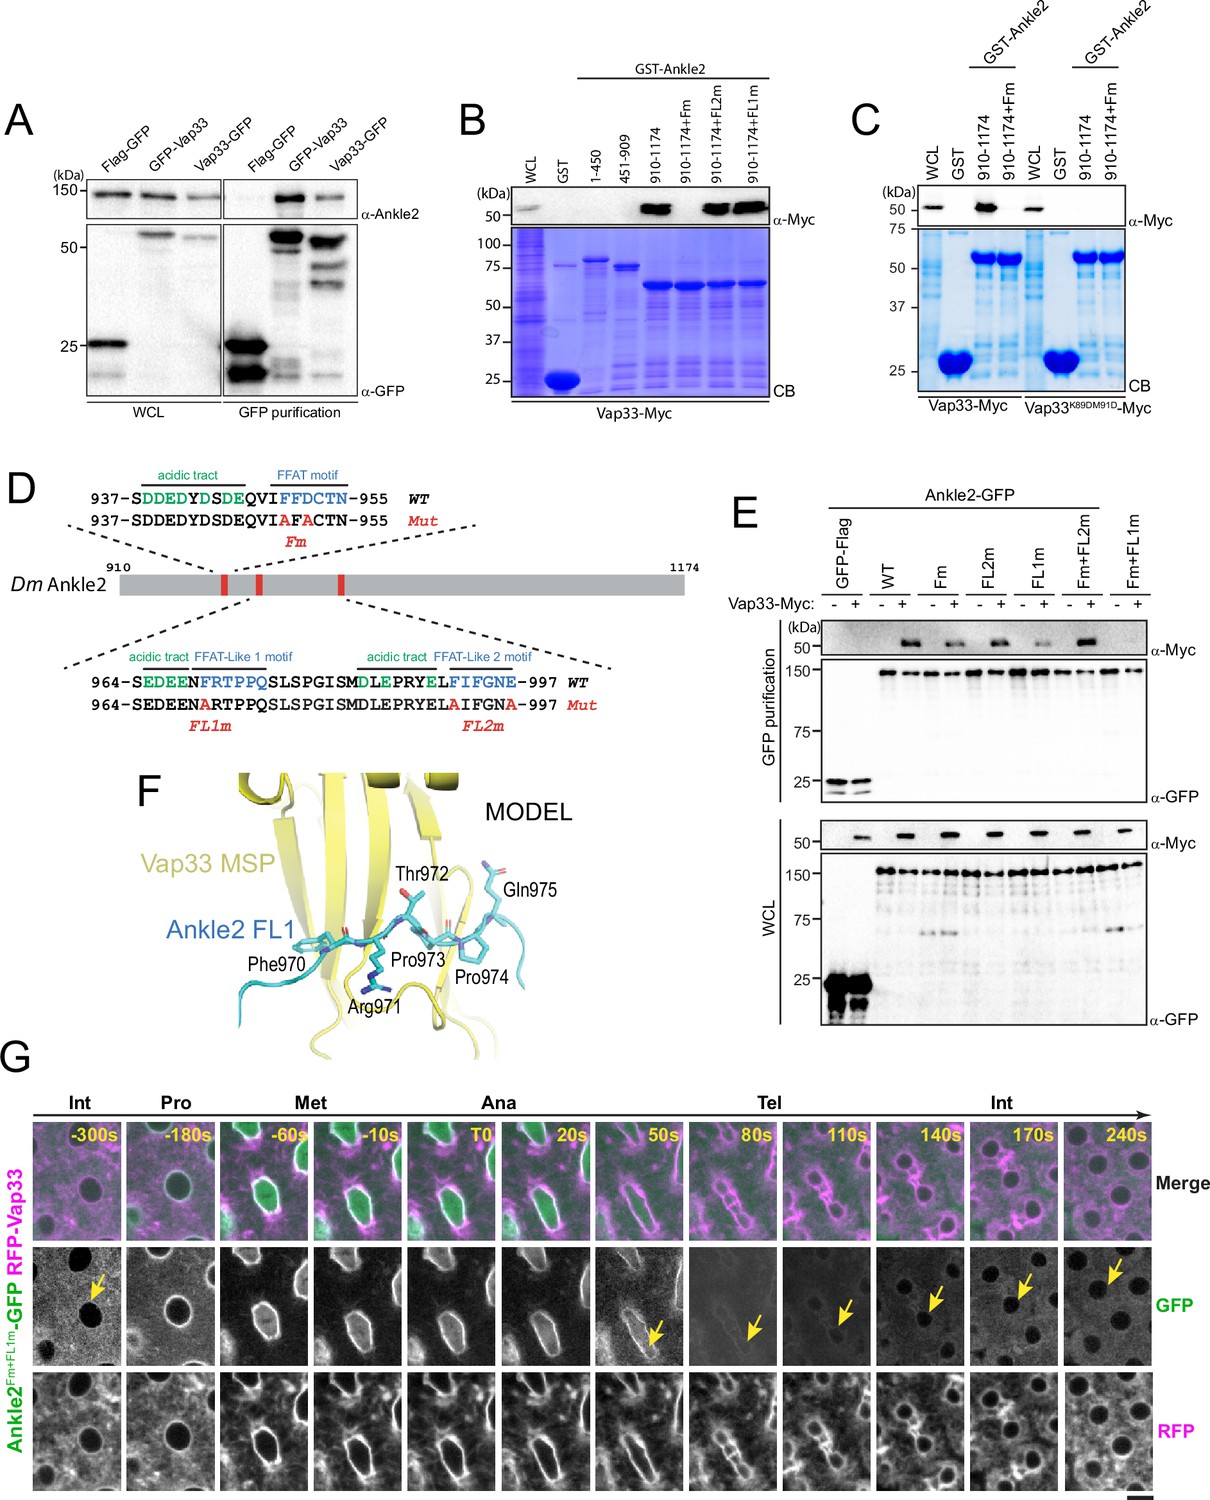
Ankle2 interacts with Vap33 through FFAT motifs.
(A) Cells were transfected with the indicated proteins and used in GFP affinity purifications. Products were analyzed by western blots. WCL: Whole cell extracts. (B, C) GST pulldown mapping Ankle2-Vap33 interaction. GST-fused fragments of Ankle2 (wild-type, WT or with the indicated mutations) produced in bacteria were used in GST-pulldowns with extracts from D-Mel cells expressing Vap33-Myc or Vap33DD-Myc. Pulldown products were analyzed by western blots. CB: Coomassie Blue. WCL: Whole cell extracts. (D) FFAT and FFAT-Like motifs identified (green) in the C-terminal end of Ankle2. Acidic residues are in blue. The mutations introduced (Fm, FL1m, and FL2m) are in red. (E) The FFAT and FFAT-Like 1 (FL1) motifs contribute to the interaction of Ankle2 with Vap33. Cells were transfected with the indicated proteins and used in GFP affinity purifications. Products were analyzed by western blots. (F) AlphaFold3 predicted a model of a complex between Drosophila Ankle2, Vap33, Mts, and PP2A-29B. The image shows a zoomed-in view of the contact between the MSP domain of Vap33 (yellow) and the FL1 motif of Ankle2 (blue). The full heterotetramer structure model is shown in Figure 4—figure supplement 1B. (G) The FFAT and FL1 motifs are required for co-localization with Vap33 during telophase and interphase. Video images of a syncytial embryo co-expressing Ankle2Fm+FL1m-GFP and RFP-Vap33 through different stages of the cell cycle. To be compared with Figure 3B. Note the delocalization of Ankle2Fm+FL1m-GFP at the nuclear envelope indicated by the yellow arrows. Scale bars: 5 μm.
-
Figure 4—source data 1
Figures with uncropped western blots annotated.
- https://cdn.elifesciences.org/articles/104233/elife-104233-fig4-data1-v1.zip
-
Figure 4—source data 2
Original files for western blots.
- https://cdn.elifesciences.org/articles/104233/elife-104233-fig4-data2-v1.zip
Figure 4—figure supplement 1
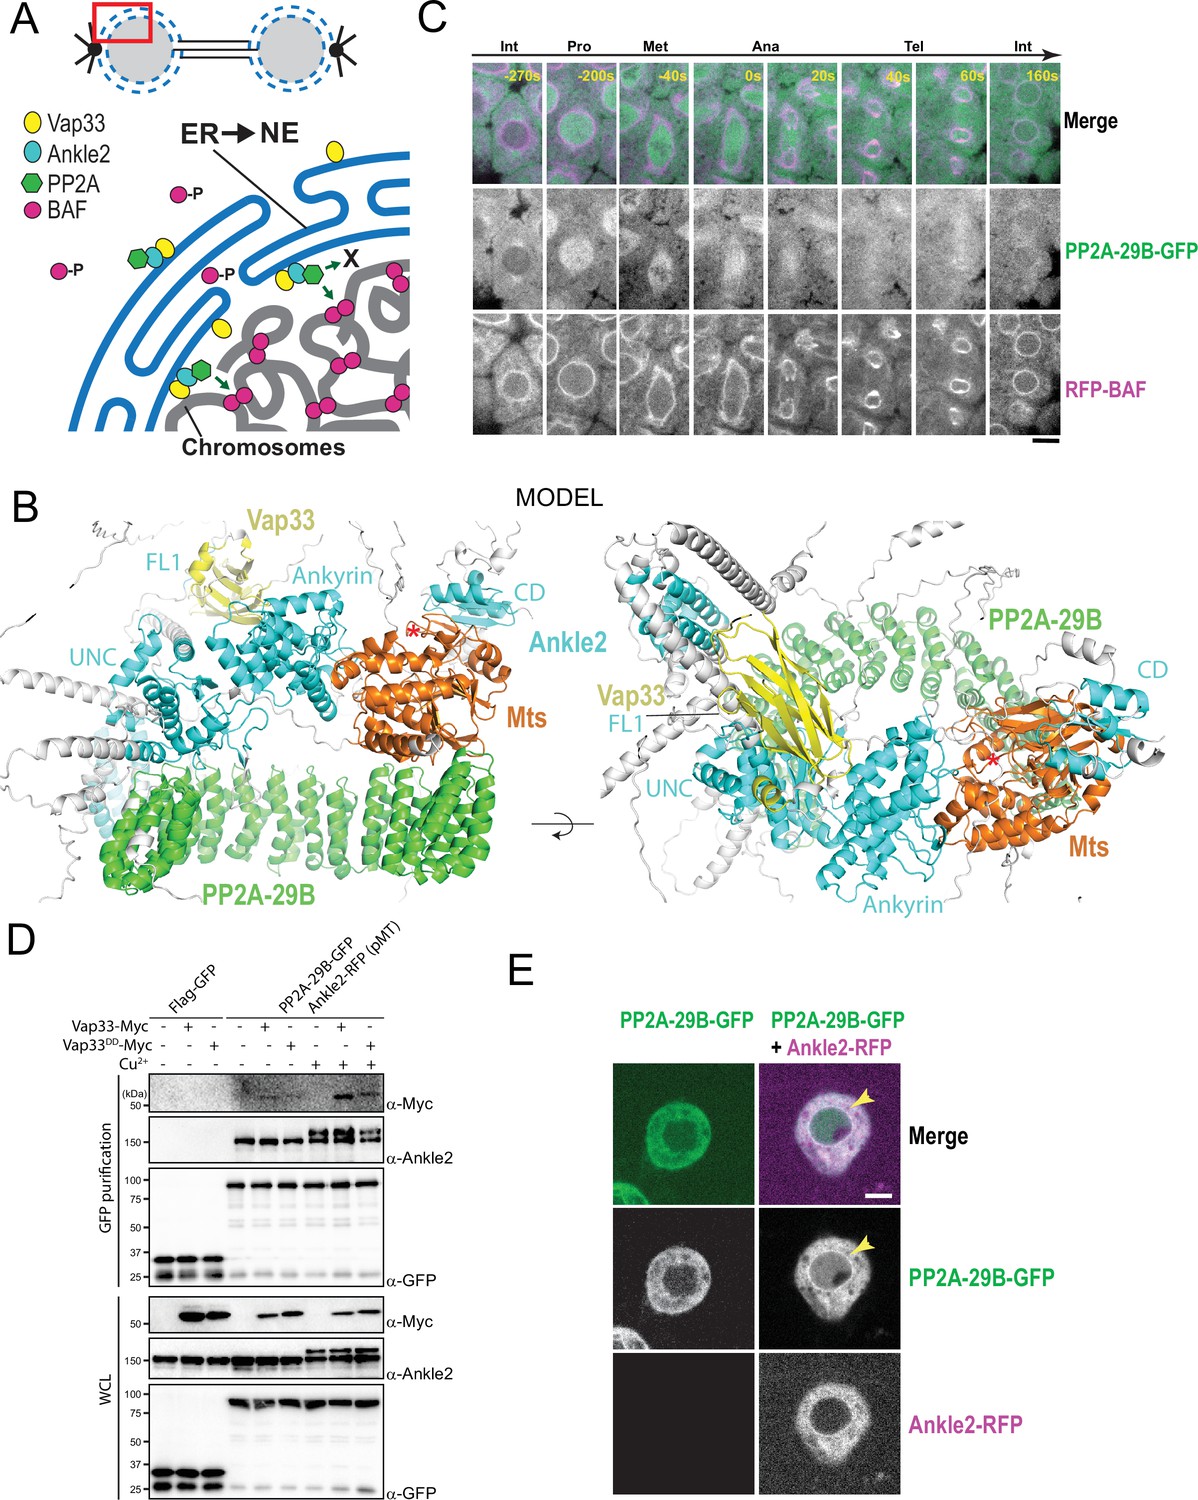
A Vap33-Ankle2-PP2A complex may promote nuclear reassembly in a localized manner.
(A) Hypothetical model discussed in the text. ER: Endoplasmic Reticulum; NE: Nuclear Envelope. (B) AlphaFold3 predicted model of a complex between Drosophila Ankle2, PP2A-29B, Mts, and Vap33. Residues with Cα confidence scores below 0.75 are coloured gray. Red asterisks denote the positions of the phosphatase catalytic site. (C) Imaging of a mitotic cycle in an embryo expressing PP2A-29B-GFP and RFP-BAF. Scale bar: 5 μm. (D) Overexpression of Ankle2-RFP enhances complex formation between Vap33-Myc and PP2A-29B-GFP. Cells were transfected to express the indicated proteins and submitted to GFP affinity purifications. Cu2+ was added to induce the expression of Ankle2-RFP (under the pMT promoter). Products were analyzed by western blotting. WCL: Whole cell extracts. (E) Overexpression of Ankle2-RFP enhances the localization of PP2A-29B-GFP to the nuclear envelope (arrows). Scale bars: 5 μm.
-
Figure 4—figure supplement 1—source data 1
Figures with uncropped western blots annotated.
- https://cdn.elifesciences.org/articles/104233/elife-104233-fig4-figsupp1-data1-v1.zip
-
Figure 4—figure supplement 1—source data 2
Original files for western blots.
- https://cdn.elifesciences.org/articles/104233/elife-104233-fig4-figsupp1-data2-v1.zip
Figure 5 with 3 supplements
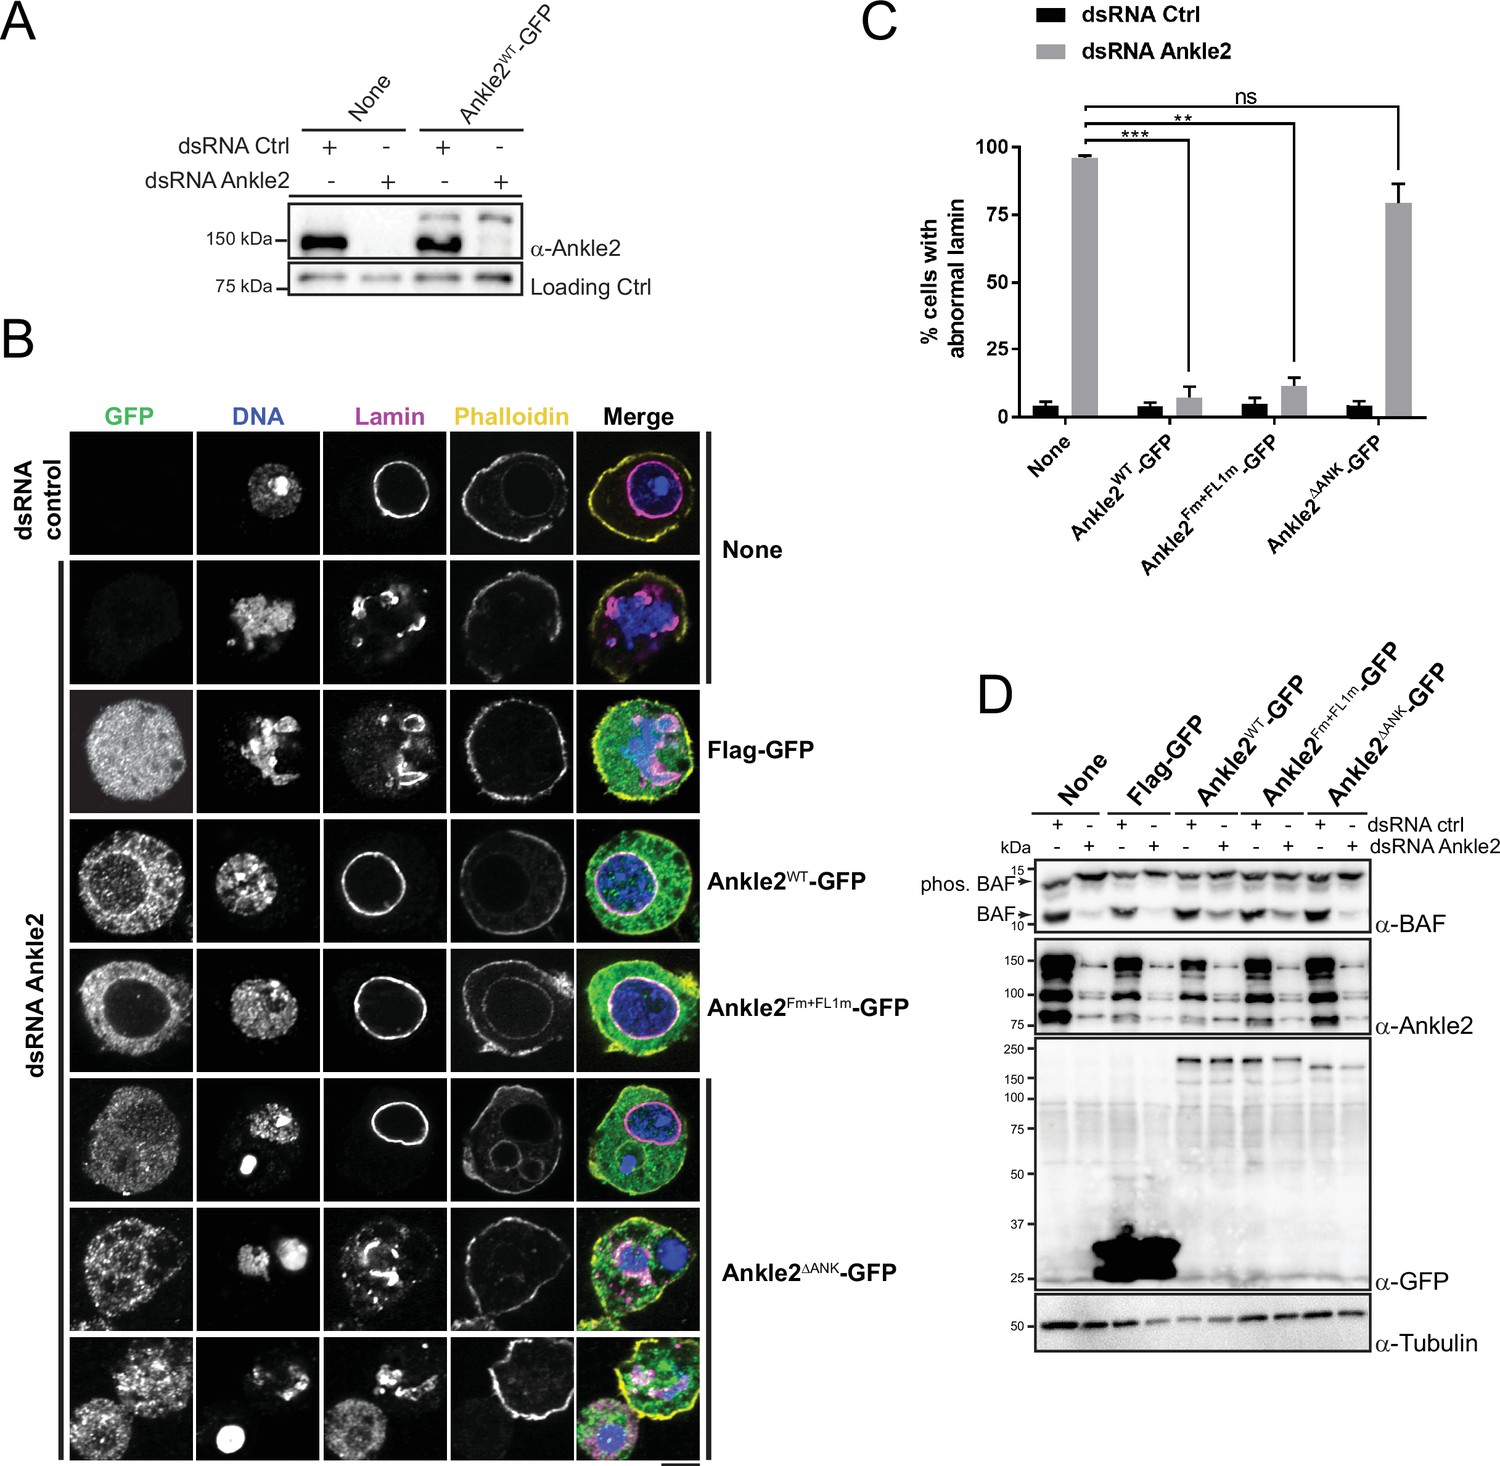
Ankle2 interaction with Protein Phosphatases 2A (PP2A) but not with Vap33 is required for nuclear reassembly.
(A) RNAi depletion of endogenous Ankle2 and simultaneous expression of RNAi-insensitive Ankle2-GFP. D-Mel cells expressing RNAi-insensitive Ankle2-GFP or not were transfected with dsRNA against Ankle2 or non-target dsRNA (NT, against bacterial KAN gene). Four days later, cells were analyzed by western blots. Non-specific band is used as the loading control. (B) Immunofluorescence on cells expressing the indicated proteins (right labels) and transfected with the indicated dsRNAs (left labels). GFP fluorescence, DAPI staining for DNA, Lamin (Lamin B) immunostaining, and Phalloidin staining for actin are shown. Red frames indicate the presence of nuclear reassembly defects. Scale bars: 5 μm. (C) Quantification of the abnormal Lamin phenotypes from experiments as in B. Note that Ankle2WT-GFP and Ankle2Fm+FL1m-GFP, but not Ankle2ΔANK-GFP, rescue nuclear defects. Averages of three experiments are shown. All error bars: S.D. **p<0.01, ***p<0.001, ns: non-significant from paired t-tests. (D) Western blot analysis of experiment shown in B, C. The blot at the top was obtained from a gel containing Phos-Tag to increase the resolution between phosphorylated BAF (phos. BAF) and unphosphorylated BAF (BAF). Note that BAF is hyperphosphorylated after Ankle2 depletion and that this is rescued by the expression of Ankle2WT-GFP and Ankle2Fm+FL1m-GFP, but not by Ankle2ΔANK-GFP. Numerical data are available in Figure 5—source data 1.
-
Figure 5—source data 1
Numerical data is used to make graphs.
- https://cdn.elifesciences.org/articles/104233/elife-104233-fig5-data1-v1.xlsx
-
Figure 5—source data 2
Figures with uncropped western blots annotated.
- https://cdn.elifesciences.org/articles/104233/elife-104233-fig5-data2-v1.zip
-
Figure 5—source data 3
Original files for western blots.
- https://cdn.elifesciences.org/articles/104233/elife-104233-fig5-data3-v1.zip
Figure 5—figure supplement 1
Results of rescue experiments in D-Mel cells in culture.
Endogenous Ankle2 was depleted by RNAi and RNAi-insensitive Ankle2-GFP variants were simultaneously expressed as in Figure 6. D-Mel cells expressing RNAi-insensitive Ankle2-GFP variants or not were transfected with dsRNA against Ankle2 or non-target dsRNA (NT, against bacterial KAN gene). (A) Western blot analyses showing expression of the different variants of Ankle2-GFP. α-Tubulin: loading control. (B) Quantification of the abnormal Lamin phenotypes from rescue experiments (Top). Western blots (Bottom) were obtained from a gel containing Phos-Tag to increase the resolution between phosphorylated BAF (phos. BAF) and unphosphorylated BAF (BAF). Averages of 3 experiments are shown. All error bars: S.D. *p<0.05, **p<0.01, ***p<0.001 ****p<0.0001, ns: non-significant from paired t-tests. Numerical data are available in Figure 5—figure supplement 1—source data 1.
-
Figure 5—figure supplement 1—source data 1
Numerical data is used to make graphs.
- https://cdn.elifesciences.org/articles/104233/elife-104233-fig5-figsupp1-data1-v1.xlsx
-
Figure 5—figure supplement 1—source data 2
Figures with uncropped western blots annotated.
- https://cdn.elifesciences.org/articles/104233/elife-104233-fig5-figsupp1-data2-v1.zip
-
Figure 5—figure supplement 1—source data 3
Original files for western blots.
- https://cdn.elifesciences.org/articles/104233/elife-104233-fig5-figsupp1-data3-v1.zip
Figure 5—figure supplement 2
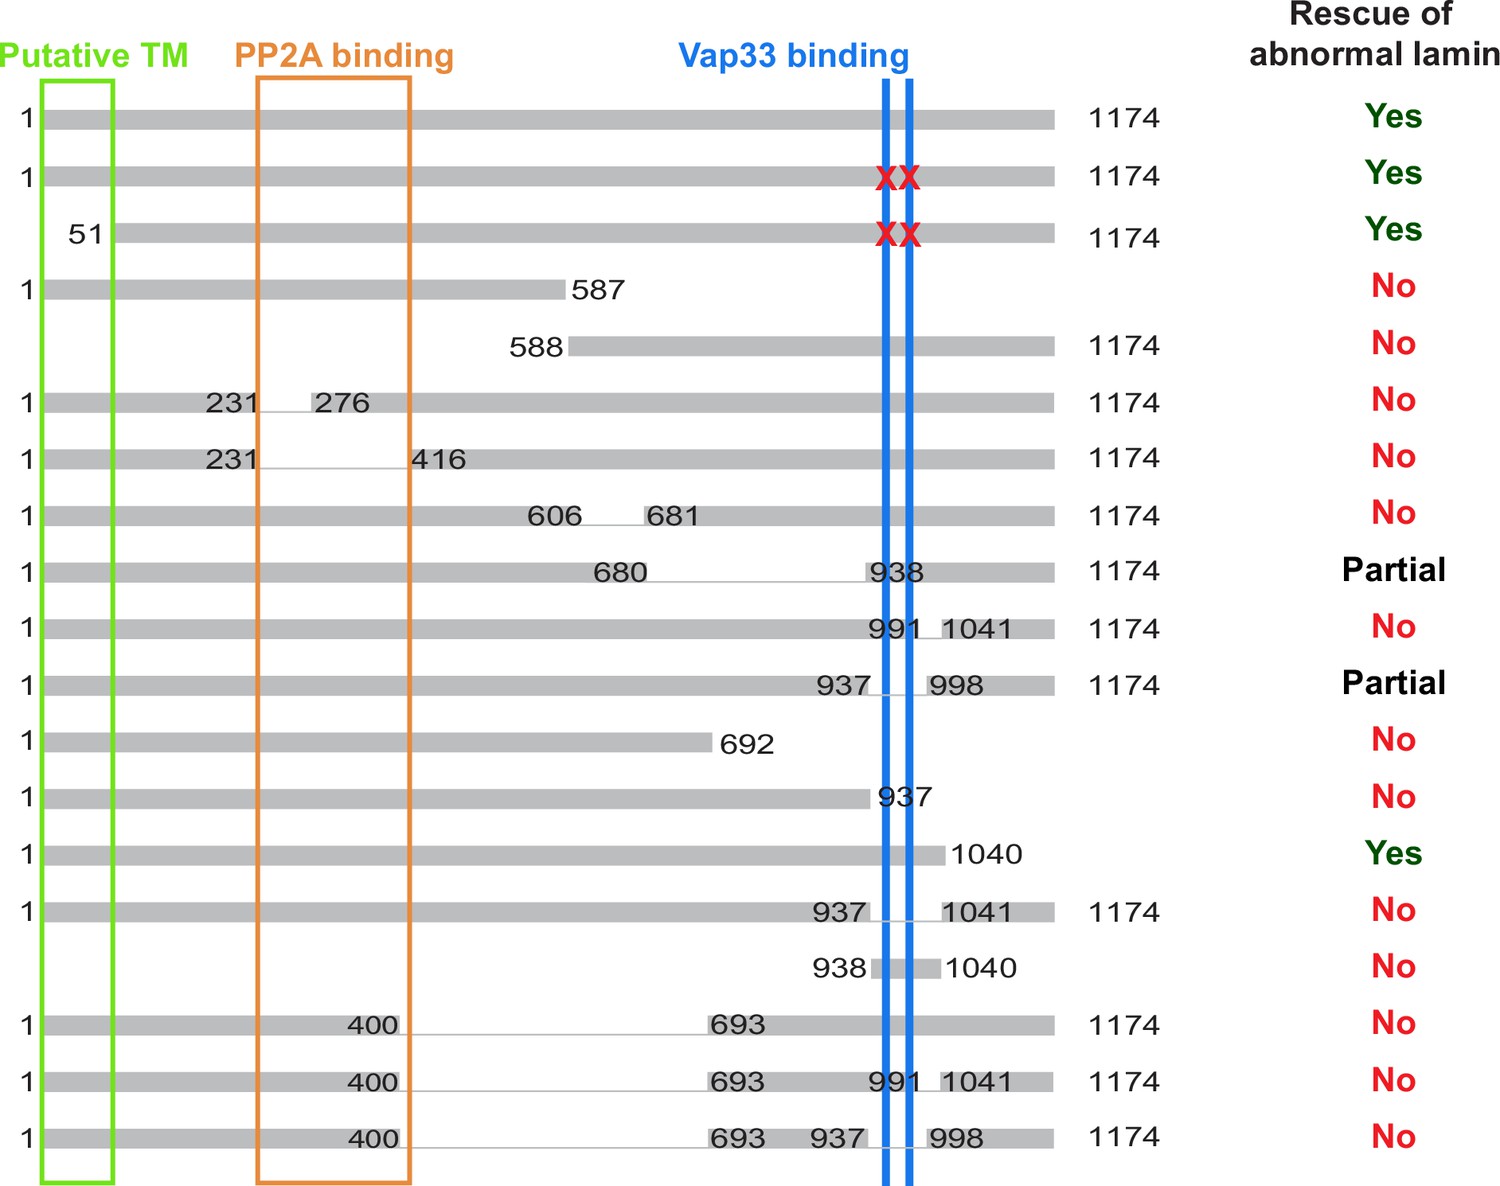
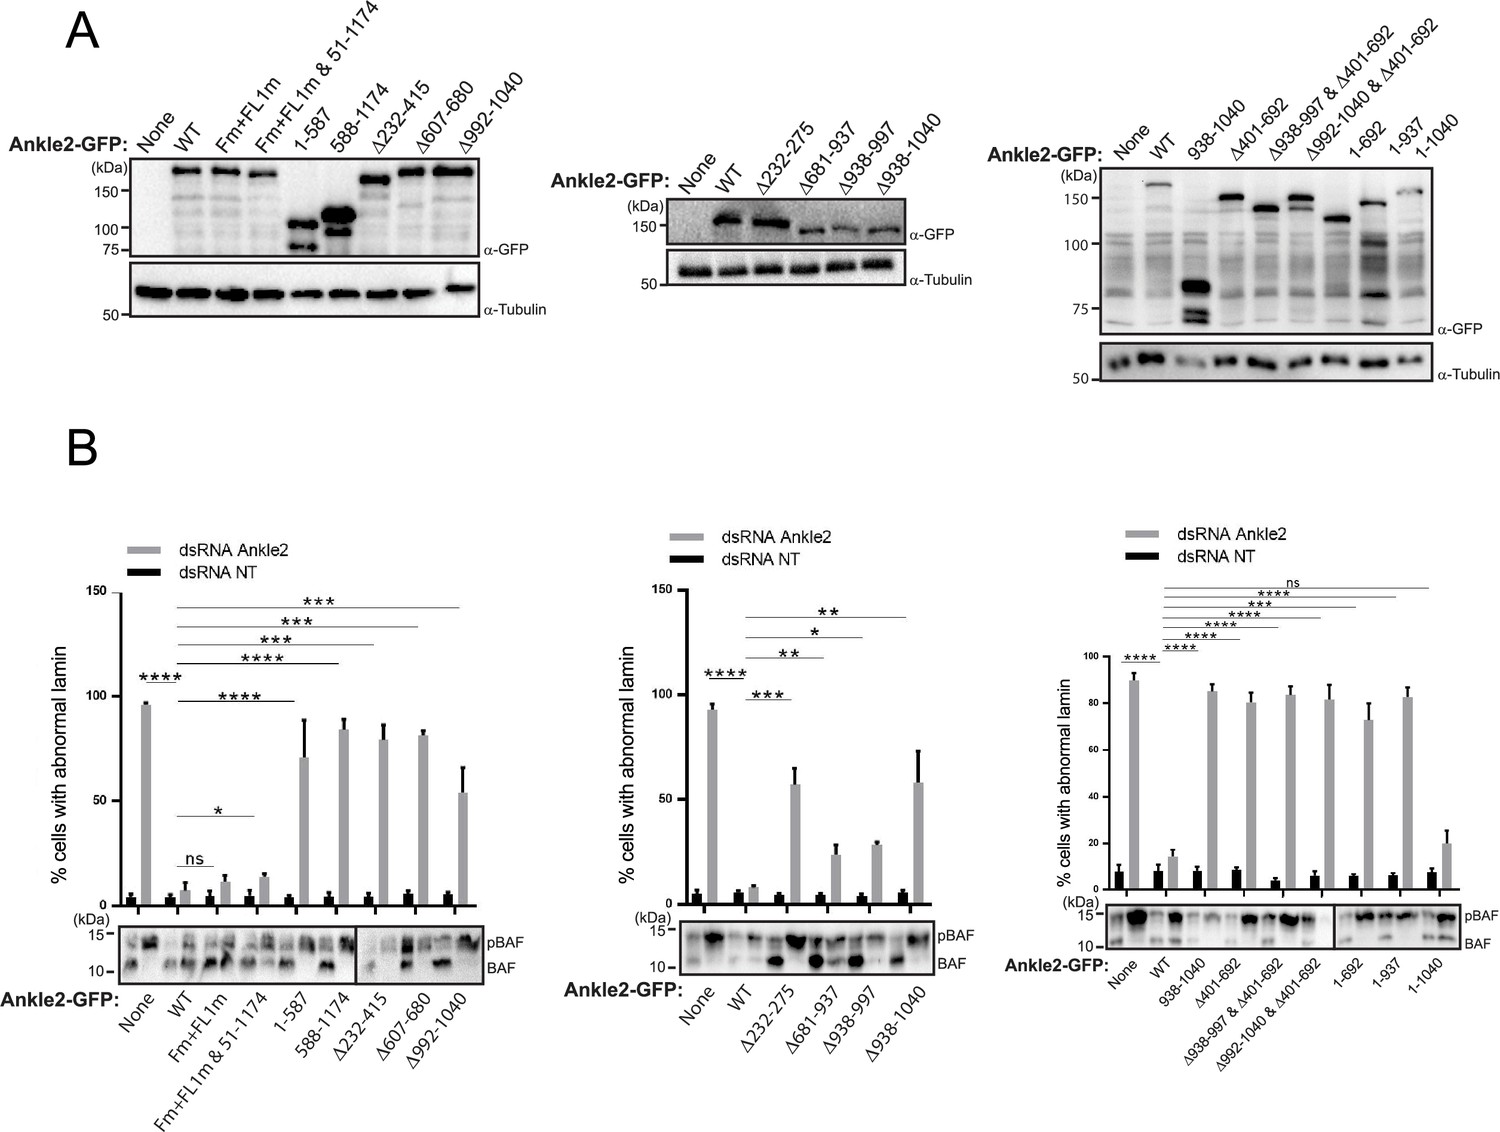
Summary of results for various deletion mutants of Ankle2-GFP assessed for their ability to rescue abnormal Lamin phenotypes.
Regions of interest discussed in the text are indicated with colored boxes. Red Xs: mutations of FFAT and FFAT-Like 1 Vap33 binding motifs.
Figure 5—figure supplement 3
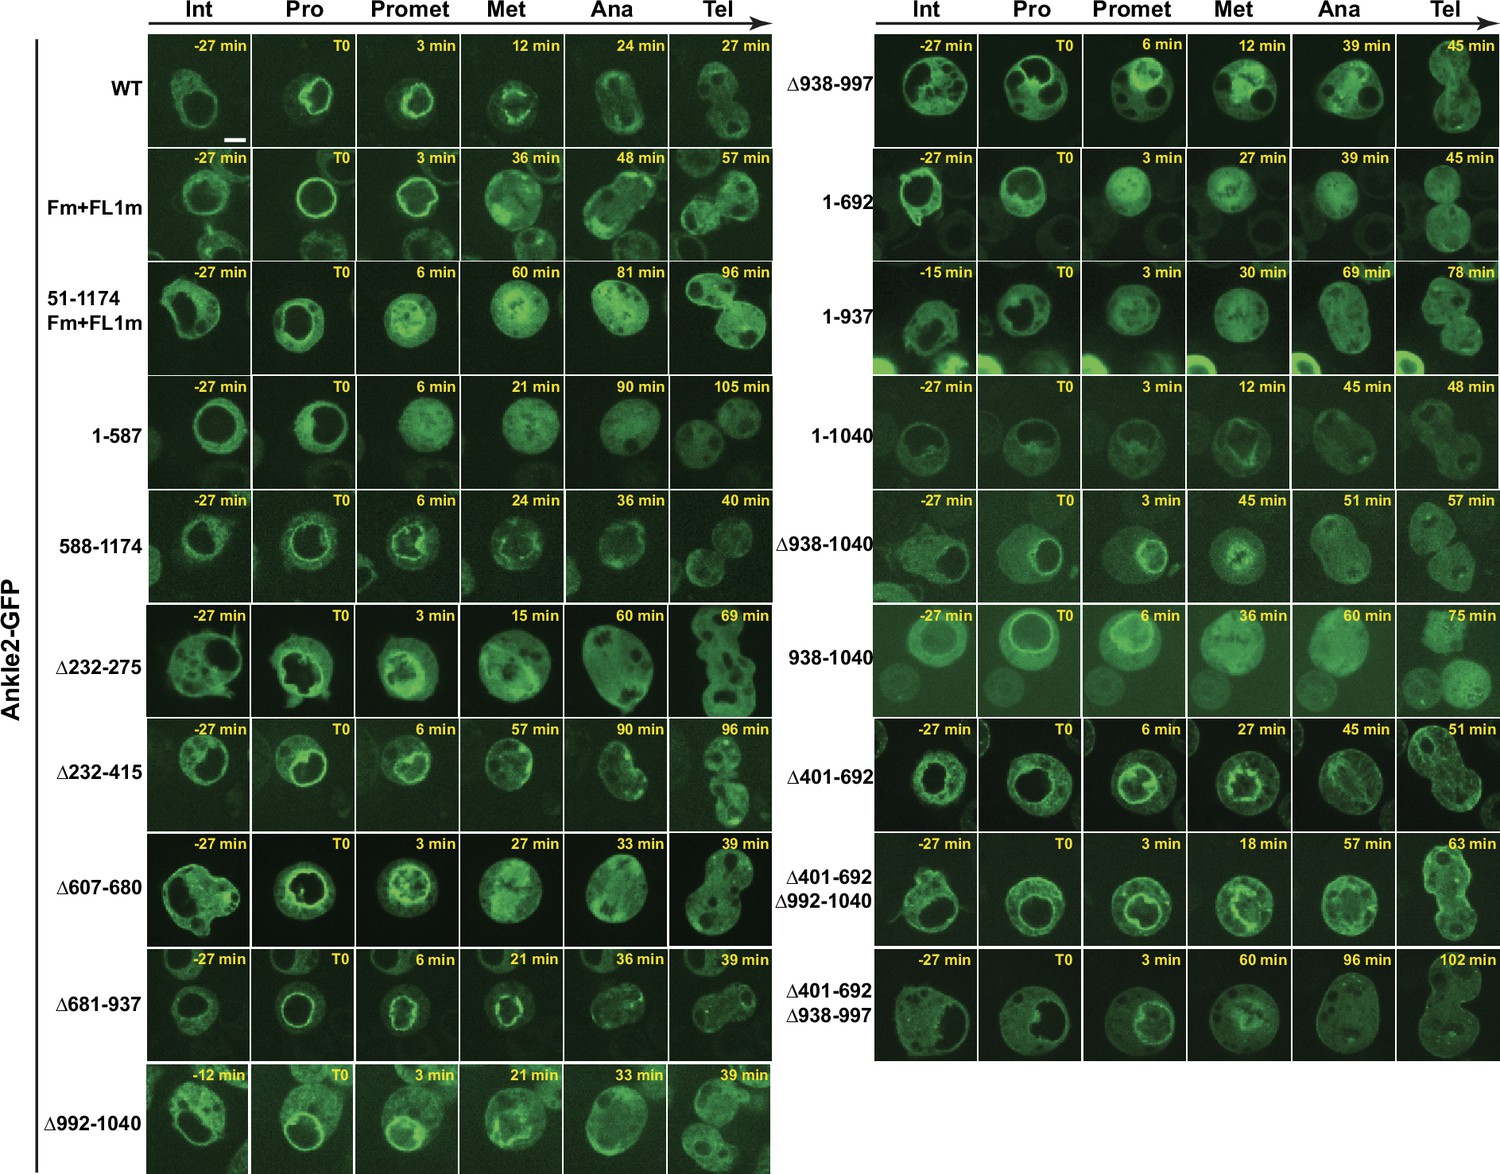
Localization of Ankle2-GFP variants during the cell cycle in D-Mel cells.
Cells were imaged on a confocal microscope. Representative images of different stages of the mitotic cycle are shown. Int: Interphase; Pro: Prophase; Promet: Prometaphase; Met: Metaphase; Ana: Anaphase; Tel: Telophase. Scale bar: 5 μm.
Figure 6 with 2 supplements
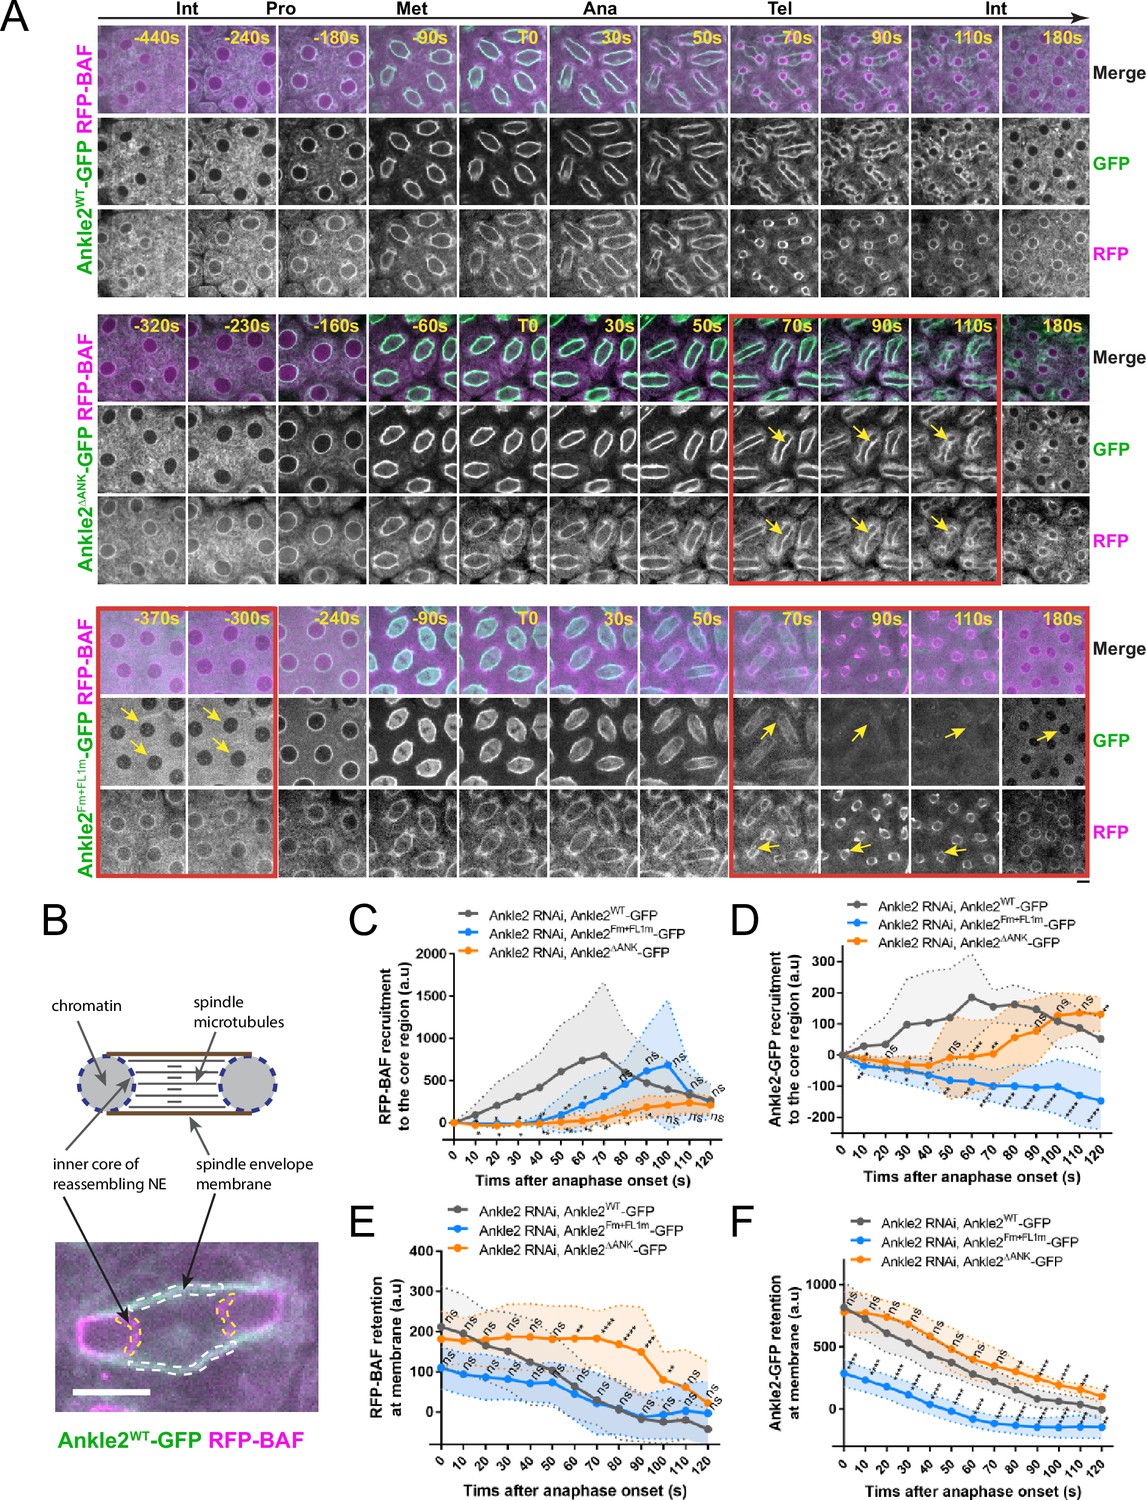
Ankle2 interactions with Protein Phosphatases 2A (PP2A) and Vap33 promote BAF recruitment at reassembling nuclei.
(A) Syncytial embryos depleted of endogenous Ankle2 and expressing RNAi-insensitive Ankle2WT-GFP (top), Ankle2ΔANK-GFP (middle), or Ankle2Fm+FL1m-GFP (bottom) along with RFP-BAF were imaged through the cell cycle. Times frames where differences are the most pronounced are highlighted by red frames, along with yellow arrows. (B) Illustration of fluorescence quantifications at specific structures. GFP and RFP fluorescence intensities were quantified at the inner core region of the reassembling nuclei and at the spindle envelope membranes after anaphase. (C, D) Quantification of the recruitment of RFP-BAF (C) or Ankle2-GFP variants (D) at the inner core region of the reassembling nuclei as a function of time after anaphase onset. (E, F) Quantification of the retention of RFP-BAF (E) or Ankle2-GFP variants (F) at the lateral spindle envelope membranes as a function of time after anaphase onset. Averages of fluorescence intensity from 10 nuclear divisions taken from 5 or 6 embryos are shown per condition. All error bars: S.D. *p<0.05, **p<0.01, ***p<0.001 **** p<0.0001, ns: non-significant from unpaired t-tests. Scale bars: 5 μm. Numerical data are available in Figure 6—source data 1.
-
Figure 6—source data 1
Numerical data is used to make graphs.
- https://cdn.elifesciences.org/articles/104233/elife-104233-fig6-data1-v1.xlsx
Figure 6—figure supplement 1

Female germline expression of Ankle2-GFP variants in transgenic lines.
Expression of UASp-Ankle2-GFP WT, ΔANK, or Fm +FL1 m (RNAi insensitive) was induced using the matα4-GAL-VP16 driver. Ankle2 RNAi (line BDSC 77437) was also induced using by the same driver. Western blots from ovaries, probing for GFP, Ankle2, and Actin, show relative expression levels.
-
Figure 6—figure supplement 1—source data 1
Figures with uncropped western blots annotated.
- https://cdn.elifesciences.org/articles/104233/elife-104233-fig6-figsupp1-data1-v1.zip
-
Figure 6—figure supplement 1—source data 2
Original files for western blots and gels.
- https://cdn.elifesciences.org/articles/104233/elife-104233-fig6-figsupp1-data2-v1.zip
Figure 6—figure supplement 2
Quantifications in embryos.
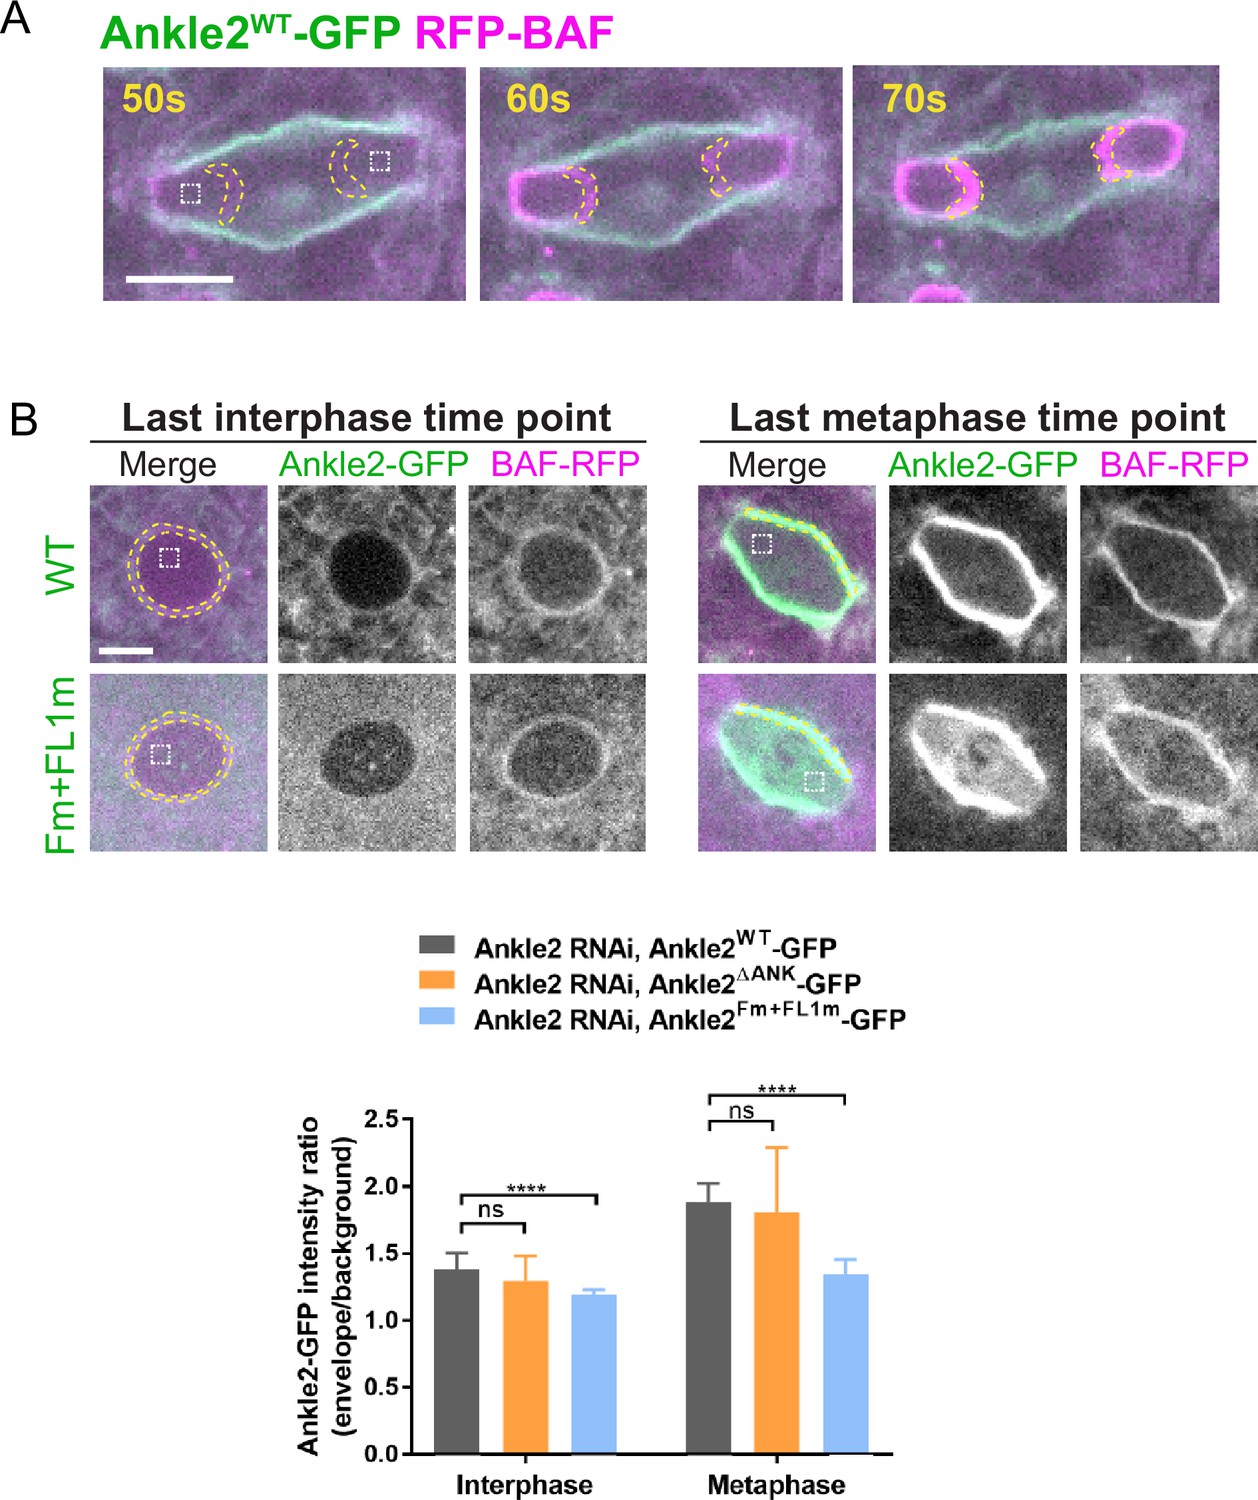
(A) Illustration of the quantification of fluorescence intensities at the inner core region of the reassembling nuclear envelope (NE) in embryos expressing Ankle2-GFP and RFP-BAF. Inner core regions correspond to the area within the dotted lines where RFP-BAF is recruited in telophase. For each nuclear division quantified, the average of mean intensities from both inner core regions was calculated for each time point. (B) Interaction of Ankle2 with Vap33 promotes Ankle2 localization during mitosis. Top: Quantification of fluorescence intensities of Ankle2-GFP (wild-type, WT or Fm +FLm1) at the NE and spindle envelope at the last time points in interphase and metaphase, respectively. Mean intensities of Ankle2-GFP at the NE delineated based on RFP-BAF localization were measured (inside the yellow dotted line) in interphase. Fluorescence inside the nucleus was measured as the background (white dotted boxes). For metaphase, mean intensities of Ankle2-GFP in the lateral spindle envelope (inside yellow dotted lines) and within spindles (white dotted boxes, background) were measured. Bottom: ratios of Ankle2-GFP (WT, Fm +FLm1, ΔANK) at the membranes relative to backgrounds in interphase and metaphase. 15 nuclear divisions from five to six embryos were quantified for each genotype. All scale bars: 5 μm. ***p<0.001, n.s: non-significant (p>0.05) from unpaired t-tests with Welch’s correction. Numerical data are available in Figure 6—figure supplement 2—source data 1.
-
Figure 6—figure supplement 2—source data 1
Numerical data is used to make graphs.
- https://cdn.elifesciences.org/articles/104233/elife-104233-fig6-figsupp2-data1-v1.xlsx
Figure 7 with 1 supplement
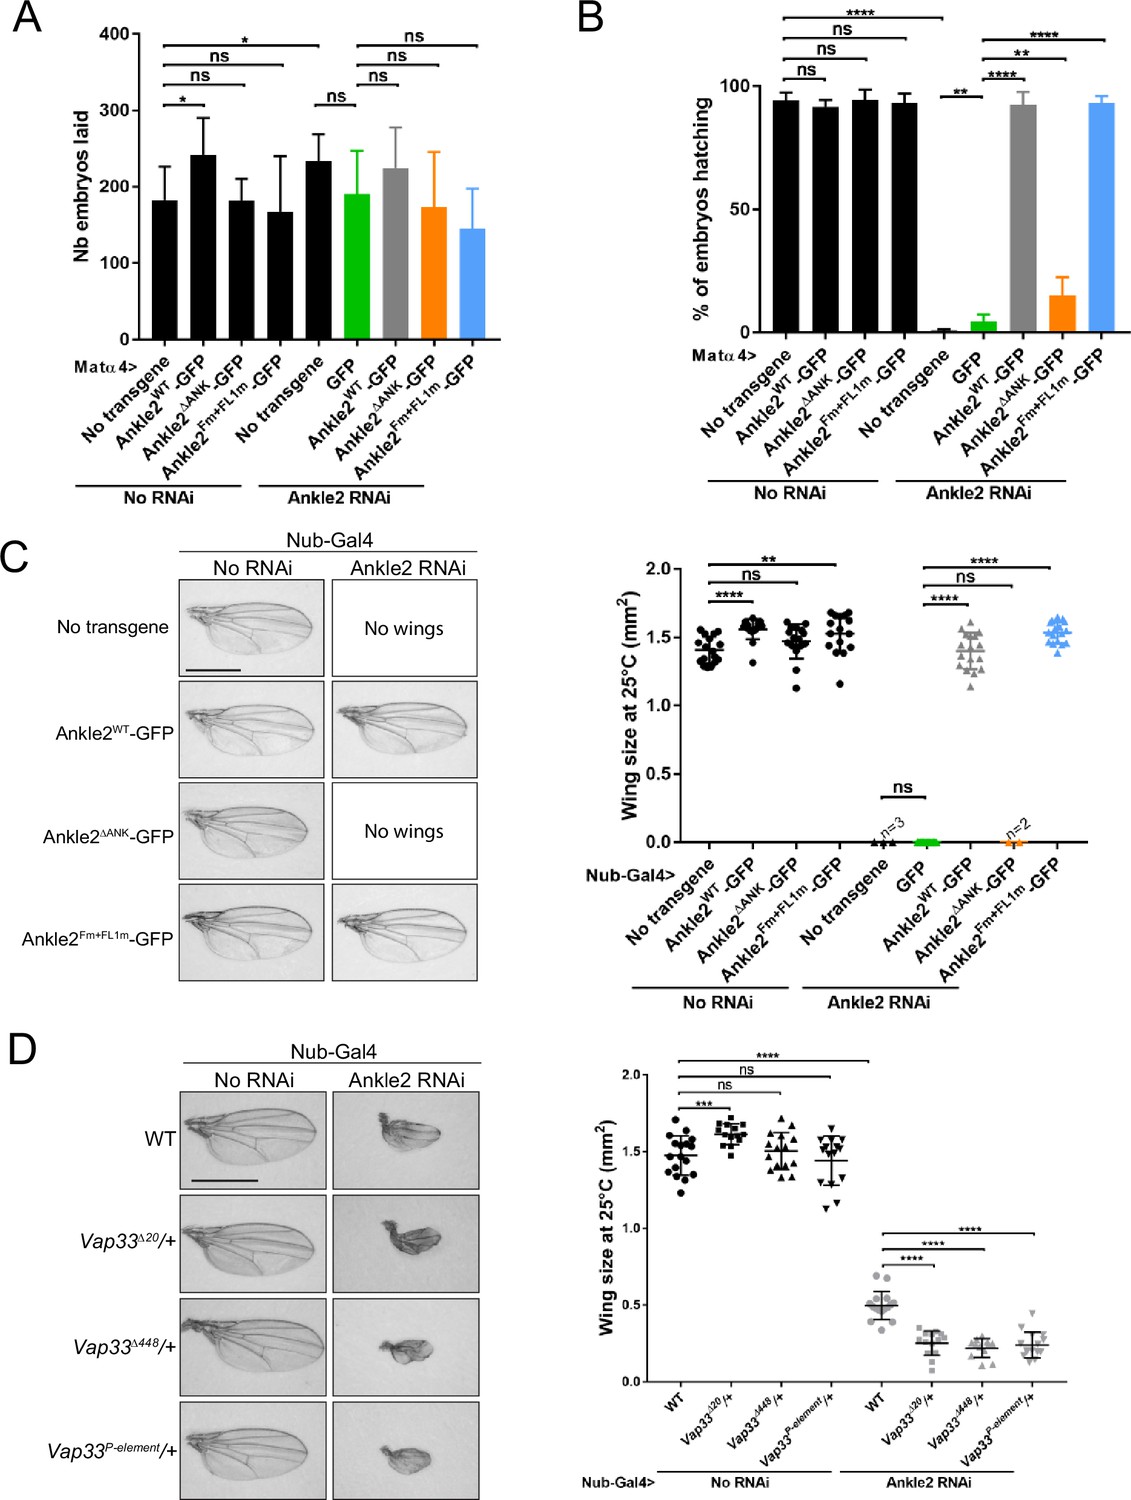
Ankle2 interaction with Protein Phosphatases 2A (PP2A) but not with Vap33 is required for development.
(A) Number of embryos laid over three days per female of the indicated genotypes. (B) Percentage of embryos hatching per female of the indicated genotypes. In A-B, the Ankle2 RNAi insertion from line BDSC 77437 was used to deplete endogenous Ankle2 during oogenesis using the maternal matα4-GAL-VP16 driver and RNAi-resistant Ankle2-GFP variants were simultaneously expressed. (C) Wing development phenotypes from flies of the indicated genotypes. The Ankle2 RNAi insertion from line BDSC 77437 was used to deplete endogenous Ankle2 in the wing pouch using Nub-Gal4 and RNAi-resistant Ankle2-GFP variants were simultaneously expressed at 25 °C. Left: Examples of wings. Right: Quantification of wing size. (D) Mutations in Vap33 enhance a small-wing phenotype caused by Ankle2 depletion. The weaker Ankle2 RNAi insertion from line VDRC100665 was used to deplete endogenous Ankle2 in the wing pouch using Nub-Gal4. Left: Examples of wings. Right: Quantification of wing size at 25 °C. Averages of 12–17 wings are shown. All error bars: S.D. *p<0.05, **p<0.01, ***<0.001 ****p<0.0001, ns: non-significant from paired t-tests with Welch’s correction. Scale bars: 1 mm. Numerical data are available in Figure 7—source data 1.
-
Figure 7—source data 1
Numerical data is used to make graphs.
- https://cdn.elifesciences.org/articles/104233/elife-104233-fig7-data1-v1.xlsx
Figure 7—figure supplement 1
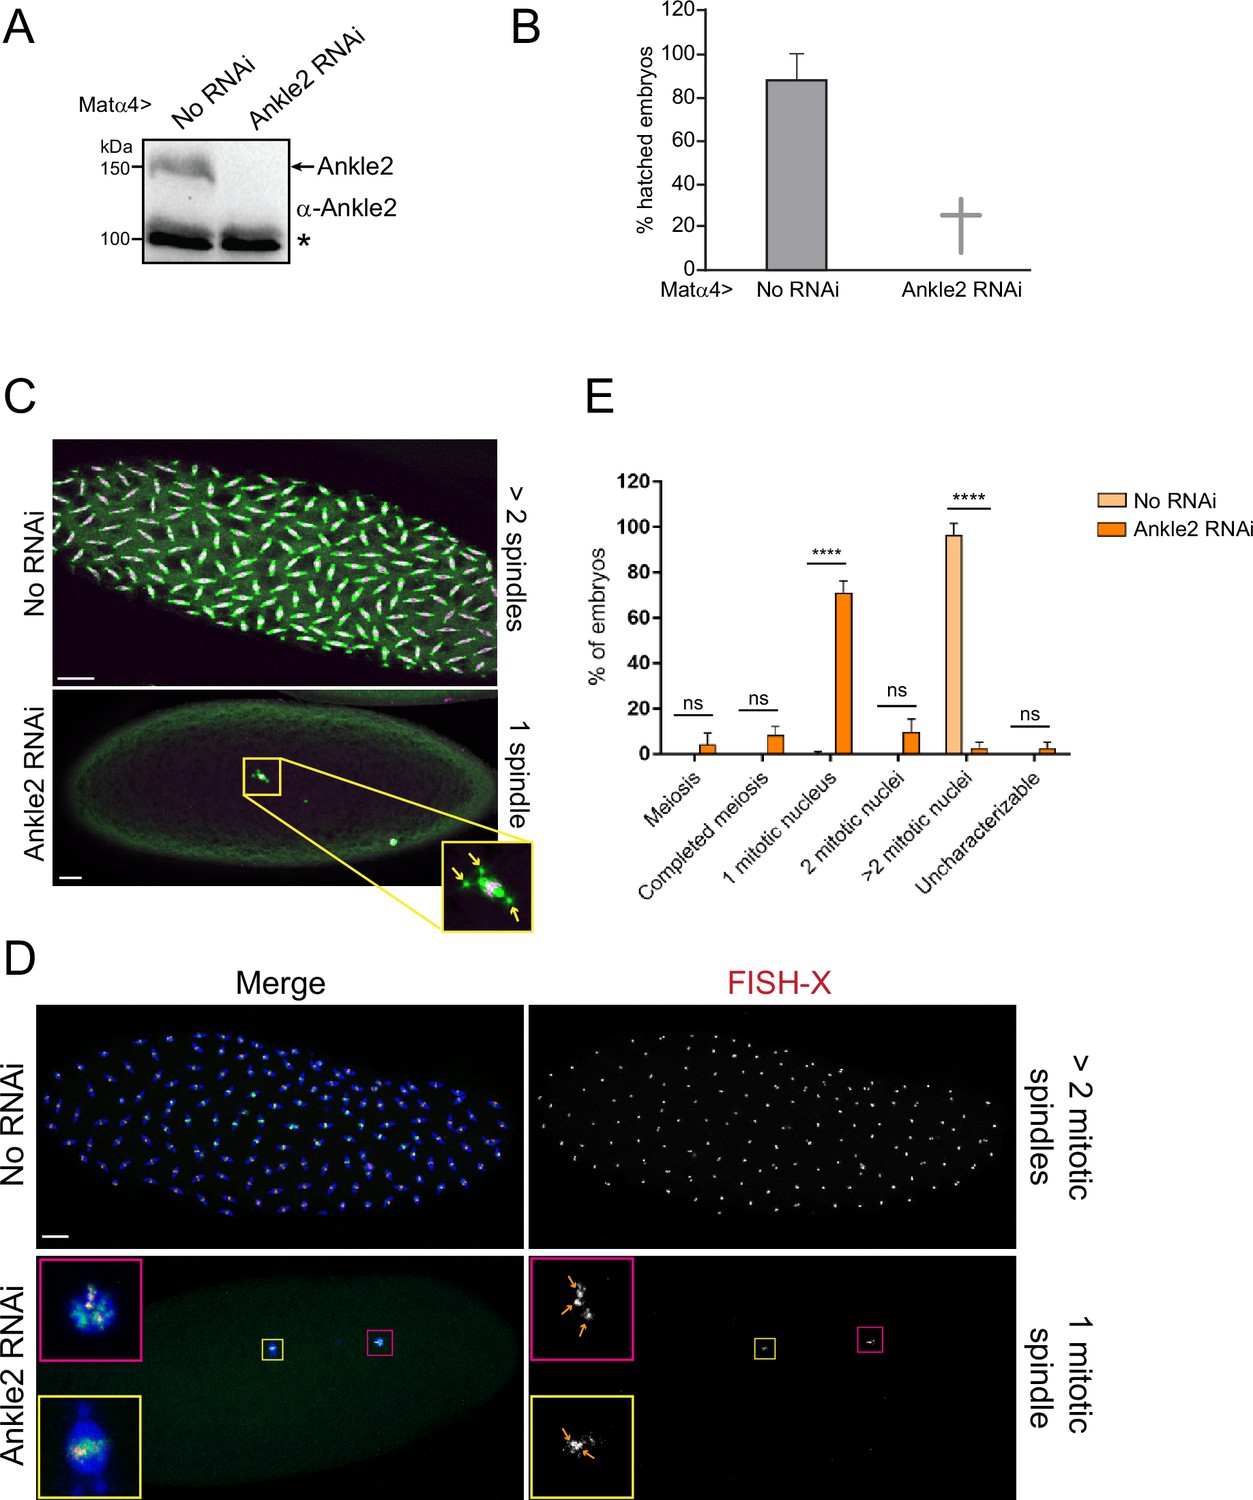
Phenotypes resulting from RNAi depletion of Ankle2 during oogenesis.
Ankle2 RNAi (line BDSC77437) was using the matα4-GAL-VP16 driver. (A) Western blot from ovaries showing Ankle2 depletion. The asterisk indicates a non-specific band used as the loading control. (B) Embryos fail to hatch after Ankle2 RNAi. Averages of three independent experiments are shown. Error bar: S.D. (C) Representative phenotypes of embryos examined by immunofluorescence. Green: α-Tubulin; magenta: histone. Arrows indicate centrosomes, confirming that the spindle is in mitosis and not female meiosis. (D) Embryos were examined by Fluorescence in situ hybridization (FISH) to reveal the X-chromosome and immunofluorescence for α-Tubulin (blue) and DNA (green). Quantification of embryonic phenotypes. Yellow box: mitotic spindle; pink box: polar body. Enlarged insets are shown on the left. Arrows: X-chromosome foci. (E) Quantification of the embryonic phenotypes using images as in D. Numbers are averages of three independent experiments. At least 50 embryos were scored in each replicate. Error bars: S.D. ****p<0.0001. ns: non-significant from unpaired t-tests. Scale bars: 20 μm. Numerical data are available in Figure 7—figure supplement 1—source data 1.
-
Figure 7—figure supplement 1—source data 1
Numerical data is used to make graphs.
- https://cdn.elifesciences.org/articles/104233/elife-104233-fig7-figsupp1-data1-v1.xlsx
-
Figure 7—figure supplement 1—source data 2
Figure with uncropped western blot annotated.
- https://cdn.elifesciences.org/articles/104233/elife-104233-fig7-figsupp1-data2-v1.zip
-
Figure 7—figure supplement 1—source data 3
Original file for western blot.
- https://cdn.elifesciences.org/articles/104233/elife-104233-fig7-figsupp1-data3-v1.zip
Videos
Video 1
Localization of Ankle2-RFP and GFP-Vap33 during mitosis and cytokinesis in a D-Mel cell.
Orthogonal maximum intensity projection of 4 z-sections spaced by 1 μm. Images were taken every 205 s. Scale bar: 5 μm.
Video 2
Localization of Ankle2-GFP and RFP-Vap33 during the cell cycle in a syncytial embryo.
A single plane is shown. Images were taken every 10 s. Scale bar: 5 μm.
Video 3
Localization of Ankle2Fm+FL1m-GFP and RFP-Vap33 during the cell cycle in a syncytial embryo.
A single plane is shown. Images were taken every 10 s. Scale bar: 5 μm.
Video 4
Localization of Ankle2WT-GFP and RFP-BAF during the cell cycle in a syncytial embryo where endogenous is depleted by RNAi.
A single plane is shown. Images were taken every 10 s. Scale bar: 5 μm.
Video 5
Localization of Ankle2ΔANK-GFP and RFP-BAF during the cell cycle in a syncytial embryo where endogenous is depleted by RNAi.
A single plane is shown. Images were taken every 10 s. Scale bar: 5 μm.
Video 6
Localization of Ankle2Fm+FL1m-GFP and RFP-BAF during the cell cycle in a syncytial embryo where endogenous is depleted by RNAi.
A single plane is shown. Images were taken every 10 s. Scale bar: 5 μm.
Additional files
Download links
A two-part list of links to download the article, or parts of the article, in various formats.
Downloads (link to download the article as PDF)
Open citations (links to open the citations from this article in various online reference manager services)
Cite this article (links to download the citations from this article in formats compatible with various reference manager tools)
Mechanisms of PP2A-Ankle2 dependent nuclear reassembly after mitosis
eLife 13:RP104233.
https://doi.org/10.7554/eLife.104233.3


