SFSWAP is a negative regulator of OGT intron detention and global pre-mRNA splicing
- Department of Microbiology, University of Texas Southwestern Medical Center, United States
Figures
Figure 1
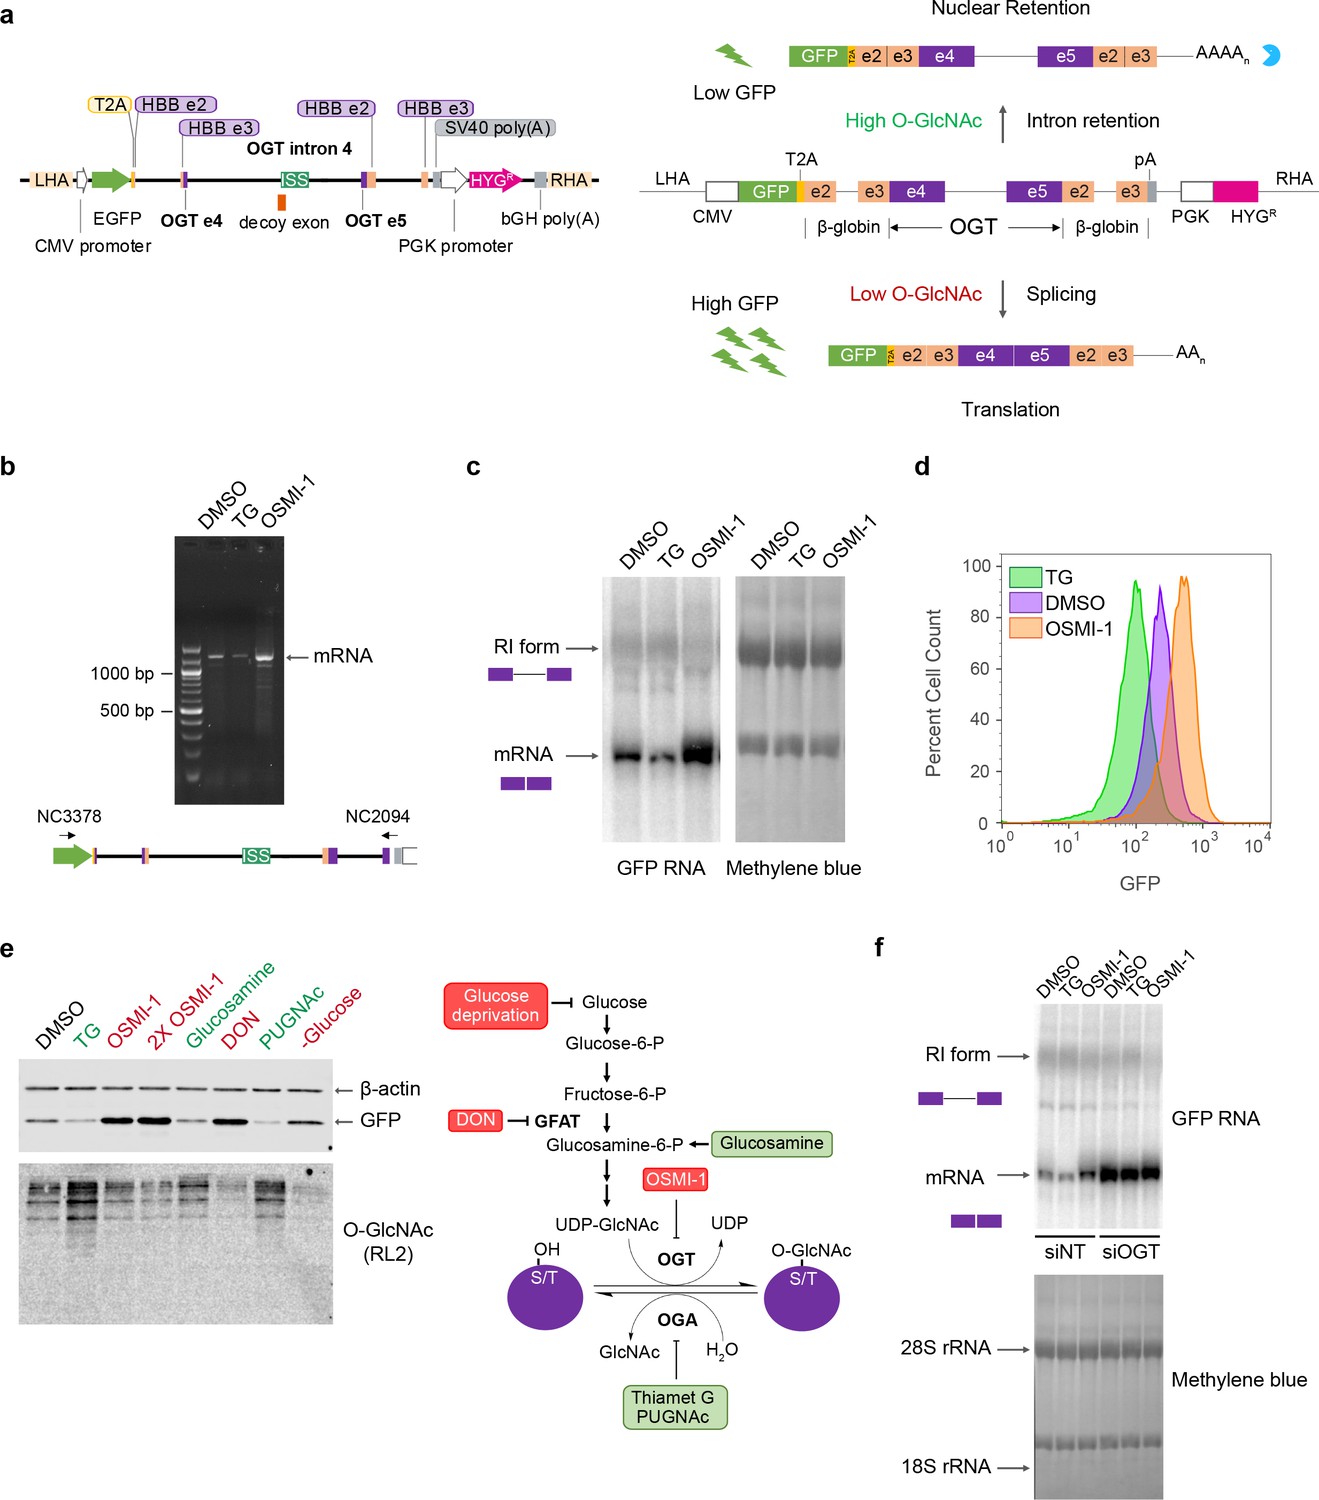
Construction of an O-GlcNAc responsive GFP biosensor.
(a) Schematic of the GFP reporter (left, drawn to scale) and predicted changes in reporter splicing and expression upon varying cellular O-GlcNAc conditions (right). ISS – intronic splicing silencer; LHA – left homology arm; RHA – right homology arm; HBB – hemoglobin subunit β; PGK – phosphoglycerokinase; CMV – cytomegalovirus; bGH – bovine growth hormone; SV40 – Simian virus 40. (b) Semi-quantitative RT-PCR of RNA isolated from the reporter line under different treatment conditions using DNA primers (NC3378 and NC2094) that hybridize within the GFP ORF and just upstream of the polyadenylation signal sequence as shown below. The PCR conditions make it unlikely to detect the full-length detained intron isoform, so only the mRNA is observed. (c) Northern blot analysis of total RNA isolated from the reporter line after treatment with either DMSO, 1 μM TG or 10 μM OSMI-1 for 6 hr. The blot was probed for GFP. The retained intron band is heterogeneous and difficult to discern clearly due to its co-migration with the large ribosomal RNA. Methylene blue stain of the blot (right) is shown as a loading control. (d) GFP fluorescence levels of the reporter line as measured by flow cytometry after treatment with DMSO, TG, or OSMI-1 for 24 hr. (e) Validation of GFP reporter protein levels by western blot analysis after treatment of the reporter line with various modulators of cellular O-GlcNAc levels (left). Steps in the hexosamine biosynthesis pathway targeted by the modulators are shown on the right. Treatment with modulators indicated in red are expected to lead to reduced cellular O-GlcNAc levels, while treatment with those indicated in green are expected to lead to increased cellular O-GlcNAc levels. A broad specificity O-GlcNAc antibody (RL2) and β-actin are used as controls. (f) Northern blot analysis of RNA isolated from either 30 nM non-target (siNT) or OGT-specific (siOGT) siRNA-treated reporter line. Cells were treated for 6 hr with DMSO, TG, or OSMI-1 3 days after siRNA treatment. The blot was probed for GFP as above.
-
Figure 1—source data 1
Agarose gel of semi-quantitative RT-PCR of RNA isolated from the reporter line under different treatment conditions (source data for Figure 1b).
- https://cdn.elifesciences.org/articles/104439/elife-104439-fig1-data1-v1.zip
-
Figure 1—source data 2
Northern blot of total RNA isolated from the reporter line after treatment with either DMSO, 1 μM TG, or 10 μM OSMI-1 for 6 hr (source data for Figure 1c).
- https://cdn.elifesciences.org/articles/104439/elife-104439-fig1-data2-v1.zip
-
Figure 1—source data 3
Methylene blue stained loading control for northern blot of RNA isolated from the reporter line under different treatment conditions (source data for Figure 1c).
- https://cdn.elifesciences.org/articles/104439/elife-104439-fig1-data3-v1.zip
-
Figure 1—source data 4
Validation of GFP reporter protein levels by western blot analysis after treatment of the reporter line with various modulators of cellular O-GlcNAc levels (source data for Figure 1e).
- https://cdn.elifesciences.org/articles/104439/elife-104439-fig1-data4-v1.zip
-
Figure 1—source data 5
Western blot for O-GlcNAc levels (RL2 antibody) after treatment of the reporter line with various modulators of cellular O-GlcNAc levels (source data for Figure 1e).
- https://cdn.elifesciences.org/articles/104439/elife-104439-fig1-data5-v1.zip
-
Figure 1—source data 6
Northern blot analysis of RNA isolated from either 30 nM non-target (siNT) or OGT-specific (siOGT) siRNA-treated reporter line (source data for Figure 1f).
- https://cdn.elifesciences.org/articles/104439/elife-104439-fig1-data6-v1.zip
-
Figure 1—source data 7
Methylene blue stained loading control for northern blot (source data for Figure 1f).
- https://cdn.elifesciences.org/articles/104439/elife-104439-fig1-data7-v1.zip
Figure 2 with 4 supplements
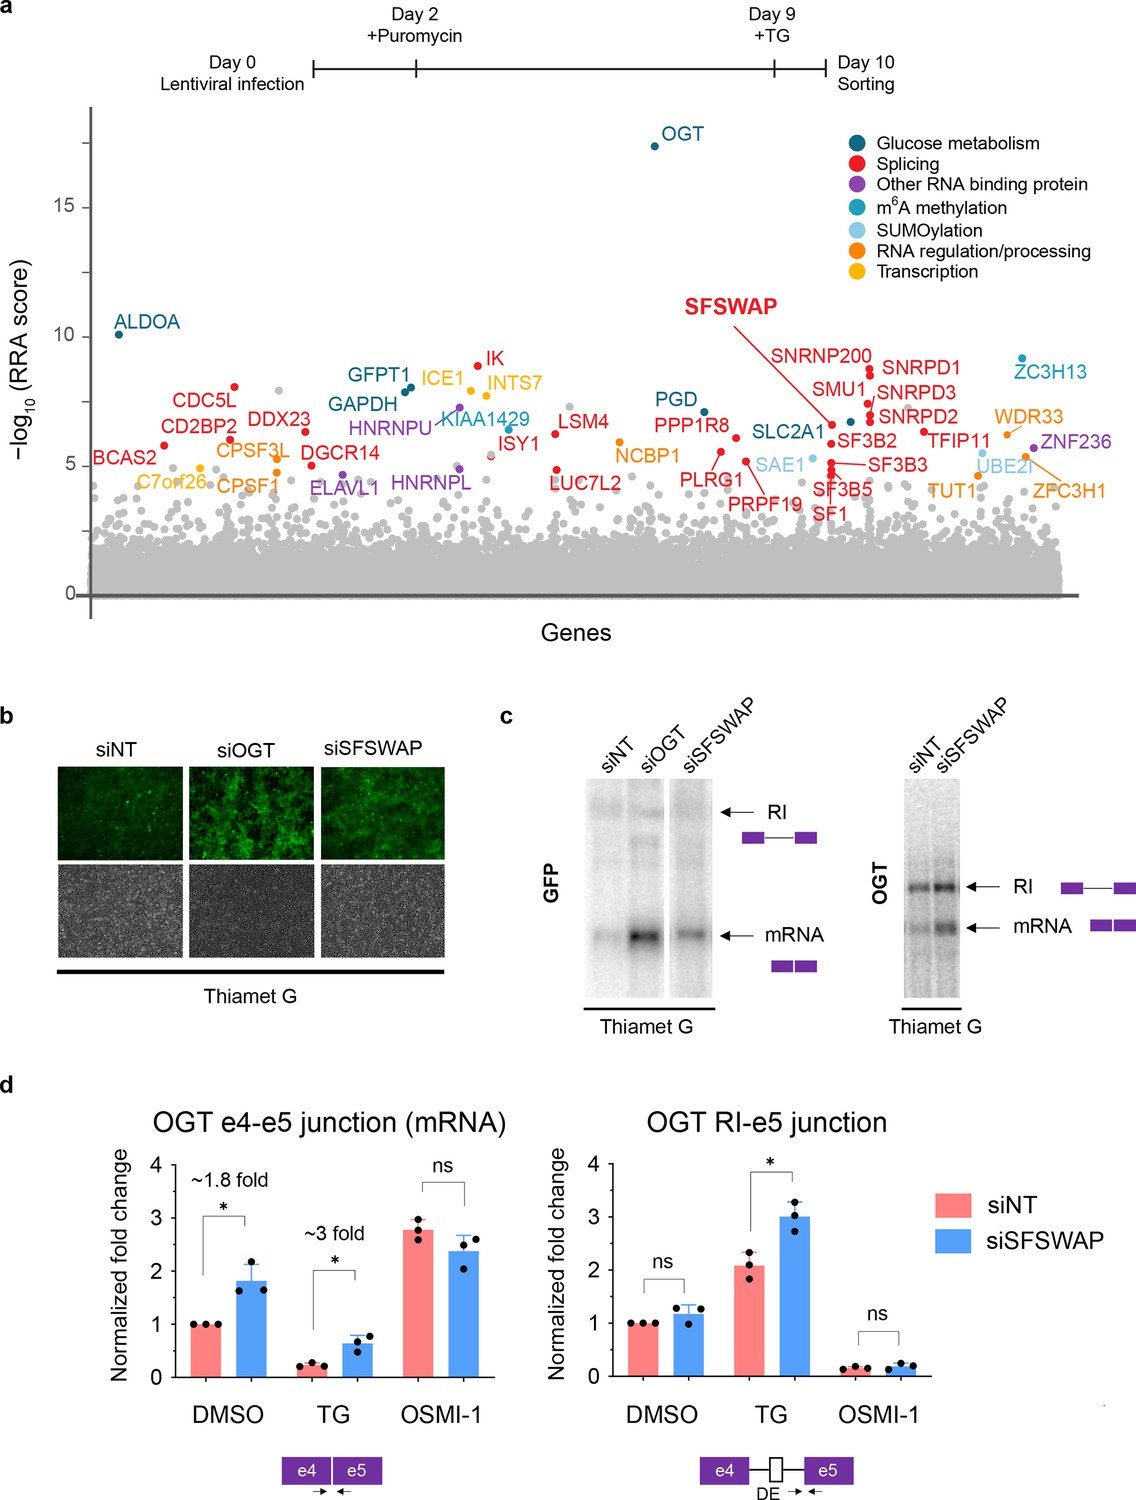
SFSWAP is a negative regulator of OGT intron 4 splicing.
(a) Top, timeline of CRISPR screen. Bottom, MAGeCK analysis of CRISPR screen results from TG-treated gain of GFP screen in three biological replicates. Top hits are color coded based on predicted function of the protein. Target genes are arranged alphabetically on the x-axis. (b) GFP fluorescence of TG-treated reporter cells 4 days post-treatment with siRNA corresponding to non-target (siNT), OGT (siOGT), or SFSWAP (siSFSWAP). Bottom panels show corresponding brightfield images. (c) Northern blot analysis of RNA isolated from either the TG-treated reporter line (left, probed for GFP) or TG-treated 293A-TOA cells (right, probed for OGT) 4 days after treatment with siRNA corresponding to either non-target (siNT) or SFSWAP (siSFSWAP). Cells were treated with TG for 6 hr just before RNA isolation. (d) RT-qPCR analysis of the splice junctions of interest after treatment of cells with either DMSO, TG, or OSMI-1 in the presence or absence of SFSWAP knockdown (n = 3). Primers used correspond to either the OGT intron 4 spliced junction (e4–e5) or retained intron junction (RI–e5). p-values are derived from unpaired t-tests against the corresponding non-target control. Single asterisk (*) denotes p-value <= 0.05.
-
Figure 2—source data 1
Northern blot analysis of RNA isolated from TG-treated reporter line and probed for GFP (source data for Figure 2c).
- https://cdn.elifesciences.org/articles/104439/elife-104439-fig2-data1-v1.zip
-
Figure 2—source data 2
Northern blot analysis of RNA isolated from 293A-TOA cells and probed for OGT (source data for Figure 2c).
- https://cdn.elifesciences.org/articles/104439/elife-104439-fig2-data2-v1.zip
Figure 2—figure supplement 1
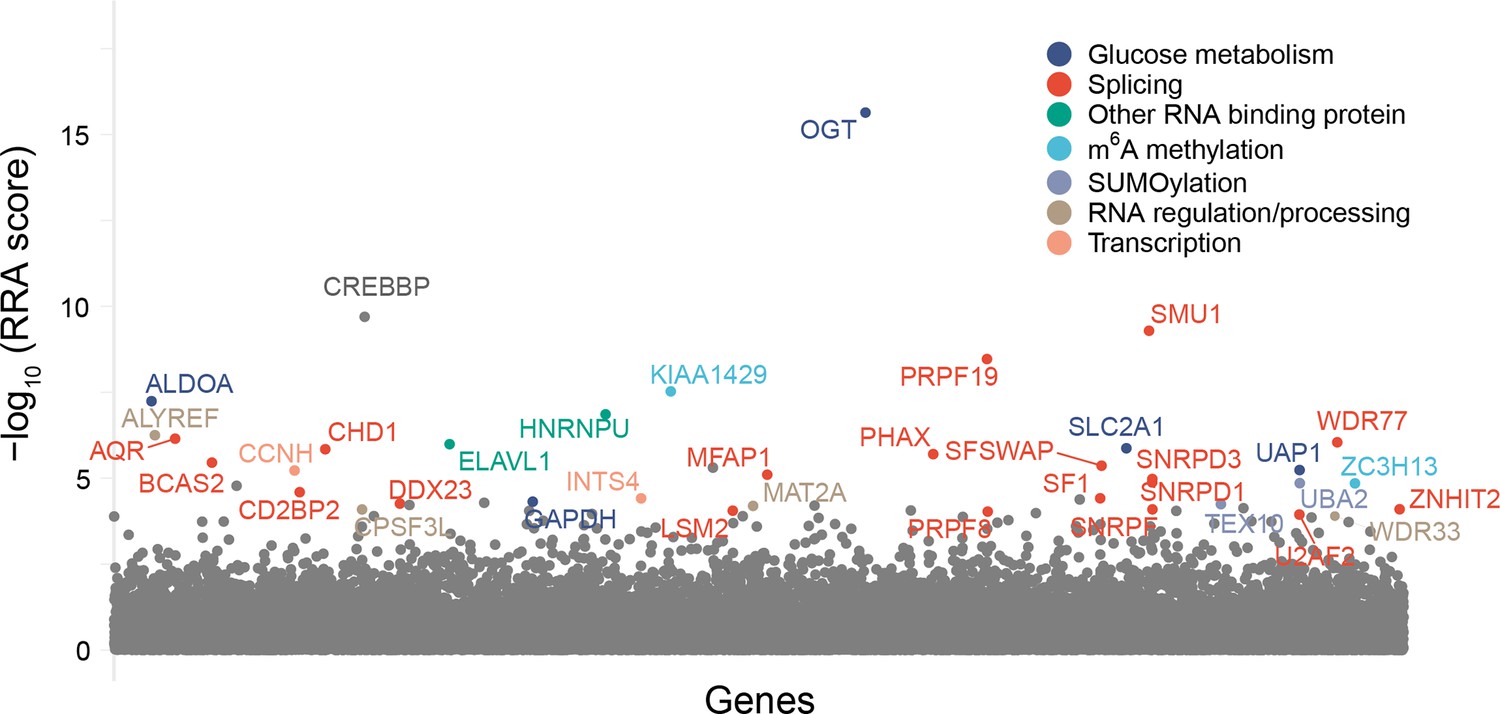
CRISPR screen for the identification of factors regulating OGT intron detention in the absence of TG treatment (n = 1).
Results of MAGeCK analysis are plotted with target genes arranged alphabetically on the x-axis.
Figure 2—figure supplement 2
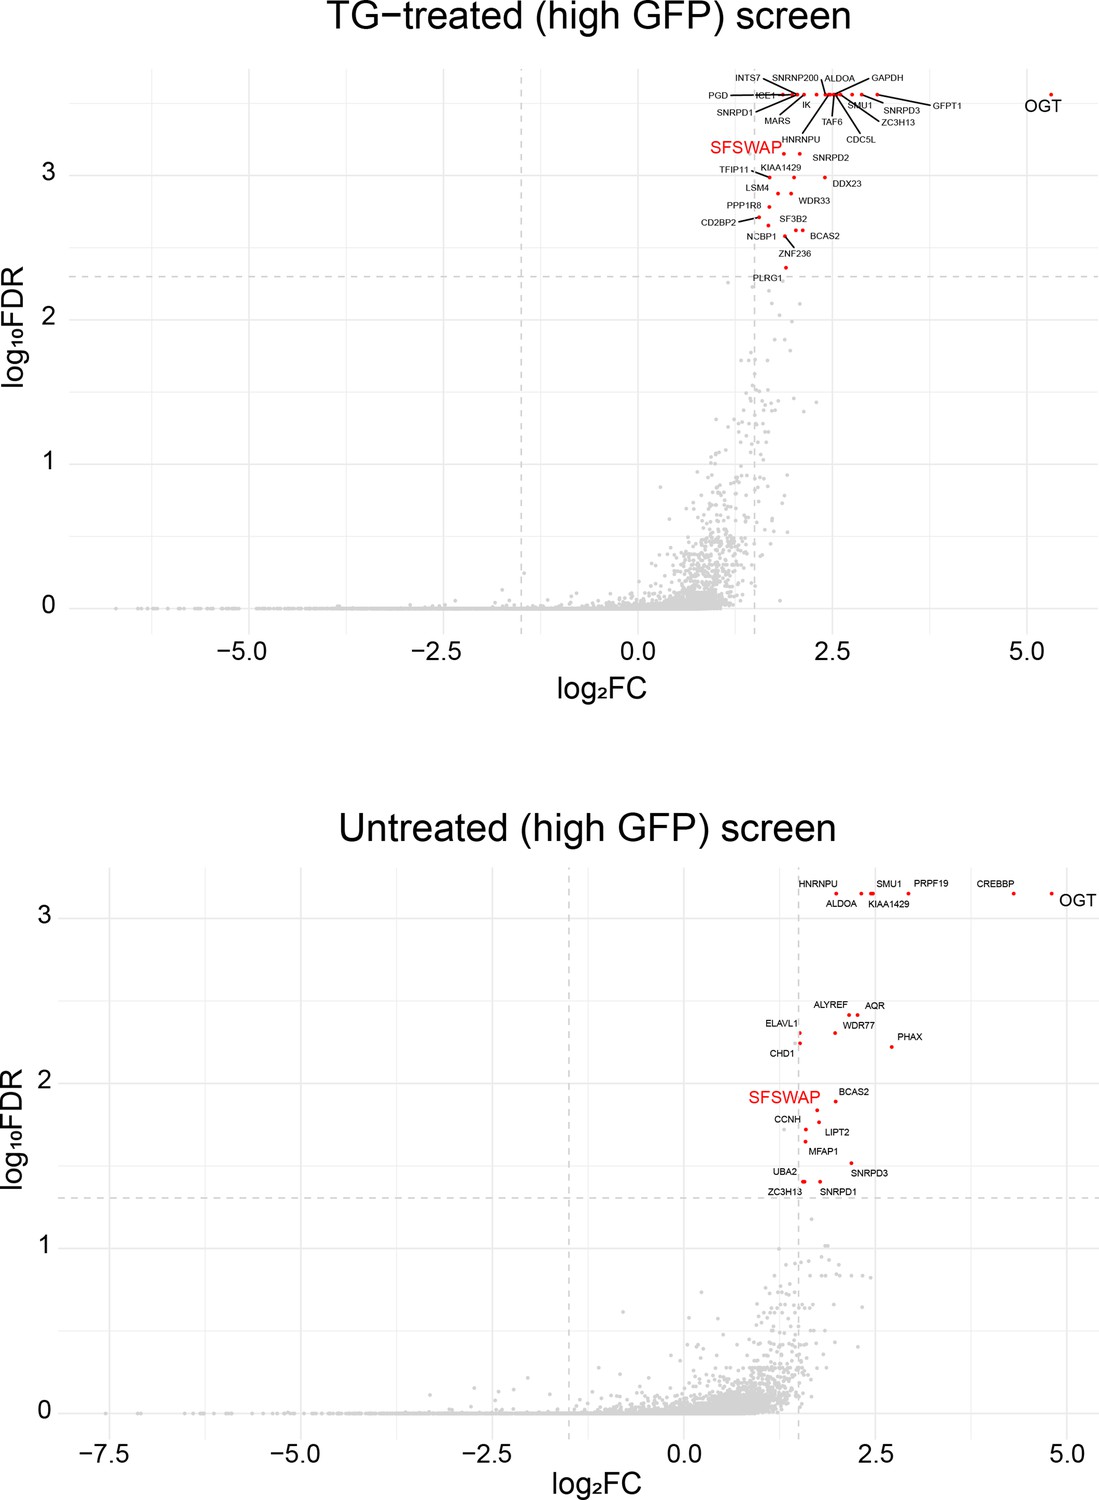
MAGeCK analysis of TG-treated (top) and untreated (high GFP, bottom) CRISPR screens plotted as a volcano plot.
Figure 2—figure supplement 3
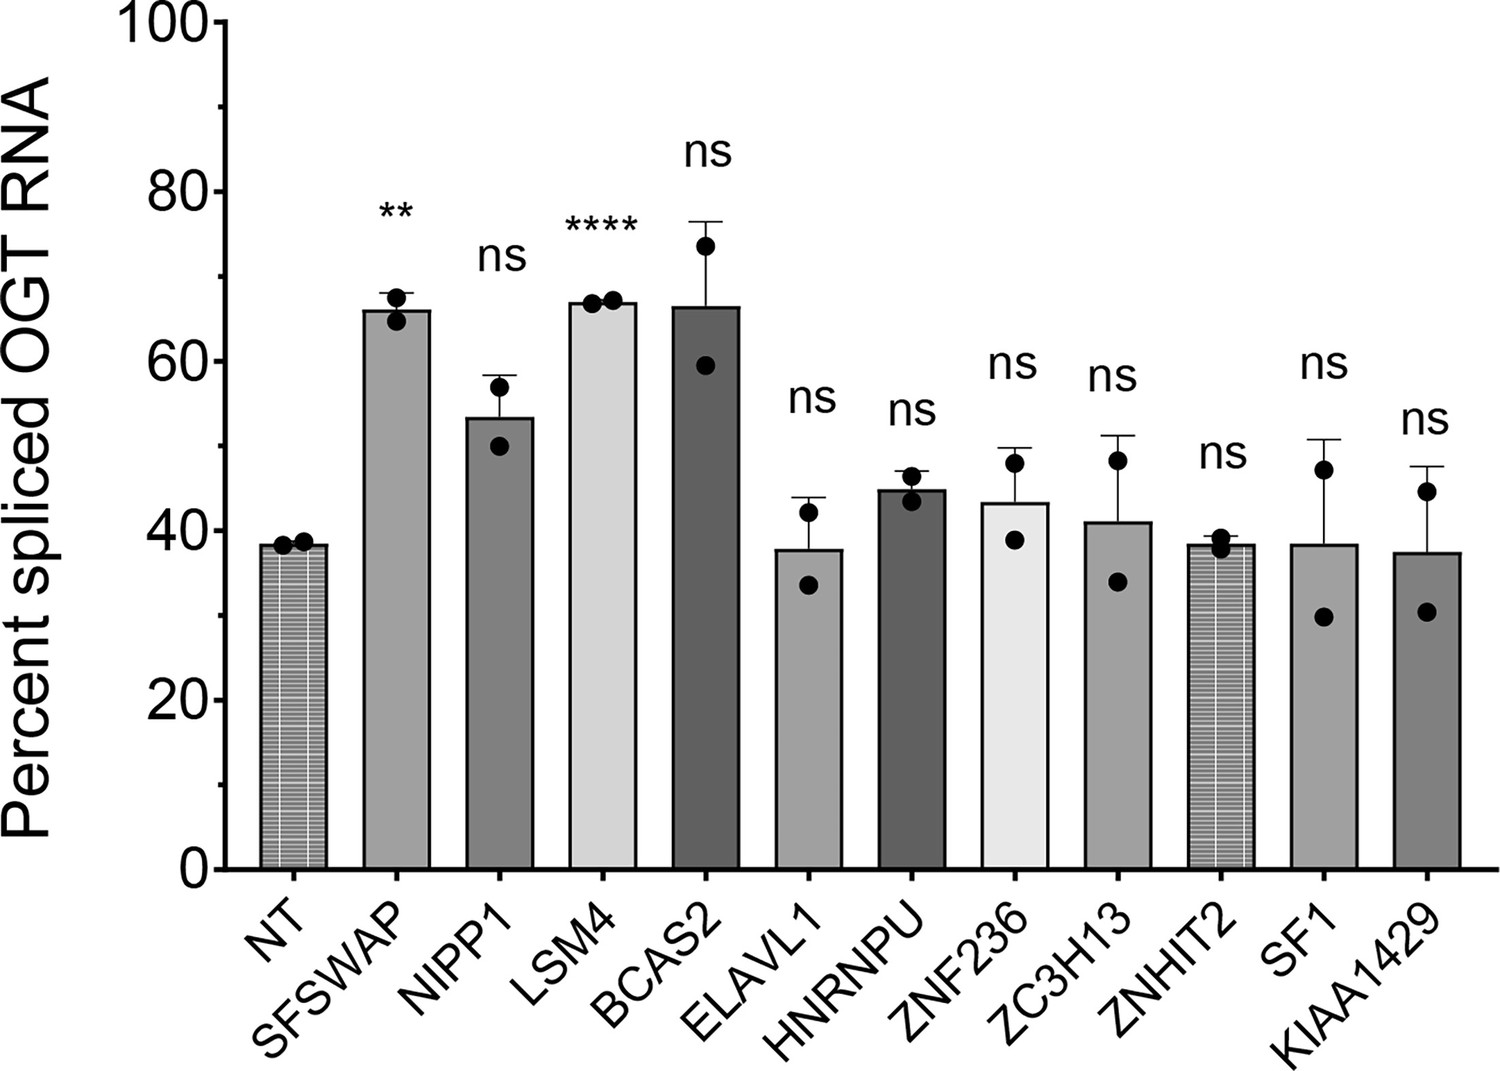
Validation of targets identified in the TG-treated CRISPR screen by RT-qPCR analysis of endogenous OGT intron 4 splicing after knockdown of the target of interest (n = 2).
Percent spliced OGT RNA was calculated as the ratio of spliced OGT mRNA (exon 4–5 junction) to the sum of spliced and retained (RI–exon 5 junction) forms of the transcript. RNA knockdowns were not verified by western blot or RT-qPCR, so negative results are interpreted to be inconclusive. Significance values derived from an unpaired t-test are shown with respect to non-target (NT) control. Significant p-values are represented as ** (p<0.01) or **** (p<0.0001).
Figure 2—figure supplement 4
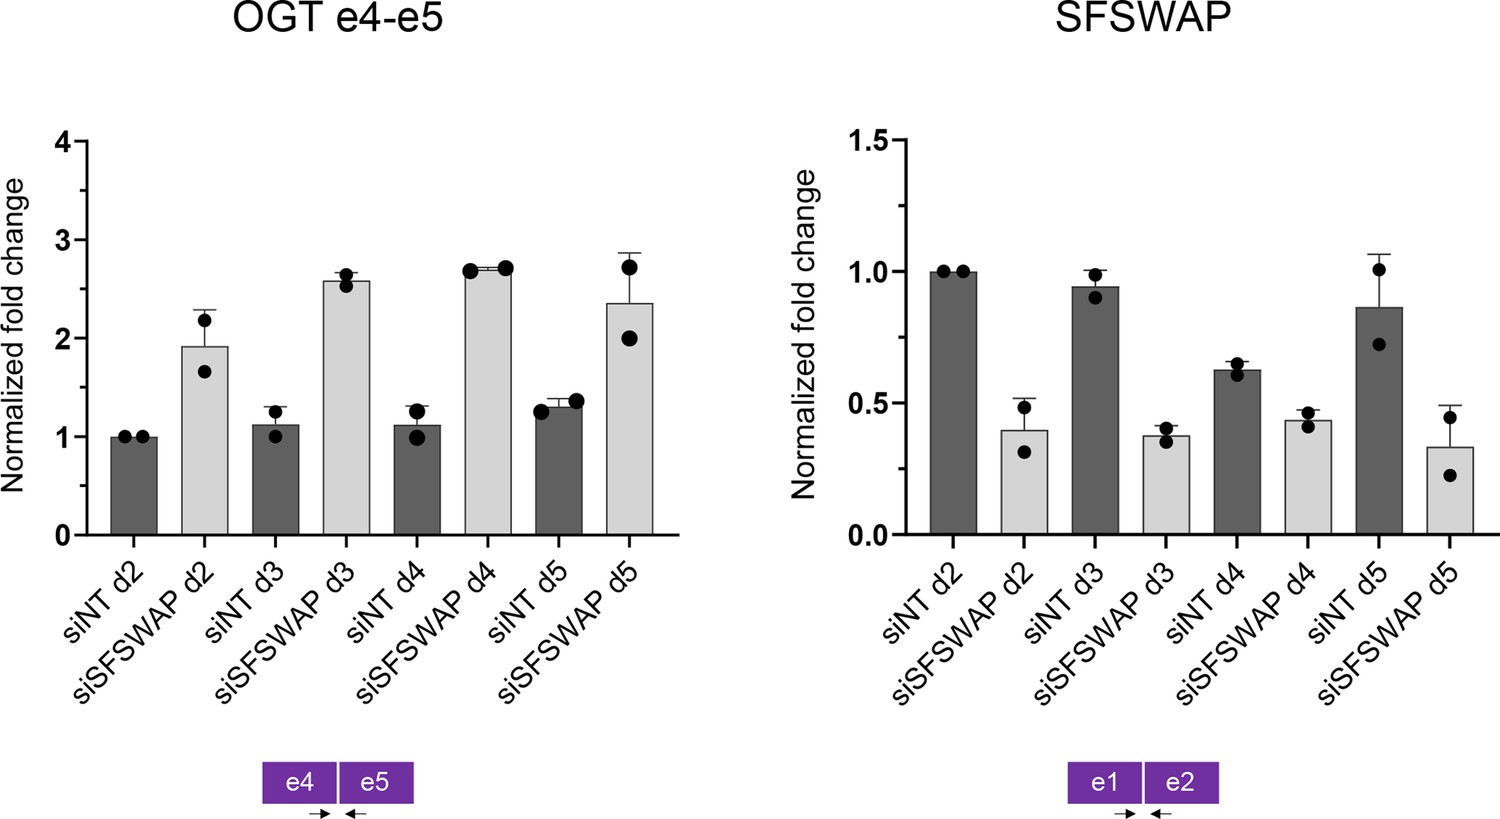
Time course RT-qPCR analysis of OGT e4–e5 junction splicing (left) upon SFSWAP knockdown.
SFSWAP transcript levels measured using e1–e2 junction primers (right) are shown for comparison.
Figure 3 with 8 supplements
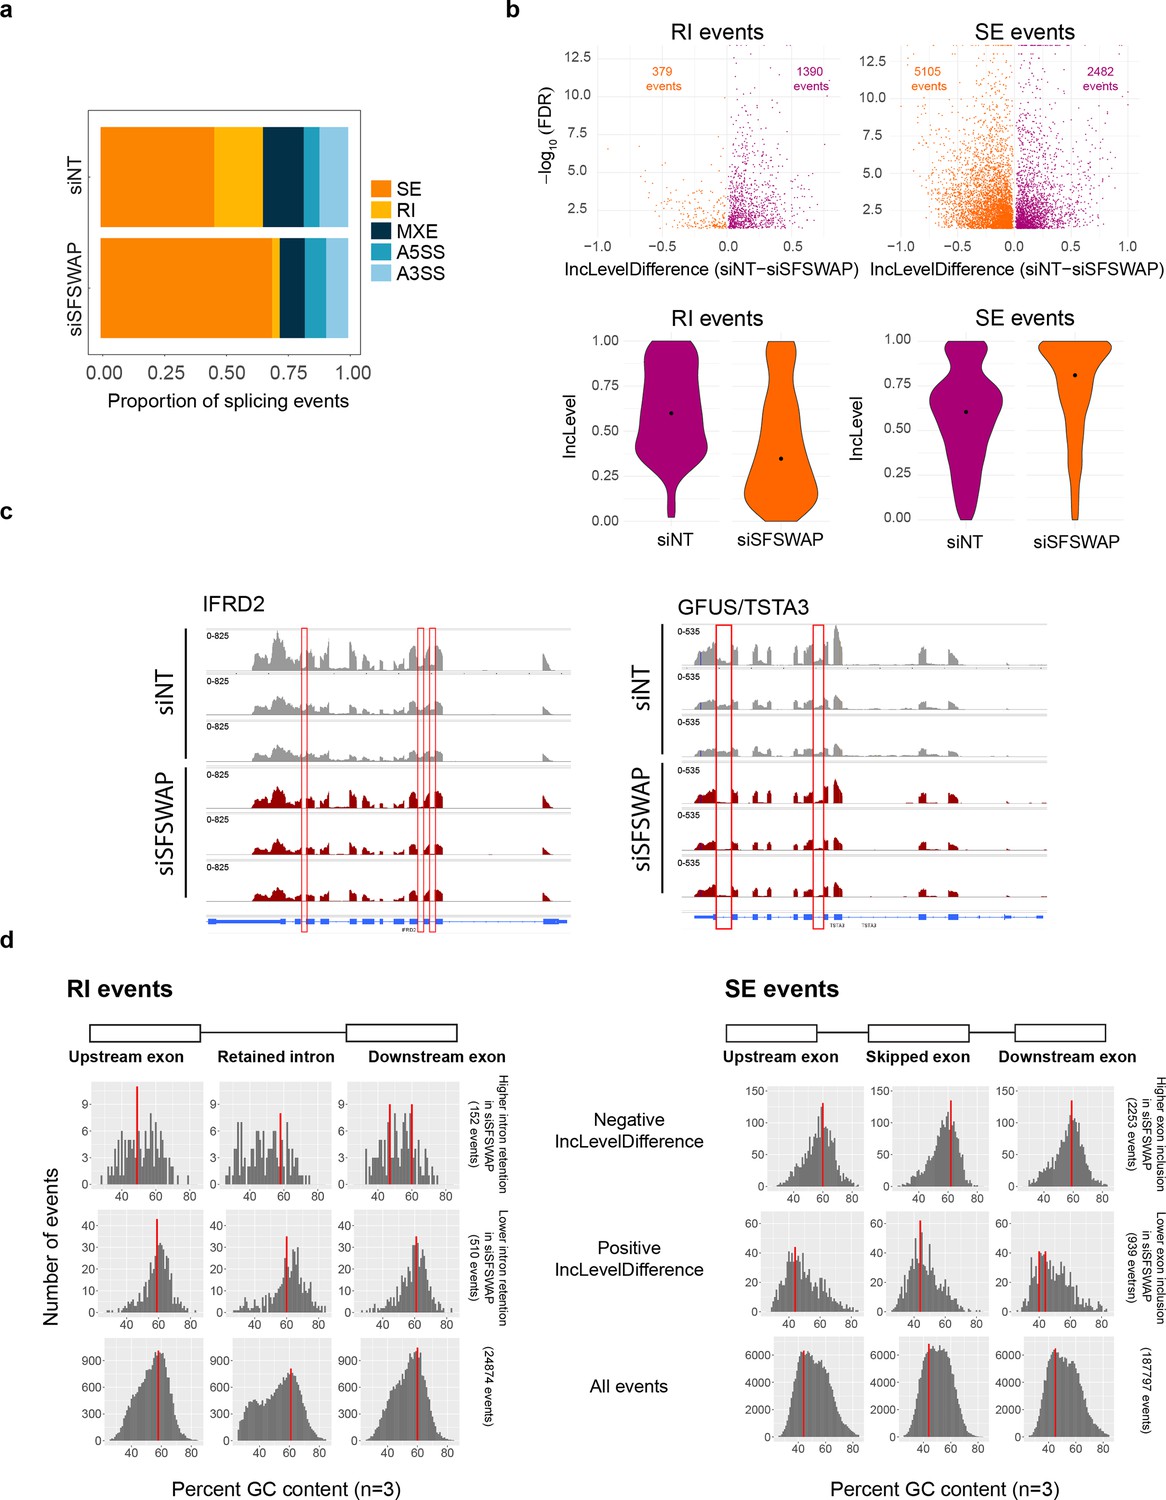
SFSWAP is a global regulator of retained intron splicing and exon skipping.
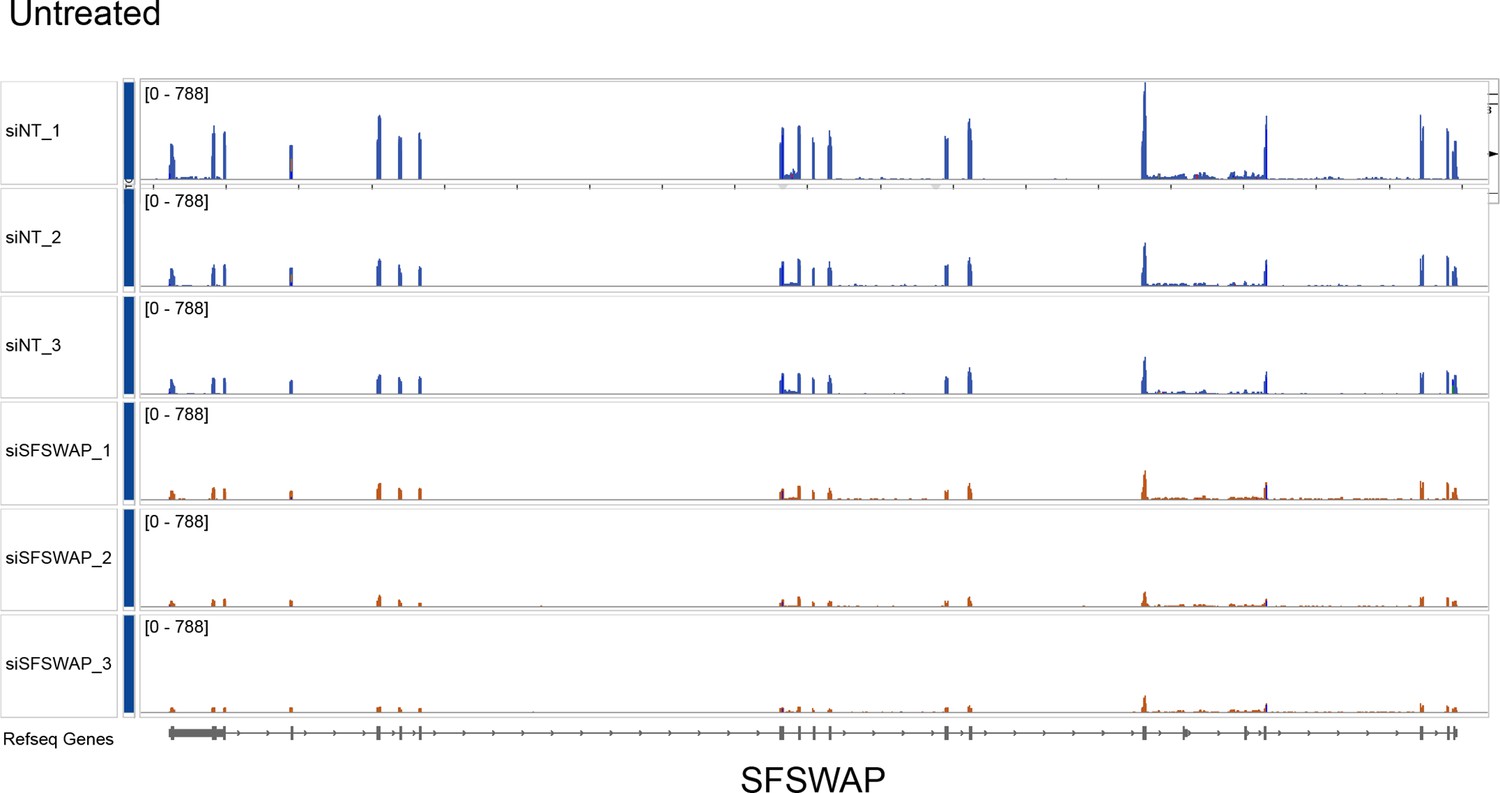
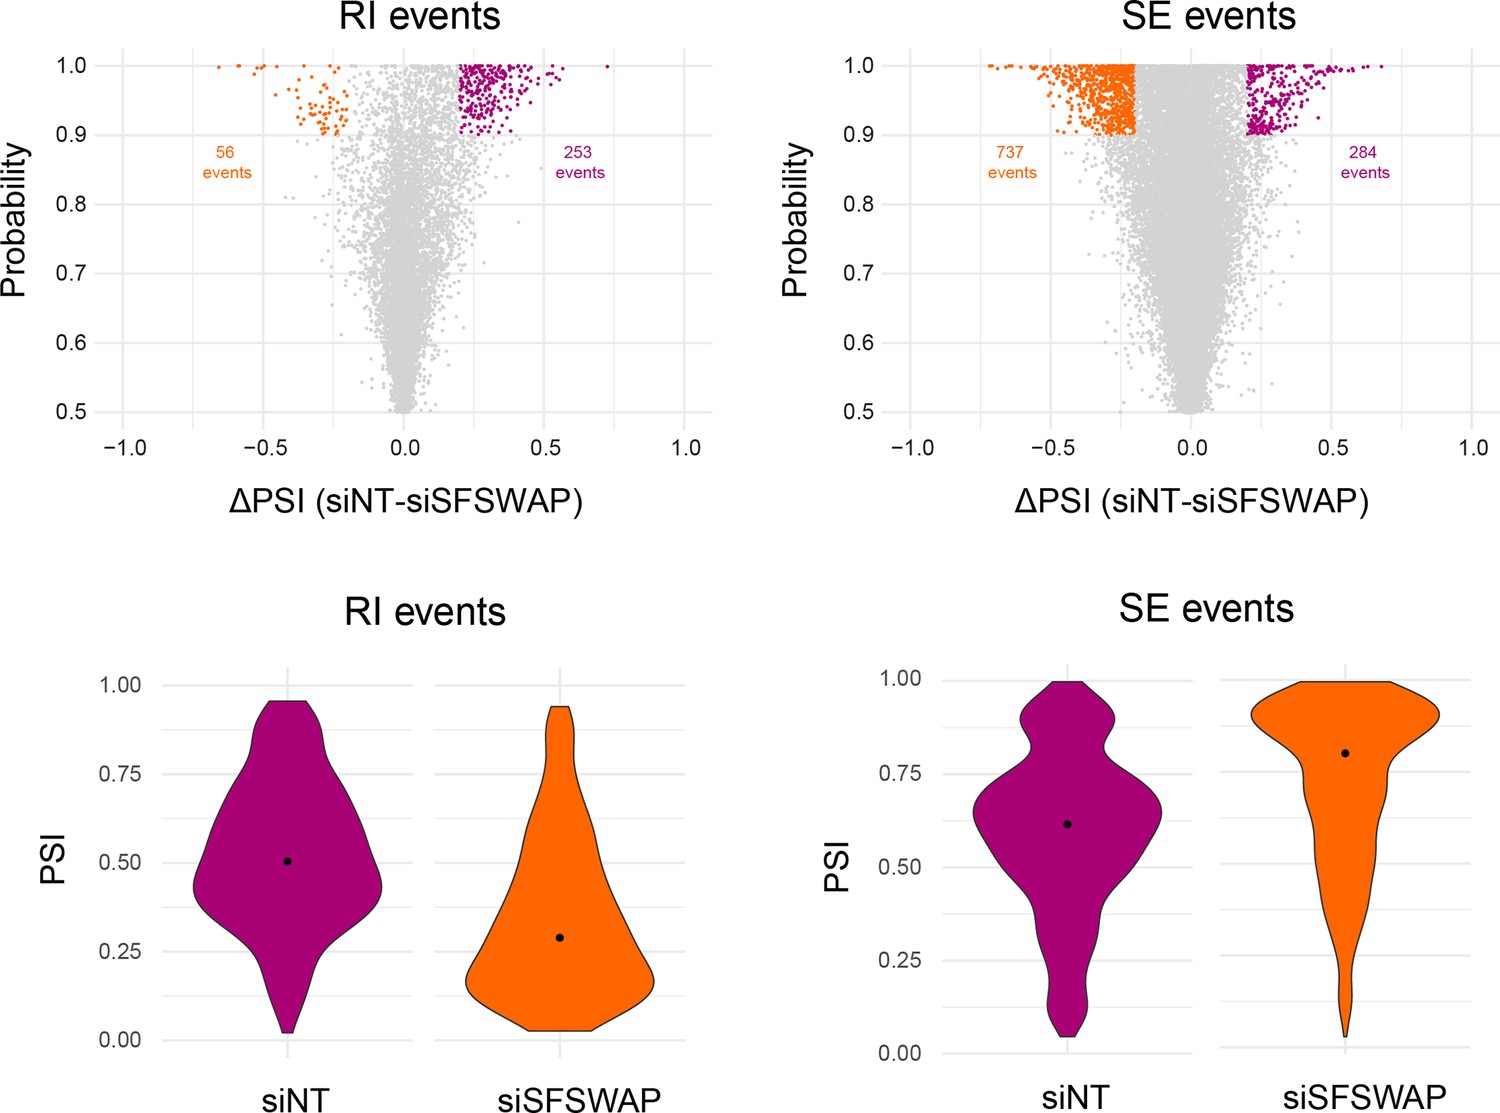
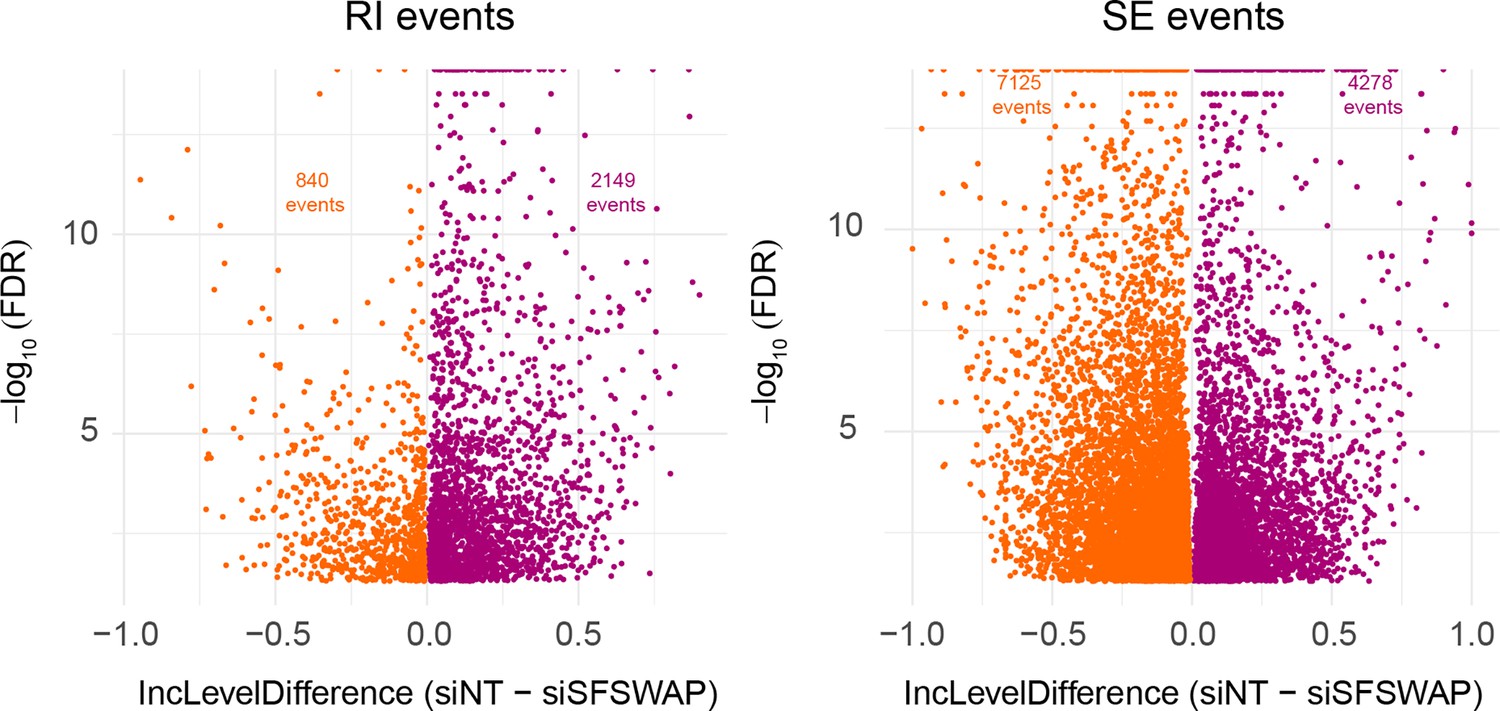
(a) Alternate splicing analysis in untreated SFSWAP knockdown (siSFSWAP) cells compared to non-target (siNT)-treated cells using rMATS (n = 3). The number of events of each type are plotted as proportion of total events detected. A3SS – alternate 3′ splice site; A5SS – alternate 5′ splice site; MXE – mutually exclusive exon; RI – retained intron; SE – skipped exon. Assignment of sample labels for events was done based on the value of IncLevelDifference (events with positive IncLevelDifference were designated as siNT and negative IncLevelDifference were designated as siSFSWAP). (b) Scatter plots of retained intron (RI) and skipped exon (SE) events plotted using the JC model of rMATS (top). The difference in inclusion values between siNT and siSFSWAP-treated cells is plotted on the x-axis. Only statistically significant events (FDR ≤0.05) are shown. Violin plots of inclusion levels corresponding to the individual samples are shown below. Median inclusion value for the sample is indicated by the black dot. Only significant events with 20% or greater change in inclusion levels are plotted for the violin plots. (c) IGV screenshot of read coverages of a few significant retained intron events. Three biological replicates are shown and the intron of interest is marked by the red rectangle. (d) GC content of relevant regions of significant RI and SE events (FDR ≤0.05, ≥10% change in inclusion levels). Red bars indicate the mode of GC content in each region.
Figure 3—figure supplement 1
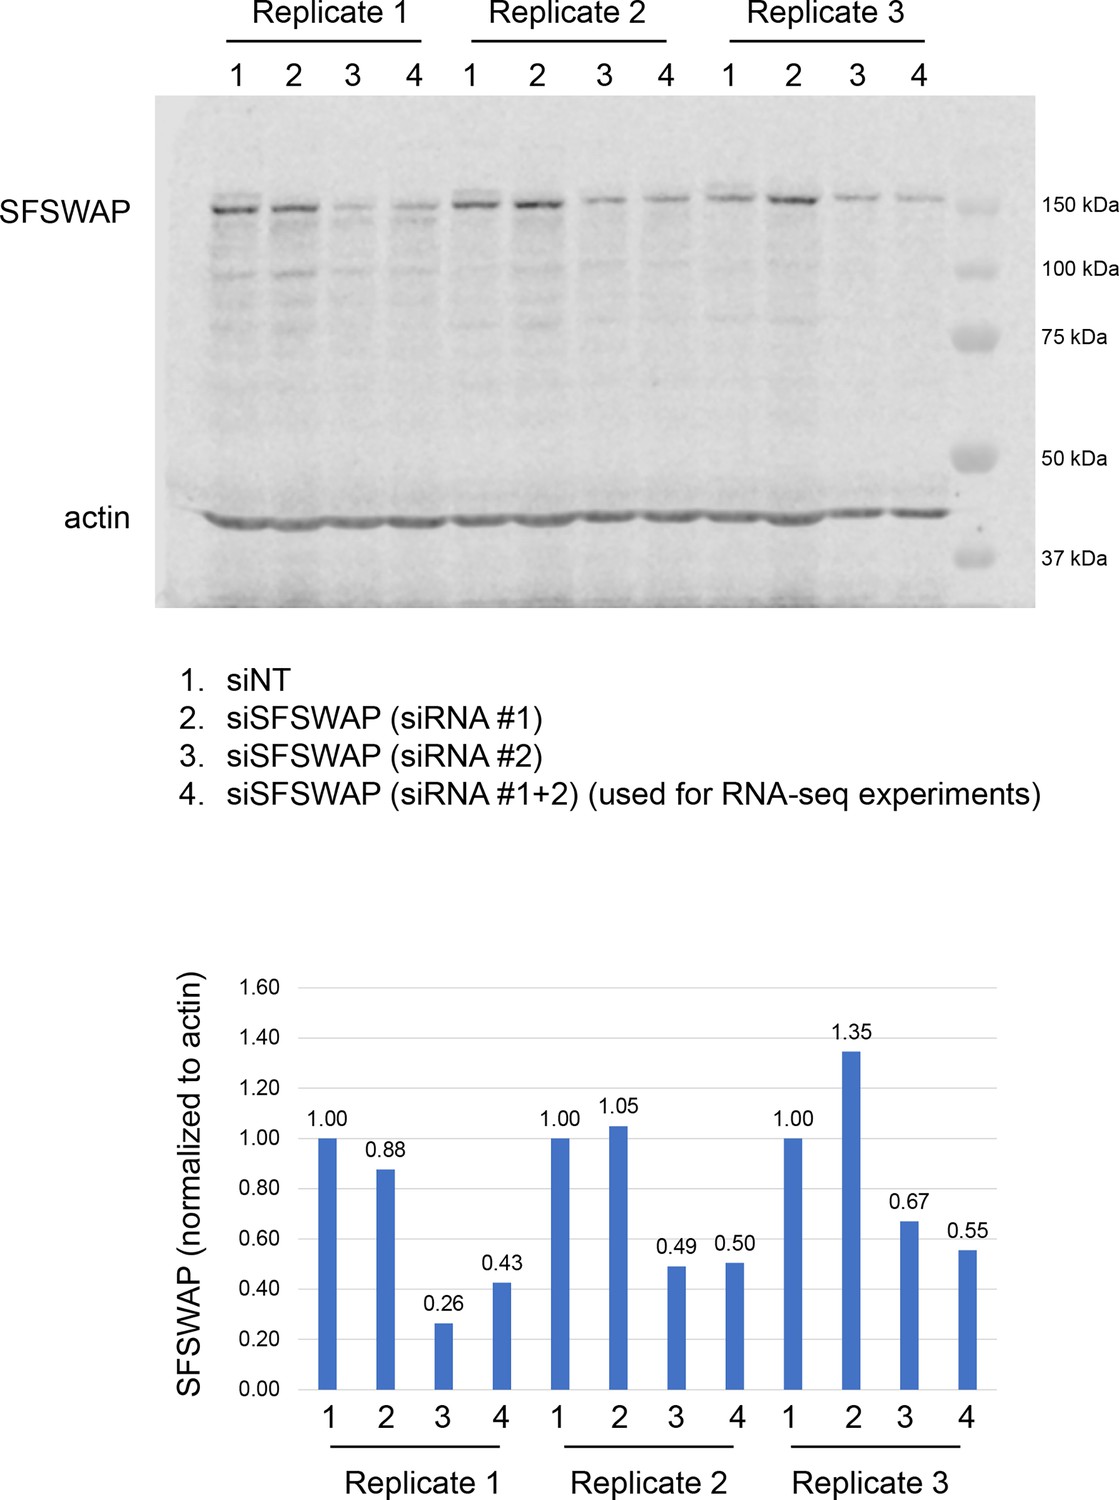
Validation of SFSWAP knockdown for untreated RNA-seq samples (data shown in Figure 3) by western blot analysis (top) and corresponding quantification (normalized to actin, bottom).
siRNA #1 is not an effective siRNA.
-
Figure 3—figure supplement 1—source data 1
Western blot for validation of SFSWAP knockdown in untreated RNA-seq samples.
- https://cdn.elifesciences.org/articles/104439/elife-104439-fig3-figsupp1-data1-v1.zip
Figure 3—figure supplement 2
IGV screenshot showing knockdown of SFSWAP in the untreated RNA-seq samples (data shown in Figure 3).
Figure 3—figure supplement 3
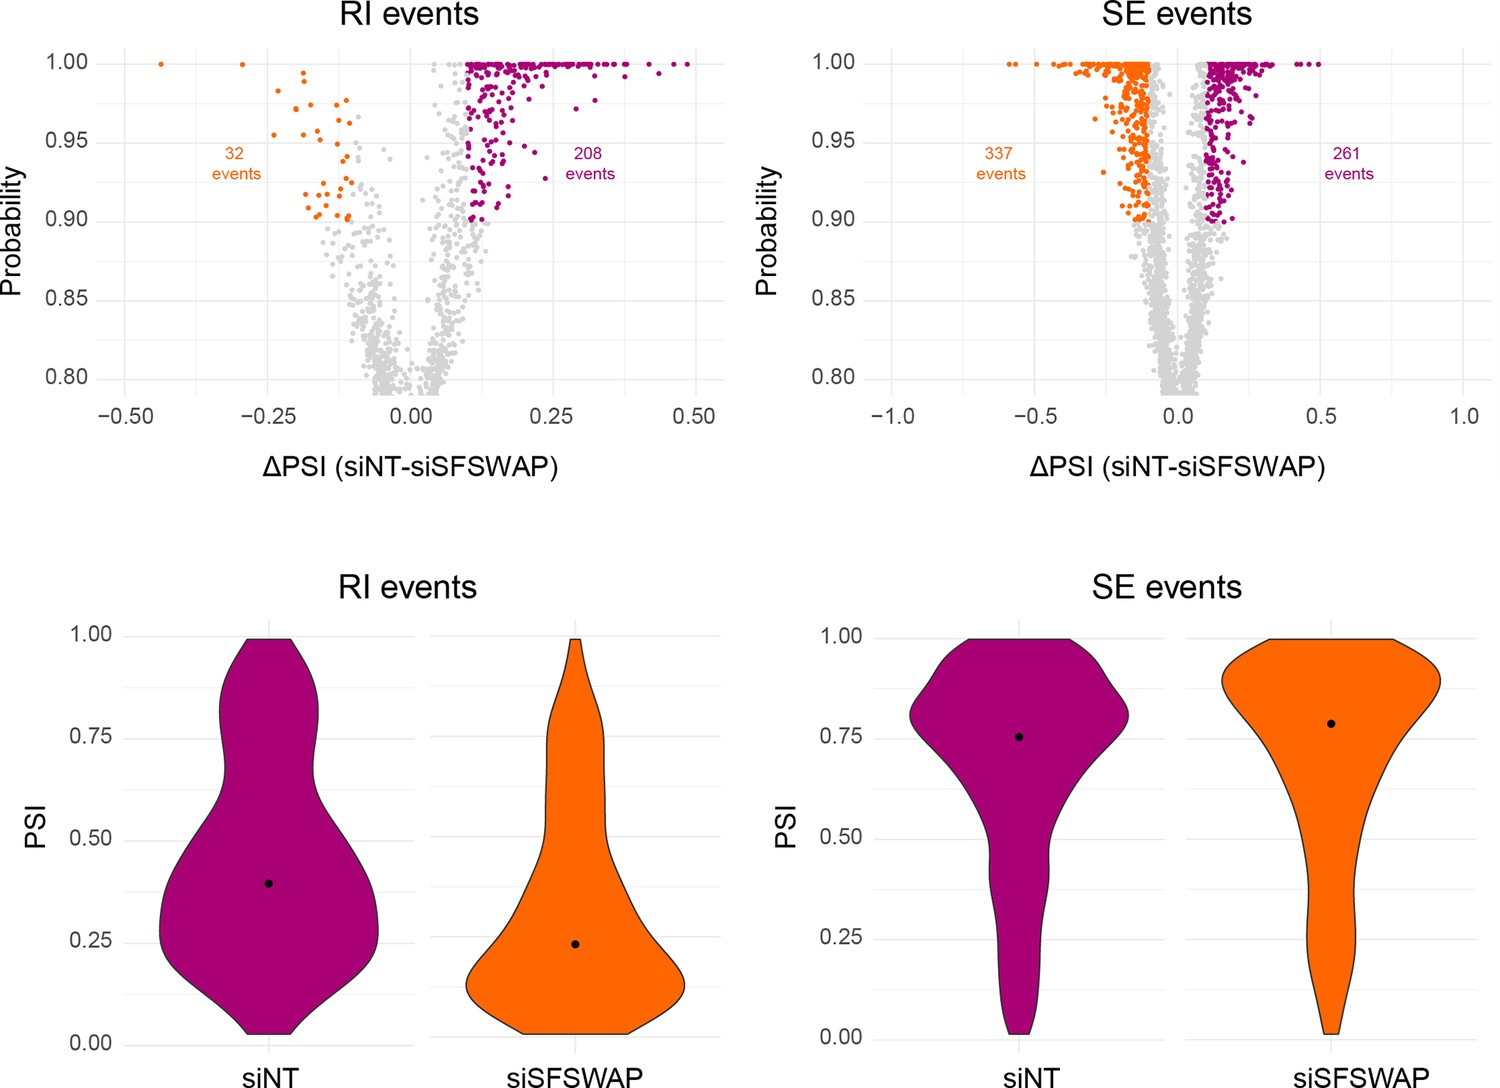
Alternate splicing analysis in SFSWAP knockdown background using Whippet (n = 3).
Scatter plots of RI and SE events are shown with significant events colored (probability ≥0.9 and greater than or equal to 20% change in ΔPSI). Violin plots of PSI distribution of significant events from individual samples is shown below. The black dot corresponds to the median PSI value of each sample.
Figure 3—figure supplement 4
Alternate splicing analysis in SFSWAP knockdown background using MAJIQ (n = 3).
Scatter plots of RI and SE events are shown with significant events colored (probability ≥0.9 and greater than or equal to 10% change in ΔPSI). Violin plots of PSI distribution of significant events from individual samples is shown below. The black dot corresponds to the median PSI value of each sample.
Figure 3—figure supplement 5
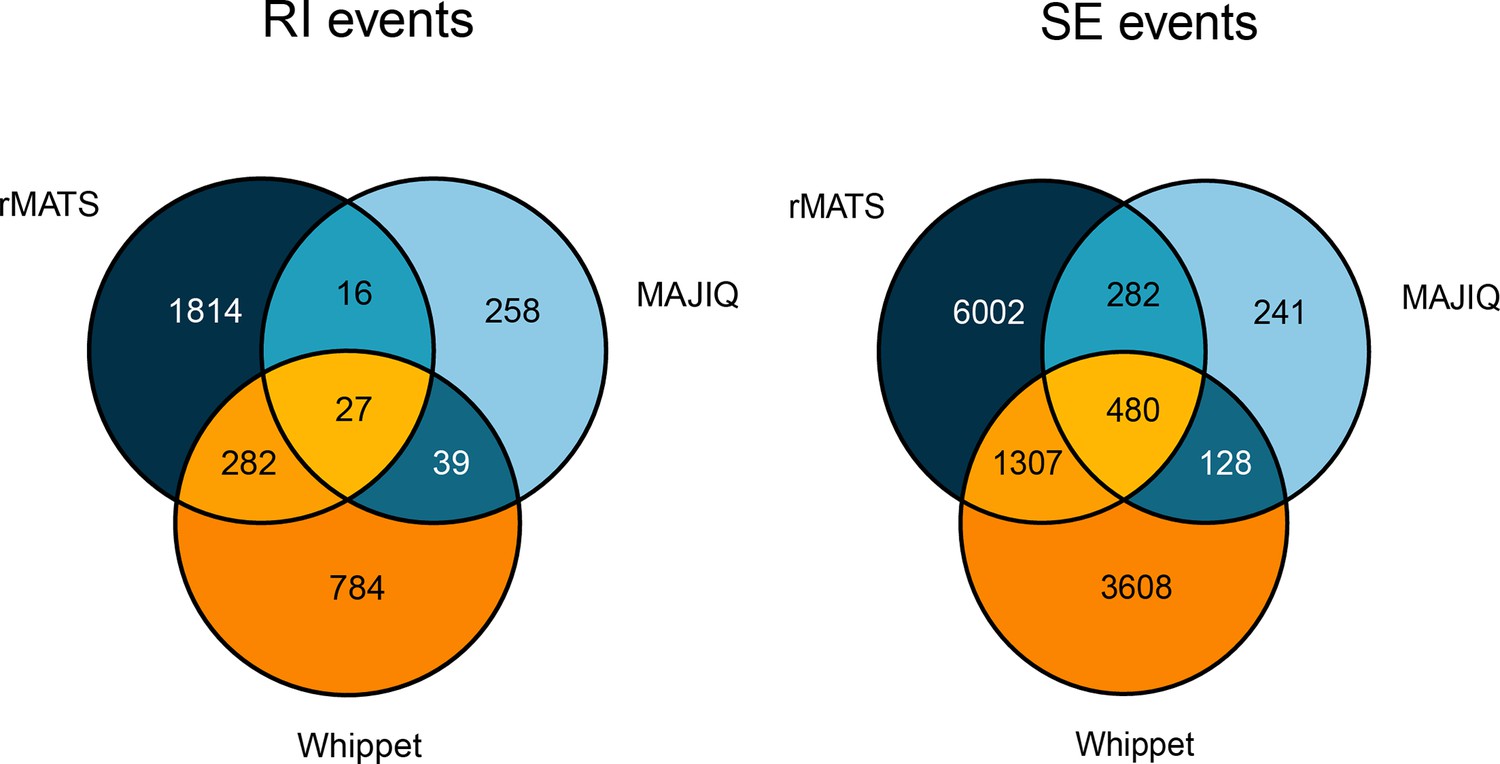
Degree of overlap in detected alternately spliced events by rMATS, MAJIQ, and Whippet for retained intron events (left) and skipped exon events (right).
Figure 3—figure supplement 6
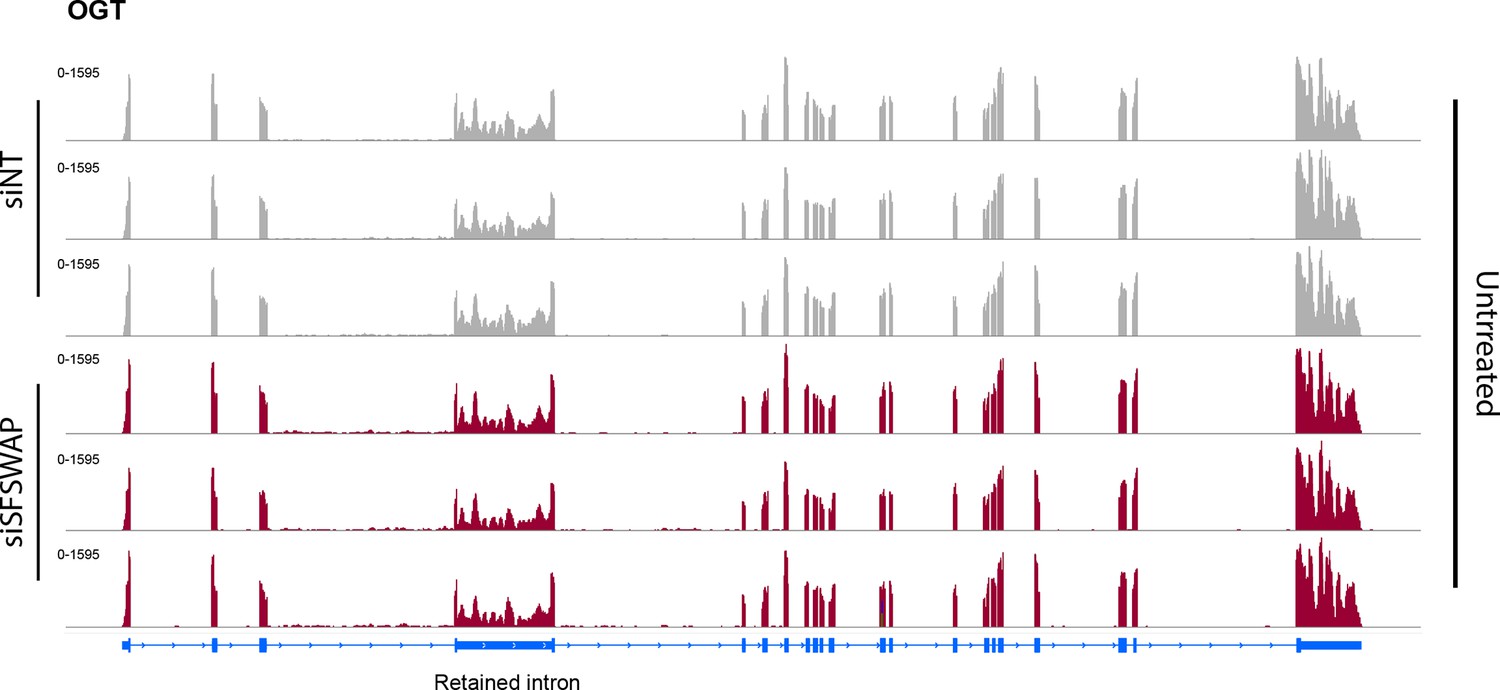
IGV screenshot of read coverage of the OGT transcript from RNA-seq analysis in the presence or absence of SFSWAP knockdown (n = 3) without any inhibitor treatment.
Figure 3—figure supplement 7
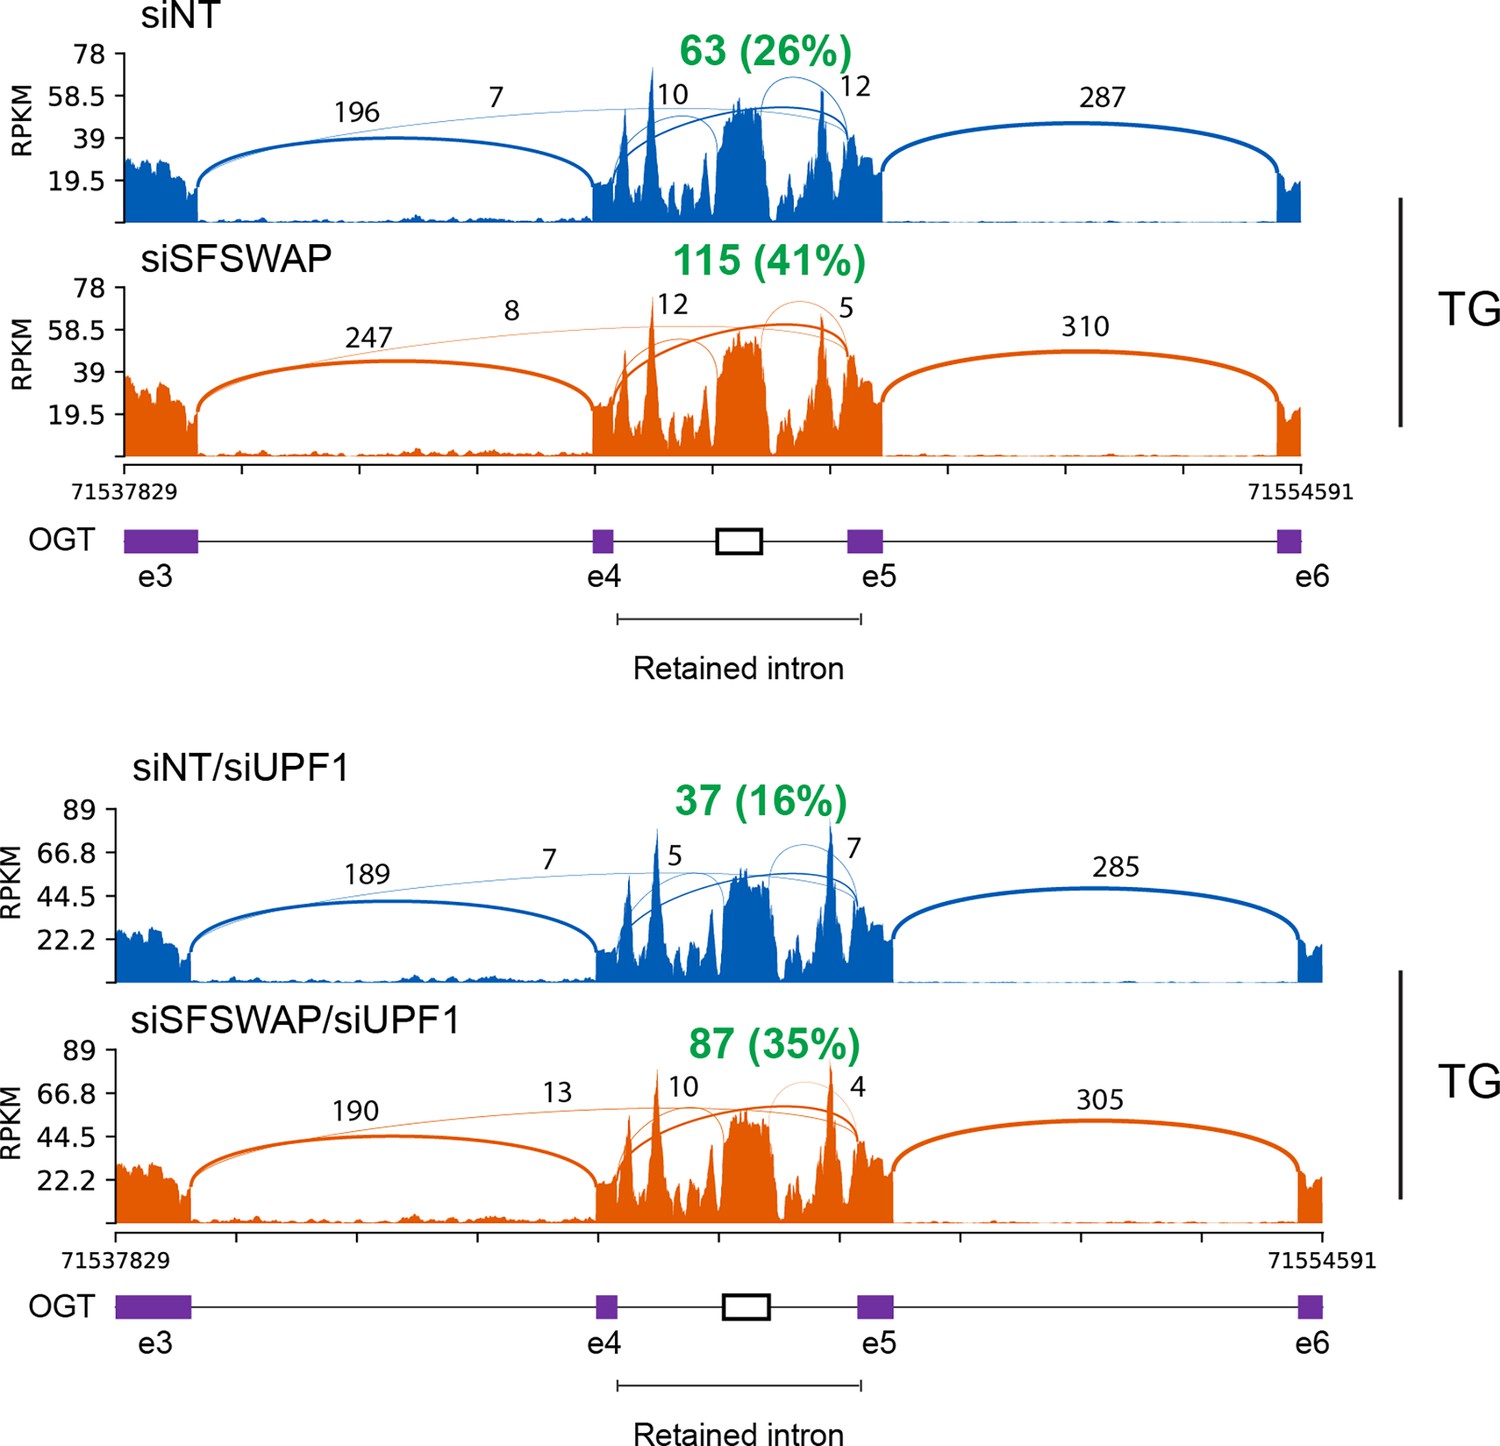
Sashimi plot of splice events around the OGT retained intron showing enhanced removal of the retained intron upon SFSWAP knockdown.
Splicing to generate the mature mRNA (e4–e5) is shown in green. Approximate PSI is shown in parentheses. This was calculated as the number of reads supporting removal of the decoy intron over the mean of reads from adjacent exon-exon junctions is shown in bold green.
Figure 3—figure supplement 8
Scatter plot of significant RI and SE events from rMATS analysis of RNA-seq data from TG-treated cells in the presence or absence of SFSWAP knockdown.
Figure 4 with 2 supplements
SFSWAP regulates OGT decoy exon inclusion.
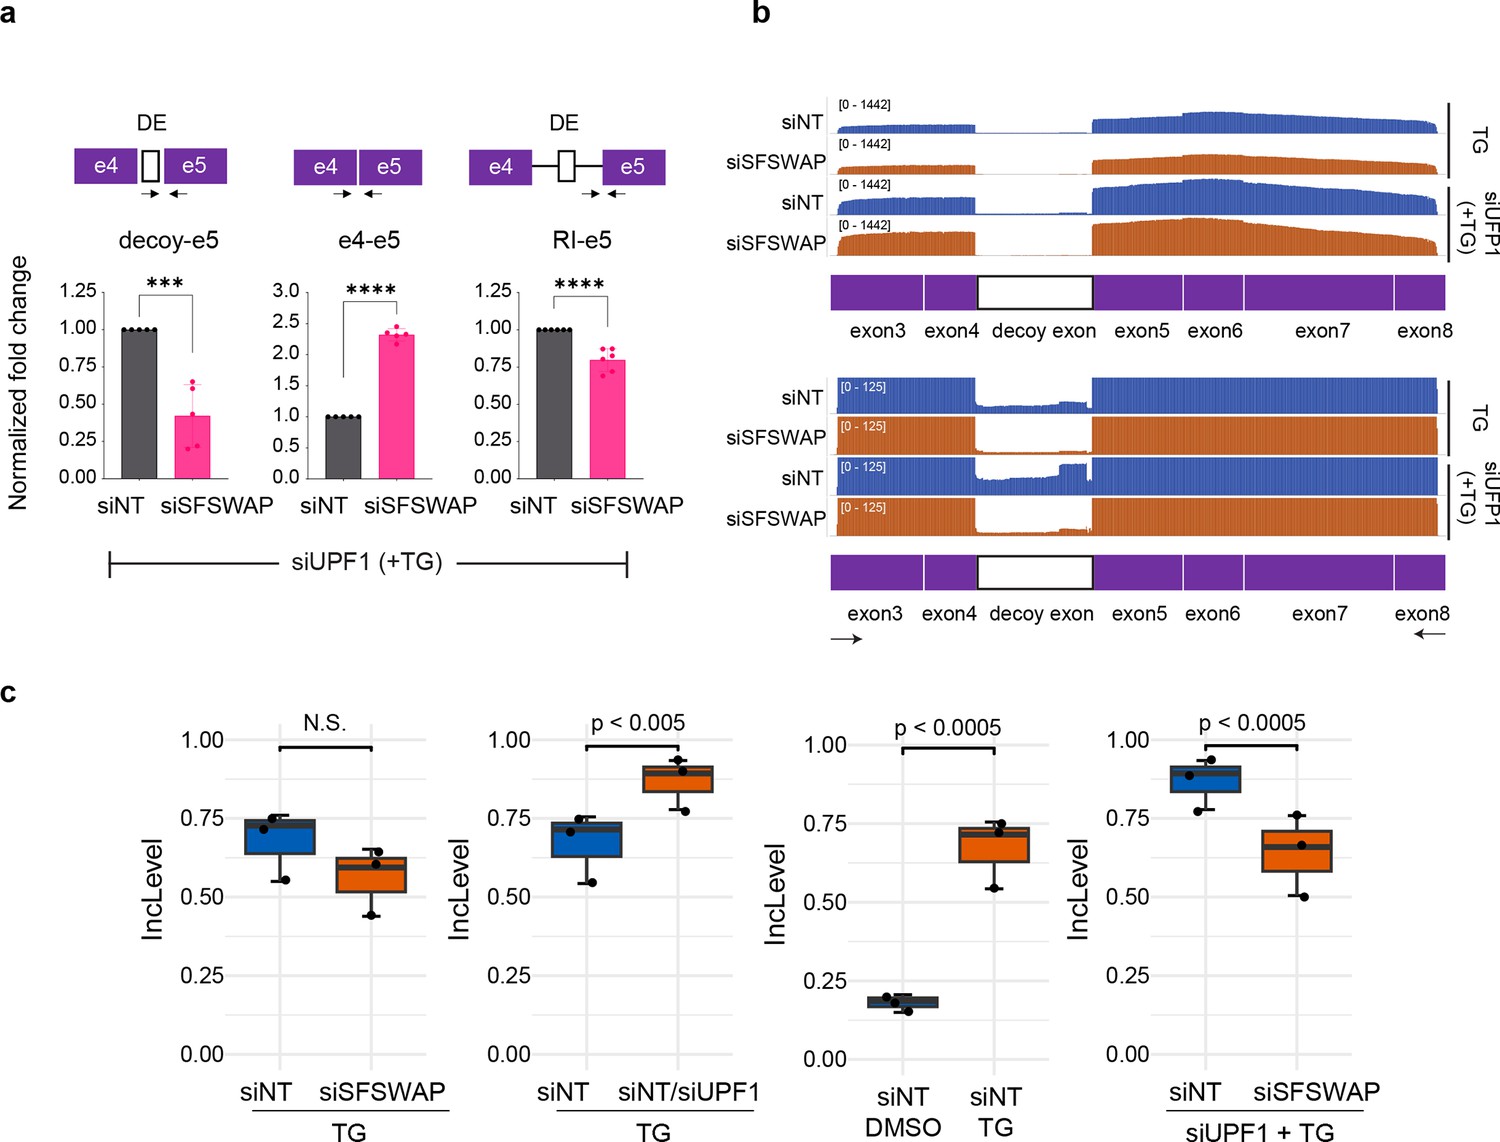
(a) RT-qPCR analysis of OGT intron 4 splicing in UPF1 knockdown background. SFSWAP knockdown was performed for 5 days and cells were then treated with TG for 6 hr before RNA isolation and reverse transcription using a mixture of dT20 and a DNA oligomer complementary to exon 5 of OGT. qPCR was performed for either the spliced junction (e4–e5), retained intron junction (RI–e5), or decoy–e5 junction as shown. DE – decoy exon. p-values are derived from unpaired t-tests against the corresponding non-target controls and are represented as *** (p<0.001) or **** (p<0.0001). (b) IGV screenshot of aligned reads after nanopore sequencing of semi-quantitative RT-PCR amplicons generated from the above samples using DNA oligomers complementary to exons 3 and 8 of OGT. A zoomed version is shown below to better show changes in the decoy exon region. (c) Quantification of OGT decoy exon inclusion from RNA-seq data in the presence or absence of UPF1 knockdown and/or TG treatment. Inclusion levels and p-values are calculated from the JCEC model of rMATS performed after alignment against a custom reference annotation of the human genome containing decoy exon annotations.
Figure 4—figure supplement 1
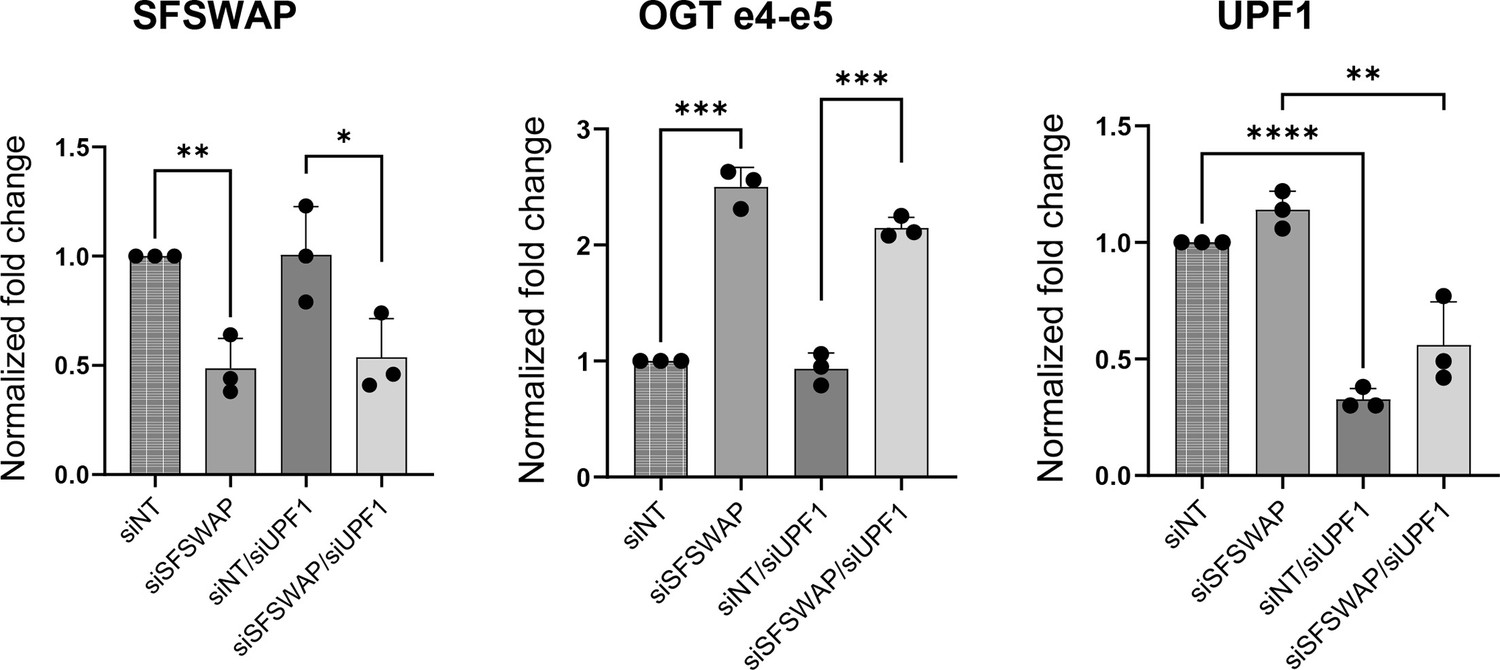
Validation of SFSWAP and UPF1 knockdown in TG-treated RNA-seq samples in the presence or absence of UPF1 knockdown (data shown in Figures 4 and 5) by RT-qPCR.
Significance values shown are derived from unpaired t-tests with respect to the corresponding untreated samples. p-values are represented as * (p<=0.05), ** (p<=0.01), *** (p<0.001) or **** (p<0.0001).
Figure 4—figure supplement 2
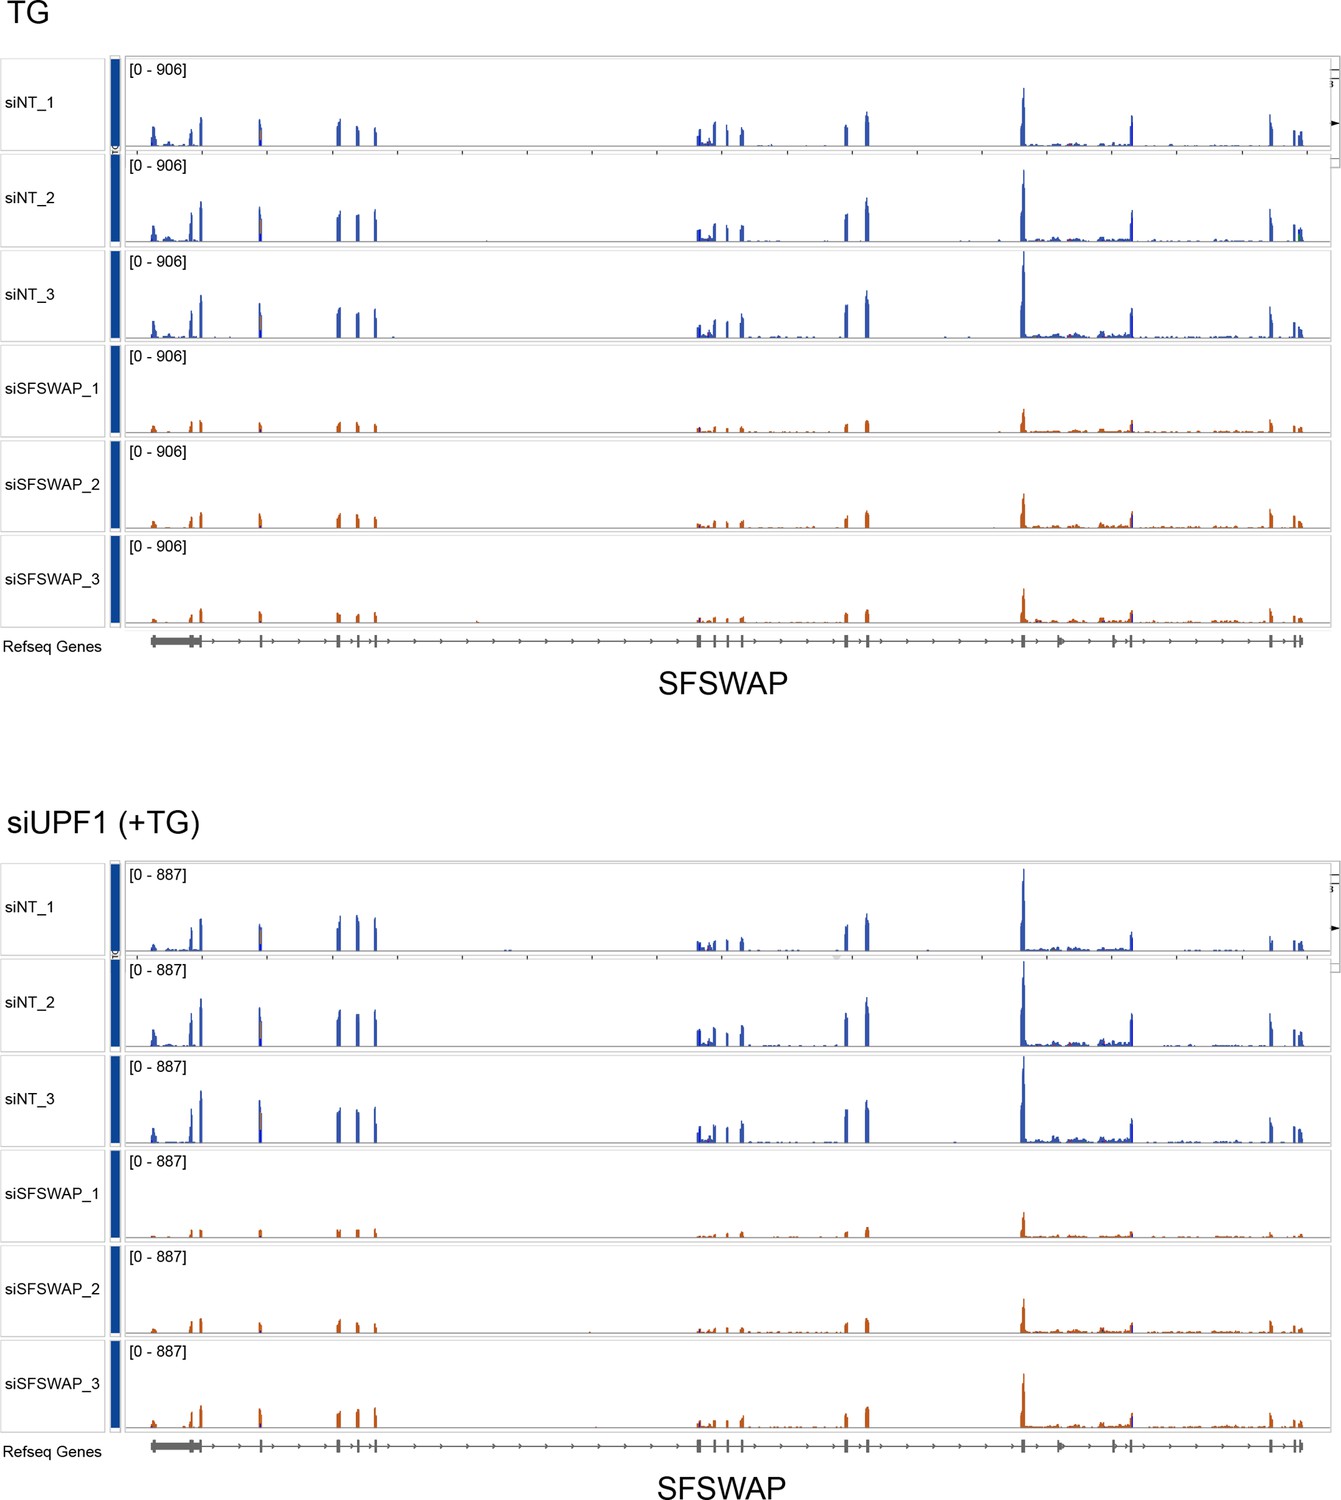
IGV screenshot showing knockdown of SFSWAP in the TG-treated RNA-seq samples in the presence (bottom) or absence (top) of UPF1 knockdown (data shown in Figures 4 and 5).
Figure 5 with 1 supplement
SFSWAP is a global regulator of decoy exon splicing.
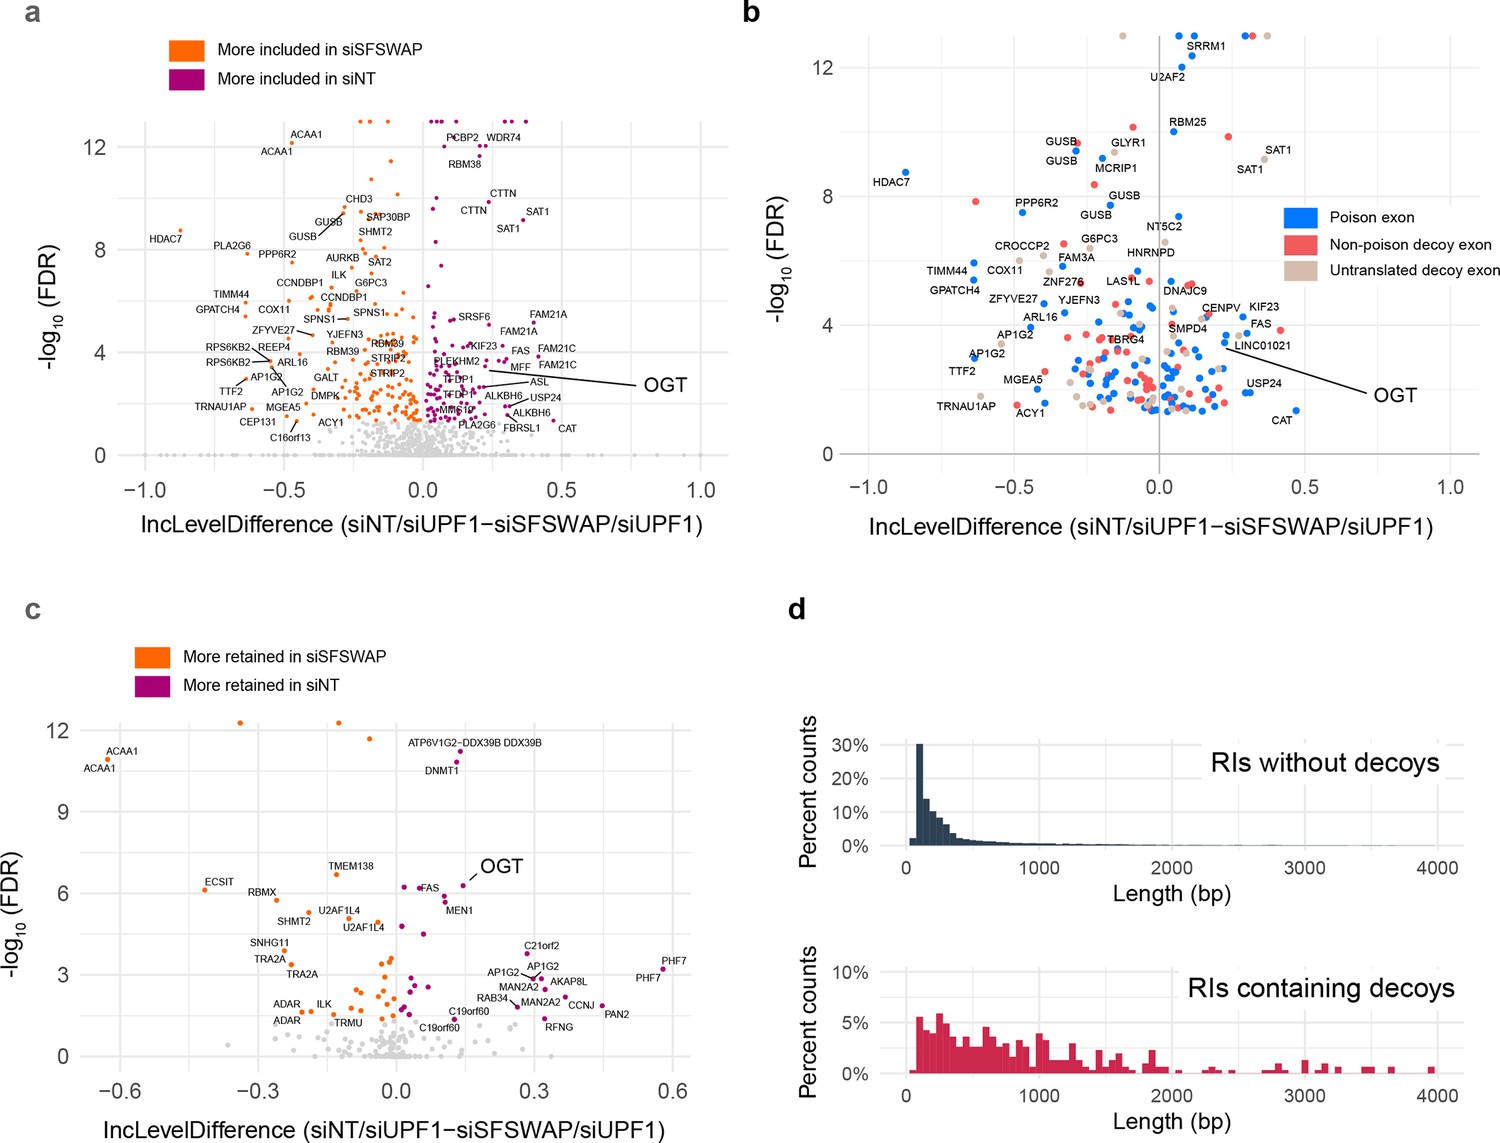
(a) Scatter plot of global decoy exon inclusion level changes upon SFSWAP knockdown in a TG-treated UPF1 knockdown background. Statistically significant events are colored. Not all analyzed cassettes may function as splicing decoys. (b) Exon types of the events shown in (a) classified based on the predicted translation outcome. Events shown in blue introduce an in-frame stop codon in the CDS, thus functioning as poison cassettes. (c) Inclusion level changes in decoy-containing retained introns upon SFSWAP knockdown in a TG-treated UPF1 knockdown background. Significant events are colored. (d) Length distribution of the decoy-containing retained introns compared to non-decoy-containing retained introns.
Figure 5—figure supplement 1
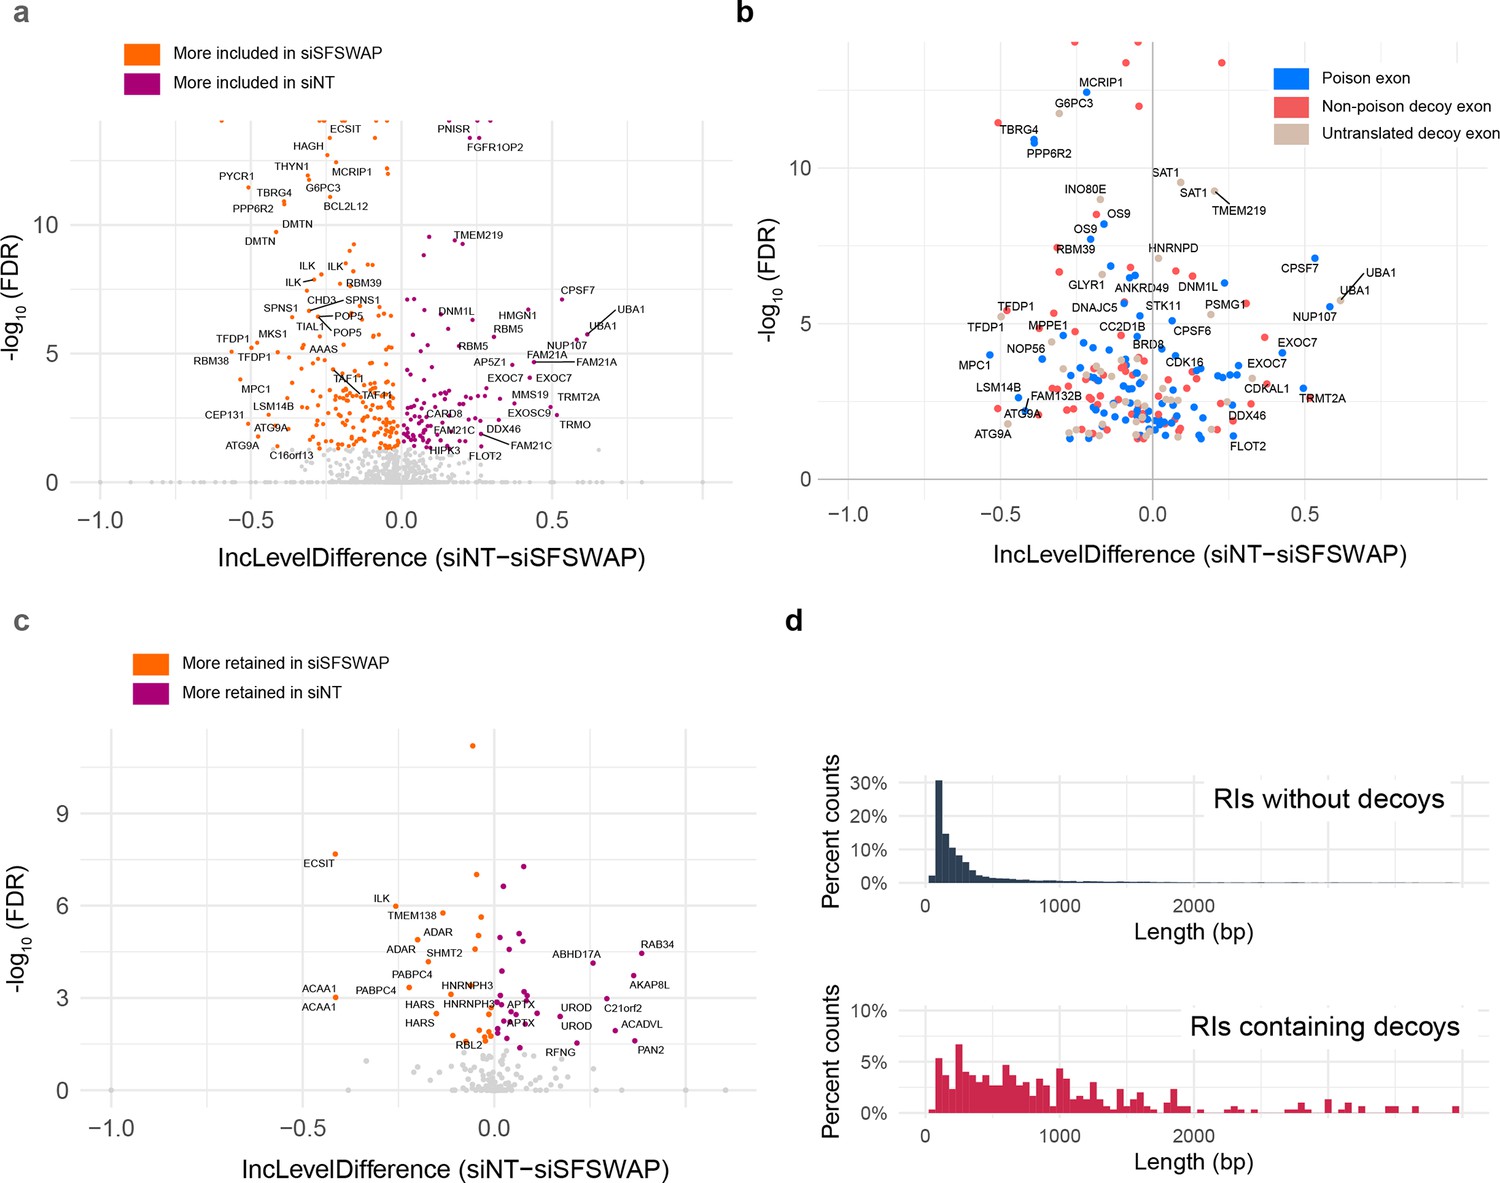
SFSWAP is a global regulator of decoy exon splicing.
(a) Scatter plot of global decoy exon inclusion level changes upon SFSWAP knockdown in a TG-treated background. Statistically significant events are colored. (b) Exon types of the events shown in (a) classified based on the predicted translation outcome. Events shown in blue introduce an in-frame stop codon in the CDS, thus functioning as poison cassettes. (c) Inclusion level changes in decoy-containing retained introns upon SFSWAP knockdown in TG-treated cells. Significant events are colored. (d) Length distribution of the decoy-containing retained introns compared to non-decoy-containing retained introns.
Figure 6 with 2 supplements
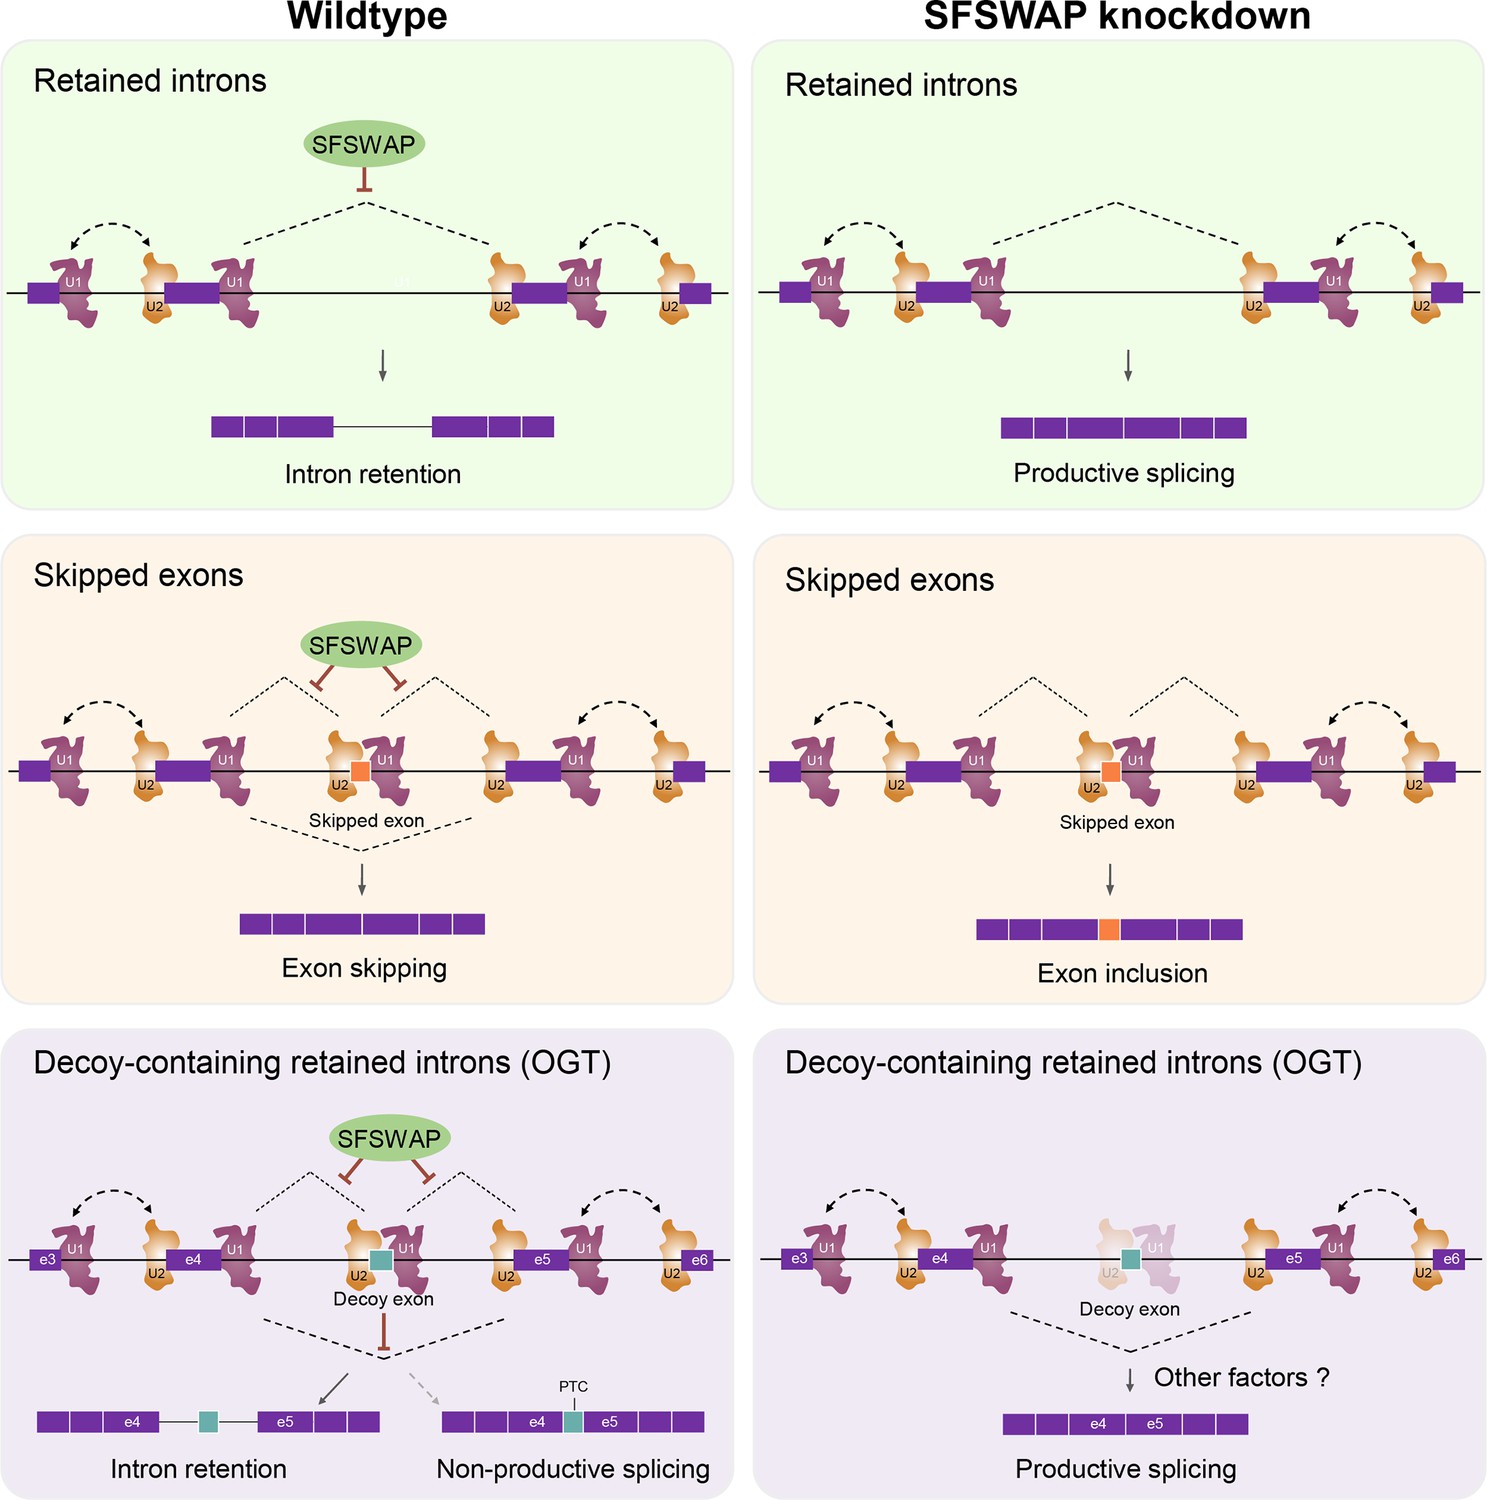
Model for the mechanism of action of SFSWAP on intron retention and exon skipping.
See text for details. In the case of retained introns without decoy exons or cassette exons (top and middle), we suggest that SFSWAP (green oval) restricts splicing subsequent to definition of the exons by U1 and U2. For retained introns with decoys, this inhibition of decoy exon inclusion supports the decoy exon’s function to promote intron retention (see Discussion).
Figure 6—figure supplement 1
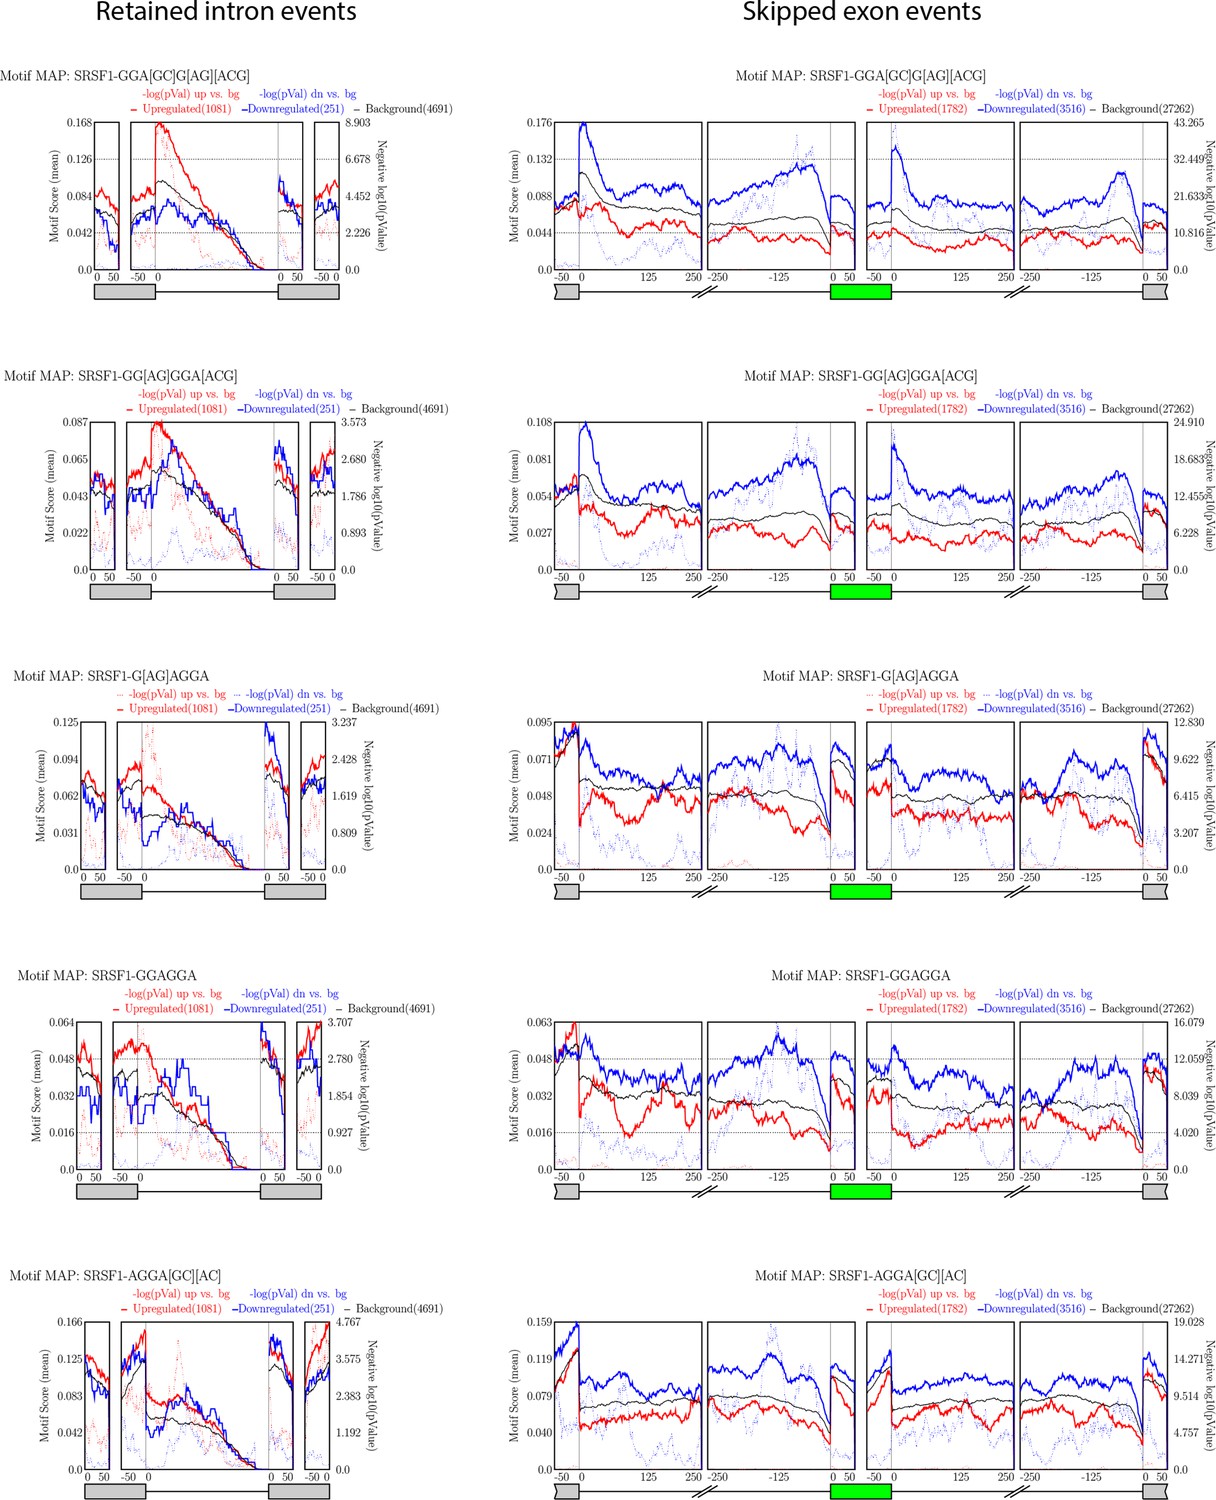
Enrichment of different SRSF1-binding sites on significant alternate splicing events as analyzed by rMAPS.
Enrichment on RI and SE events is shown as a motif score across the regions of interest. Colored solid lines (red or blue) correspond to motif scores for upregulated and downregulated events, respectively, and dotted lines indicate corresponding −log(p-values). The solid black line indicates the background motif score for the region.
Figure 6—figure supplement 2
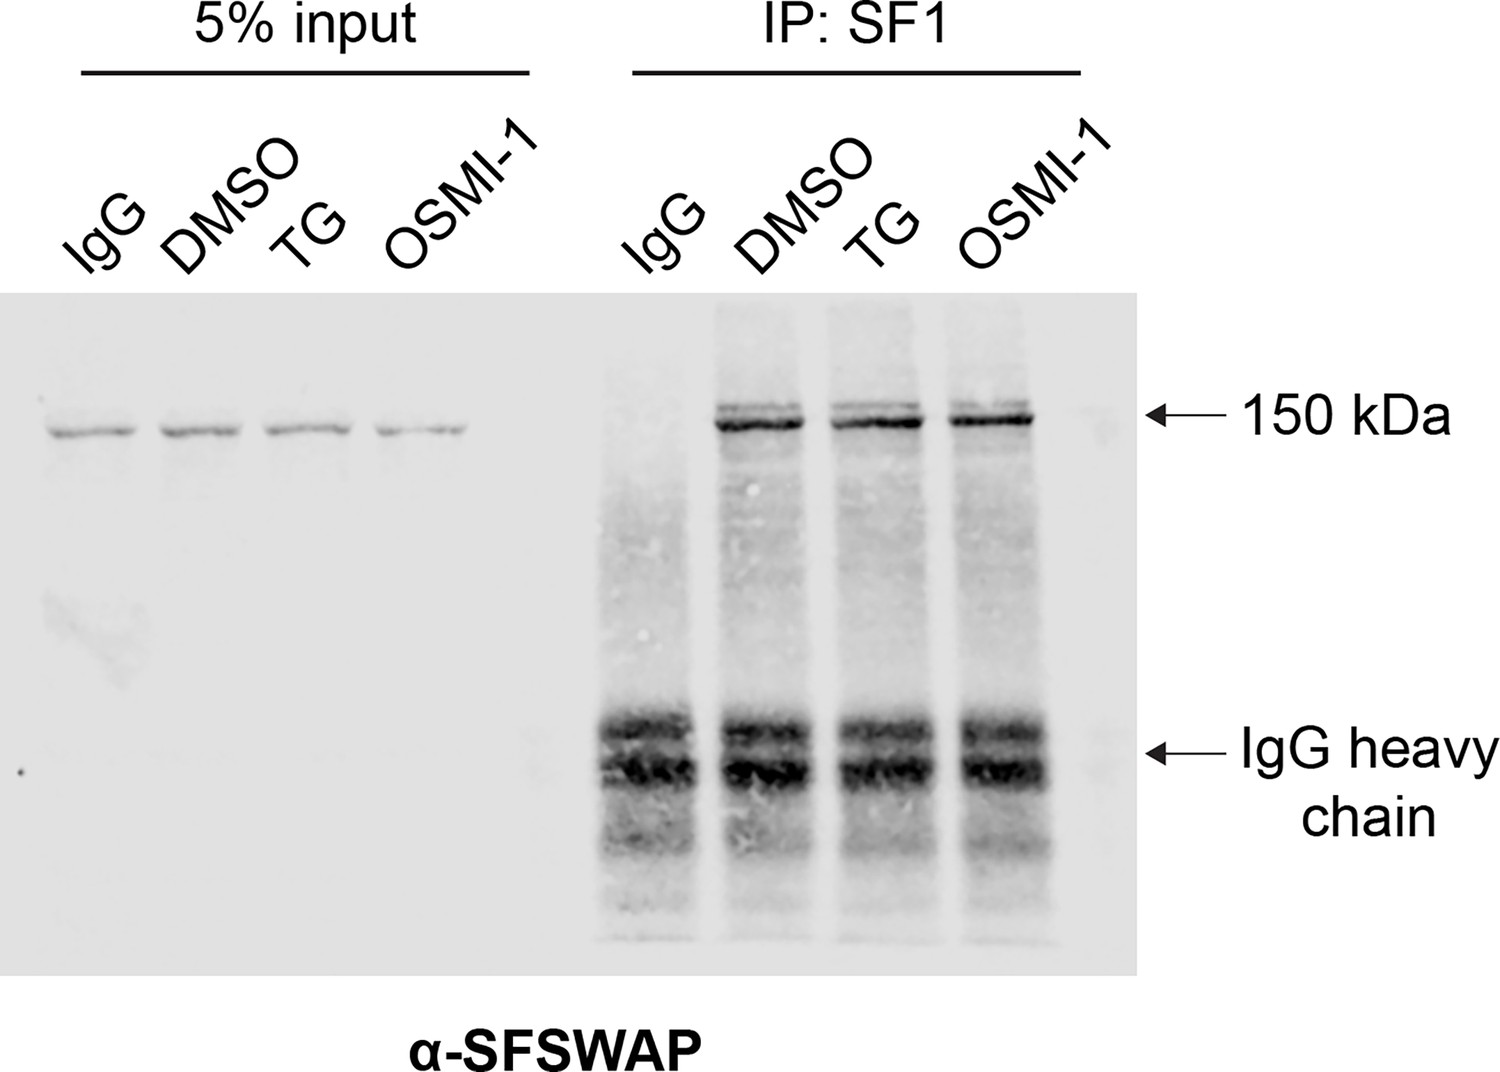
Co-immunoprecipitation (co-IP) analysis of SF1 interaction with SFSWAP.
SF1 was immunoprecipitated with mouse anti-SF1 antibodies from 293A-TOA cells treated with either DMSO, TG, or OSMI-1 and the blot was probed with rabbit anti-SFSWAP antibodies. The ~150 kDa band corresponding to SFSWAP is marked. Notably, IP efficiency does not change upon treatment with TG or OSMI-1.
-
Figure 6—figure supplement 2—source data 1
Co-immunoprecipitation (co-IP) analysis of SF1 interaction with SFSWAP.
- https://cdn.elifesciences.org/articles/104439/elife-104439-fig6-figsupp2-data1-v1.zip
Author response image 1

Tables
Appendix 1—key resources table
| Reagent type (species) or resource | Designation | Source or reference | Identifiers | Additional information |
|---|---|---|---|---|
| Cell line (H. sapiens) | HEK293A-TOA | Dr. Nicholas K. Conrad; Sahin et al., 2010 | UT Southwestern Medical Center | |
| Cell line (H. sapiens) | HEK293T | Dr. Joshua Mendell | UT Southwestern Medical Center | |
| Cell line (H. sapiens) | HCT116 | ATCC | CCL-247 | |
| Cell line (H. sapiens) | HCT116 GFP-β-OGT | This paper | Clone E9 | Maintained by Nicholas K. Conrad lab |
| Strain, strain background (E. coli) | ElectroMAX Stbl4 competent cells | ThermoFisher | Cat #11635018 | Competent cells |
| Strain, strain background (E. coli) | DH5α | ThermoFisher | Cat #EC0112 | Competent cells |
| Antibody | Rabbit polyclonal anti-GFP | Abcam | Cat #ab6556;RRID:AB_305564 | 1:2000 |
| Antibody | Rabbit polyclonal anti-SFSWAP | Bethyl | Cat #A300-985A;RRID:AB_2185354 | 1:1000 |
| Antibody | Rabbit polyclonal anti-SF1 | Abnova | Cat #H00007536-M01;RRID:AB_607016 | 1:5000 |
| Antibody | Goat anti-rabbit IRDye 800CW | LI-COR Biosciences | Cat #926–32211;RRID:AB_621843 | 1:10,000 |
| Antibody | Goat anti-mouse IRDye 800CW | LI-COR Biosciences | Cat #926–32210;RRID:AB_621842 | 1:10,000 |
| Antibody | Mouse monoclonal anti-beta-actin | Abcam | Cat #ab6276; RRID:AB_2223210 | 1:10,000 |
| Antibody | Mouse monoclonal anti-O-GlcNAc (RL2) | Invitrogen | Cat #MA1-072; RRID:AB_326364 | 1:1000 |
| Antibody-based Reagent | Myc-Trap magnetic agarose beads | Chromotek | Cat #ytma | |
| Synthetic Peptide | 2 x Myc-peptide | Chromotek | Cat #2yp | |
| Recombinant DNA reagent | Plasmid: pcDNA3 | ThermoFisher | Cat #V79020 | |
| Recombinant DNA reagent | Plasmid: psPAX2 | Addgene | Plasmid #12260 | psPAX2 was a gift from Didier Trono (Addgene plasmid #12260; http://n2t.net/addgene:12260; RRID:Addgene_12260) |
| Recombinant DNA reagent | Plasmid: pMD2.G | Addgene | Plasmid #12259 | pMD2.G was a gift from Didier Trono (Addgene plasmid #12259; http://n2t.net/addgene:12259; RRID:Addgene_12259) |
| Recombinant DNA reagent | Plasmid: lentiCRISPR v2 | Sanjana et al., 2014 | Plasmid #52961 | lentiCRISPR v2 was a gift from Feng Zhang (Addgene plasmid #52961; http://n2t.net/addgene:52961; RRID:Addgene_52961) |
| Recombinant DNA reagent | Brunello pooled library in lentiCRISPR v2 | Doench et al., 2016 | Pooled Library #73179 | Human Brunello CRISPR knockout pooled library was a gift from David Root and John Doench (Addgene #73179) |
| Recombinant DNA reagent | Plasmid: pc-Myc-SFSWAP | GenScript | Cat #OHu108377 | Obtained as an N-terminal Myc-tagged clone |
| Recombinant DNA reagent | Plasmid: hAAVS1-GFP-T2A-b2-MAT-E8-3 hp2-6m9 | Scarborough et al., 2021 | pNC1330 | |
| Recombinant DNA reagent | Plasmid: hAAVS1-GFP-β-OGT | This paper | pNC1771 | |
| Recombinant DNA reagent | hAAVS1 1 L TALEN | Sanjana et al., 2012 | Plasmid #35431 | hAAVS1 1 L TALEN was a gift from Feng Zhang (Addgene plasmid # 35431; http://n2t.net/addgene:35431; RRID:Addgene_35431) |
| Recombinant DNA reagent | hAAVS1 1 R TALEN | Sanjana et al., 2012 | Plasmid #35432 | hAAVS1 1 R TALEN was a gift from Feng Zhang (Addgene plasmid # 35432; http://n2t.net/addgene:35432; RRID:Addgene_35432) |
| Recombinant DNA reagent | β-OGT | Park et al., 2017 | N/A | β-globin based OGT splicing reporter |
| Commercial assay or kit | CellTiter-Glo | Promega | Cat #G7570 | |
| Commercial assay or kit | AMPure XP | Beckman Coulter | Cat #A63880 | |
| Commercial assay or kit | KAPA mRNA HyperPrep Kit | Roche | Cat # KK8580 | |
| Sequence-based reagent | Negative Control No. 2 siRNA | ThermoFisher | Cat #4390846 | Non-target siRNA |
| Sequence-based reagent | SFSWAP siRNA #1 | ThermoFisher | Assay ID #s12746 | Silencer select siRNA |
| Sequence-based reagent | SFSWAP siRNA #2 | ThermoFisher | Assay ID #s12748 | Silencer select siRNA |
| Sequence-based reagent | UPF1 siRNA #1 | Sigma-Aldrich | siRNA ID # SASI_Hs01_00101017 | Mission siRNA |
| Sequence-based reagent | UPF1 siRNA #2 | Sigma-Aldrich | siRNA ID # SASI_Hs01_00101018 | Mission siRNA |
| Sequence-based reagent | OGT siRNA #1 | ThermoFisher | Assay ID #s16094 | Silencer select siRNA |
| Sequence-based reagent | OGT siRNA #2 | ThermoFisher | Assay ID #s16095 | Silencer select siRNA |
| Sequence-based reagent | NIPP1 siRNA #1 | ThermoFisher | Assay ID #s10954 | Silencer select siRNA |
| Sequence-based reagent | NIPP1 siRNA #2 | ThermoFisher | Assay ID #s10955 | Silencer select siRNA |
| Sequence-based reagent | LSM4 siRNA #1 | ThermoFisher | Assay ID #s24521 | Silencer select siRNA |
| Sequence-based reagent | LSM4 siRNA #2 | ThermoFisher | Assay ID #s24522 | Silencer select siRNA |
| Sequence-based reagent | BCAS2 siRNA #1 | ThermoFisher | Assay ID #s20104 | Silencer select siRNA |
| Sequence-based reagent | BCAS2 siRNA #2 | ThermoFisher | Assay ID #s20105 | Silencer select siRNA |
| Sequence-based reagent | ELAVL1 siRNA #1 | ThermoFisher | Assay ID #s4609 | Silencer select siRNA |
| Sequence-based reagent | ELAVL1 siRNA #2 | ThermoFisher | Assay ID #4610 | Silencer select siRNA |
| Sequence-based reagent | HNRNPU siRNA #1 | ThermoFisher | Assay ID #s6745 | Silencer select siRNA |
| Sequence-based reagent | HNRNPU siRNA #2 | ThermoFisher | Assay ID #s6744 | Silencer select siRNA |
| Sequence-based reagent | ZNF236 siRNA #1 | ThermoFisher | Assay ID #s15328 | Silencer select siRNA |
| Sequence-based reagent | ZNF236 siRNA #2 | ThermoFisher | Assay ID #s15326 | Silencer select siRNA |
| Sequence-based reagent | ZC3H13 siRNA #1 | ThermoFisher | Assay ID #s23011 | Silencer select siRNA |
| Sequence-based reagent | ZC3H13 siRNA #2 | ThermoFisher | Assay ID #s23012 | Silencer select siRNA |
| Sequence-based reagent | ZNHIT2 siRNA #1 | ThermoFisher | Assay ID #s194322 | Silencer select siRNA |
| Sequence-based reagent | ZNHIT2 siRNA #2 | ThermoFisher | Assay ID #s2212 | Silencer select siRNA |
| Sequence-based reagent | SF1 siRNA #1 | ThermoFisher | Assay ID #s14976 | Silencer select siRNA |
| Sequence-based reagent | SF1 siRNA #2 | ThermoFisher | Assay ID #s200464 | Silencer select siRNA |
| Sequence-based reagent | KIAA1429 siRNA #1 | ThermoFisher | Assay ID #s24832 | Silencer select siRNA |
| Sequence-based reagent | KIAA1429 siRNA #2 | ThermoFisher | Assay ID #s24833 | Silencer select siRNA |
| Software, algorithm | FlowJo | BD Biosciences | v 10 | |
| Software, algorithm | Snapgene | Dotmatics | v 7.2.1 | |
| Software, algorithm | rMATS | Shen et al., 2014 | v 4.3.0 | |
| Software, algorithm | STAR | Dobin et al., 2013 | v 2.7 | |
| Software, algorithm | Cutadapt | DOI:10.14806/ej.17.1.200 | v 1.9.1 | |
| Software, algorithm | FastQC | http://www.bioinformatics.babraham.ac.uk/projects/fastqc/ | v 0.11.5 | |
| Software, algorithm | Rstudio | Posit Software | 2024.04.1 | |
| Software, algorithm | MAGeCK-VISPR | Li et al., 2015 | v 0.5.6 | |
| Software, algorithm | Whippet | Kreppel et al., 1997; Sterne-Weiler et al., 2018 | v 1.6.1 | |
| Software, algorithm | MAJIQ | Vaquero-Garcia et al., 2023 | v 2.4.dev102 | |
| Software, algorithm | maser | https://github.com/DiogoVeiga/maser | v 1.22.0 | |
| Software, algorithm | bedtools | Quinlan and Hall, 2010 | v 2.29.0 | |
| Software, algorithm | minimap2 | Li, 2018 | v 2.26 | |
| Software, algorithm | edgeR | Robinson et al., 2010 | v 4.2.1 | |
| Software, algorithm | DESeq2 | Love et al., 2014 | v 1.44.0 | |
| Software, algorithm | EDASeq | Risso et al., 2011 | v 2.38.0 | |
| Software, algorithm | RUVSeq | Risso et al., 2014 | v 1.38.0 | |
| Software, algorithm | rMAPS2 web server | Hwang et al., 2020 | N/A | http://rmaps.cecsresearch.org/ |
| Software, algorithm | rmats2sashimiplot | https://github.com/Xinglab/rmats2sashimiplot | v 3.0.0 | |
| Software, algorithm | Graphpad Prism | Dotmatics | v 10.3.0 |
Additional files
-
Supplementary file 1
Full list of putative target genes identified by MAGeCK analysis of TG-treated gain of GFP CRISPR screen (n = 3).
- https://cdn.elifesciences.org/articles/104439/elife-104439-supp1-v1.txt
-
Supplementary file 2
Full list of putative target genes identified by MAGeCK analysis of untreated gain of GFP CRISPR screen (n = 1).
- https://cdn.elifesciences.org/articles/104439/elife-104439-supp2-v1.txt
-
Supplementary file 3
List of differentially expressed genes upon SFSWAP knockdown (unreated samples) as determined by edgeR analysis.
- https://cdn.elifesciences.org/articles/104439/elife-104439-supp3-v1.csv
-
Supplementary file 4
List of differential splicing events upon SFSWAP knockdown (untreated samples) as analyzed by rMATS.
- https://cdn.elifesciences.org/articles/104439/elife-104439-supp4-v1.zip
-
Supplementary file 5
List of differential splicing events upon SFSWAP knockdown (untreated samples) as analyzed by Whippet.
- https://cdn.elifesciences.org/articles/104439/elife-104439-supp5-v1.csv
-
Supplementary file 6
List of differential splicing events upon SFSWAP knockdown (untreated samples) as analyzed by MAJIQ.
- https://cdn.elifesciences.org/articles/104439/elife-104439-supp6-v1.zip
-
Supplementary file 7
List of potential decoy exons analyzed in Figure 5.
- https://cdn.elifesciences.org/articles/104439/elife-104439-supp7-v1.csv
-
Supplementary file 8
List of primers used.
- https://cdn.elifesciences.org/articles/104439/elife-104439-supp8-v1.zip
-
MDAR checklist
- https://cdn.elifesciences.org/articles/104439/elife-104439-mdarchecklist1-v1.docx
Download links
A two-part list of links to download the article, or parts of the article, in various formats.
Downloads (link to download the article as PDF)
Open citations (links to open the citations from this article in various online reference manager services)
Cite this article (links to download the citations from this article in formats compatible with various reference manager tools)
SFSWAP is a negative regulator of OGT intron detention and global pre-mRNA splicing
eLife 13:RP104439.
https://doi.org/10.7554/eLife.104439.3


