Stem cell progeny contribute to the schistosome host-parasite interface
- University of Illinois at Urbana-Champaign, United States
- UT Southwestern Medical Center, United States
- Howard Hughes Medical Institute, University of Illinois at Urbana-Champaign, United States
Figures
Figure 1 with 2 supplements
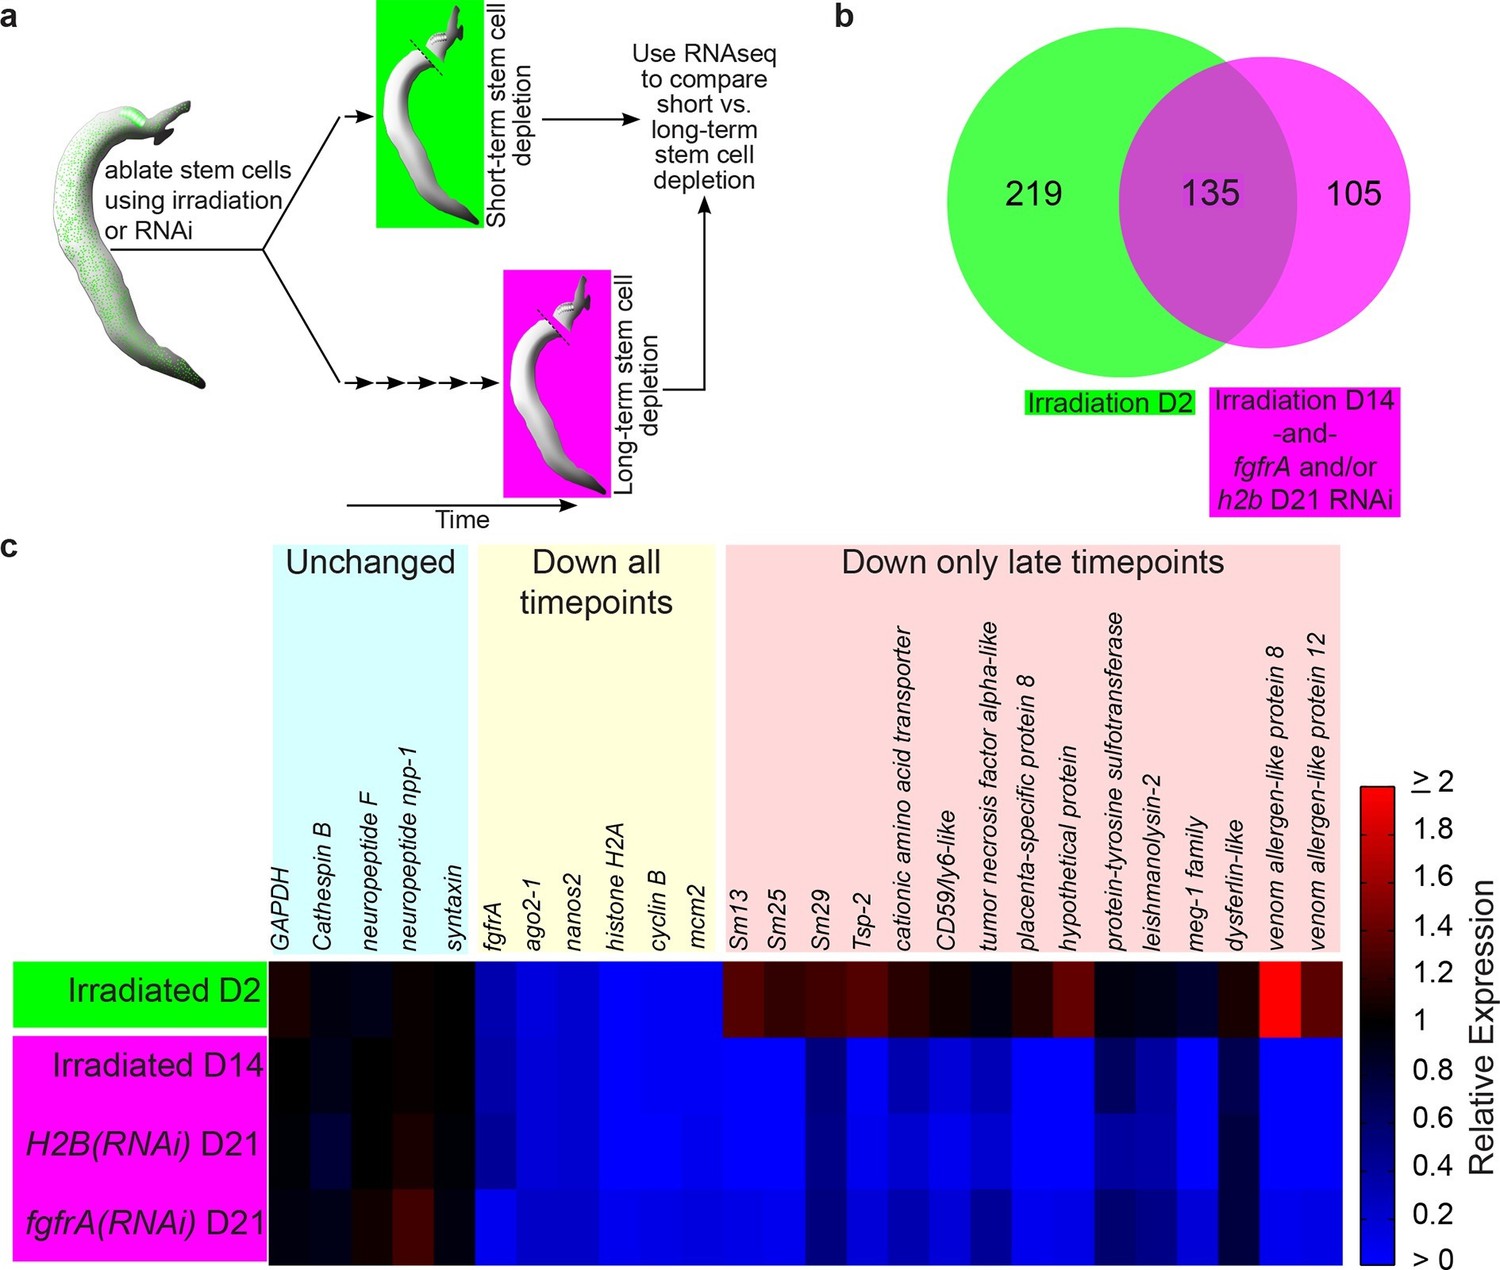
Identification of genes down-regulated after long-term stem cell depletion.
(a) Scheme for transcriptional profiling studies. (b) Venn Diagram showing number of genes significantly down-regulated after short-term (green) and long-term (magenta) stem cell depletion. (c) Heat map showing relative gene expression for various treatments and time points. Only a subset of representative genes is displayed.
Figure 1—figure supplement 1
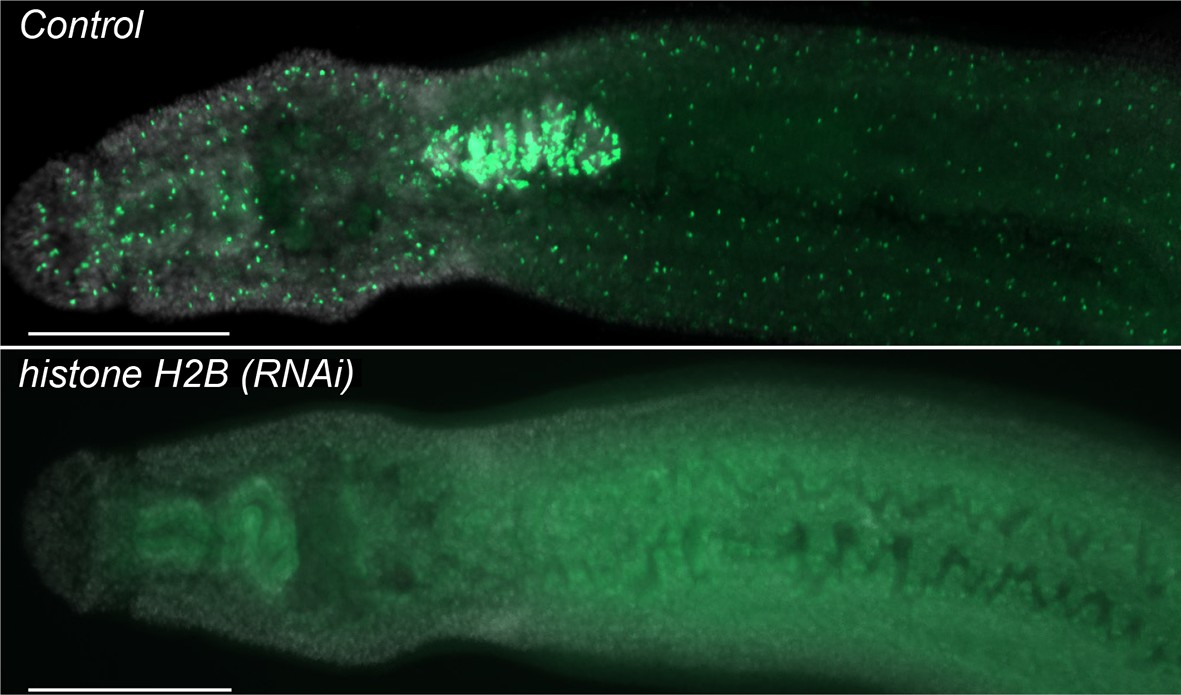
histone H2B is required to maintain proliferative neoblasts.
Parasites were treated with either control or histone H2B dsRNA for four days and then labeled at Day 11 overnight with 10 µM EdU and fixed the following day. Parasites treated with histone H2B dsRNA display a rapid and robust loss of neoblasts. n > 5 parasites. Scale bar: 200 µm.
Figure 1—figure supplement 2
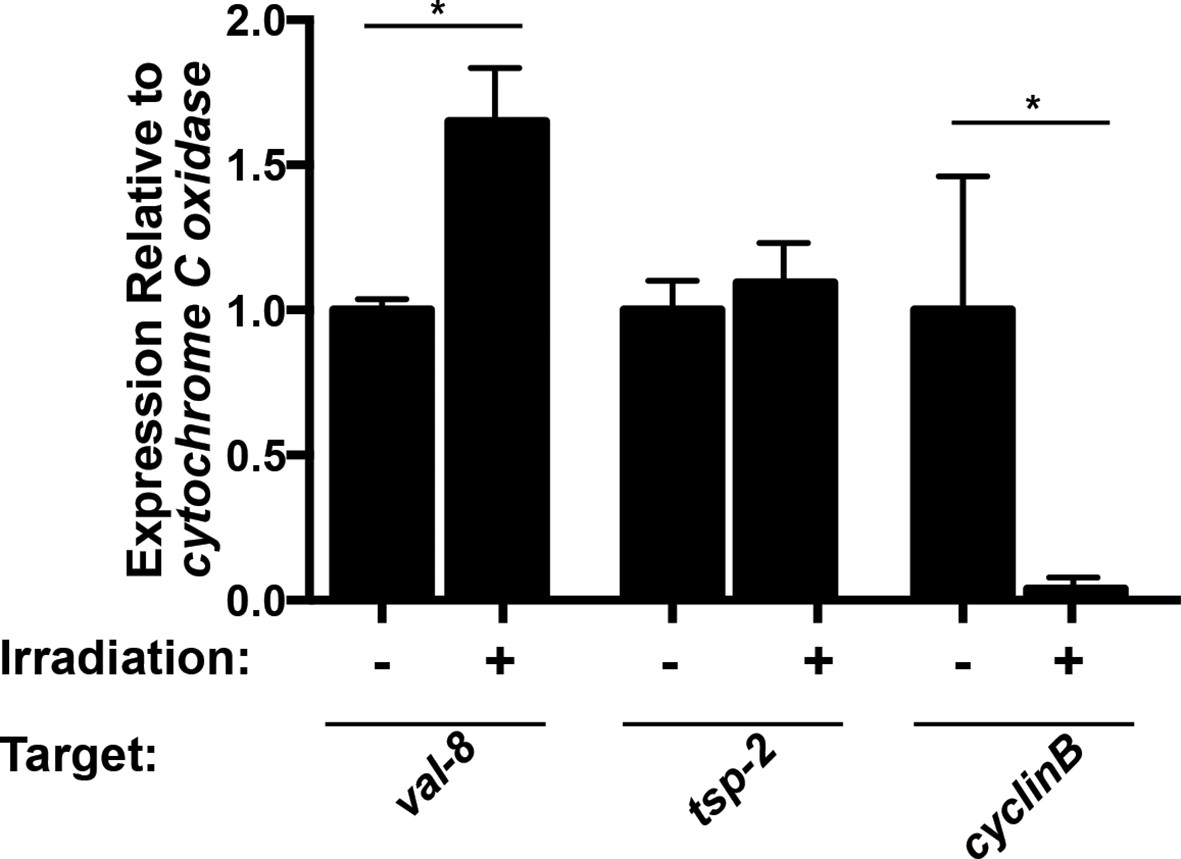
val-8 expression is increased 48 hr following irradiation.
Quantitative real time PCR analysis of val-8 48 hr post-irradiation. Levels of tsp-2 and cyclin B gene expression are shown as negative and positive controls, respectively. n=3 biological replicates, *p<0.005, Student’s t-test.
Figure 2 with 1 supplement

Cells expressing DIS genes are lost following stem cell depletion and express genes associated with the schistosome tegument.
(a) Whole-mount in situ hybridization to detect genes expressed in: the intestine (Cathepsin B); neoblasts (fgfrA, nanos2); or cells expressing DIS genes (tsp-2, sm13, sm29, val-8) in either untreated parasites or worms at D2 or D7 following irradiation. p53 is also shown as an example of a gene modestly down-regulated at early time points and highly down-regulated at late time points after neoblast ablation. Expression of DIS genes is unaffected at day 2 following irradiation but is substantially reduced by day 7. n > 3 for each data point. (b) Left, cartoon showing the organization of the schistosome tegument. Right, fluorescence in situ hybridization and DAPI labeling overlaid on a Differential Interference Contrast (DIC) micrograph showing the distribution of tsp-2+ cells relative to the tegument. Although some cells expressing lower levels of tsp-2 are located more internally, a majority of tsp-2+ cells were located just beneath the parasite muscle layer. (c) Double fluorescence in situ hybridization showing co-localization of tsp-2 with the indicated tegumental factors. Images are representative of parasites (n > 3) recovered from two separate groups of mice. Scale bars: (a) 100 µm, (b, c) 20 µm.
Figure 2—figure supplement 1
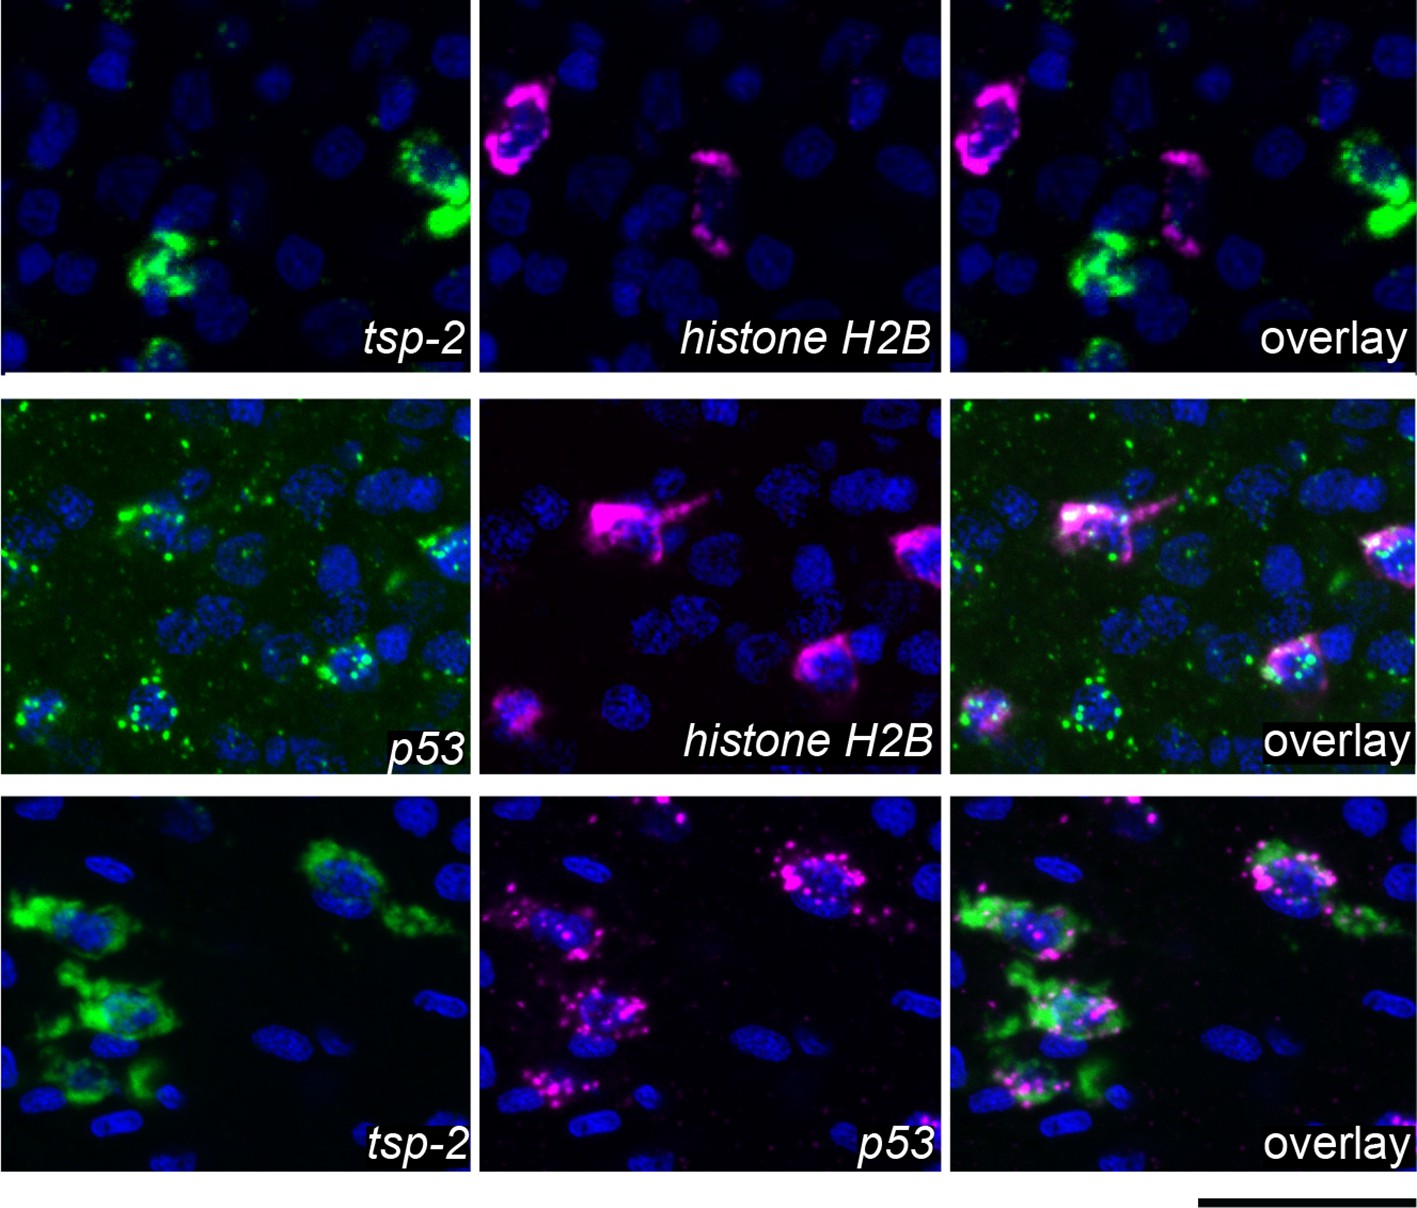
DIS genes are expressed in a population of cells that is distinct from the neoblasts.
Double fluorescence in situ hybridization showing expression of tsp-2, p53, and the stem cell marker histone H2B. tsp-2 is not expressed in histone H2B+ stem cells, whereas p53 is expressed in the histone H2B+ cells. tsp-2 and p53 are co-expressed. Thus, neoblasts and tsp-2+cells are distinct and both express p53. Images are representative of parasites (n > 3) recovered from at least two separate groups of mice. Scale bars, 20 µm.
Figure 3
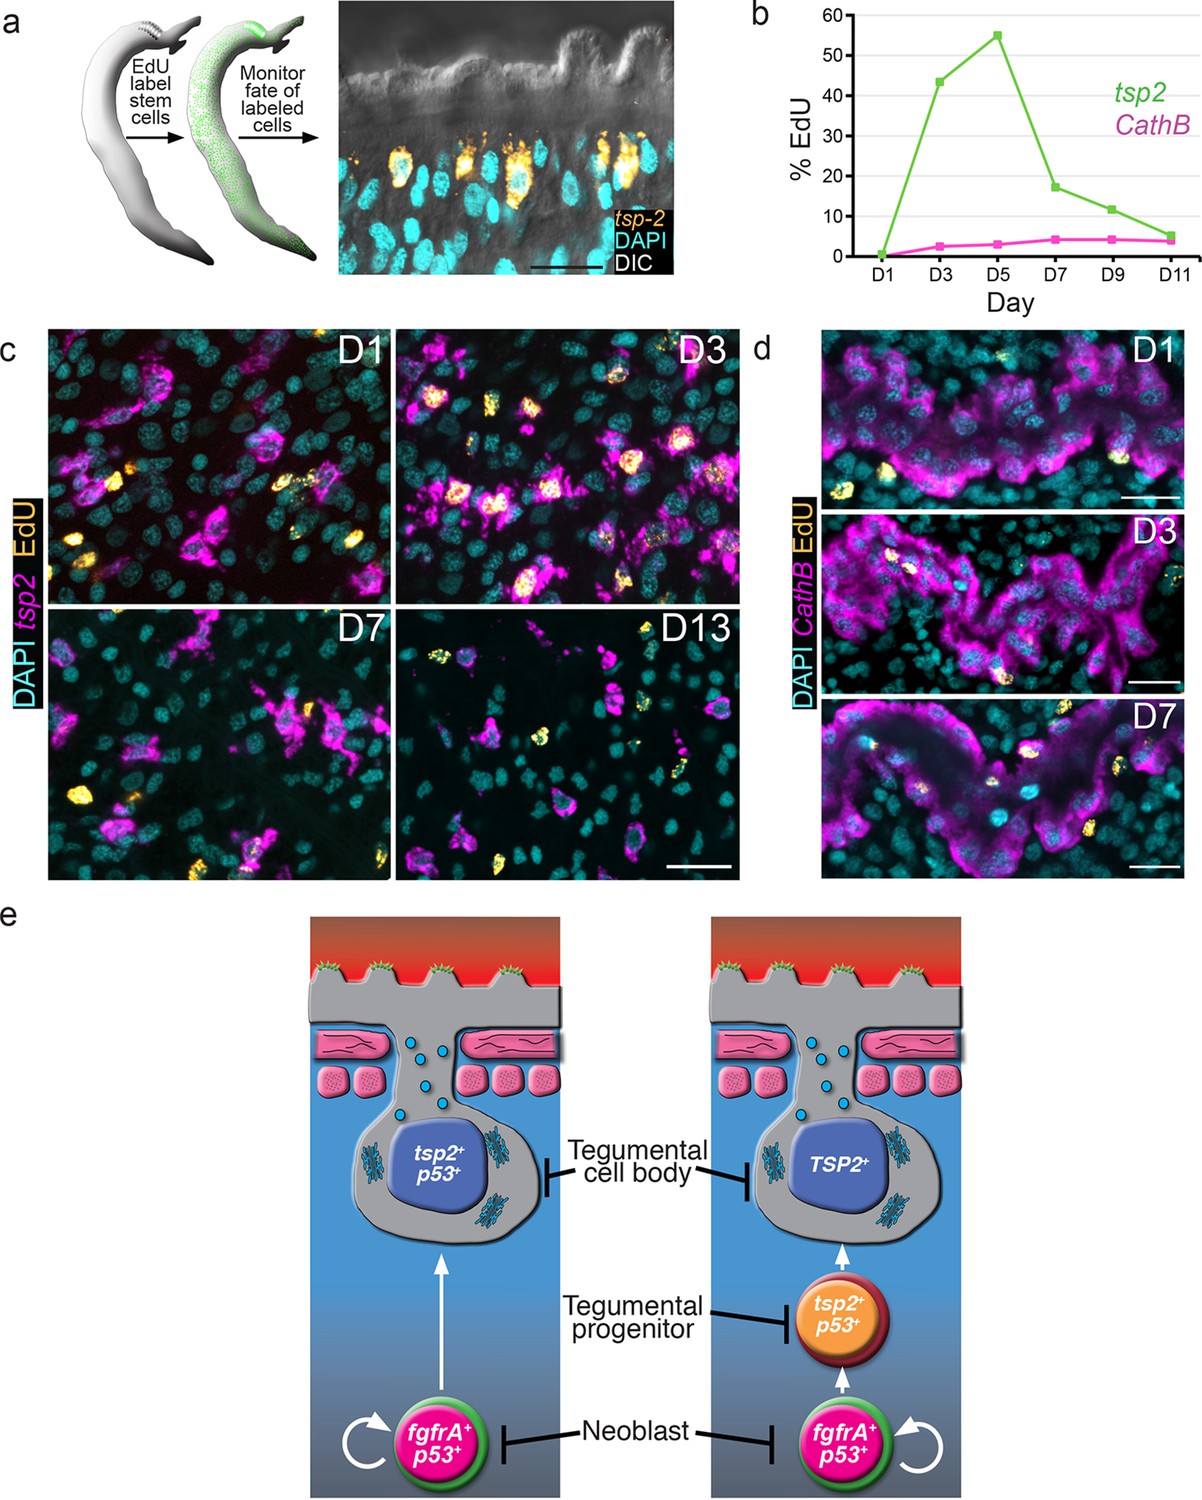
tsp-2+ cells are renewed by stem cells and then rapidly turned over.
(a) Cartoon showing EdU pulse-chase strategy to examine the differentiation of stem cells into tsp-2+ cells. (b) Quantification of the number of EdU+tsp-2+or EdU+cathepsin B+ cells following a single pulse of EdU given to parasites in vivo. Percentages of EdU+ tsp-2+/total tsp-2+ cells were D1 0.22% (2/917), D3 41% (323/787), D5 52% (299/575), 13% (57/437), D9 8.1% (49/603), D11 1.4% (8/567). Percentages of EdU+ Cathepsin B/ total Cathepsin B+ cells were D1 0% (0/1570), D3 2.4% (26/1057), D5 2.9% (61/2044), D7 4.2% (58/1359), D9 4.3% (106/2469), D11 3.9% (64/1646). Data were collected from > 5 male parasites recovered from two separate mice, except for cathepsin B labeling at D11 where parasites were recovered from a single mouse. (c, d) Fluorescence in situ hybridization showing the EdU labeling of tsp-2+ or cathepsin B+ cells at various time points following an EdU pulse. Scale bars, 15 µm. (e) Potential models for tegumental cell differentiation.
Additional files
-
Supplementary file 1
Spreadsheet detailing genes down-regulated at early and late time points after stem cell depletion.
- https://doi.org/10.7554/eLife.12473.009
-
Supplementary file 2
Spreadsheet containing detailed expression information from Day 14 post-irradiation, histone H2B(RNAi), and fgfrA(RNAi) RNAseq experiments.
- https://doi.org/10.7554/eLife.12473.010
-
Supplementary file 3
Spreadsheet detailing oligonucleotide primers used in this study.
- https://doi.org/10.7554/eLife.12473.011
Download links
A two-part list of links to download the article, or parts of the article, in various formats.
Downloads (link to download the article as PDF)
Open citations (links to open the citations from this article in various online reference manager services)
Cite this article (links to download the citations from this article in formats compatible with various reference manager tools)
Stem cell progeny contribute to the schistosome host-parasite interface
eLife 5:e12473.
https://doi.org/10.7554/eLife.12473


