A molecular portrait of maternal sepsis from Byzantine Troy
- McMaster University, Canada
- MYcroarray, United States
- School of Medicine and Public Health, University of Wisconsin-Madison, United States
- University of Wisconsin-Madison, United States
- University of Iowa, United States
- Tübingen University, Germany
- University of California, United States
- Biotechnology Center, University of Wisconsin-Madison, United States
- Lawrence Livermore National Laboratory, United States
- National Institute of Infectious Diseases, Japan
- Yale University, United States
- University of Pisa, Italy
- The University of Sydney, Australia
- Canadian Institute for Advanced Research, Canada
Figures
Figure 1 with 9 supplements
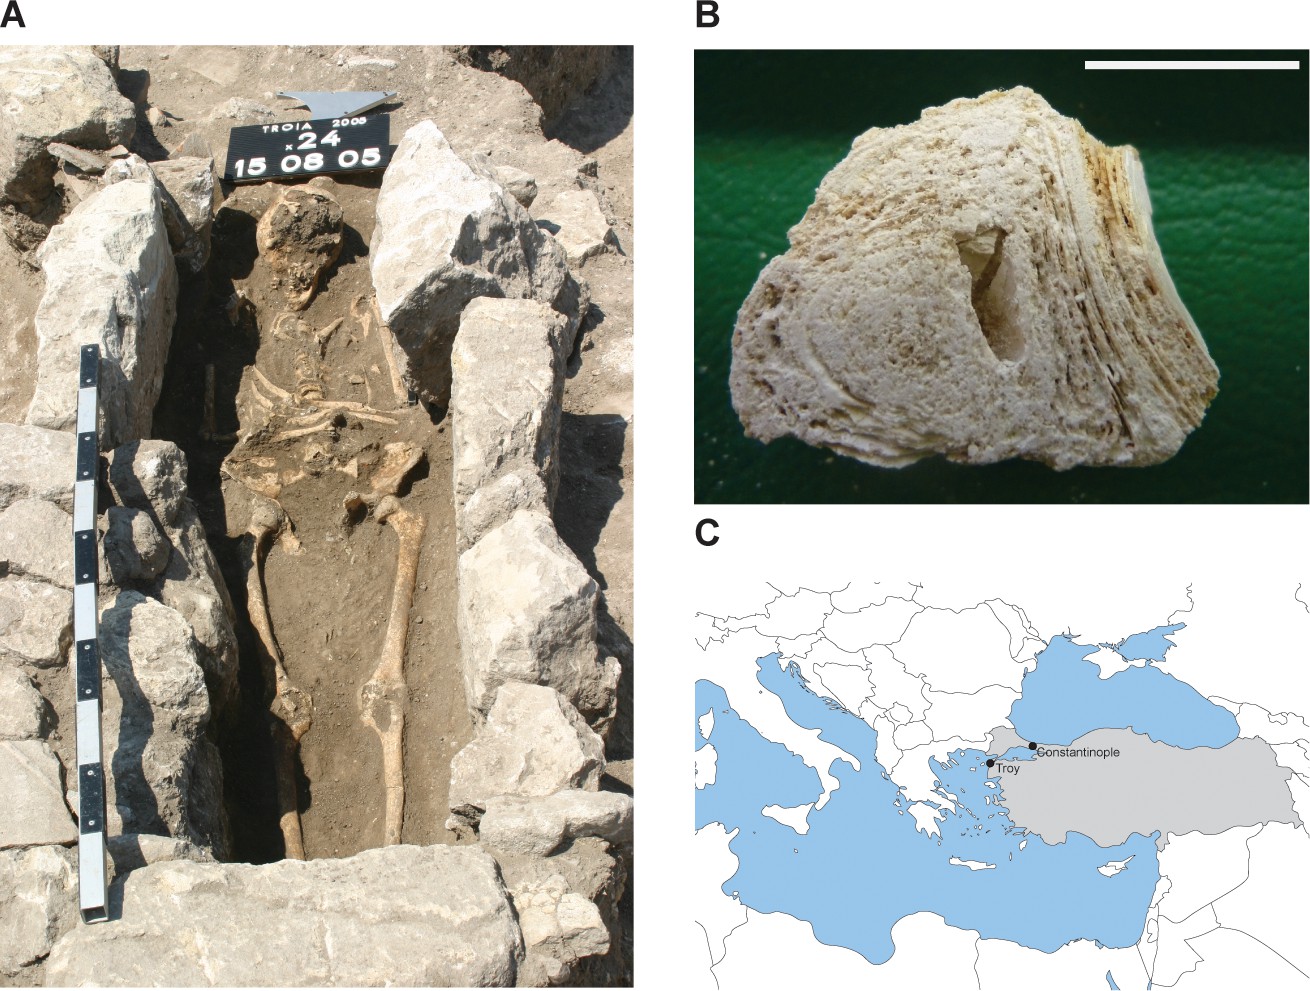
Calcified nodule found among the skeletal remains at Troy.
(A) Burial x24.177 (grave 14, cemetery in quadrat x24). Photo credit Gebhard Bieg, 2005. (B) Cross-section of nodule (sample no x24.177), photo credit: Pathologie Nordhessen 2009. Scale represents 1 cm. (C) Location of Troy. Modern day Turkey is shaded in gray.
Figure 1—figure supplement 1
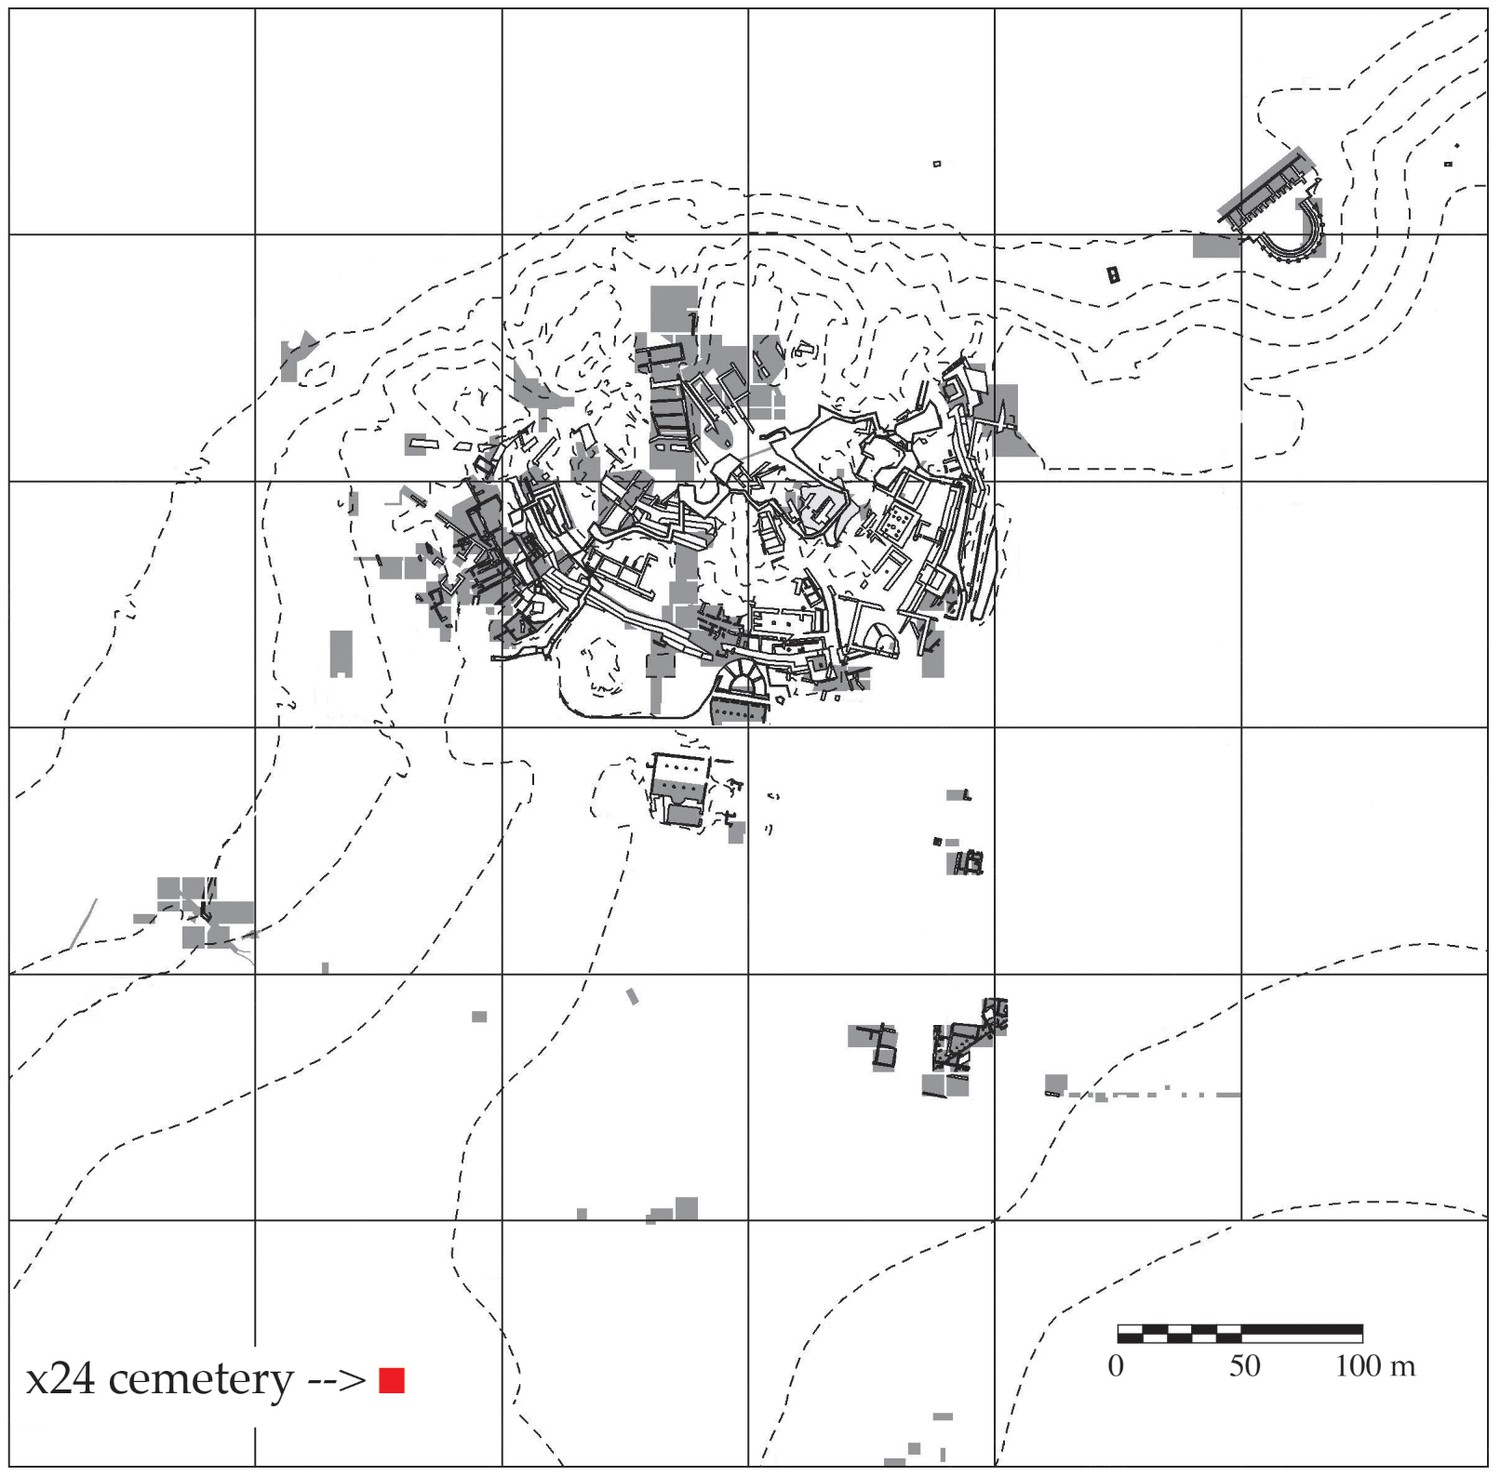
Map of Troy showing the cemetery in Grid Square x24 and areas of excavation 1988–2012.
Areas of excavation are in gray and the cemetery is marked with a red square. North is at the top of the plan.
Figure 1—figure supplement 2
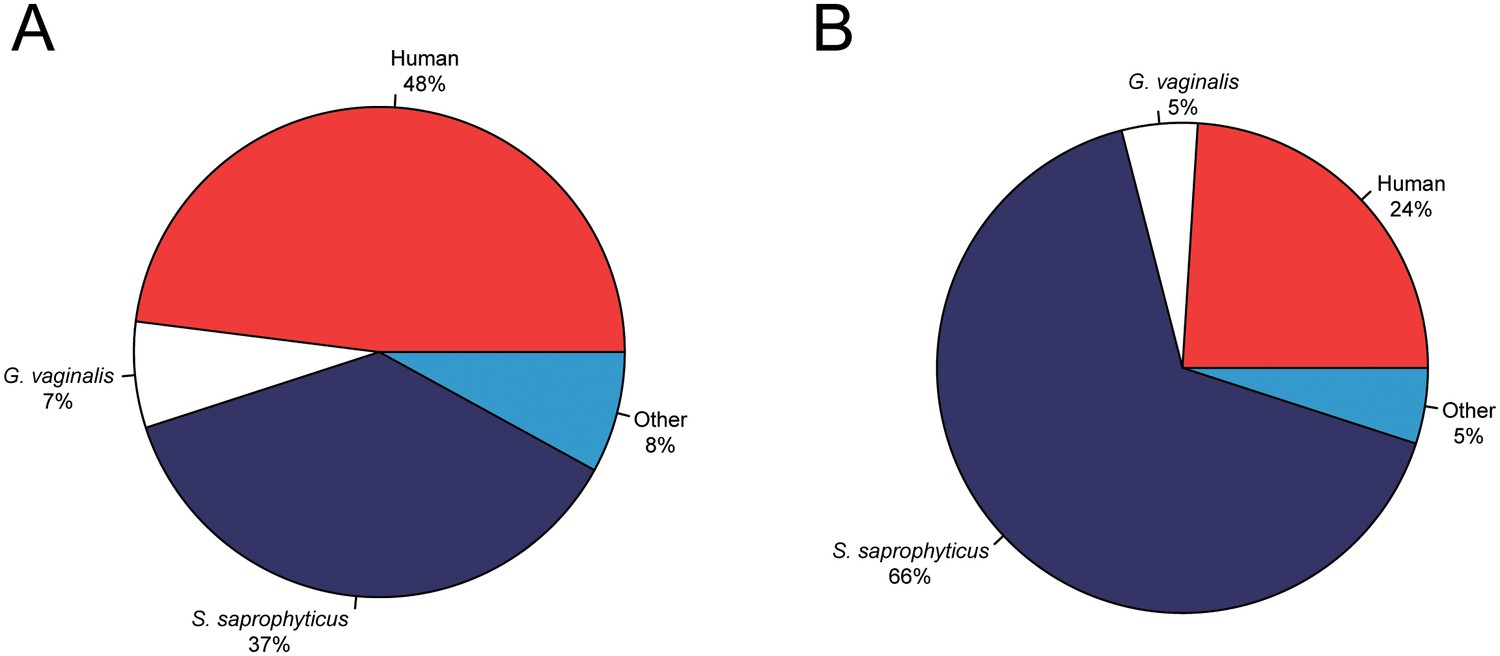
Metagenomic profiles of shotgun DNA libraries from nodules, based on BLAST analysis of all reads >35 bp length.
(A) Nodule one (Nod1_1h-UDG), 28,713,282 reads total (B) Nodule two (Nod2-UDG), 6,038,994 reads total.
Figure 1—figure supplement 3
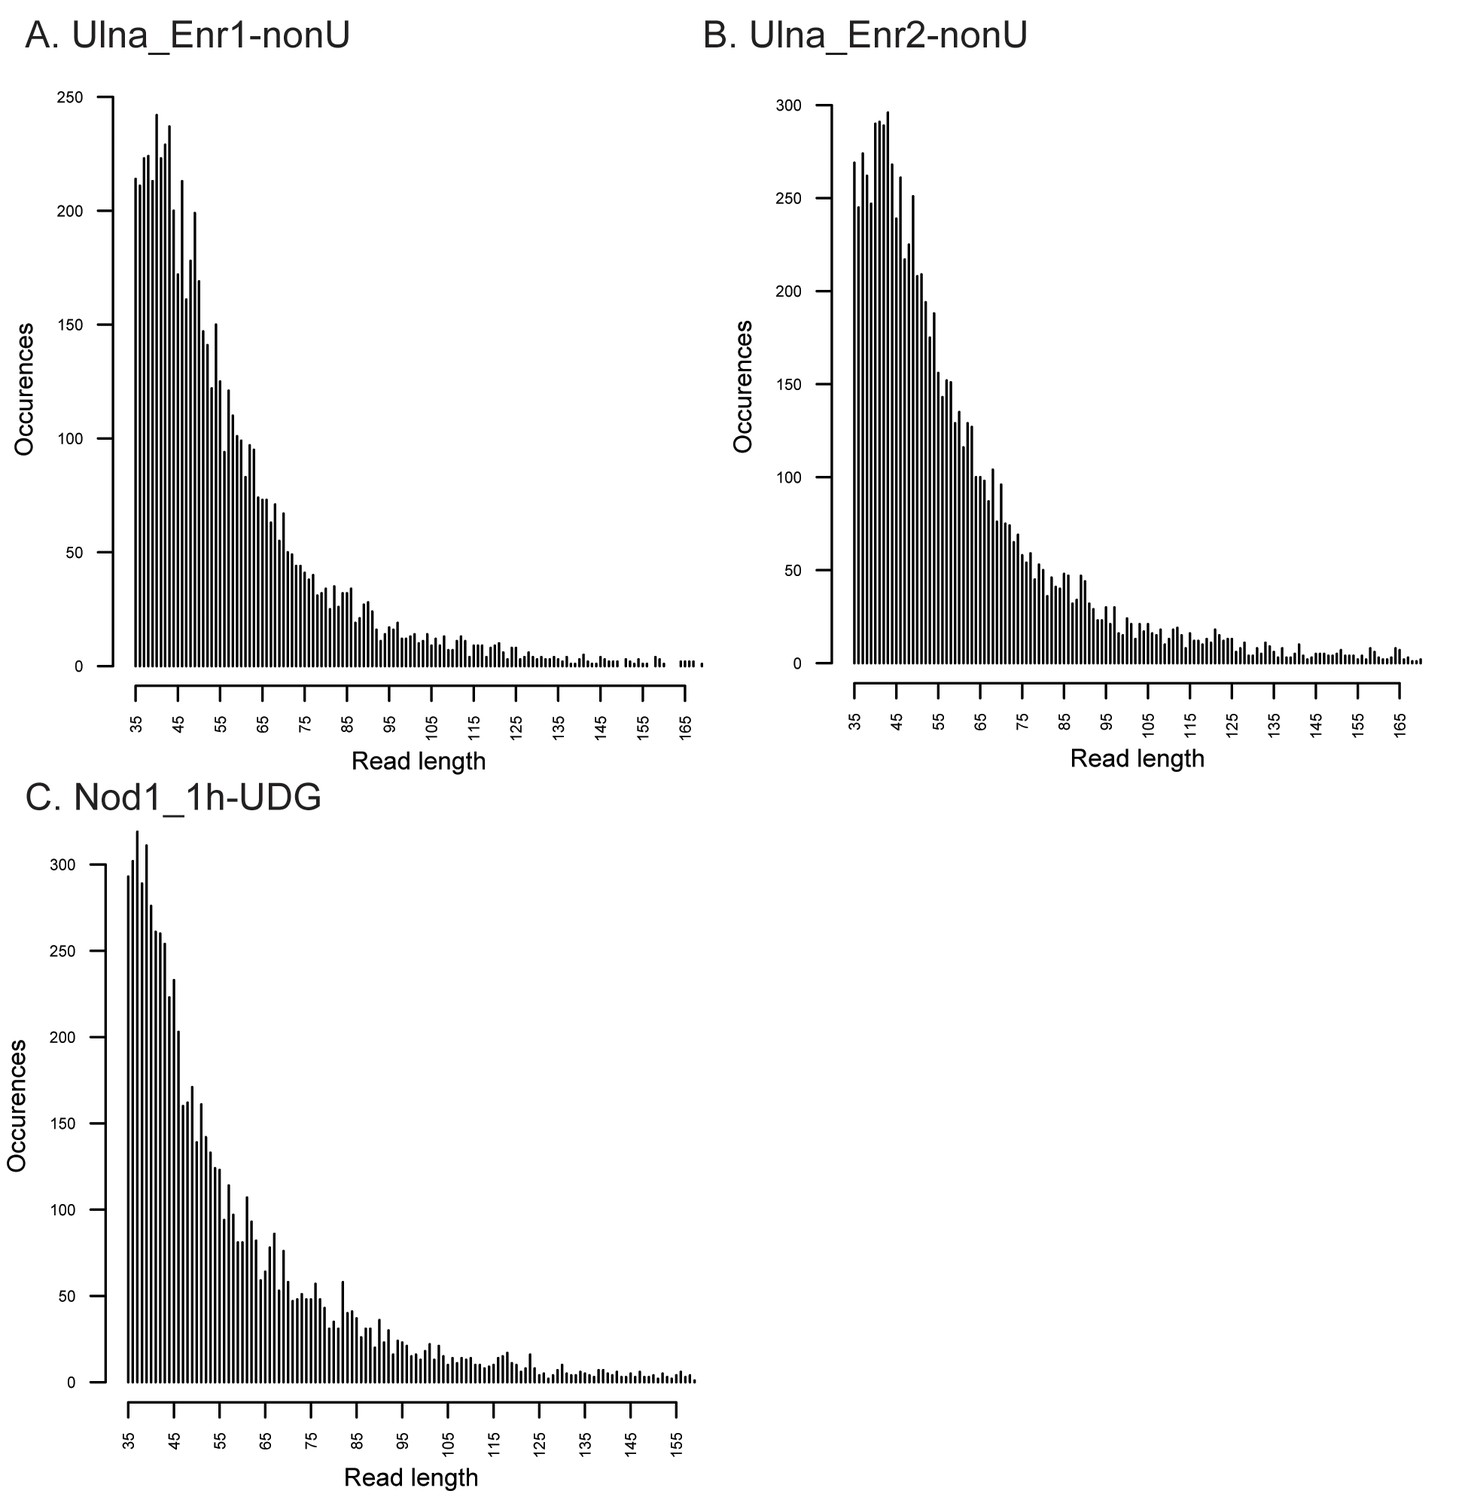
Fragment length distributions for non-UDG treated human mitochondrial assemblies.
These FLDs were generated from the Ulna enriched libraries (A + B) as well as the non enriched nodule (C) using mapDamage2 (Jonsson et al., 2013) from merged nonUDG data sets assembled to the human mitochondrial reference genome (Andrews et al., 1999), NCBI accession NC_012920.
Figure 1—figure supplement 4
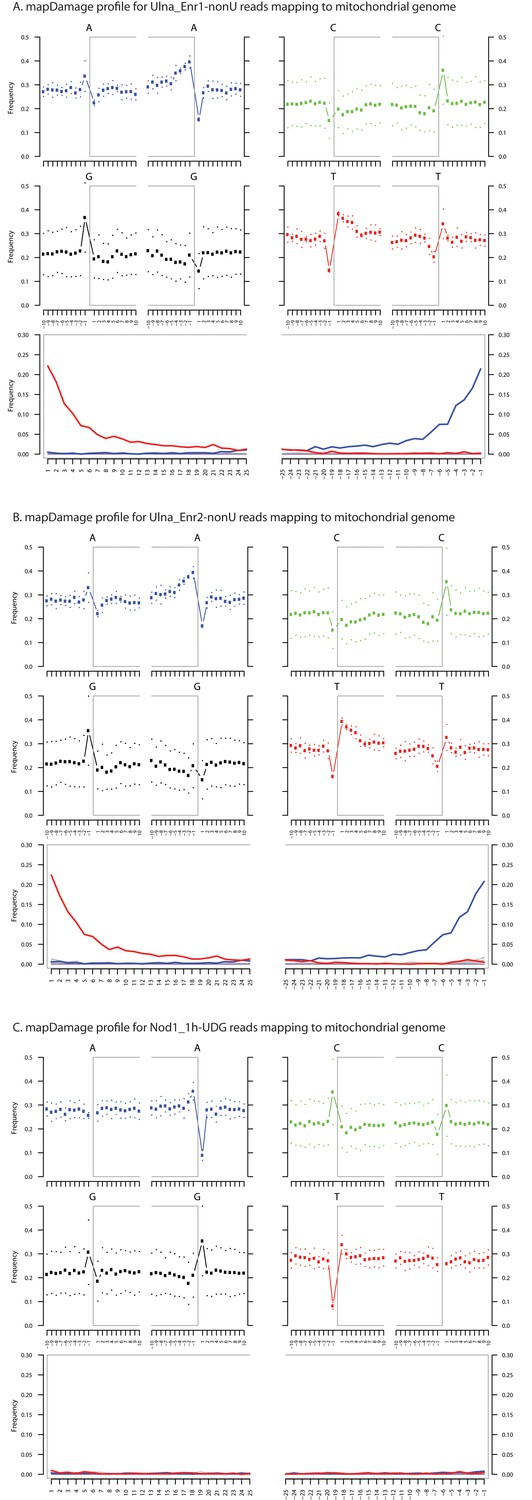
Ancient DNA damage assessment of human mitochondrial reads.
Damage profiles of non-UDG treated (‘nonU’) as well as UDG treated merged reads assembled to the human mitochondrial rCRS reference genome (NC_012920) for (A) Ulna_Enr1-nonU round one human mitochondrial enrichment, (B) Ulna_Enr2-nonU round 2, and (C) a Nod1_1h-UDG reads (which have been UDG treated). Damage profiles were generated using mapDamage2.(Jonsson et al., 2013).
Figure 1—figure supplement 5
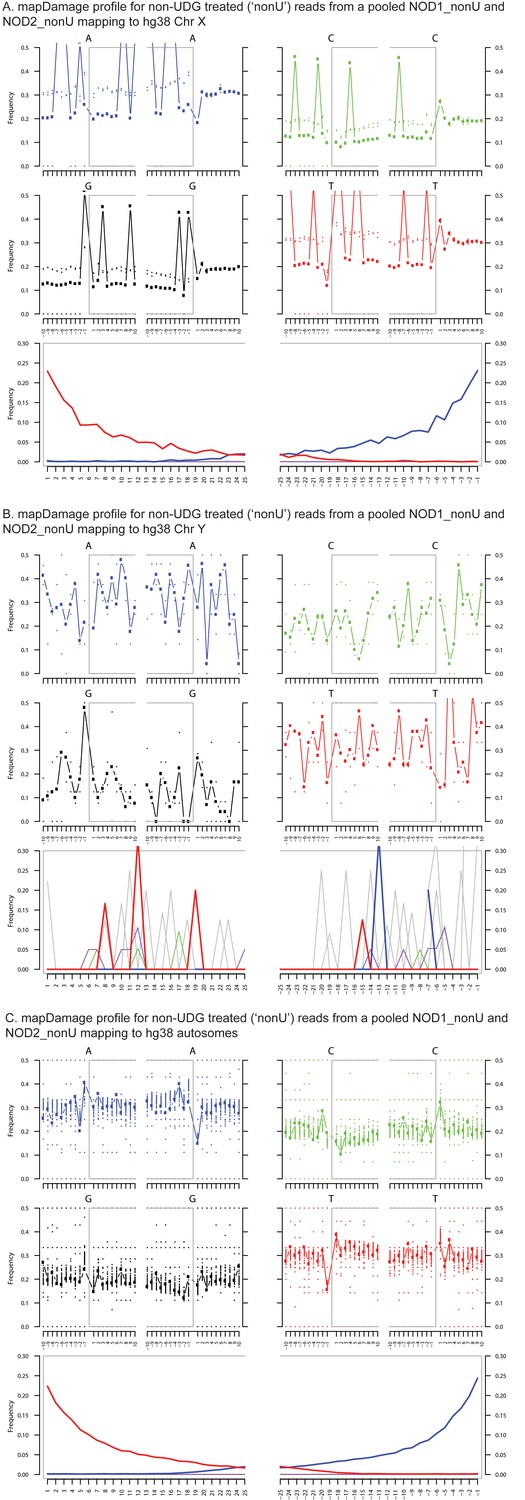
Ancient DNA damage assessment of reads mapped to hg38 chrX, chrY and autosomes.
Damage profiles generated using mapDamage2 (Jonsson et al., 2013) of non-UDG treated (‘nonU’) reads from the NOD1_nonU and NOD2_nonU data set (total of 1,468,381 trimmed and merged reads) with minimum 35 bp length and map quality 30, mapping to (A) hg38 chrX, and (B) hg38 chrY and C) hg38 autosomes.
Figure 1—figure supplement 6
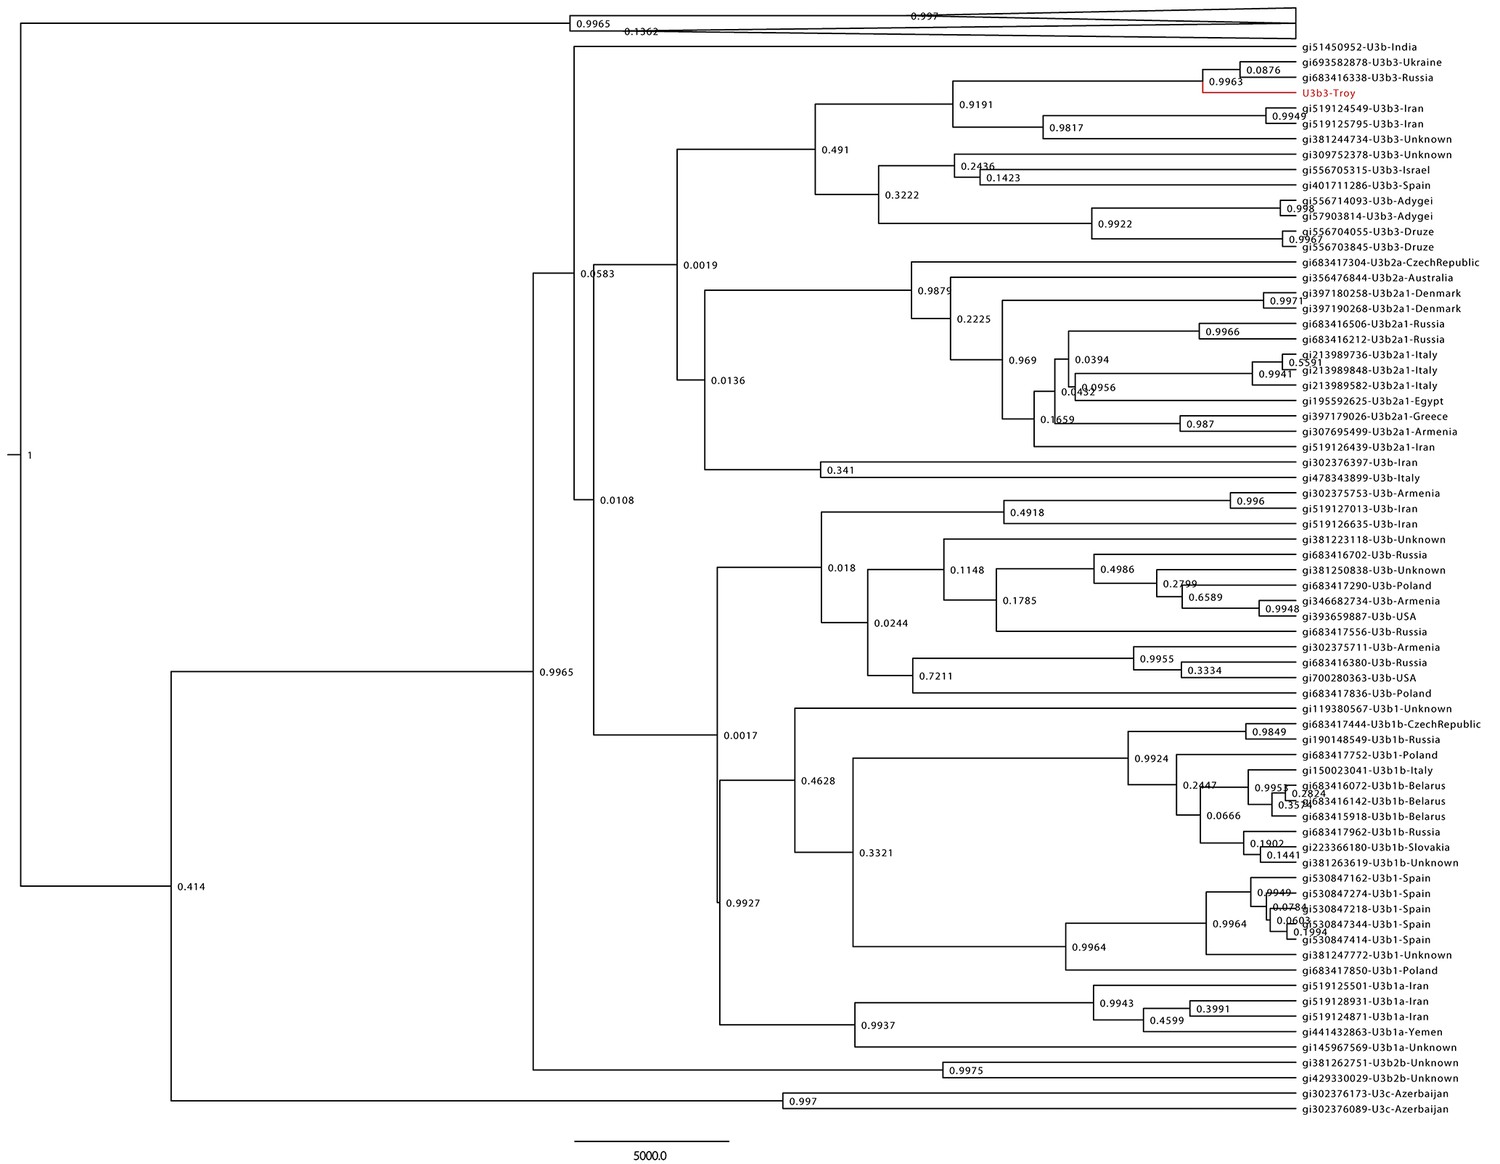
Haplogroup U3 Bayesian Maximum Clade Credibility tree.
Complete human mtDNA genomes assigned to haplogroup U3 (n = 137) were collected from GenBank and aligned with the Troy consensus sequence (highlighted in red). Tree was generated using BEAST v 1.856 and TreeAnnotator.57 Posterior probabilities are shown at nodes.
Figure 1—figure supplement 7
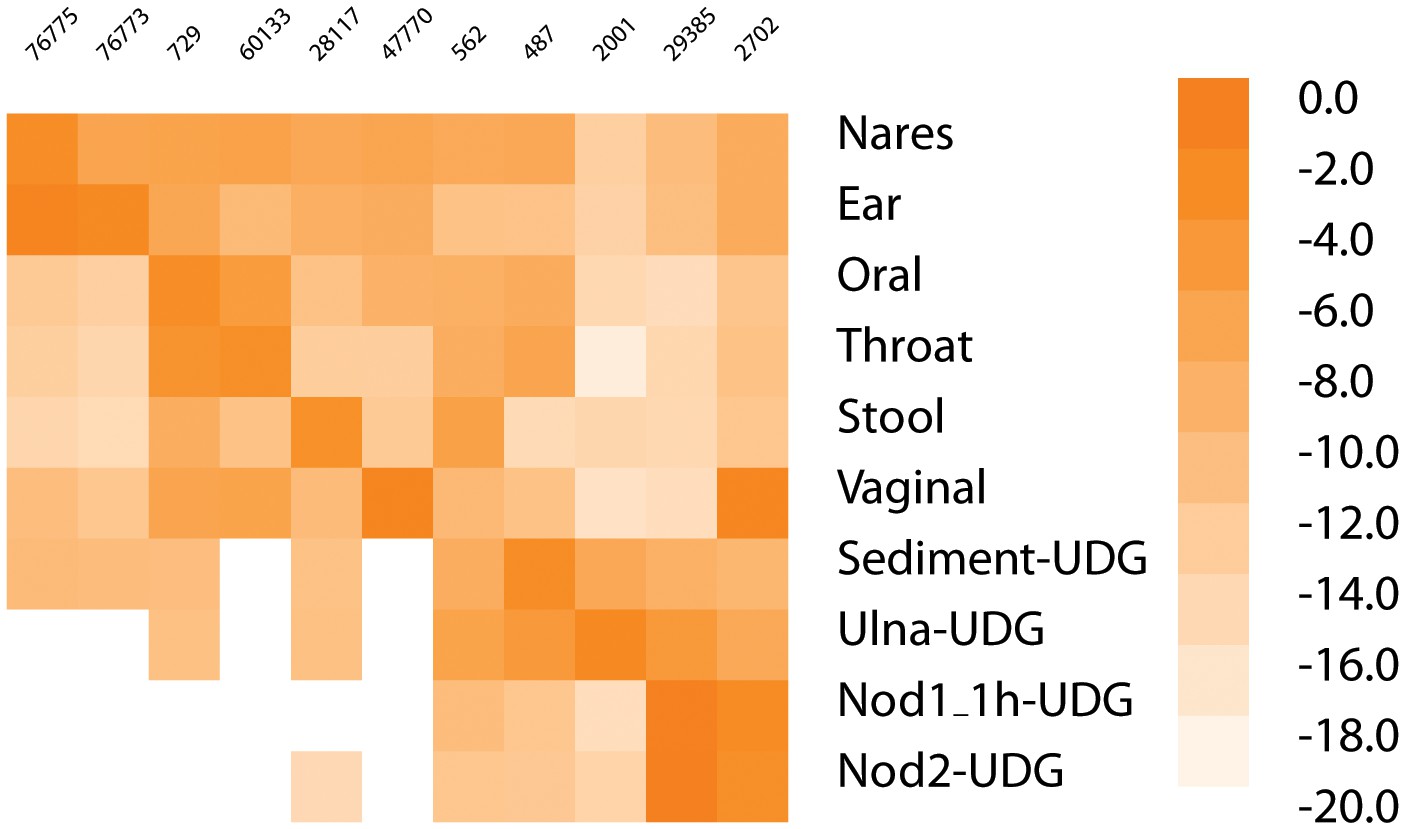
Heatmap of most common taxa in metagenomic samples.
The heatmap gives the log of the frequency of the most common taxa in each sample along the diagonal (if the most frequent is already shown, then second most frequent is added for that sample; Nares and Ear, Nod1_1h-UDG and Nod2-UDG). The taxa in order are - 76775, Malassezia restricta; 76773, Malassezia globosa; 729, Haemophilus parainfluenzae; 60133, Prevotella pallens; 28117, Alistipes putredinis; 47770, Lactobacillus crispatus; 562, Escherichia coli; 487, Neisseria meningitidis; 2001, Streptosporangium roseum; 29385, Staphylococcus saprophyticus; 2702, Gardnerella vaginalis.
Figure 1—figure supplement 8
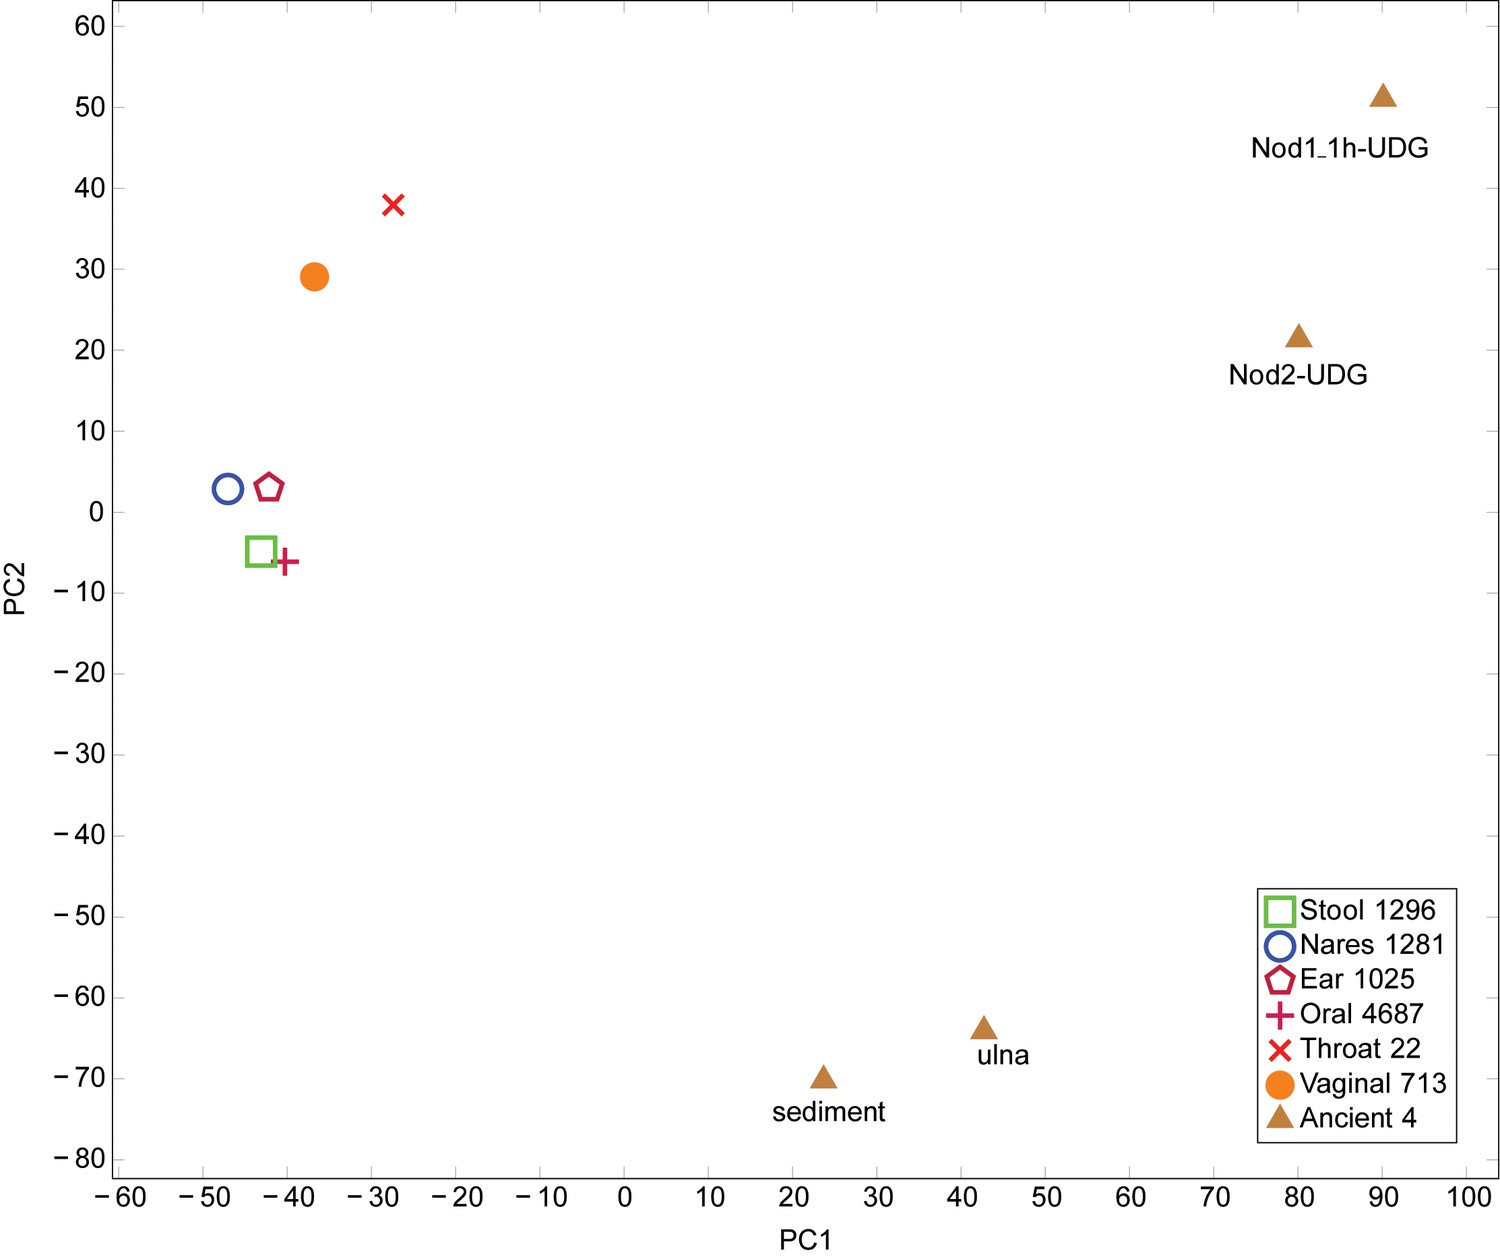
PCA of Human Microbiome Project and ancient metagenomic taxa.
Taxa were identified using LMAT. PCA performed using prcomp function in R. Legend indicates the origin of the category and the number of samples combined into each category. The first principal component axis separates the placental and ancient samples from the remaining samples. The second principal component axis separates the Sediment-UDG and Ulna-UDG data sets, which likely contain soil contamination, from the remaining samples.
Figure 1—figure supplement 9
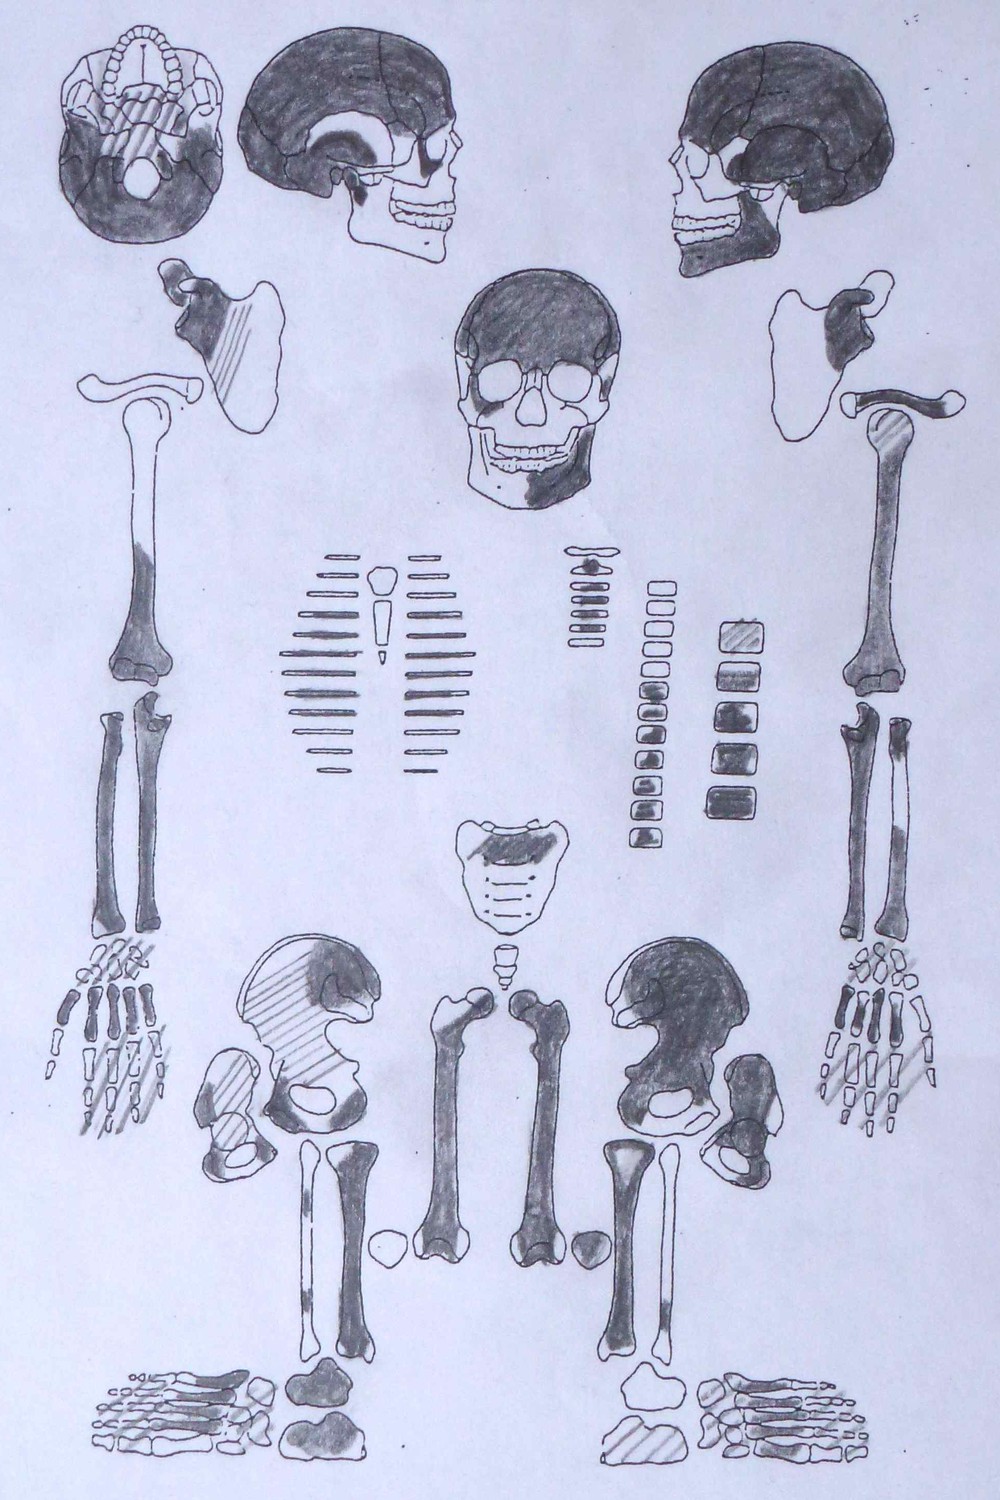
Sketch of skeletal preservation.
https://doi.org/10.7554/eLife.20983.012
Figure 2 with 2 supplements
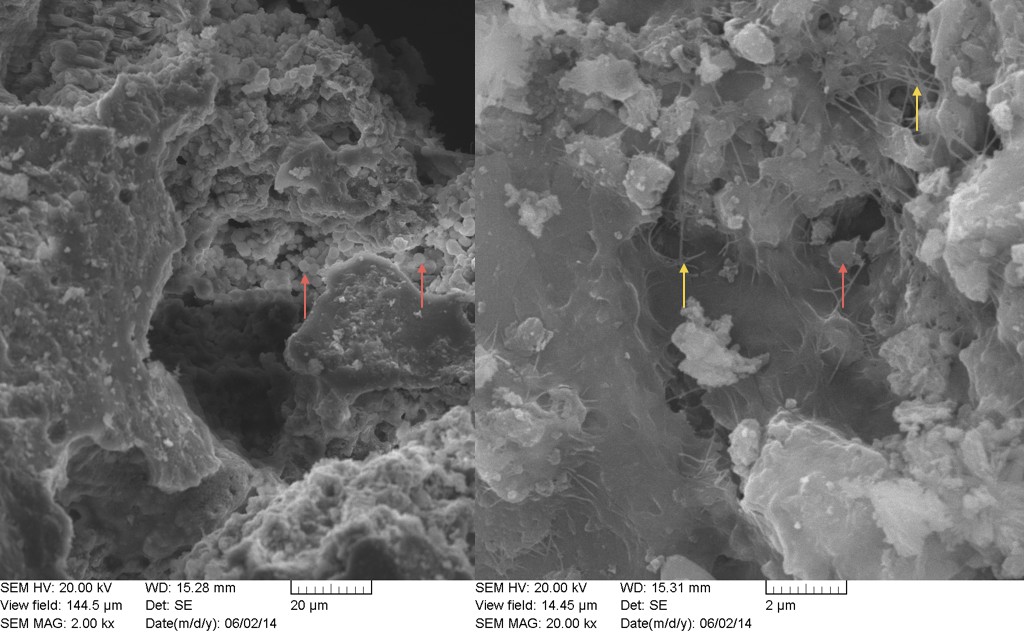
SEM image of nodule at (A) 2000x and (B) 20,000x magnification.
Bacterial cells indicated with red arrow are between ~1 µm and 2 µm (within range expected for Staphylococcus). Extracellular polymeric substances (EPS) are indicated by yellow arrows.
Figure 2—figure supplement 1
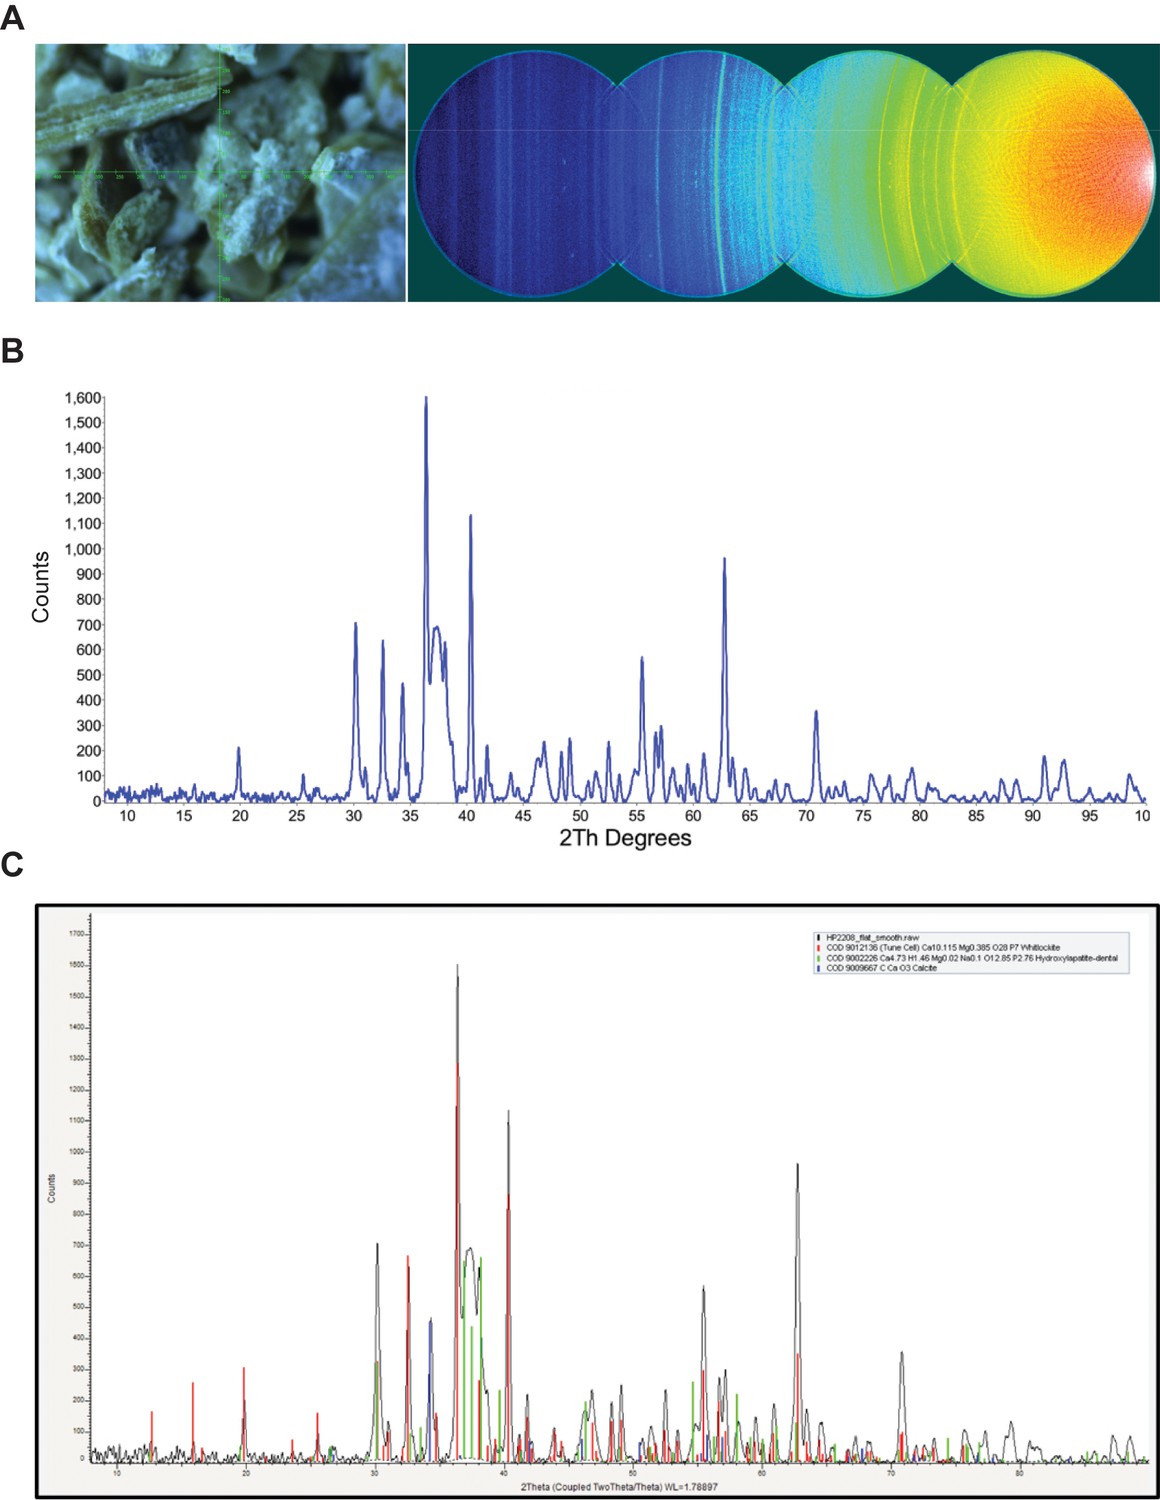
XRD analysis of nodule.
A) Video alignment and XRD frames. Left; crosshairs indicate the center of the region examined. Right; the four frames collected to obtain a 2θ range of 8–103°. At a low angle, air scatter from the main beam is evident. B) Background subtracted powder pattern. C) Search/match results.
Figure 2—figure supplement 2
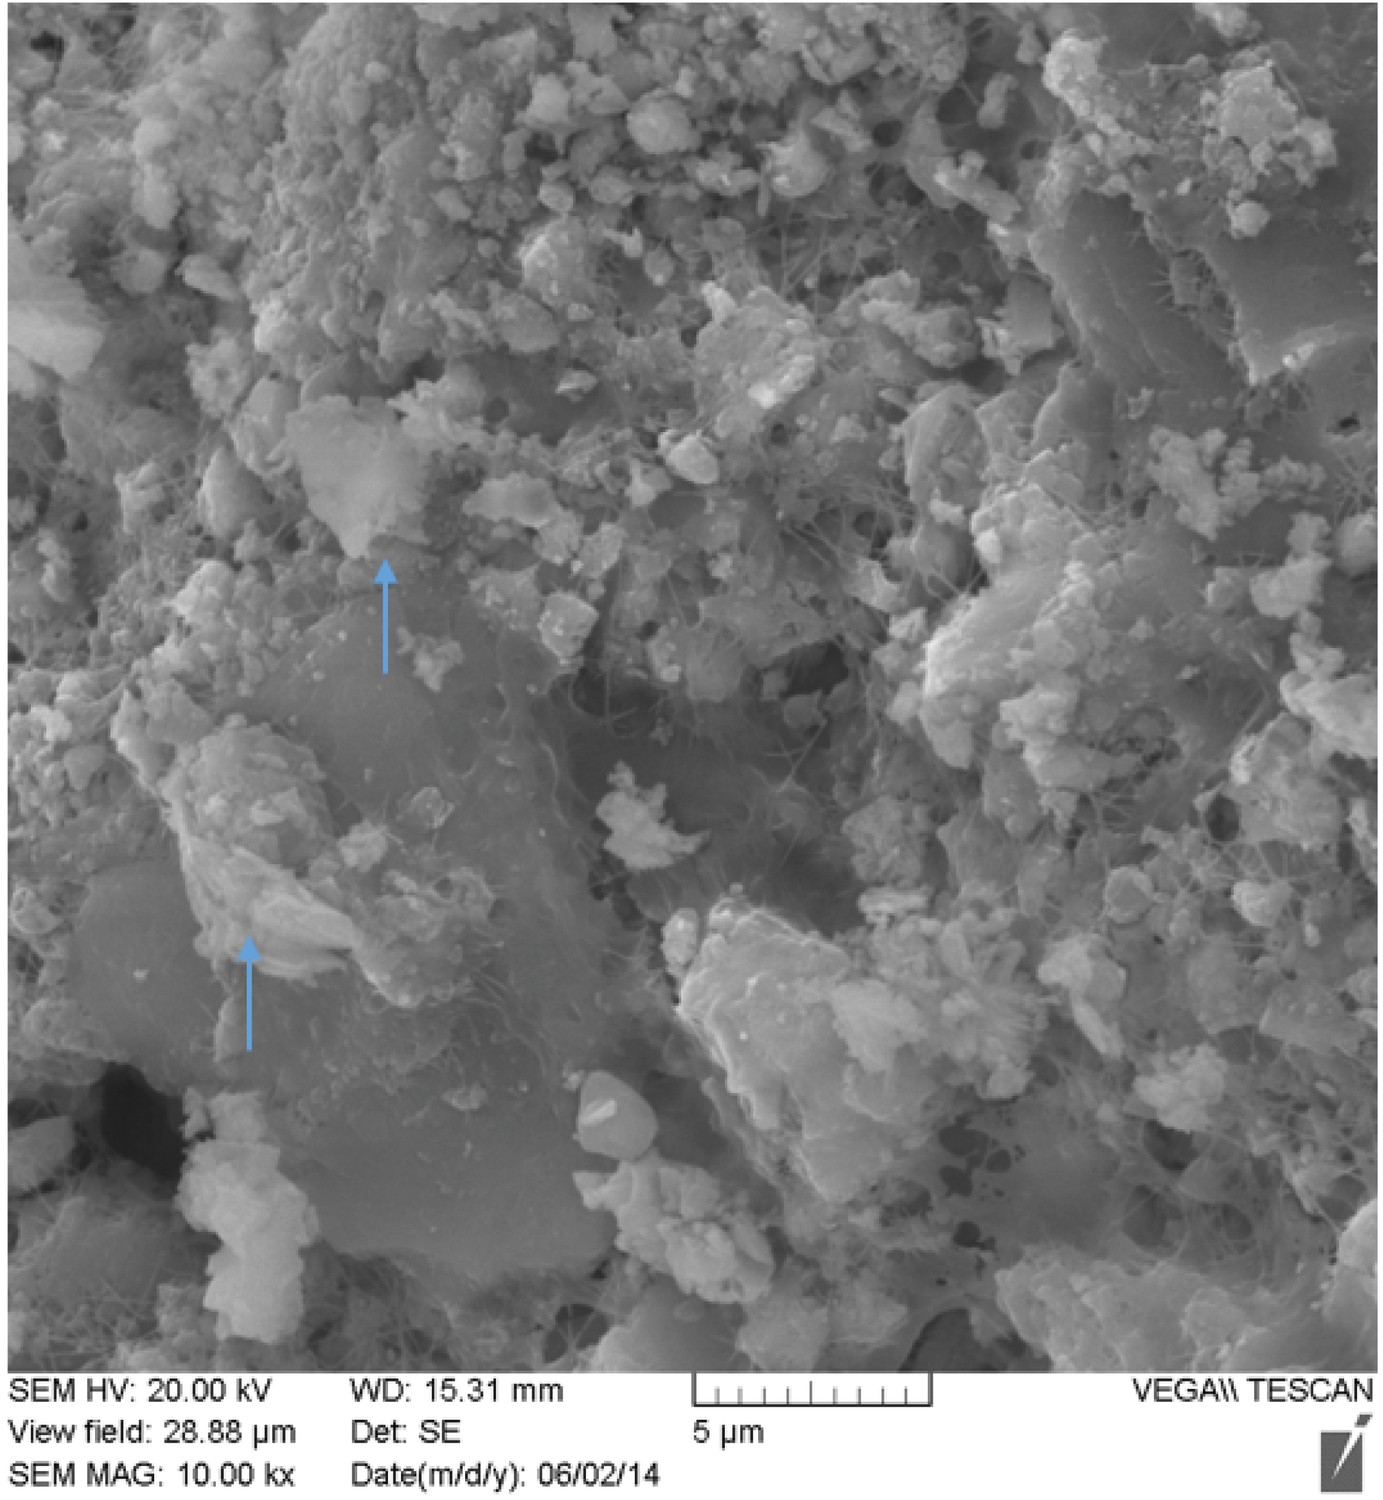
SEM image of nodule at 10,000x magnification.
Possible inflammatory (neutrophils) cells indicated by blue arrows.
Figure 3 with 4 supplements
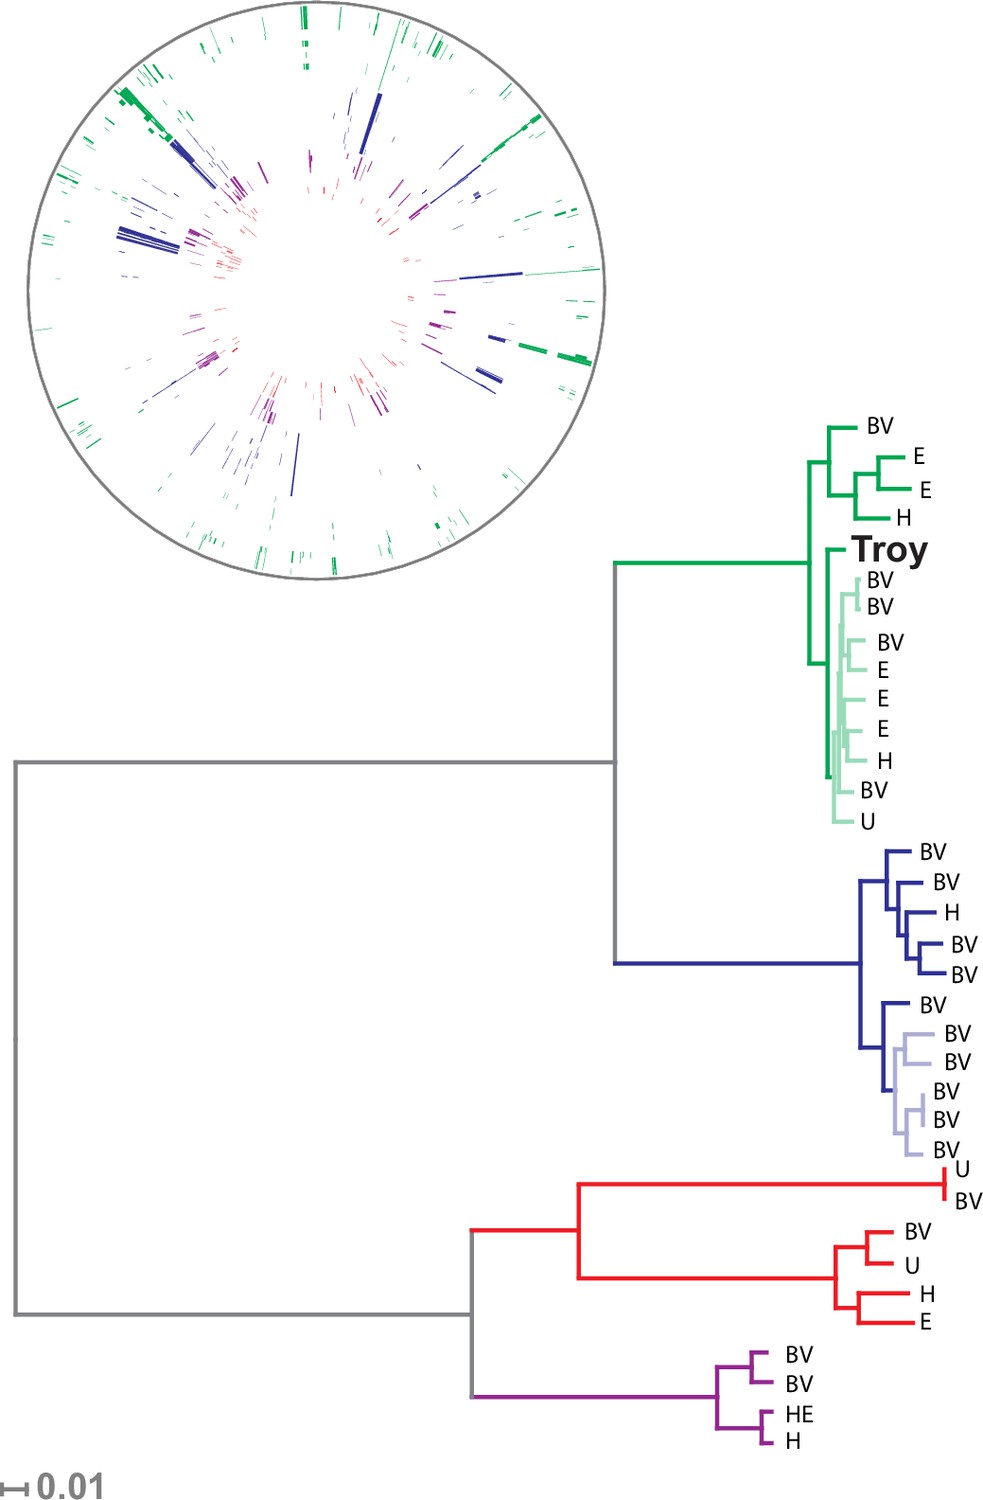
Phylogenetic analysis of Gardnerella vaginalis.
A maximum likelihood tree estimated using RAxML(Stamatakis, 2014) (Figure 3—source data 3) from a core alignment of G. vaginalis genomes (Figure 3—source data 1, Figure 3—source data 2). Branches are colored based on clades originally identified in Ahmed et al.(Ahmed et al., 2012) (green = clade 1, blue = clade 2, red = clade 3, purple = clade 4). Tips from modern G. vaginalis isolates are labeled based on sample source (H = healthy vagina, BV = bacterial vaginosis, HE = healthy endometrium, E = endometrium, U = unknown). Lighter colored branches have bootstrap values less than 100. Clinical phenotypes are interspersed throughout the phylogeny, and the Troy genome is not associated with a consistently pathogenic lineage of G. vaginalis. Inset: Recombinant fragments in G. vaginalis core genome identified by BratNextGen (Figure 3—source data 4) (Marttinen, 2012). Each circle represents one genome. Colored blocks represent recombinant fragments, and colors correspond to the clade designations in the phylogenetic tree. Plot made with Circos (Krzywinski et al., 2009).
-
Figure 3—source data 1
Concatenated alignment of core genes in G. vaginalis.
- https://doi.org/10.7554/eLife.20983.017
-
Figure 3—source data 2
G. vaginalis core genome alignment trimmed with Gblocks.
- https://doi.org/10.7554/eLife.20983.018
-
Figure 3—source data 3
Maximum likelihood phylogenetic analysis of trimmed G. vaginalis alignment with RAxML.
- https://doi.org/10.7554/eLife.20983.019
-
Figure 3—source data 4
Recombinant fragments detected with BratNextGen in trimmed G. vaginalis alignment.
- https://doi.org/10.7554/eLife.20983.020
Figure 3—figure supplement 1
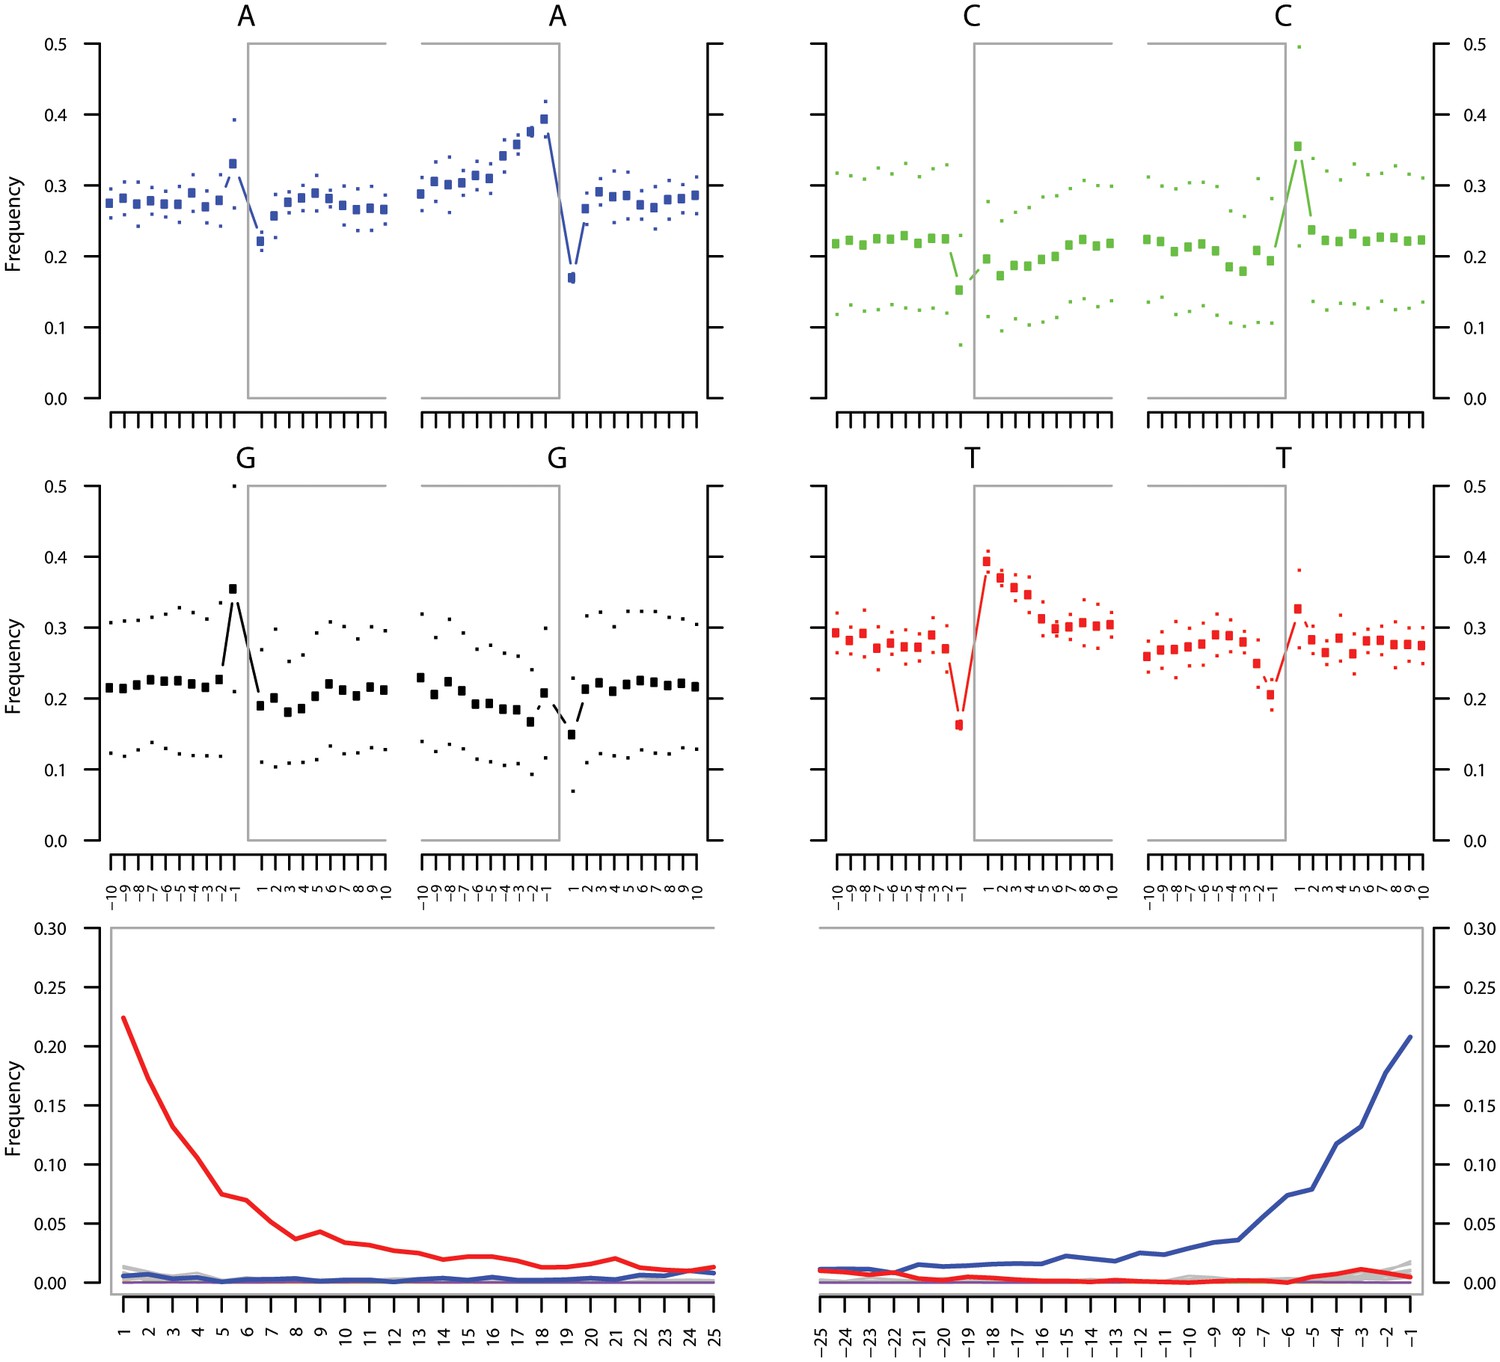
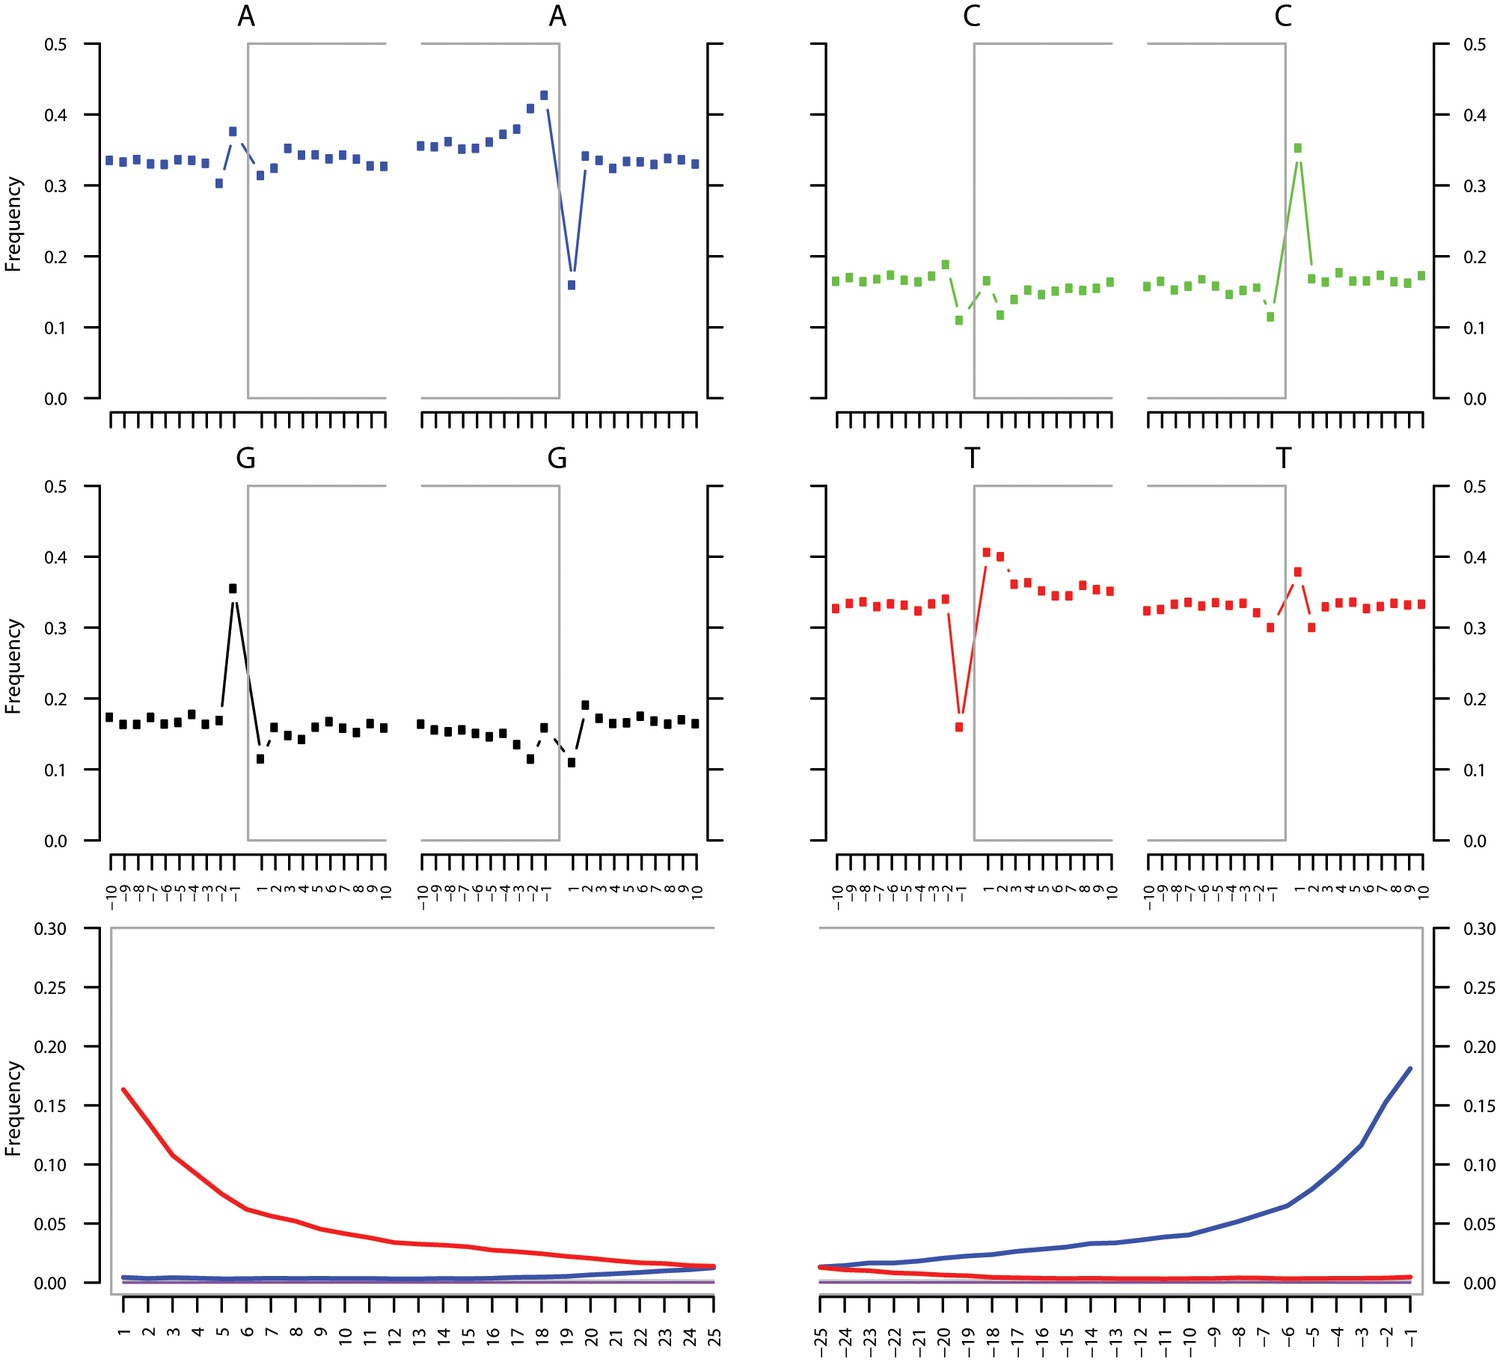
Ancient DNA damage assessment of G. vaginalis.
Damage profiles of non-UDG treated (‘nonU’) reads from a pooled NOD1_nonU and NOD2_nonU data set (total of 1,565,548 trimmed reads >24 bp) mapping to G. vaginalis strain ATCC 14019. Paired end reads were mapped using bwa (Li and Durbin, 2009) with default settings and duplicates were removed with samtools rmdup (Li et al., 2009). Damage profiles were generated using mapDamage2 (Jonsson et al., 2013).
Figure 3—figure supplement 2
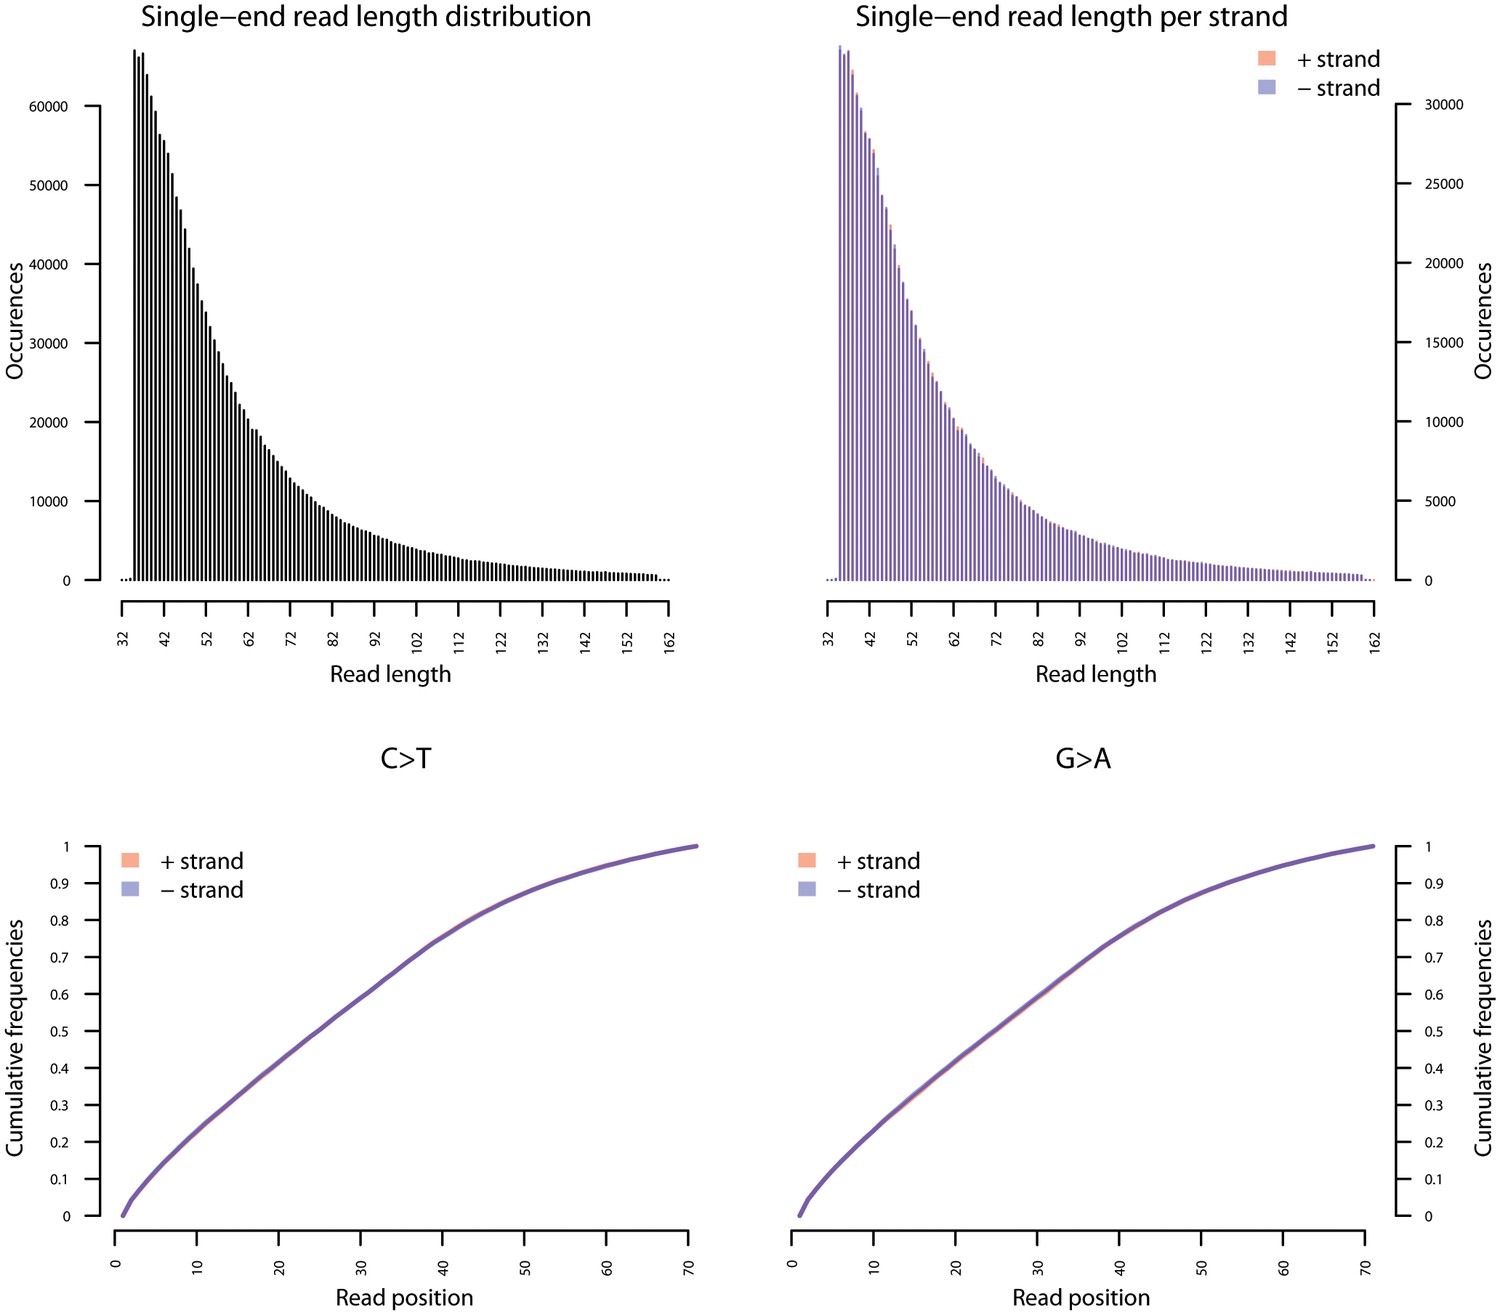
Fragment length distribution (FLD) for G. vaginalis ATCC 14019.
All nodule shotgun libraries (Nod1_1h-UDG, Nod1_1h-nonU, Nod2-UDG, Nod2-nonU) were pooled, reads were restricted to a minimum length of 35 bp and mapping quality of 30 and all duplicates removed both within and between libraries. The fragment length distribution of the remaining 1,658,978 reads was visualized using mapDamage2 (Jonsson et al., 2013).
Figure 3—figure supplement 3
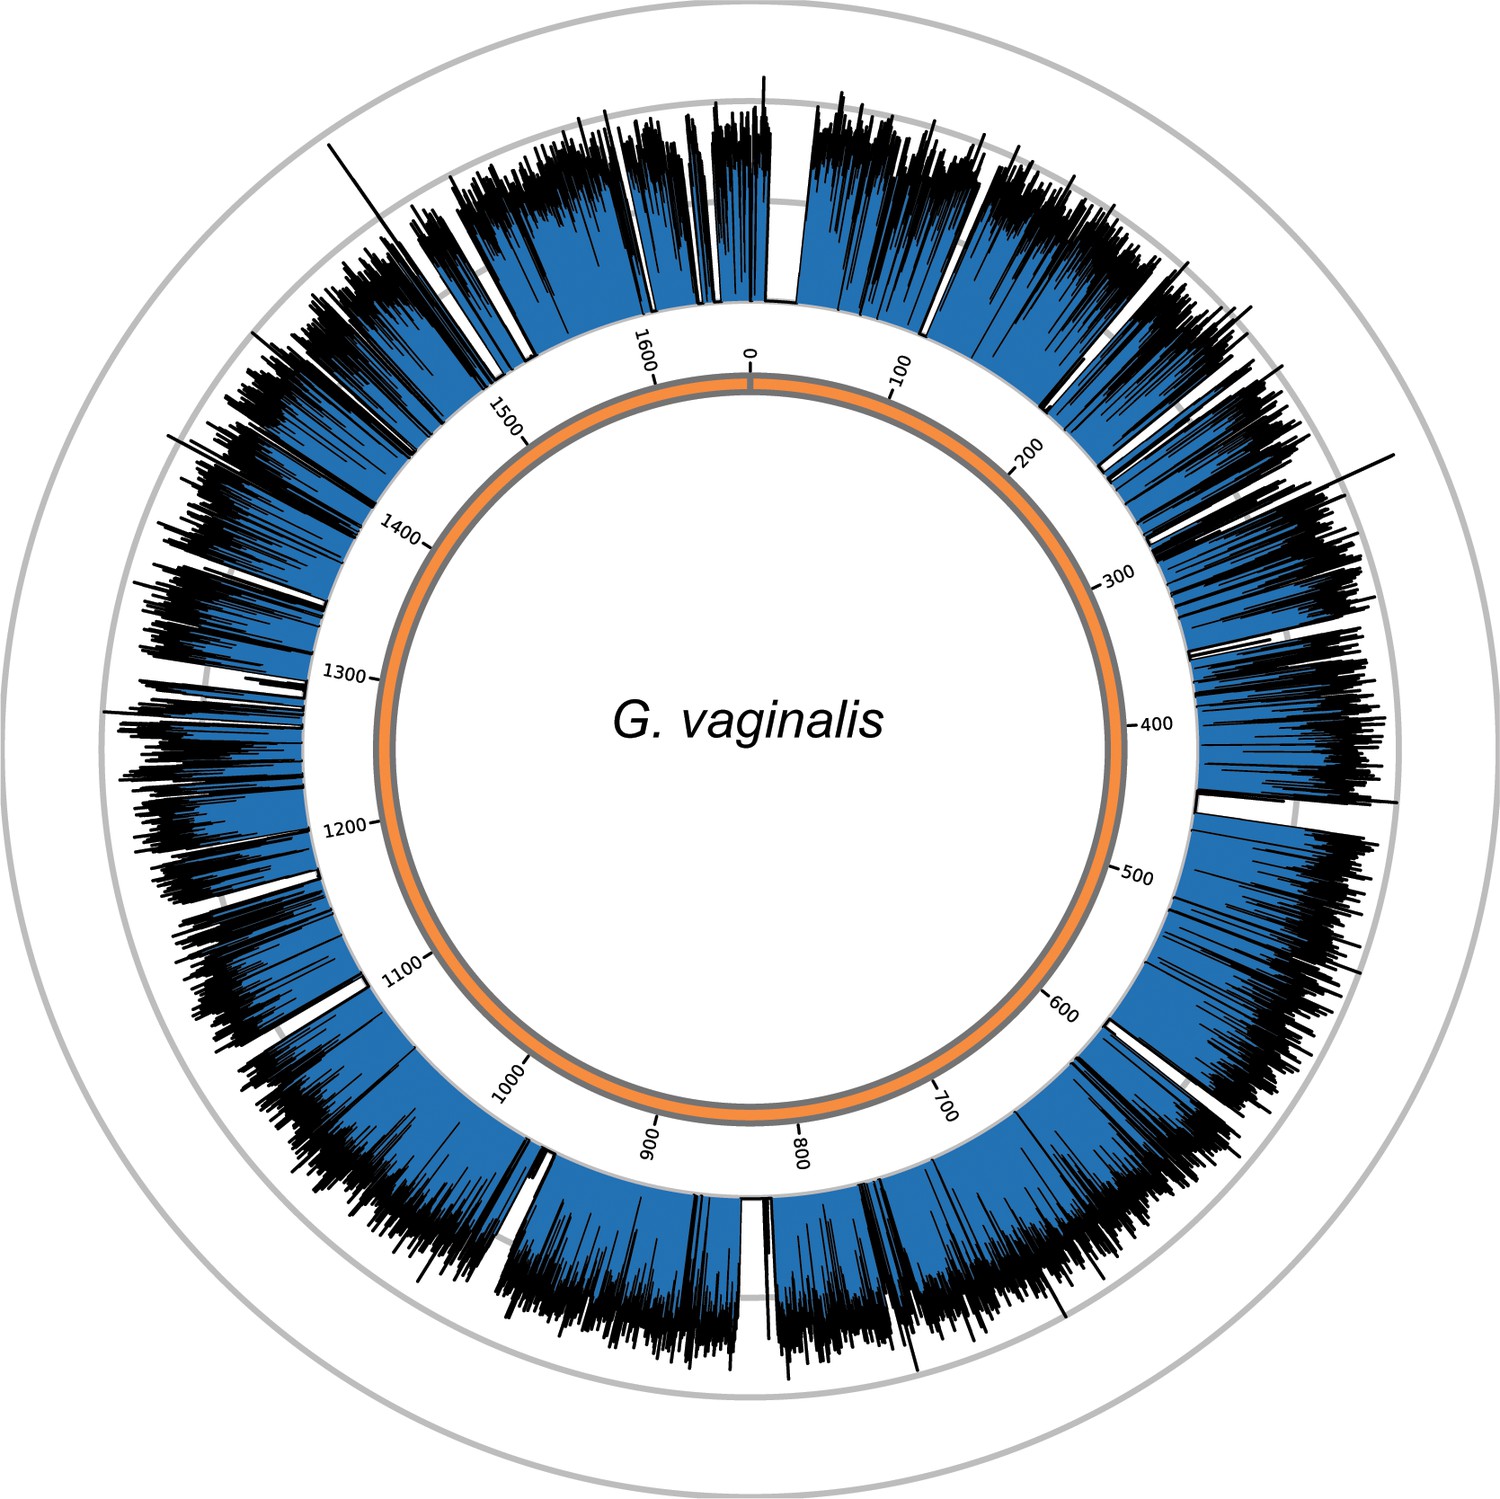
Genome coverage plots for pooled nodule shotgun libraries.
G. vaginalis (NC_014644), average coverage 57.0X. All reads were restricted to minimum length of 35 bp and minimum map quality 30 with all duplicates removed. Figures depict coverage of the genome in 100 bp blocks across references. Concentric grey circles demarcate increments of 50X coverage in both plots.
Figure 3—figure supplement 4
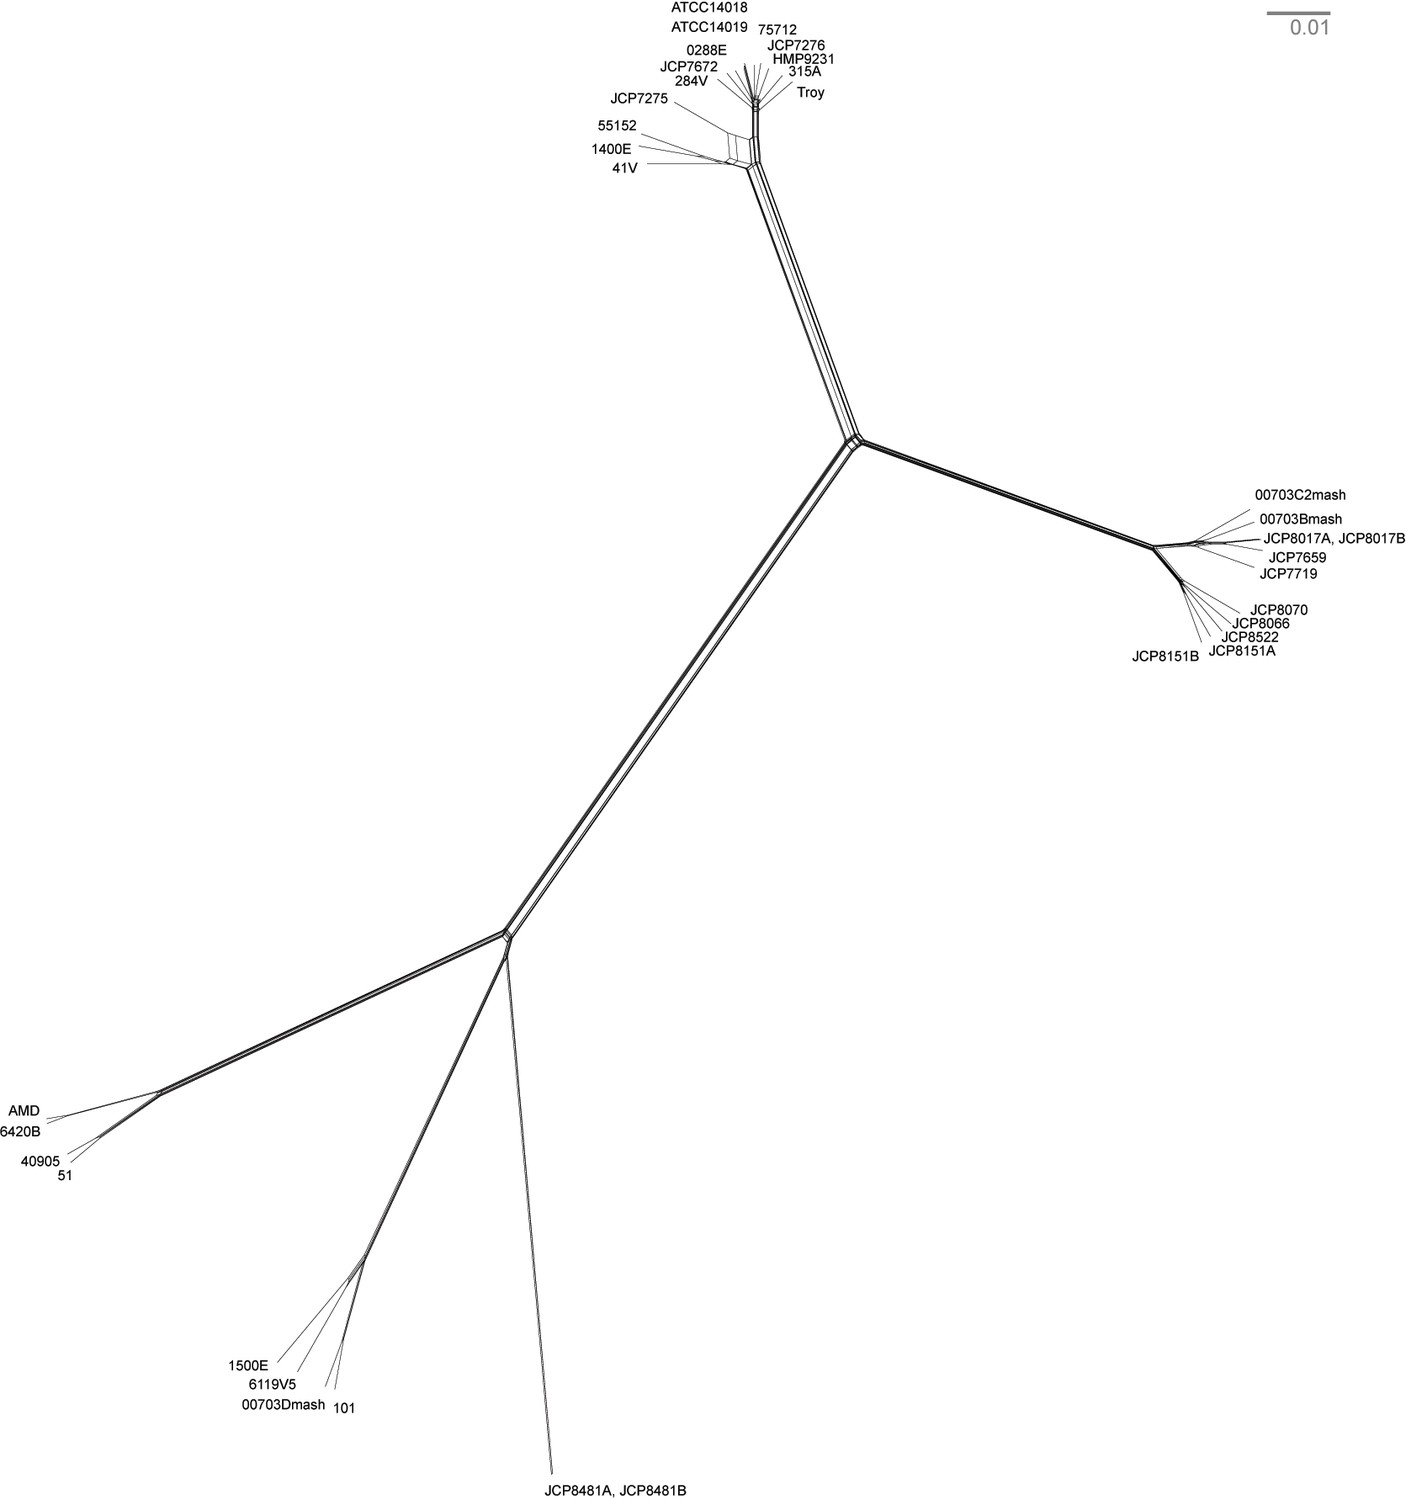
Neighbor net network of core genomes.
The network created in SplitsTree v 4 (Huson and Bryant, 2006) of Gardnerella vaginalis. The networks recapitulate the structure of maximum likelihood tree (Figure 3).
Figure 4 with 6 supplements
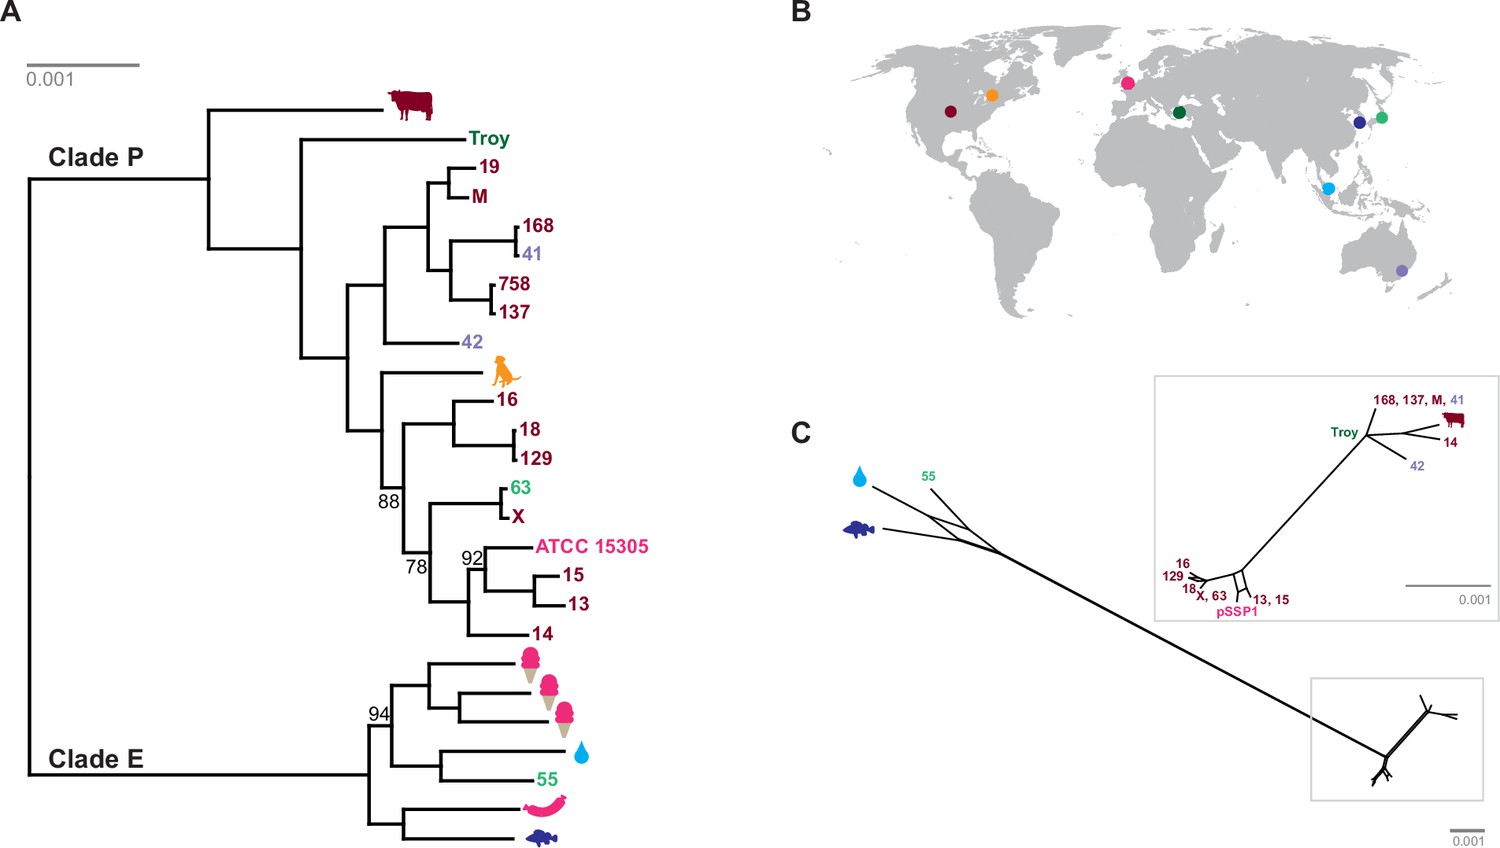
Phylogenetic analysis of Staphylococcus saprophyticus.
(A) Maximum likelihood tree estimated using RAxML (Stamatakis, 2014) (Figure 4—source data 3) from an alignment of S. saprophyticus genomes (Figure 4—source data 1, Figure 4—source data 2). Bootstrap values less than 100 are labeled. Silhouettes indicate bacterial sample source. Isolates without silhouettes are from human clinical samples isolated from urine. Color corresponds to country of isolation as seen on the map. Full sample descriptions are in Supplementary file 1H. (B) Source countries of bacterial samples. (C) Neighbor-net network of S. saprophyticus plasmid sequences (Figure 4—source data 4) related to pSST1 created in SplitsTree4 (Huson and Bryant, 2006). The boxed inset is an enlarged version of the portion of the network from Clade P isolates. Some S. saprophyticus isolates do not encode pSST1-like plasmids, and therefore, they are not included in the network. Starts and stops of recombinant regions of the alignment can be found in Figure 4—source data 5.
-
Figure 4—source data 1
S. saprophyticus whole genome alignment.
- https://doi.org/10.7554/eLife.20983.026
-
Figure 4—source data 2
S. saprophyticus whole genome alignment trimmed with trimal.
- https://doi.org/10.7554/eLife.20983.027
-
Figure 4—source data 3
Maximum likelihood phylogenetic analysis of trimmed S. saprophyticus alignment with RAxML.
- https://doi.org/10.7554/eLife.20983.028
-
Figure 4—source data 4
S. saprophyticus plasmid alignment trimmed with trimal.
- https://doi.org/10.7554/eLife.20983.029
-
Figure 4—source data 5
Recombinant fragments detected with BratNextGen in S. saprophyticus alignment.
- https://doi.org/10.7554/eLife.20983.030
Figure 4—figure supplement 1
Ancient DNA damage assessment of S. saprophyticus.
Damage profiles of non-UDG treated (‘nonU’) reads from a pooled NOD1_nonU and NOD2_nonU data set (total of 1,565,548 trimmed reads >24 bp) mapping to S. saprophyticus strain ATCC 15305. Paired end reads were mapped using bwa (Li and Durbin, 2009) with default settings and duplicates were removed with samtools rmdup (Li et al., 2009). Damage profiles were generated using mapDamage2 (Jonsson et al., 2013).
Figure 4—figure supplement 2
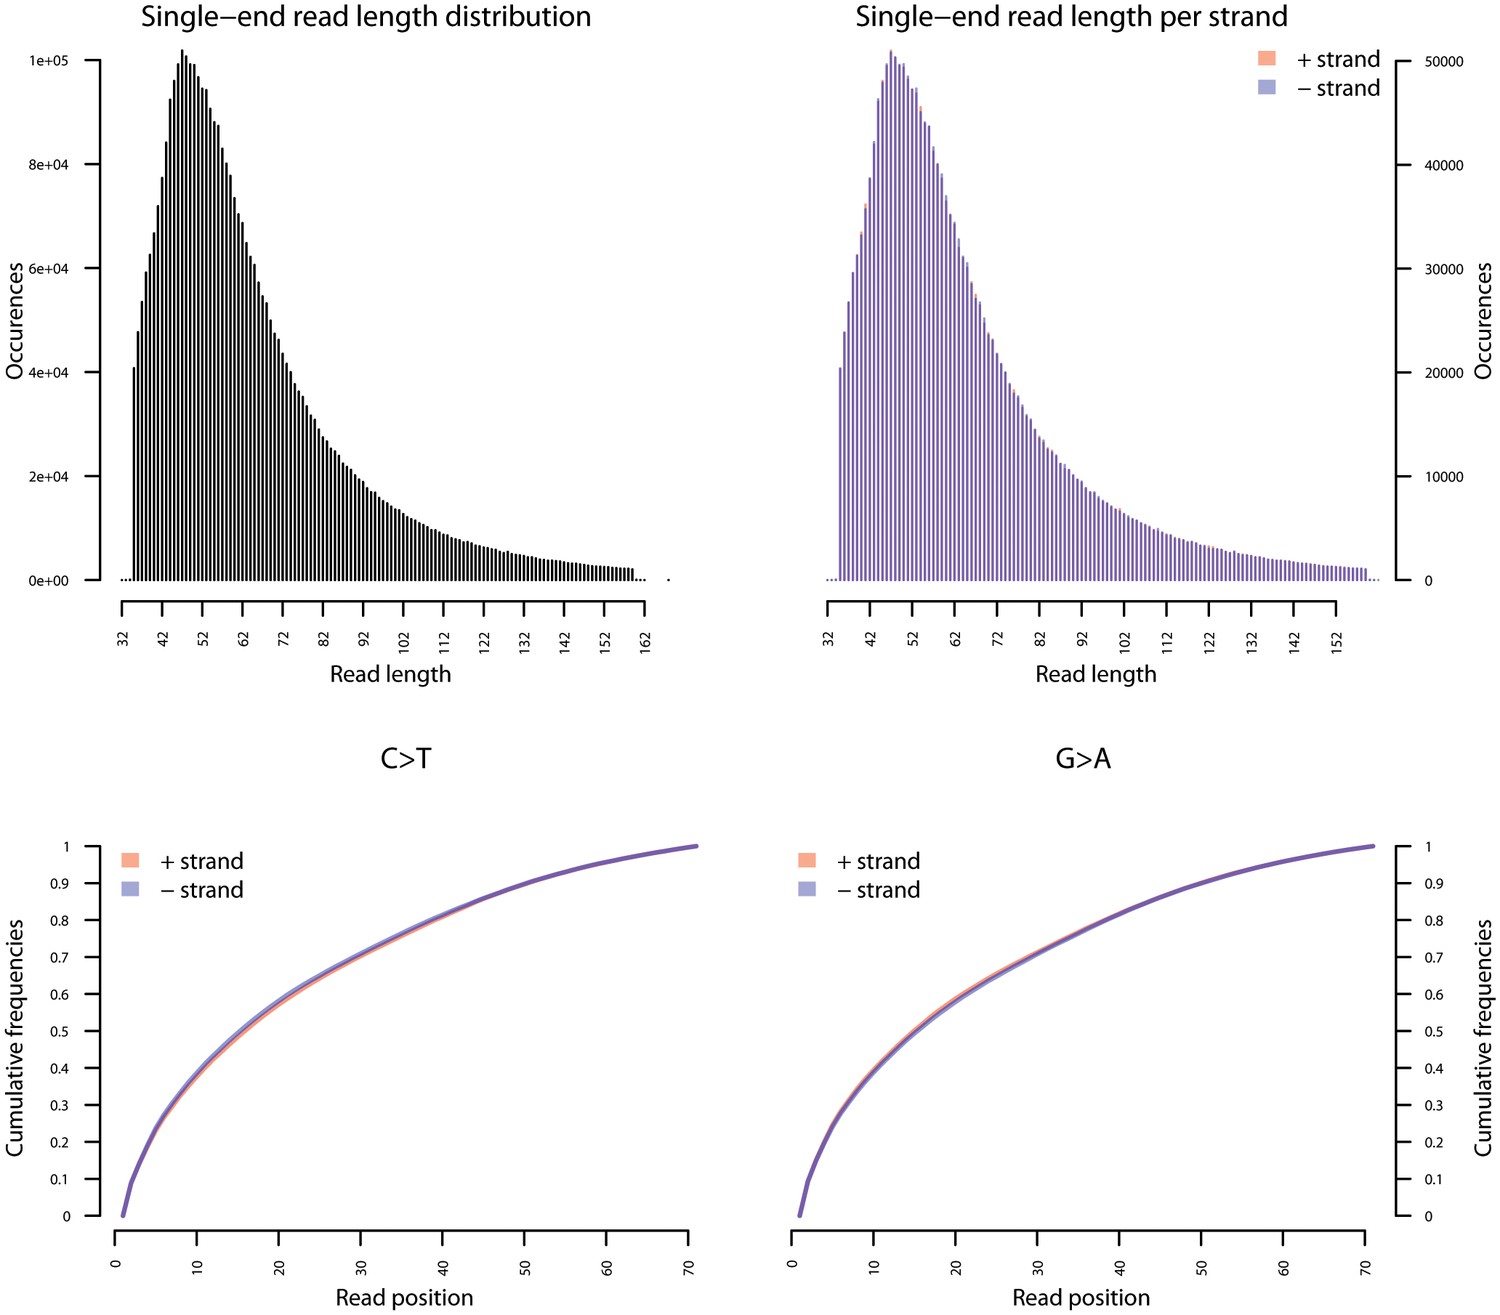
Fragment length distribution (FLD) for S. saprophyticus ATCC 15305.
All nodule shotgun libraries (Nod1_1h-UDG, Nod1_1h-nonU, Nod2-UDG, Nod2-nonU) were pooled, reads were restricted to a minimum length of 35 bp and mapping quality of 30 and all duplicates removed both within and between libraries. The fragment length distribution of the remaining 3,904,552 reads was visualized using mapDamage2 (Jonsson et al., 2013).
Figure 4—figure supplement 3
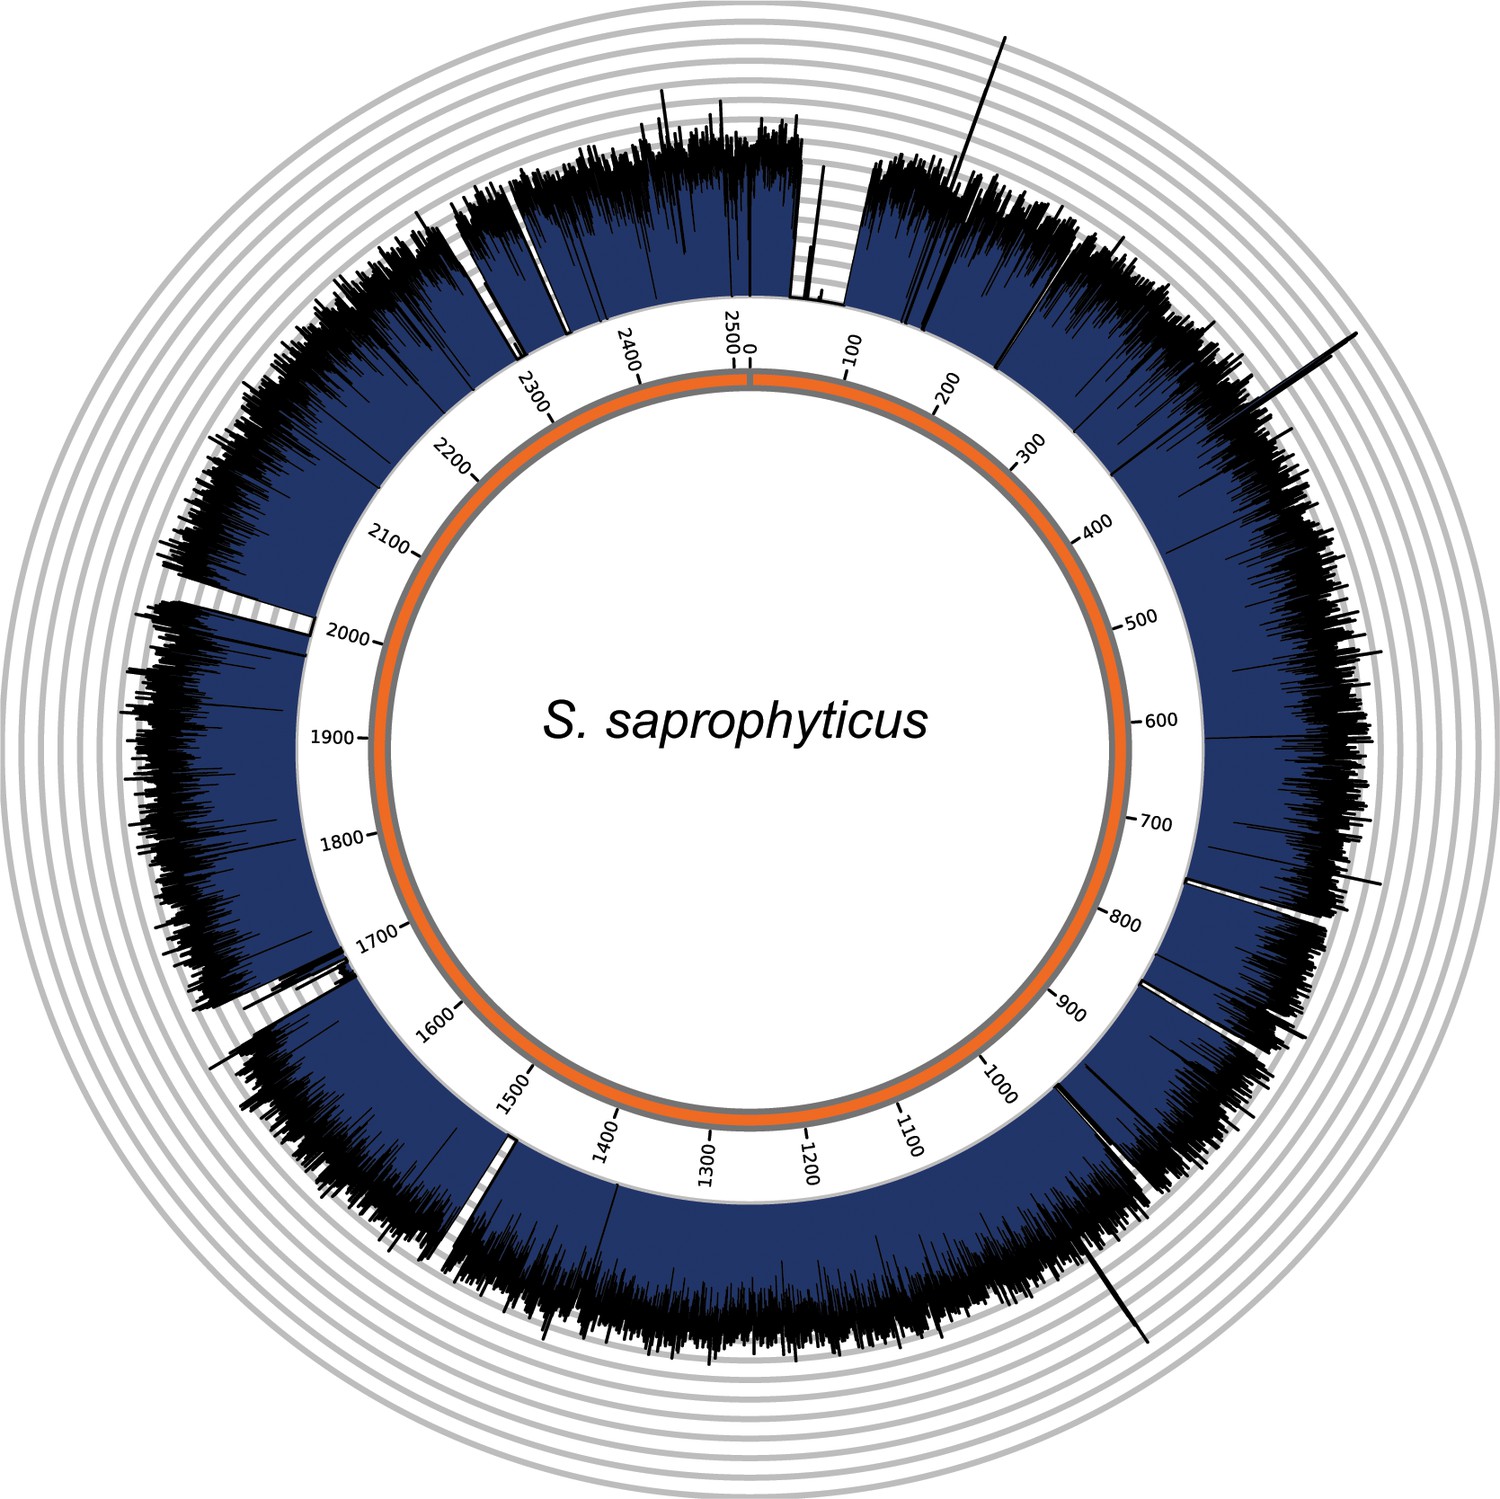
Genome coverage plots for pooled nodule shotgun libraries.
S. saprophyticus (NC_007350), average coverage 298.6X. All reads were restricted to minimum length of 35 bp and minimum map quality 30 with all duplicates removed. Figures depict coverage of the genome in 100 bp blocks across references. Concentric grey circles demarcate increments of 50X coverage in both plots.
Figure 4—figure supplement 4
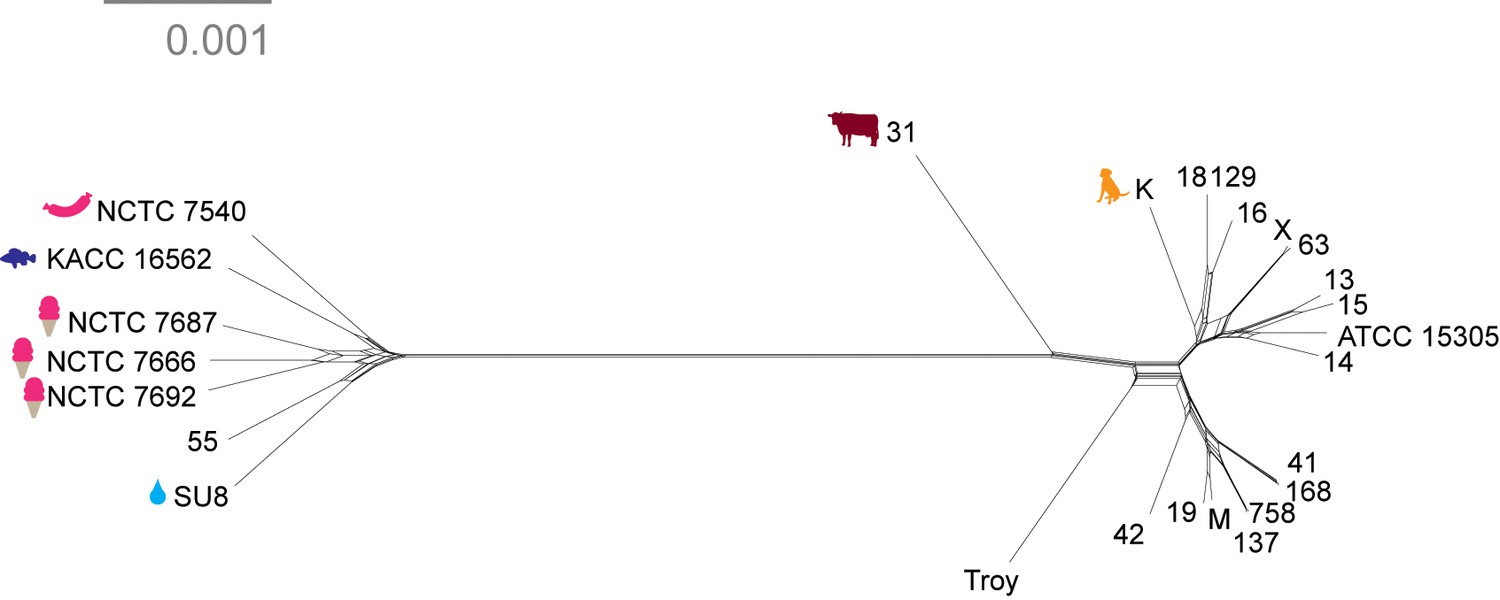
Neighbor net network of core genomes.
Networks created in SplitsTree v 4 (Huson and Bryant, 2006) of S. saprophyticus. The networks recapitulate the structure of maximum likelihood trees (Figure 4).
Figure 4—figure supplement 5
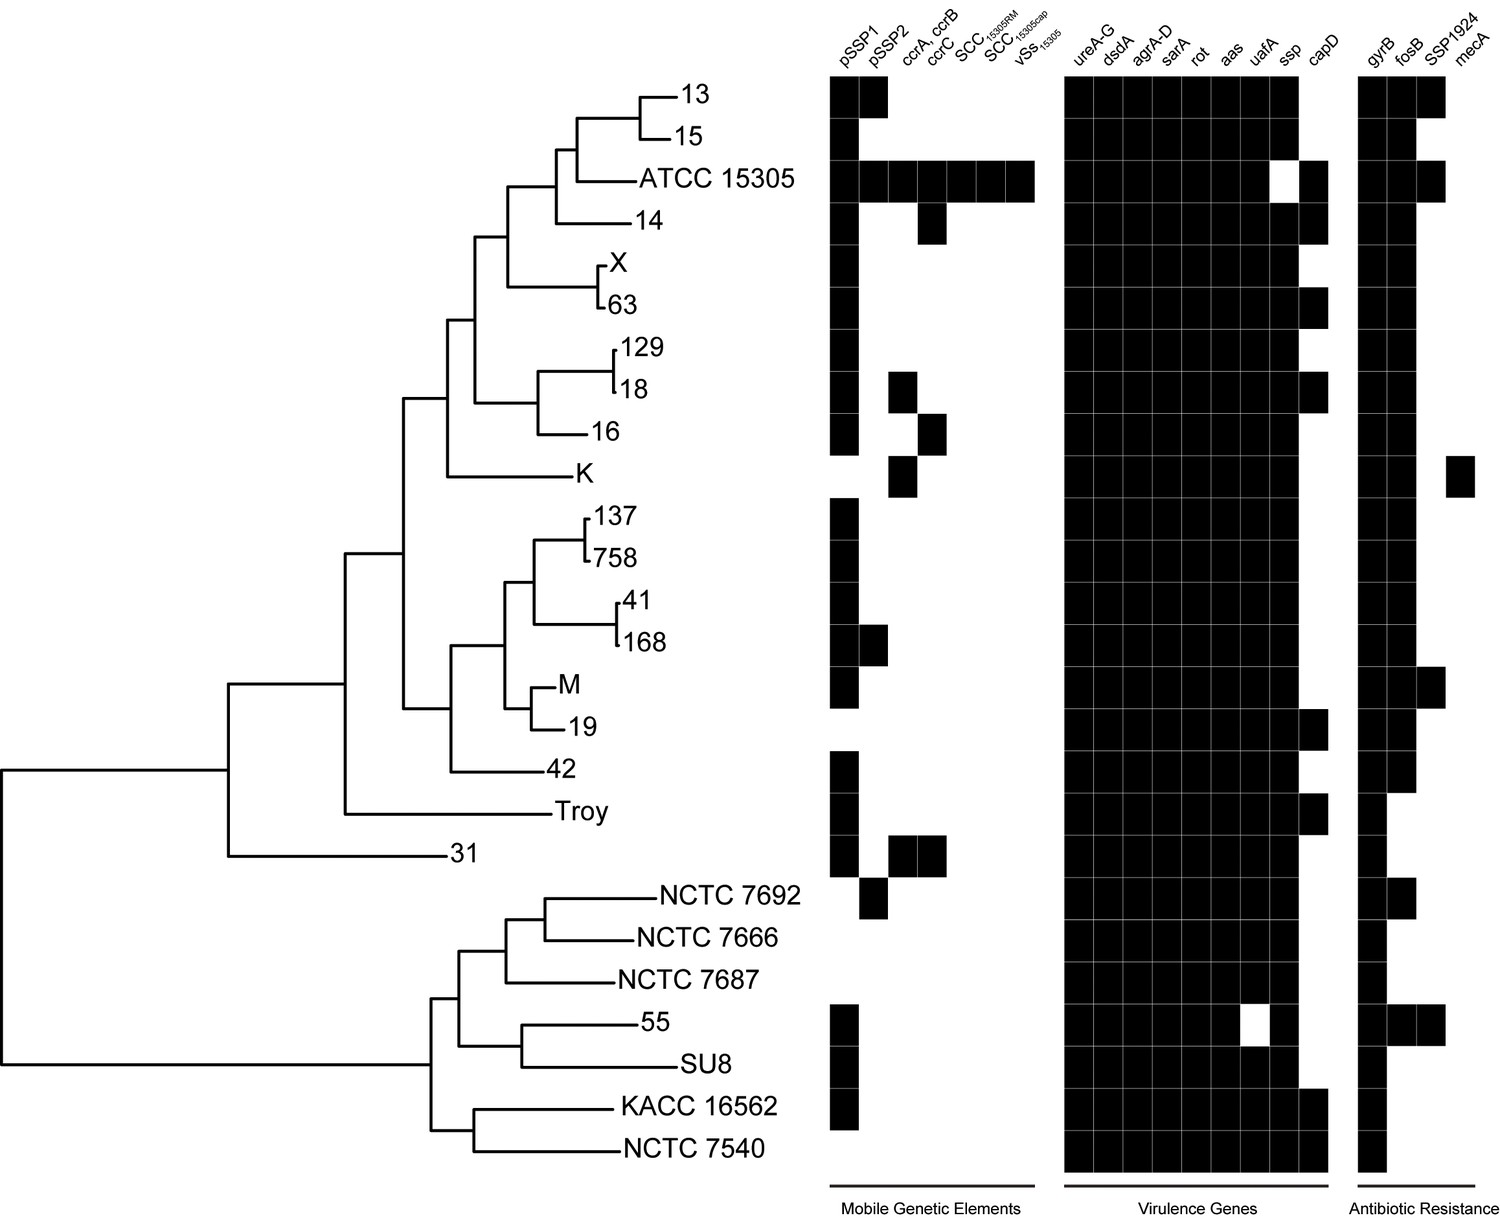
Presence of mobile genetic elements, virulence genes, and antibiotic resistance in S. saprophyticus.
Novobiocin resistance is conferred by a glycine at position 85 and lysine at position 140 (Vickers et al., 2007), which is present in all S. saprophyticus genomes examined here. SSP1924 and fosB confer streptomycin and fosfomycin resistance, respectively, and are encoded in vSs15305 in the ATCC 15305 reference genome (Kuroda et al., 2005). While none of the other isolates encode the entire genomic island, fosB and SSP1924 are found in isolates from both Clade P and Clade E. The canine isolate (K) harbors SCCmec containing mecA conferring methicillin resistance that has been identified in human clinical isolates of S. saprophyticus (Higashide et al., 2008).
Figure 4—figure supplement 6
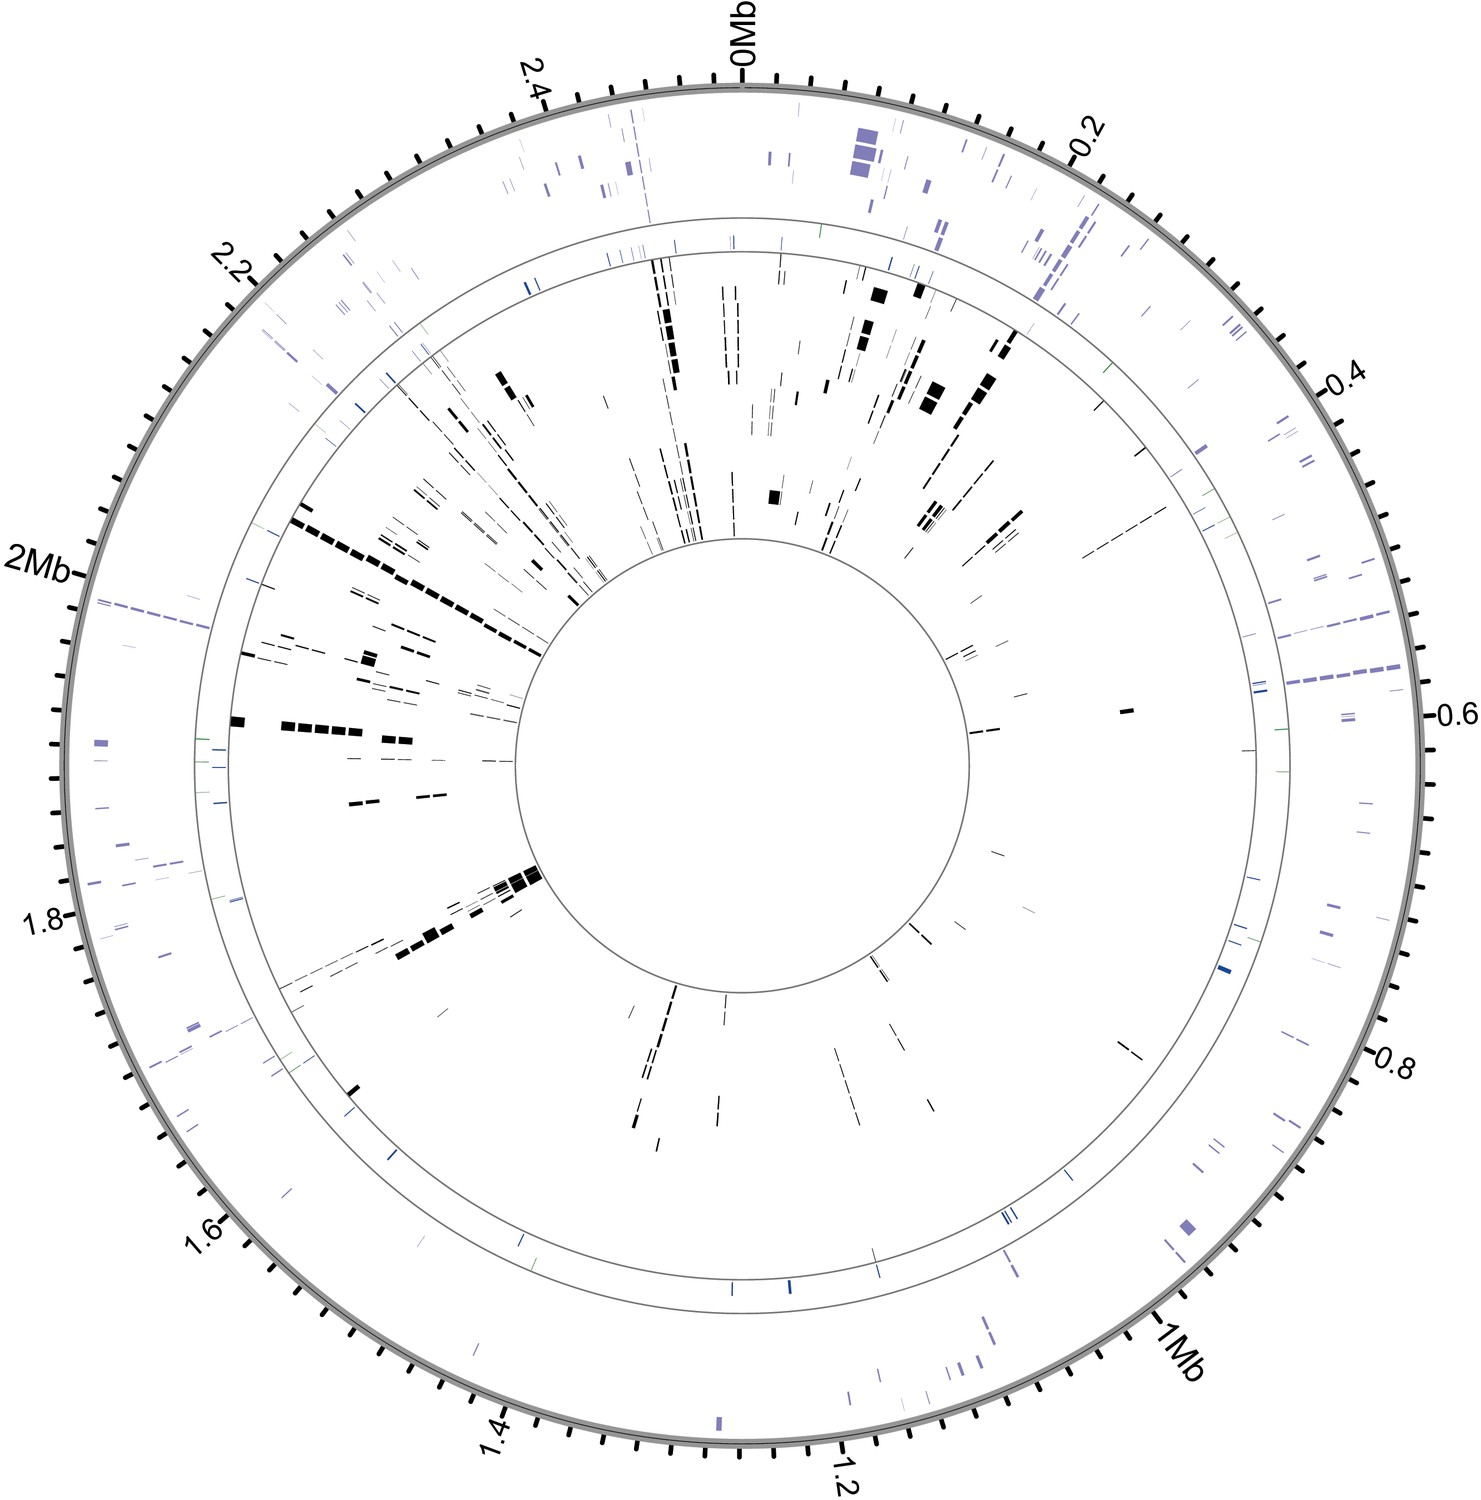
Recombinant regions detected by BratNextGen in S. saprophyticus.
Each circle in the figure represents one isolate. Regions with significant evidence for recombination are shown as black or colored blocks. Black ticks mark intervals of 20 kb, and positions are in reference to ATCC15305. 17.9% of the alignment is recombinant in at least one strain. After removing fragments associated with known MGEs, 15.0% of sites are recombinant in the core genome. Isolates are colored according to clade (purple- Clade E, green- bovine, blue- Troy, black- Clade P).
Additional files
-
Supplementary file 1
(A) Troy sample details (B) SEM-EDS results from nodule. For each replicate, upper value is weight %, lower value is atomic %. (C) Common chemical constituents of renal and bladder calculi (kidney and bladder stones) and Troy nodules. + - presence, ND- not detected, Unk- unknown, RF- Relative Frequency in modern populations (C.Y.C Pak (ed.) Pak [1987], Martinus Nijhoff Publishing, Boston). (D) Relative frequency of admixed calculi (kidney and bladder stones) in modern (grey shading) populations and archaeological findings (modified from Pak, 1987). Acronyms correspond to Table C. References cited herein. *1 Main constituent of bladder stone listed as ammonium acid urate and oxalate. *2 Majority of calculus determined to be calcium carbonate (calcite). Where not specifically given, relative proportions of all mineral components were estimated. *3 Minor constituents of calcium carbonate. *4 No other (minor) elements were provided thus composition was assumed to be 100%. ND – not determined/detected. (E) Mitochondrial results summary; unique reads mapped to the revised Cambridge Reference Sequence with minimum length of 35 bp and minimum mapping quality of 30. (F) Sex identification of all libraries after Skoglund et al. (2013). Libraries were mapped to a hard masked version of hg38 and restricted to reads of minimum length 35 bp and minimum mapping quality of 30. (G) Summary of unique shotgun reads (from nodules, ulna, sediment and associated blanks) of minimum length 35 bp and minimum mapping quality of 30, mapping to chromosome X, Y, autosomes and mitochondrion of the hard masked hg38. Nodule pooled =Nod2-UDG + Nod1. (H) Staphylococcus saprophyticus modern strains. (I) Gardnerella vaginalis modern strains. * F = full, S = scaffold; ** BWH = Brigham and Women’s Hospital, HMP = Human Microbiome Project, MWH = Magee-Womens Hospital, VCU = VCU Women’s Health Clinic (J) Troy DNA extraction details. *Demin. = demineralization; digest = digestion buffer (K) HTS data sets. (L) Summary of unique shotgun reads (from nodules, ulna, sediment and associated blanks) of minimum length 35 bp and minimum mapping quality of 30, mapping to Staphylococcus saprophyticus and Gardnerella vaginalis. Nodule pooled =Nod2-UDG + Nod1_1h-nonU + Nod2-nonU + Nod1_1h-UDG). (M) Kinetic analysis of ancient PC1 β-lactamase (N) S. saprophyticus Clade P specific genes. Locus tags refer to annotation of ATCC 15305 available at NCBI. (O) Non-synonymous variants shared between S. saprophyticus Clade P and isolate 55. REF is reference allele in ATCC15305, Clade P and isolate 55. ALT is allele in the remaining Clade E isolates. Locus tags refer to annotation of ATCC 15305 available at NCBI.
- https://doi.org/10.7554/eLife.20983.037
Download links
A two-part list of links to download the article, or parts of the article, in various formats.
Downloads (link to download the article as PDF)
Open citations (links to open the citations from this article in various online reference manager services)
Cite this article (links to download the citations from this article in formats compatible with various reference manager tools)
A molecular portrait of maternal sepsis from Byzantine Troy
eLife 6:e20983.
https://doi.org/10.7554/eLife.20983


