Molecular conservation of marsupial and eutherian placentation and lactation
- Stanford University School of Medicine, United States
- University of Utah School of Medicine, United States
- University of Melbourne, Australia
Figures
Figure 1
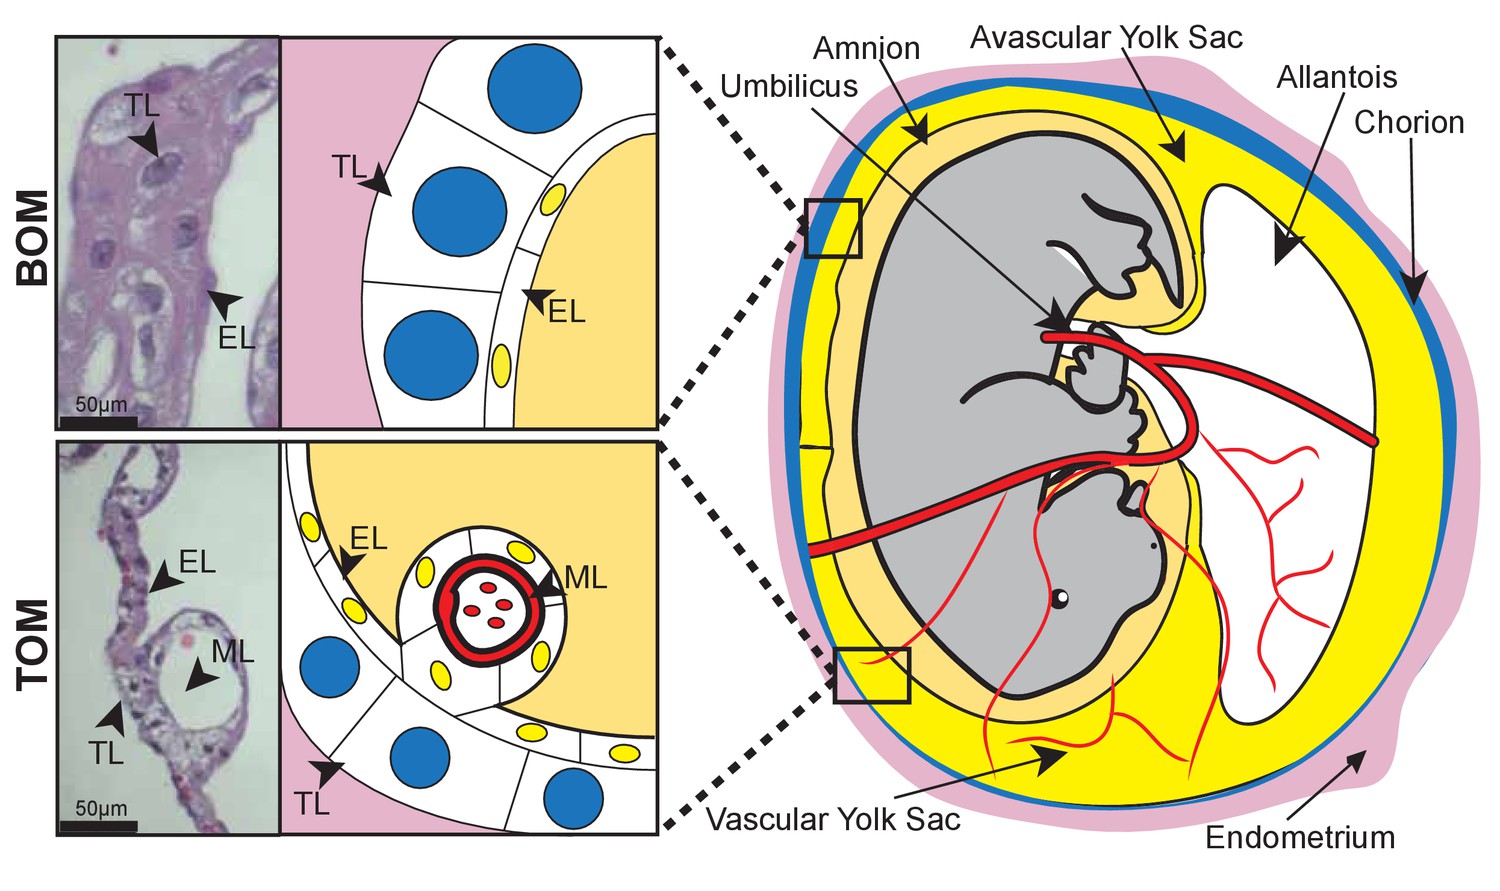
Tammar placental structure.
Schematic of a day 24 tammar conceptus (right) highlighting placental cell types (middle). The tammar yolk sac placenta contains two cellular layers: the trophoblast (TL; blue) and the endoderm (EL; yellow). Further, the placental structure is divided into two halves. The ‘top’ non-vascularized tissue is termed the bilaminar omphalopleure (BOM) and the ‘bottom’ vascularized tissue is termed the trilaminar omphalopleure (TOM) which also contains a mesodermal layer (ML). H&E sections (left) demonstrate the cell types within the BOM and TOM components (Scale bars are 50 μm).
Figure 2 with 1 supplement
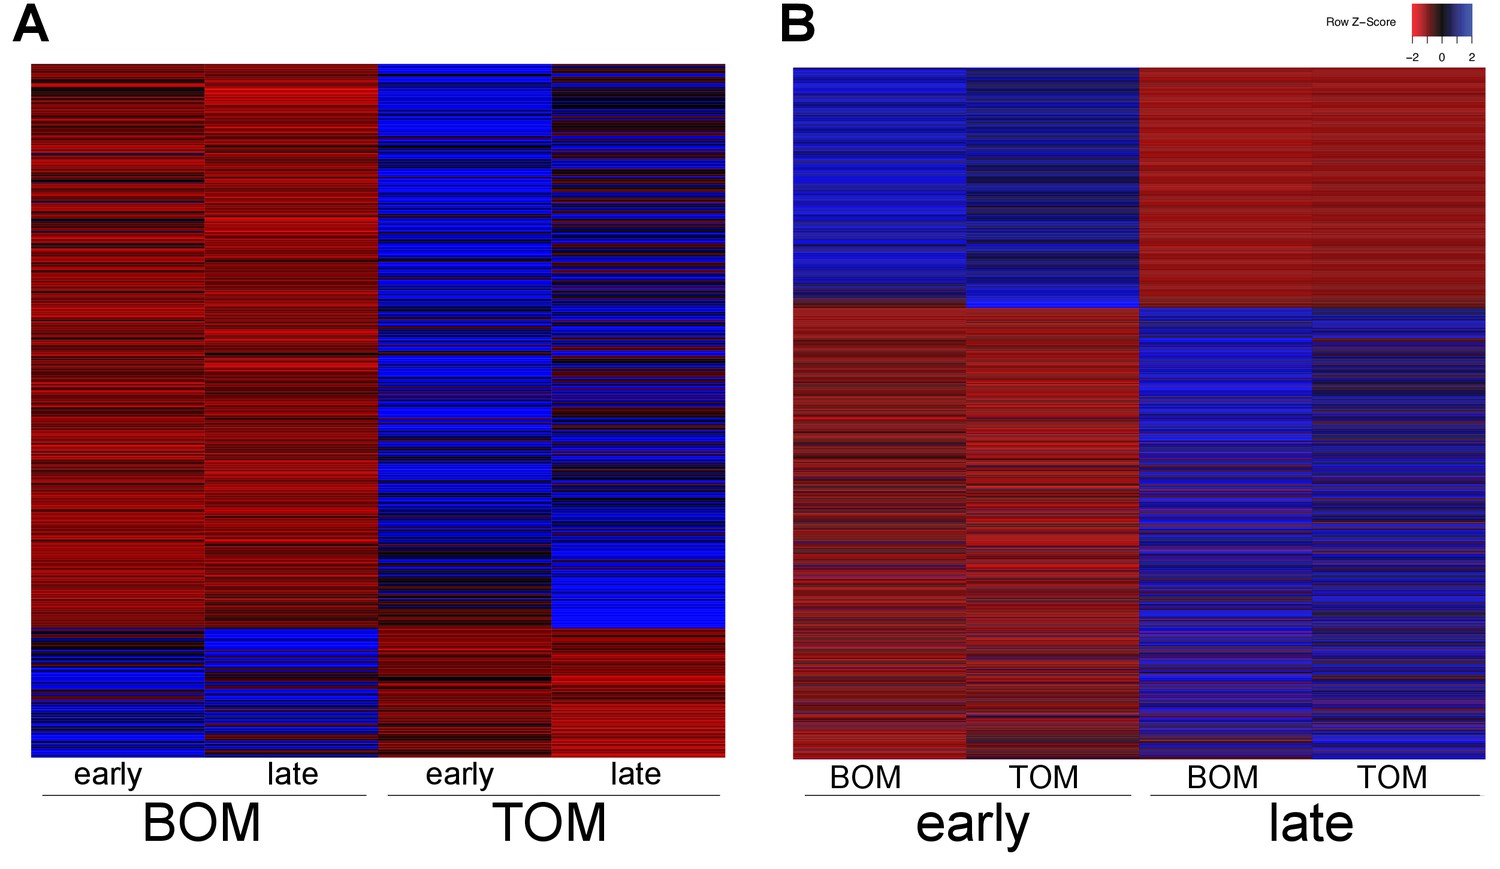
Tammar placental gene expression differs between tissues and over time.
(A) Transcripts differentially expressed between BOM and TOM (n = 445) with blue indicating high expression and red low expression (see Z-score insert upper right). (B) Transcripts differentially expressed between early (day 21–23) and late (day 25) placental time points (n = 1705).
Figure 2—figure supplement 1
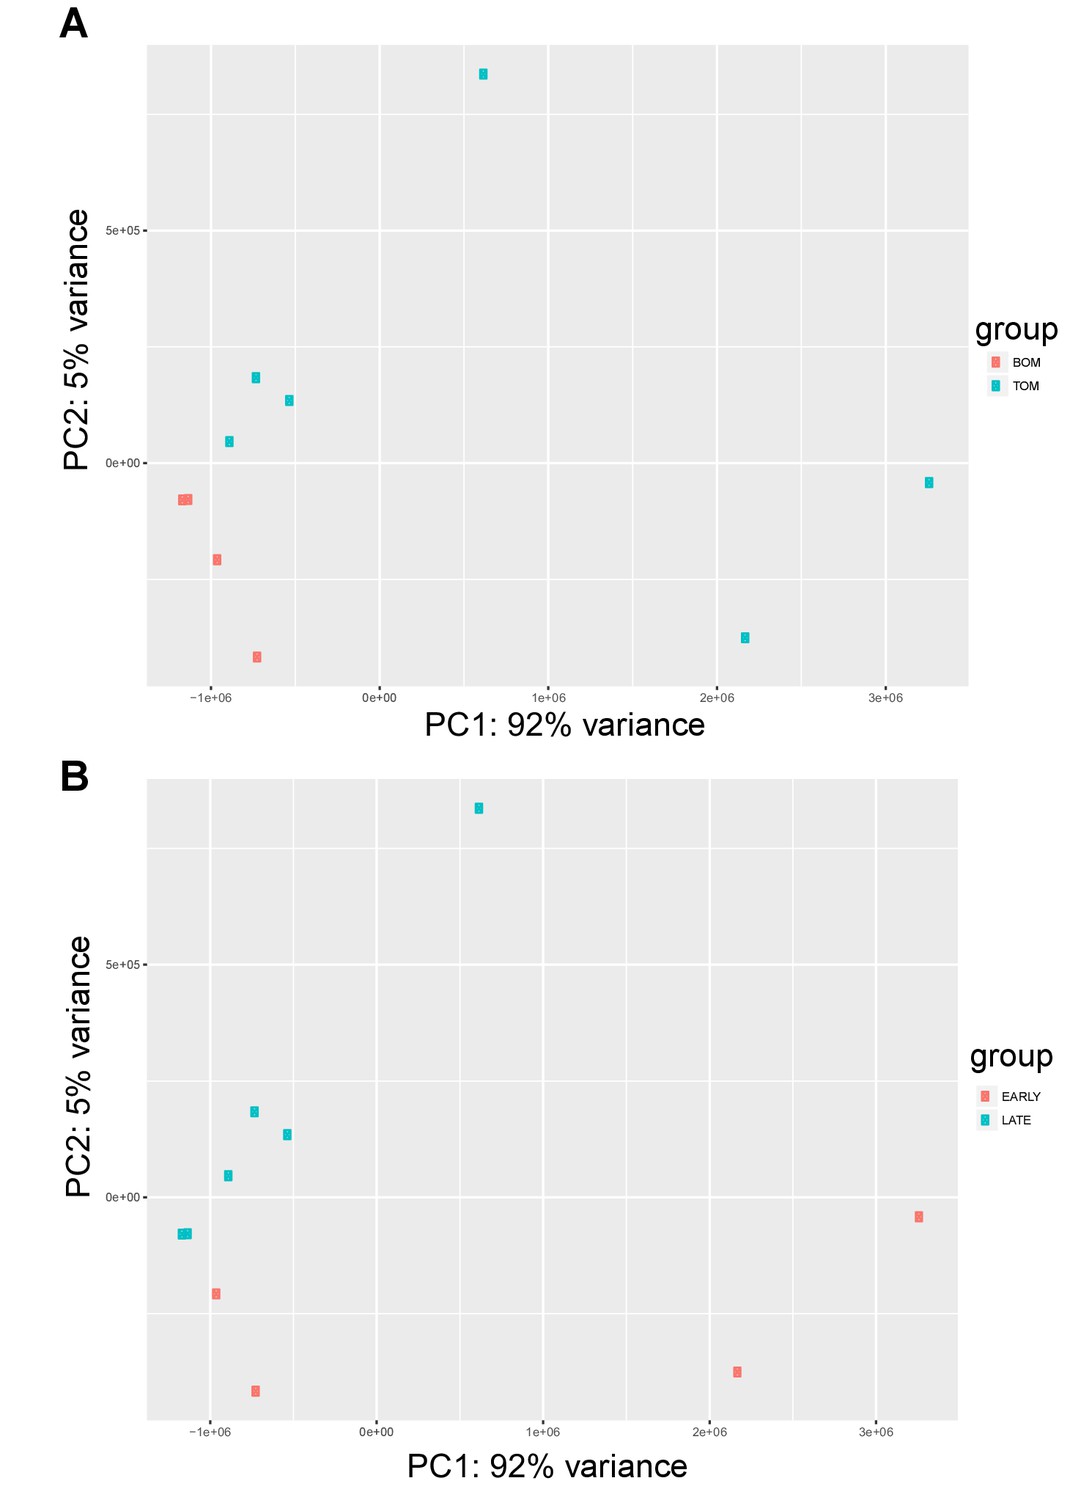
Tammar placenta transcriptome exhibits distinct signatures in both tissue type and time.
(A) PCA plot depicting the 10 RNA-seq replicates colored by placental tissue type: BOM in red and TOM in blue, demonstrating tissue specific separation on principal component 1 (B) PCA re-plotted and colored by time point: early (day 21–23) in red, and late (day 25) in blue, demonstrating temporal separation on principal component 2.
Figure 3 with 1 supplement

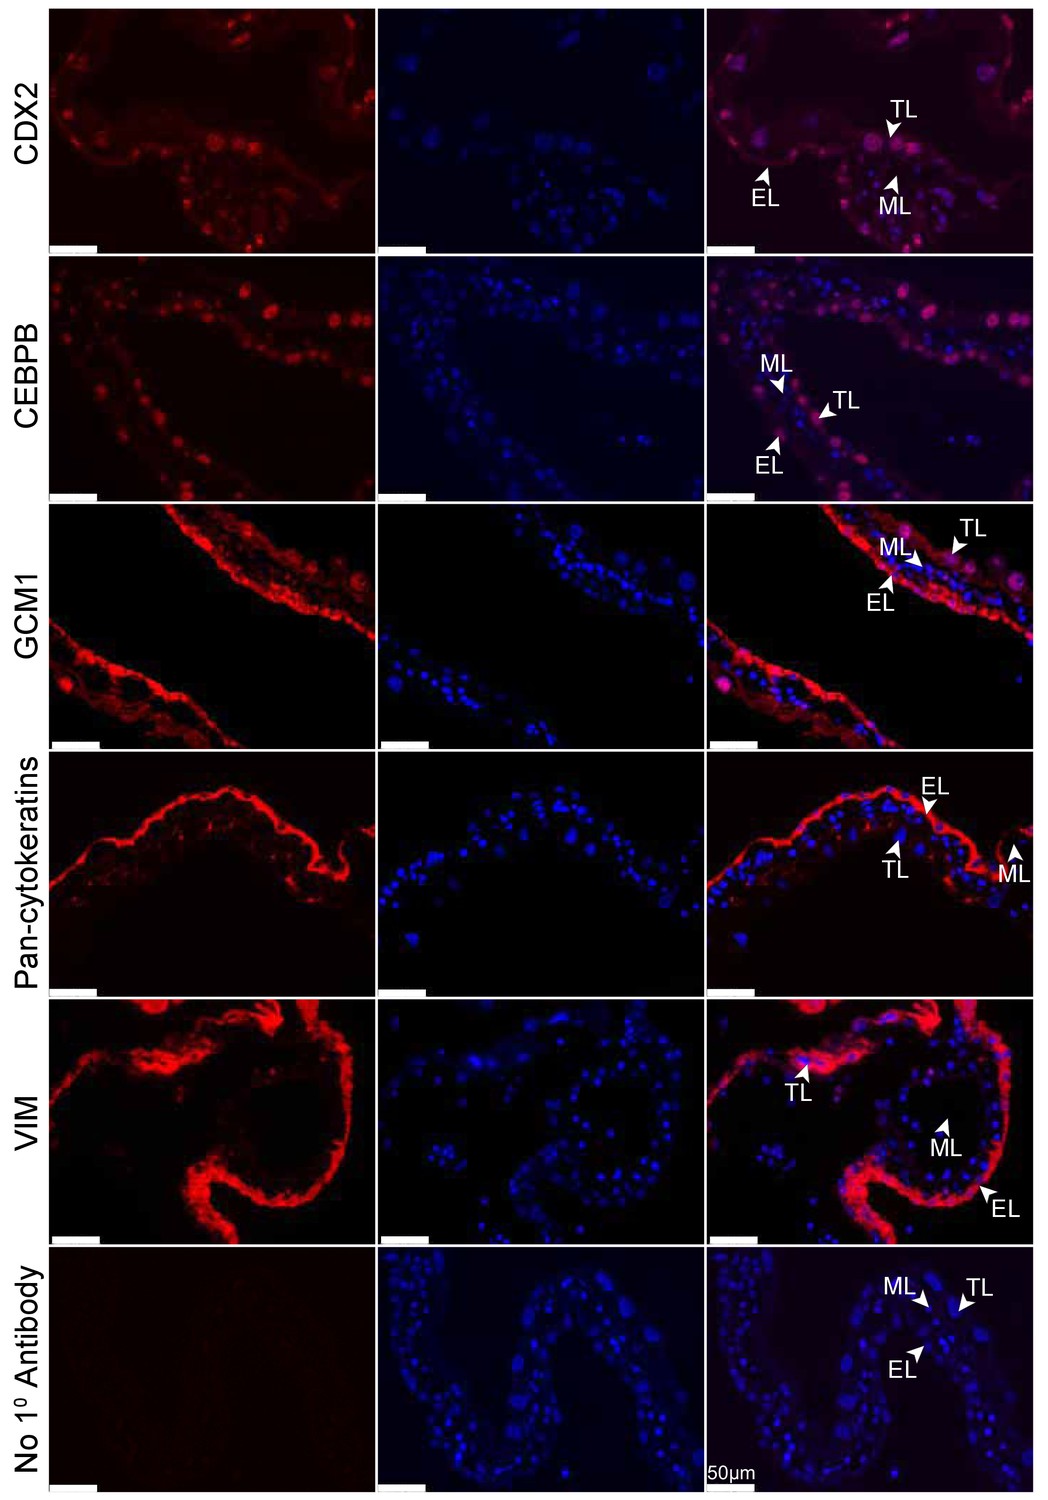
Tammar placenta expresses eutherian placental markers.
Immunofluorescence of the eutherian placental markers: CDX2, CEBPB, GCM1, Pan- cytokeratins, and Vimentin, in day 24 tammar placenta. The left column shows protein expression. The middle is DAPI stain depicting the nucleus for the same section. The right column is the merge. No 1° Antibody is a negative control (bottom row). Scale bars are 50 μm.
Figure 3—figure supplement 1
Tammar placenta expresses eutherian placental markers.
(TOM) Immunofluorescence of key placenta development genes in day 24 wallaby TOM placenta tissue. The first column of panels depicts the expression of each gene, the second column of panels depicts a DAPI nuclear stain, and the third column of panels depicts a merge of both images. Genes depicted from top to bottom include: CDX2, CEBPB, GCM1, Pan-cytokeratins, Vimentin, and a negative control where no primary antibody was applied (Scale bars are 50 μm).
Figure 4 with 1 supplement
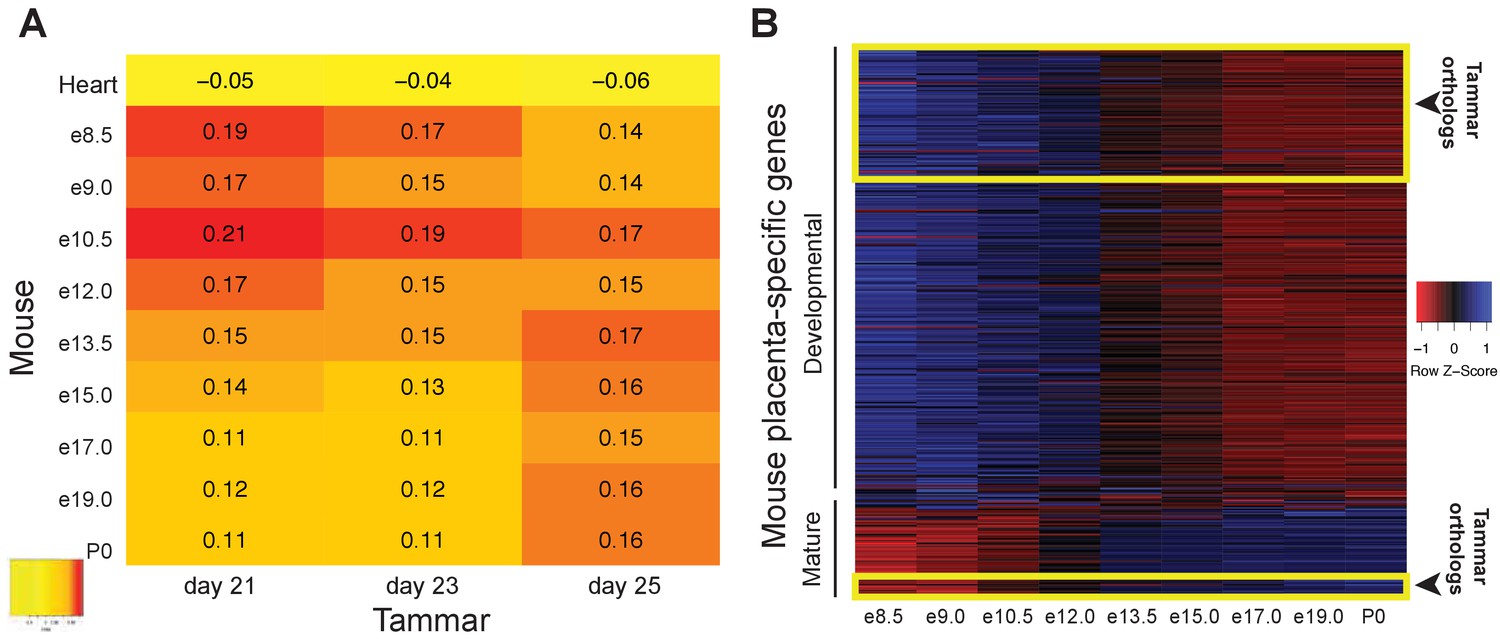
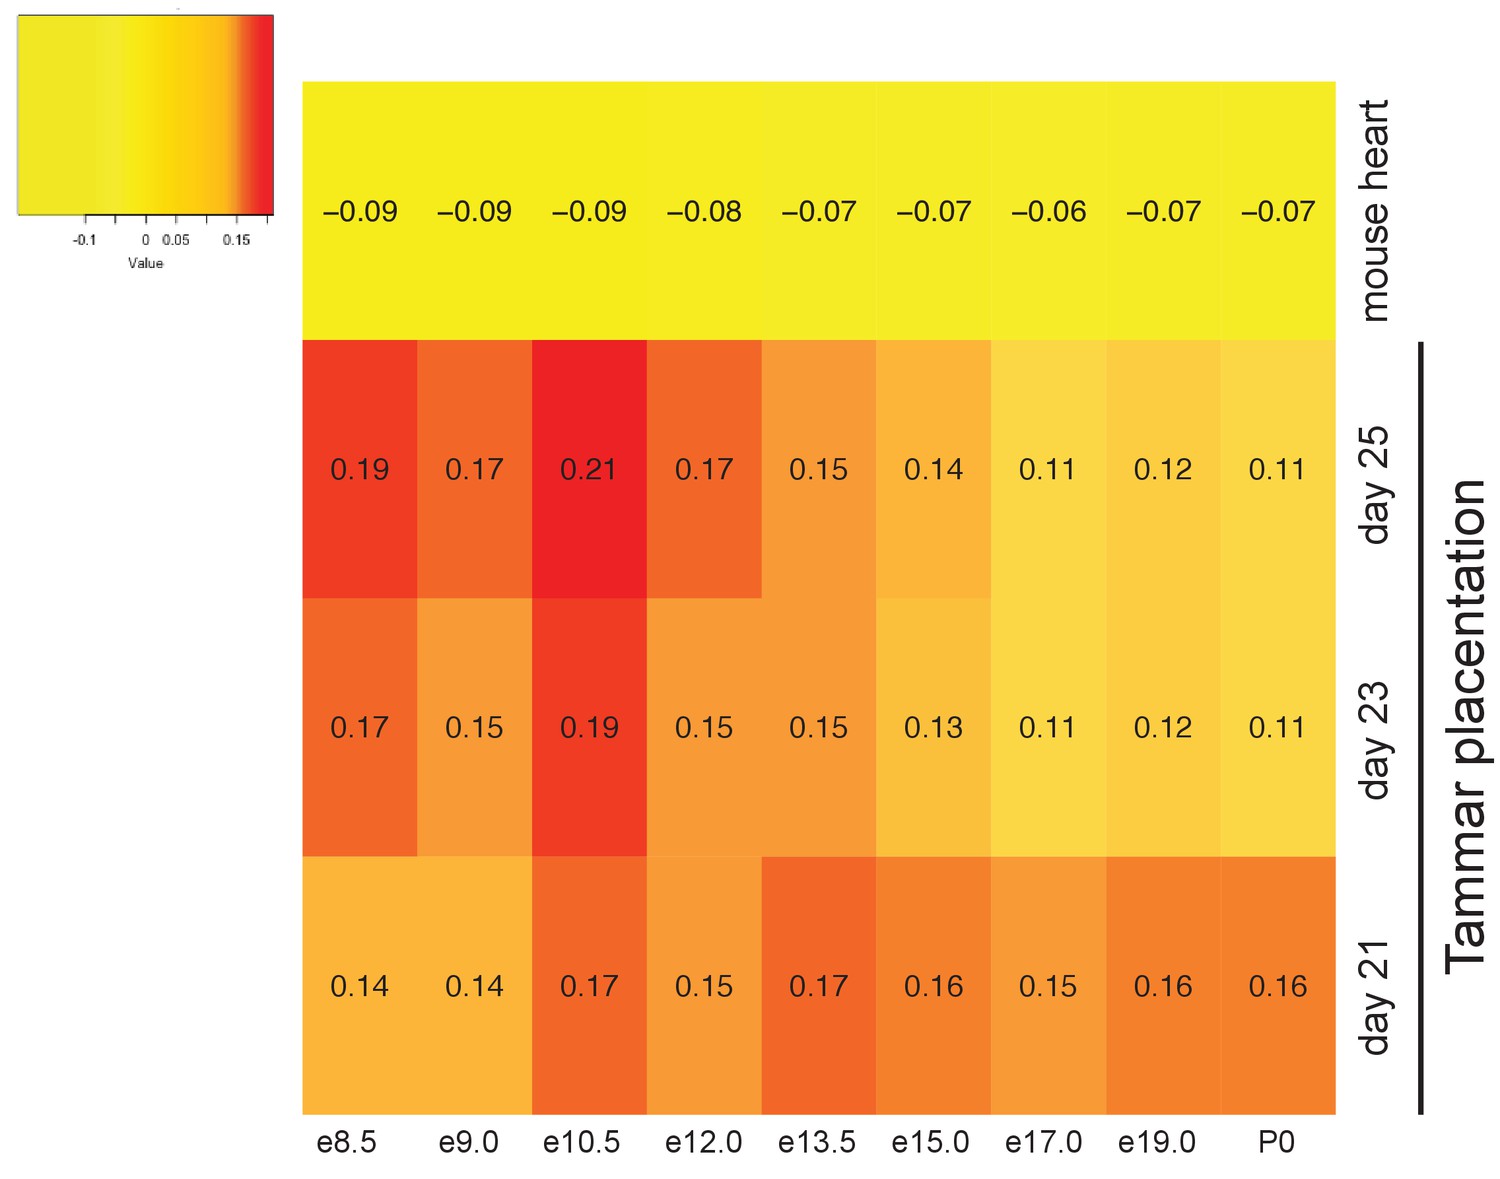
The tammar placenta is more similar to the midgestation mouse placenta.
(A) Comparison of mouse and tammar placental transcriptomes at different gestational ages using Spearman correlations (see values throughout graph). Red indicates the greatest level of transcriptional similarity while yellow indicates the weakest transcriptional similarity. The mouse heart transcriptome used as a control (top). (B) Heat map depicting the expression of 410 transcripts that are specific for the mouse placenta of which 340 are expressed before and 70 are expressed after midgestation (e12.5). The tammar placenta expresses orthologs of 100 of these transcripts, which are highlighted in the yellow boxes on the heat map. 90 are classified as developmental, or expressed early in mouse, and 10 are classified as mature, or expressed late in mouse. Blue indicates high expression and red low expression (see Z-score on right).
Figure 4—figure supplement 1
Tammar placenta exhbits conservation of placenta-specific gene expression.
Heat map depicting a comparison of the mouse placental transcriptomes against tammar and adult mouse heart transcriptome to detect conservation organ-specific transcription. Red indicates the greatest level of transcriptional similarity while yellow indicates the weakest transcriptional similarity.
Figure 5 with 1 supplement
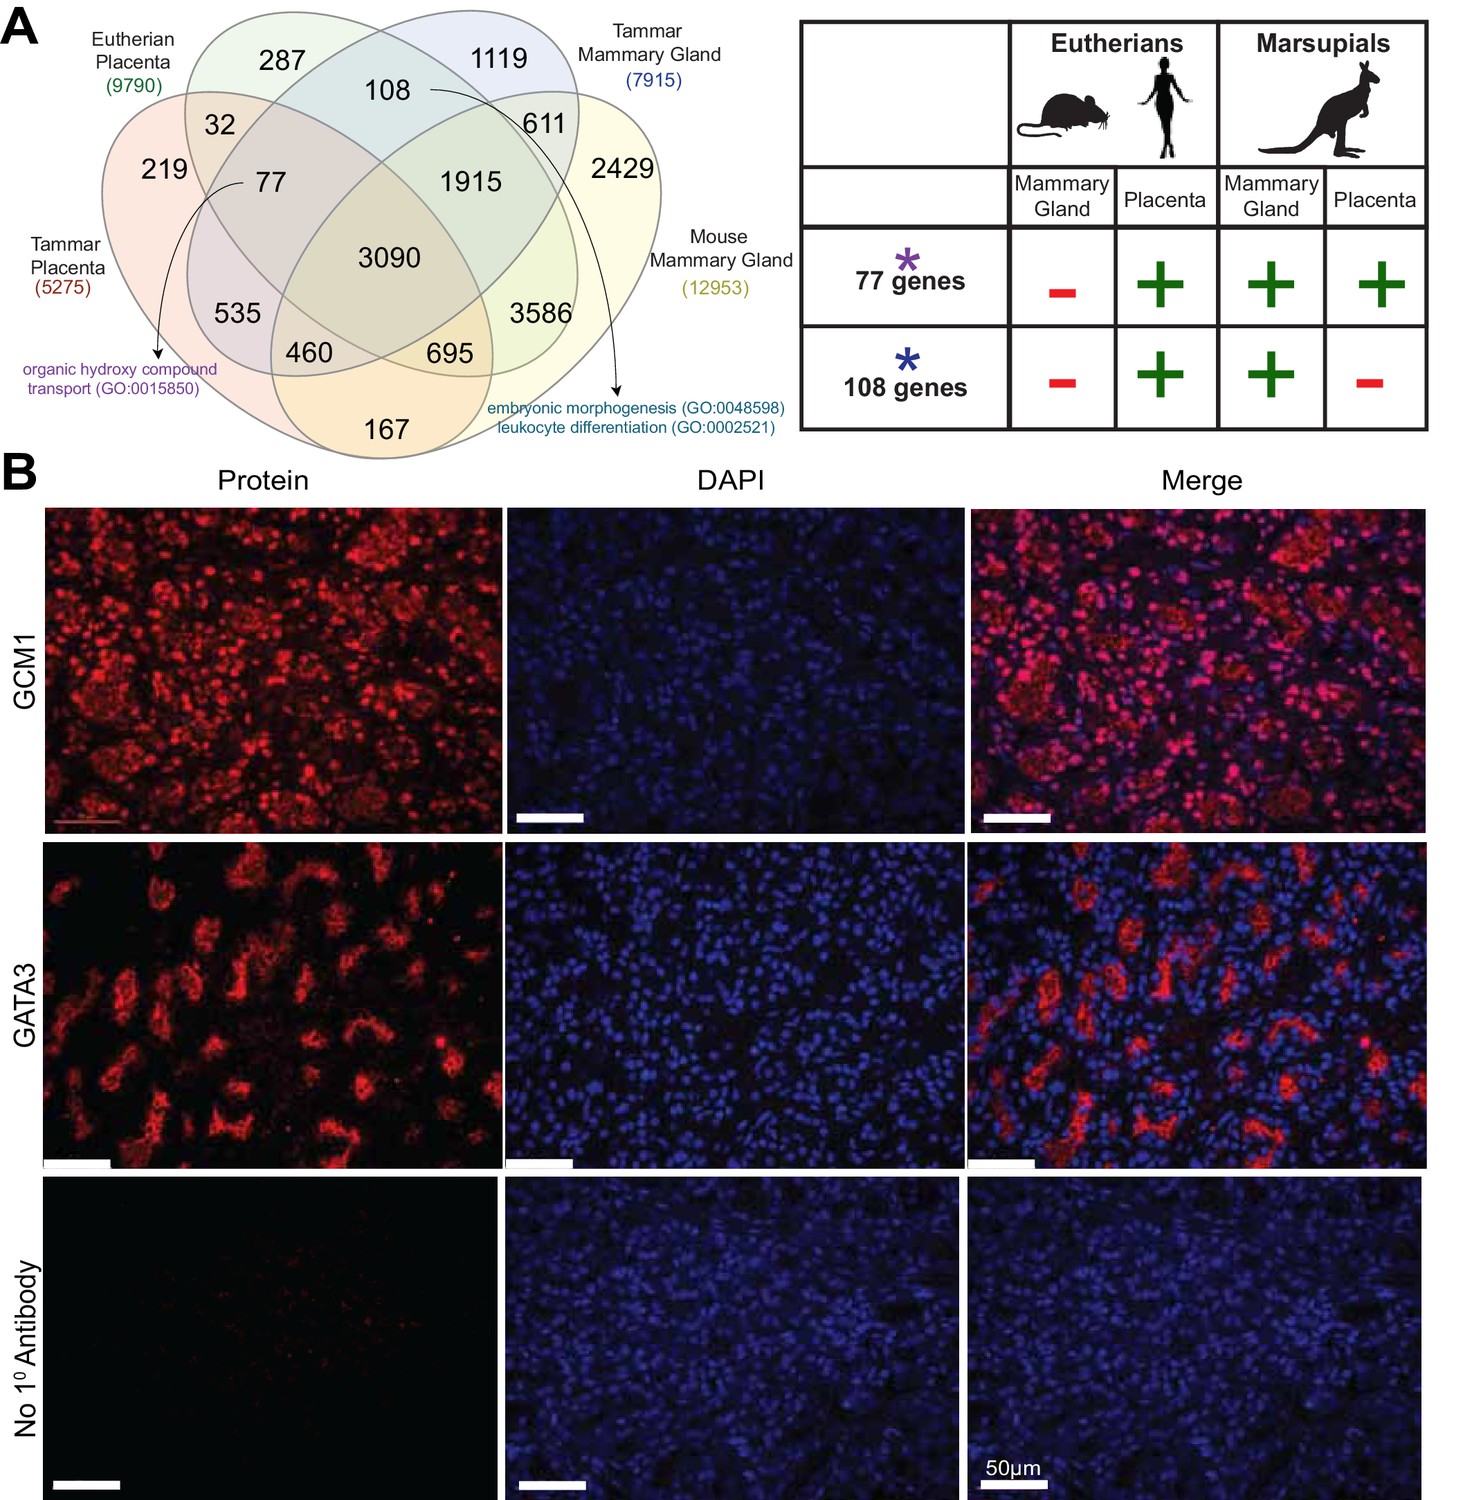
Shuffling of reproduction genes between lactation and placentation.
(A) Venn-diagram (Left) comparing the genes expressed in the lactating tammar and mouse mammary glands with the tammar and eutherian placenta. Key ontology of genes in overlapping categories is highlighted. Genes listed for each category in Supplementary file 3. The table (Right) depicts key categories of genes from the venn-diagram and whether or not they are expressed in the placenta and mammary gland tissues of the tammar and eutherians. If the gene class is present in the tissue of a given lineage it is given a green ‘+”, if it is absent it is given a red “-“. (B) Immunofluorescence of GCM1 and GATA3. The first column depicts the expression of each protein, the second column is DAPI stain for nuclear DNA, and the third column is a merge of both images. The final row contains a negative control where no primary antibody was applied (Scale bars are 50 μm).
Figure 5—figure supplement 1
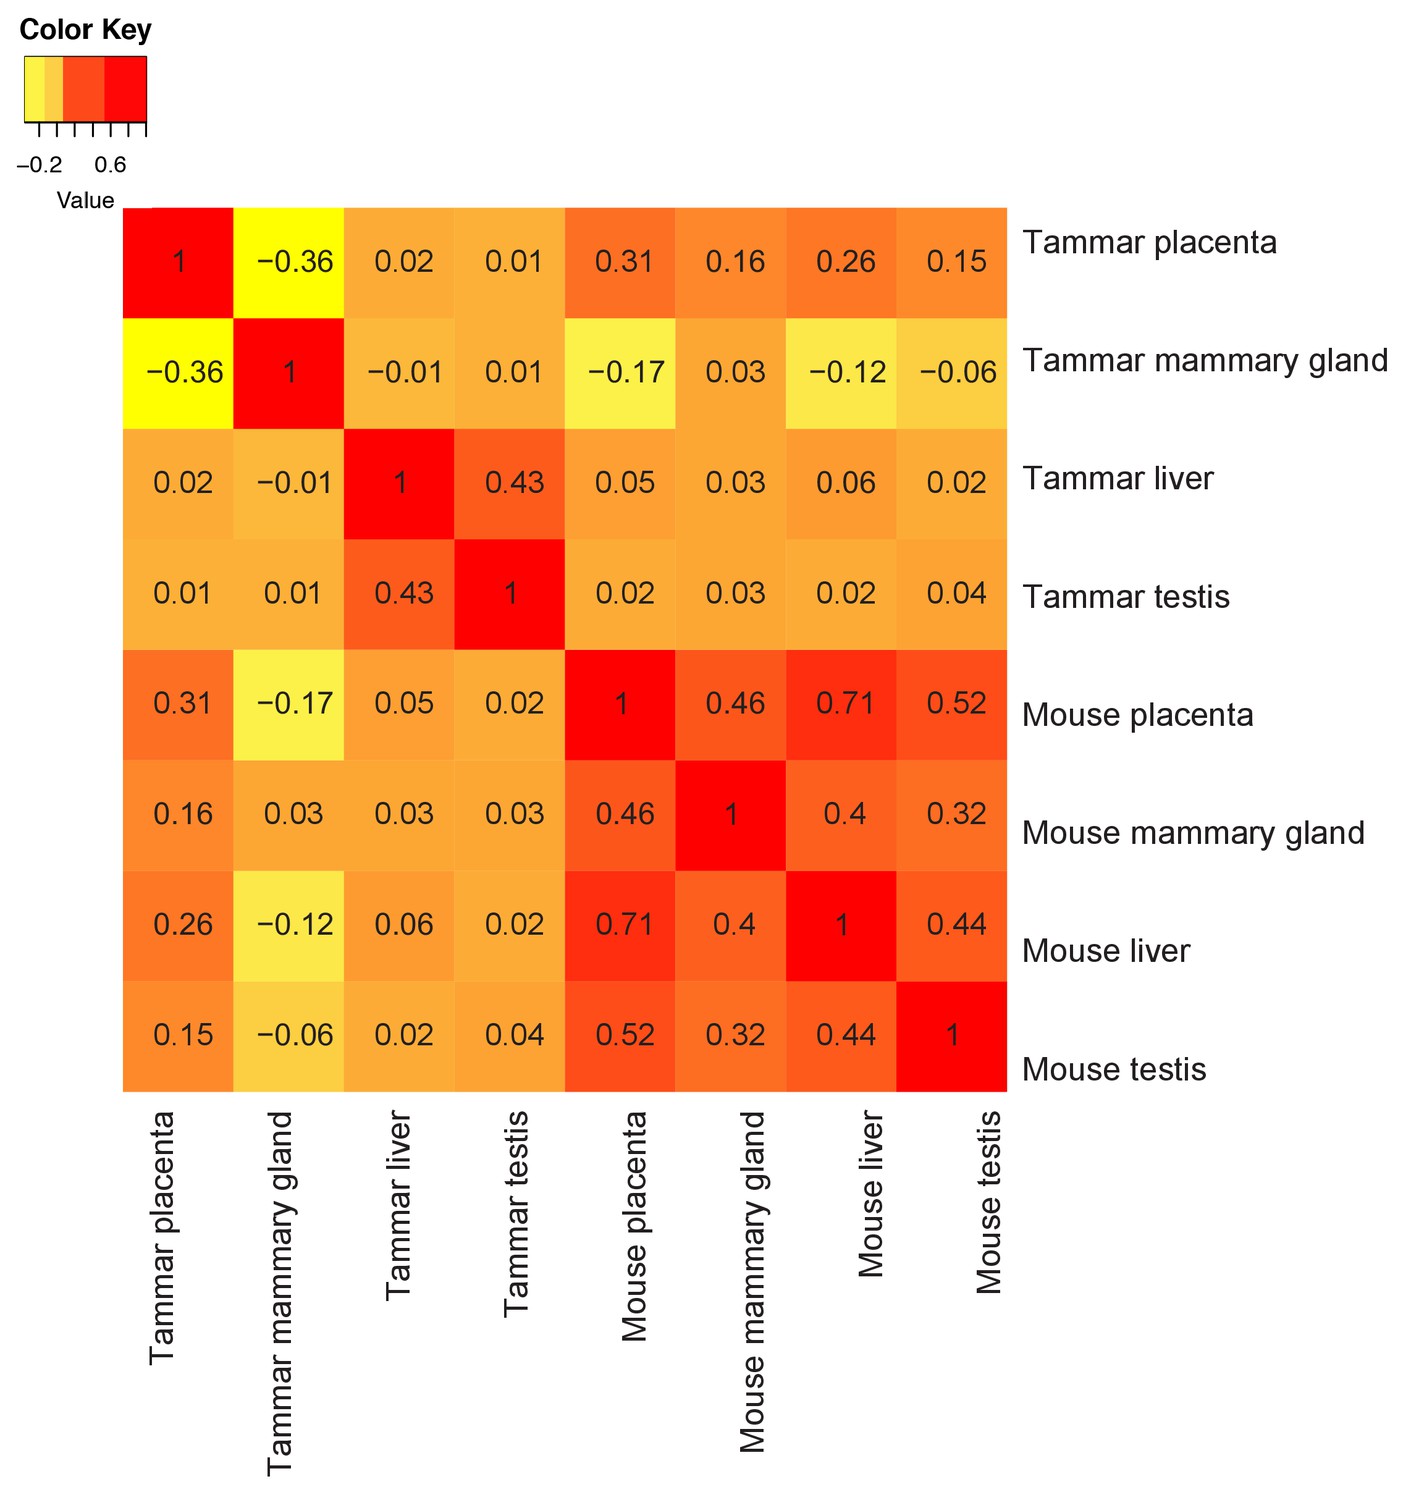
Tammar placenta and mammary gland have exceptionally distinct molecular functions.
Comparison of tammar and mouse organ transcriptomes including: placenta, mammary gland, liver and testis using Spearman correlations (see values throughout graph). Red indicates the greatest level of transcriptional similarity while yellow indicates the weakest transcriptional similarity.
Additional files
-
Supplementary file 1
Genes, transcripts, and GO terms for differential expression analysis
Excel spreadsheet containing (1) Up-regulated gene names for each category analyzed by differential expression (2) Up-regulated transcript IDs for each category analyzed by differential expression (3) GO terms for Up-regulated BOM genes (4) TOM genes (5) early genes and (6) late genes. GO terms discussed in the manuscript are highlighted in yellow.
- https://doi.org/10.7554/eLife.27450.012
-
Supplementary file 2
Genes shared by the tammar, term mouse, and term human placentas
Excel file containing all genes shared and uniquely expressed in the placenta of the marsupial, tammar wallaby, and eutherians, mouse and human.
- https://doi.org/10.7554/eLife.27450.013
-
Supplementary file 3
Genes and GO terms for organ expression comparisons
Excel file containing (1) All genes shared and uniquely expressed between tammar placenta, eutherian placenta, tammar mammary gland, and mouse mammary gland (analyzed categories highlighted) (2) Genes analyzed from placenta to liver and placenta to testis comparisons (3) GO terms for genes shared between tammar placenta, eutherian placenta, and tammar mammary gland (4) GO terms for genes shared between tammar placenta, eutherian placenta, and tammar liver (5) GO terms for genes shared between tammar placenta, eutherian placenta, and tammar testis (6) GO terms for genes shared only by eutherian placenta and tammar mammary gland (7) GO terms for genes shared only by eutherian placenta and tammar liver (8) GO terms for genes shared only by eutherian placenta and tammar testis. GO terms discussed in the manuscript are highlighted in yellow.
- https://doi.org/10.7554/eLife.27450.014
Download links
A two-part list of links to download the article, or parts of the article, in various formats.
Downloads (link to download the article as PDF)
Open citations (links to open the citations from this article in various online reference manager services)
Cite this article (links to download the citations from this article in formats compatible with various reference manager tools)
Molecular conservation of marsupial and eutherian placentation and lactation
eLife 6:e27450.
https://doi.org/10.7554/eLife.27450


