The periaqueductal gray and Bayesian integration in placebo analgesia
- University Medical Center Hamburg-Eppendorf, Germany
Figures
Figure 1 with 1 supplement
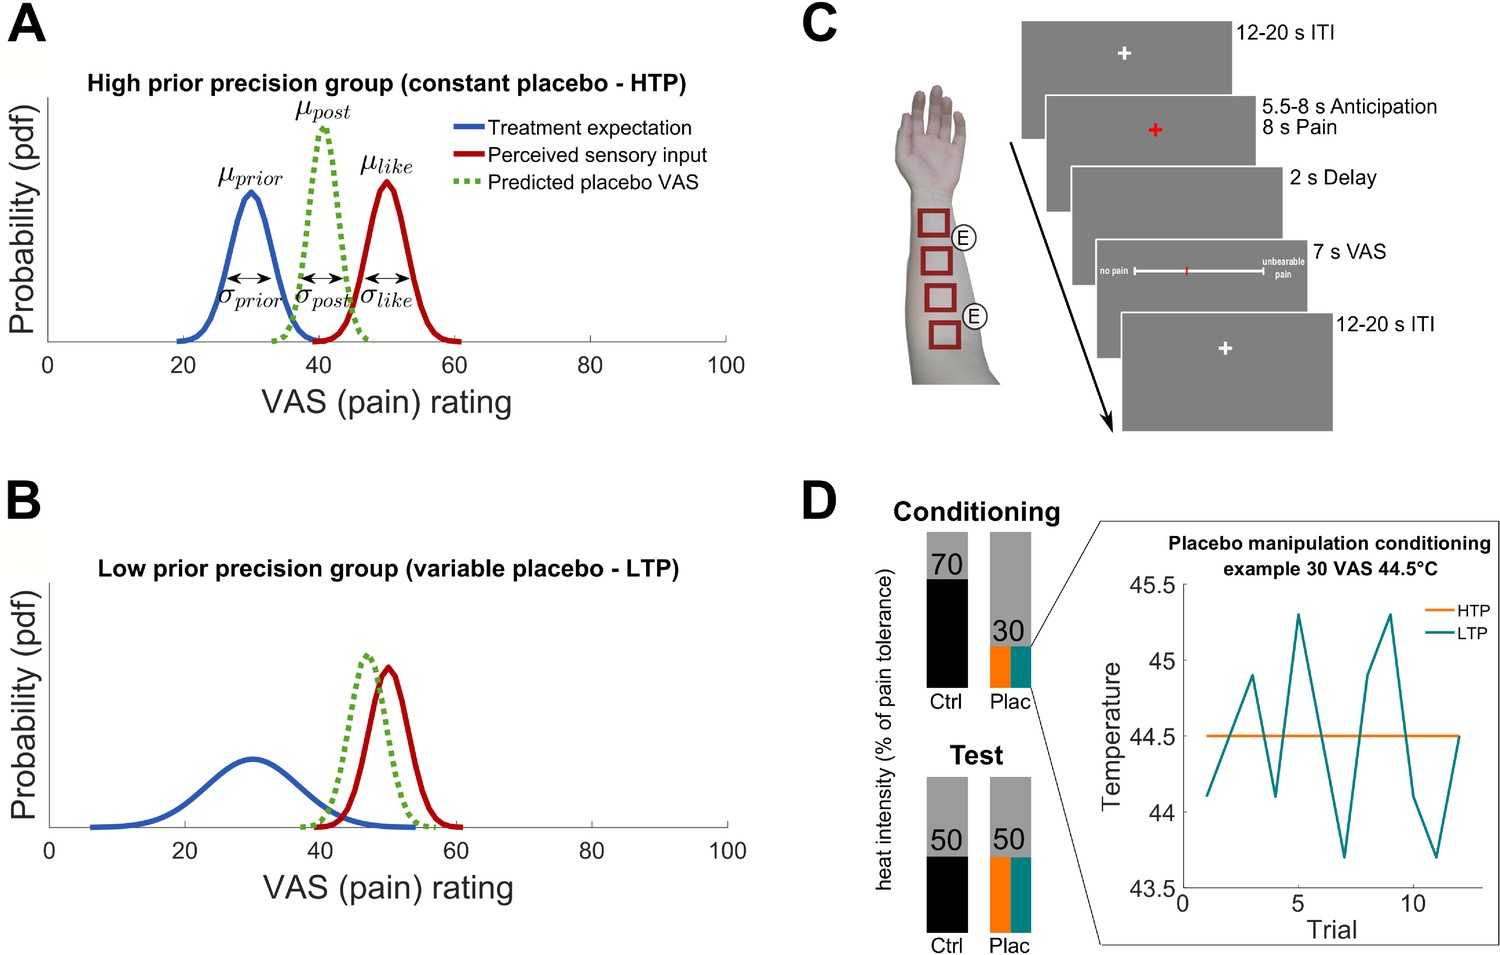
Hypotheses and experimental design.
(A) and (B) Hypothesized posterior prediction per group illustrated by Gaussian probability density functions. The different prior distributions (blue) reflect precise (A) and variable (B) treatment expectations both around the conditioned VAS mean of 30 () but with different standard deviations () due to the experimental manipulation. The likelihood distribution (red) was not manipulated and is therefore displayed identical for both groups. The posterior distribution (dashed green) reflects the model prediction of the perceived pain of a new treatment experience. In Bayesian integration, prior and likelihood are weighted by their relative precision which draws the respective prediction into the direction of the more precise distribution. The hypothesized placebo effect () is therefore larger for higher (A) compared to lower (B) treatment expectation precision. (C) Stimulation patches on the left arm including electrode positions for the sham TENS treatment and one experimental trial. (D) Conditioning and test phase pain intensities including the experimental prior manipulation of the two groups (see also Figure 1—source data 1 and Figure 1—figure supplement 1 for exit questionnaire information). An example is displayed representing a calibrated intensity of 30% pain tolerance at a temperature of 44.5°C. No variability was induced for the precise treatment expectation group (orange) compared to induced variability of SD 0.55°C for each subject of the variable treatment expectation group (turquoise). Mean temperature was the same for all participants irrespective of the group assignment. The heat pain intensity of conditioning control, test placebo as well as test control were always presented without induced variability in both groups. HTP, high treatment precision; LTP, low treatment precision; pdf, probability density function; µ, mean; σ, standard deviation; VAS, visual analogue scale; ITI, inter-trial-interval; ctrl, control condition; plac, placebo condition.
-
Figure 1—source data 1
Post-experimental TENS-exit-questionnaire (prior to debriefing).
- https://doi.org/10.7554/eLife.32930.005
Figure 1—figure supplement 1

Frequencies of post-experimental TENS-questionnaire.
Figure 1—source data 1 shows each question and the correlation parameter (r) with the observed placebo effect. Q1 – question 1; Q2 – question 2; etc.
Figure 2
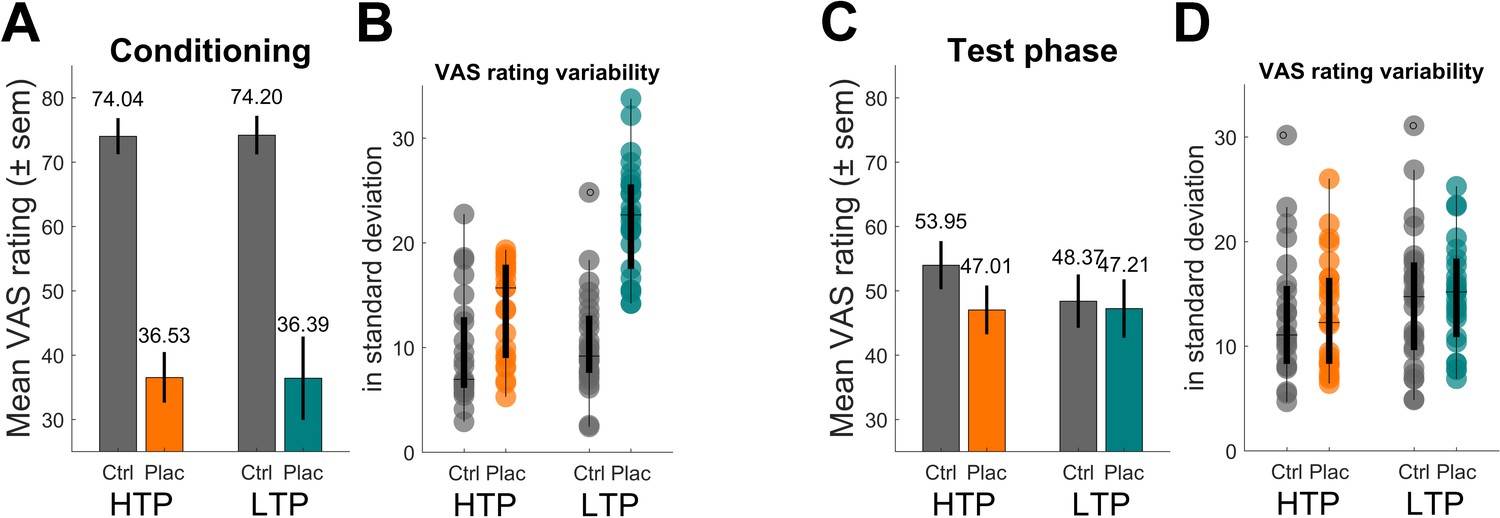
Behavioral results of pain ratings.
(A) Conditioning phase pain ratings reflecting the two distinct temperatures for the control (ctrl) and placebo (plac) condition. (B) Boxplot of single subject standard deviations of pain ratings of the conditioning phase. Note the higher variability within the LTP group’s placebo condition (turquoise). (C) Test phase pain ratings reflecting the analgesic effect of the treatment. The significant interaction effect revealed a larger placebo effect for the HTP compared to the LTP group. Note that the temperature for all trials of the two conditions was identical and constant for both groups. (D) Boxplot of single subject standard deviations of pain ratings of the test phase. Variability levels across conditions do not differ (D). HTP, high treatment precision (nsub-HTP = 23); LTP, low treatment precision (nsub-LTP = 26); sem, standard error of mean.
Figure 3 with 2 supplements
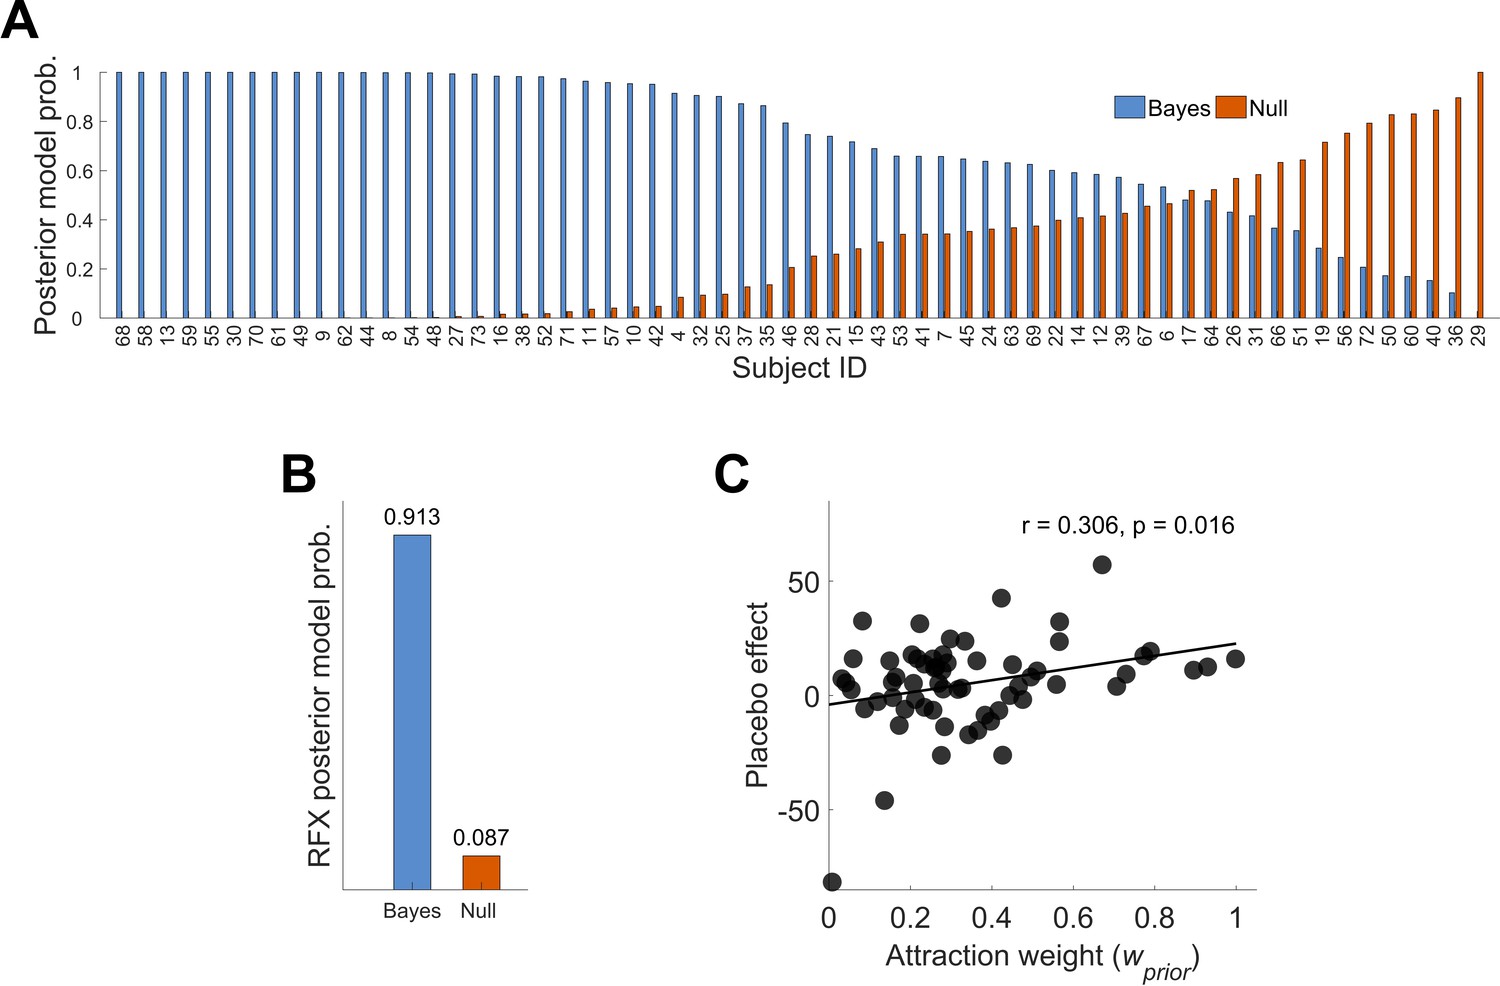
Posterior model probabilities given the observed data (N = 62) and relationship between the attraction weight and the placebo effect.
(A) Single subjects posterior model probabilities for the Bayesian and Null model. The data is sorted by the Bayesian model posterior probability of each subject. (B) Random effects overall posterior model probability for the two models. (C) Positive correlation between the placebo effect and the Bayesian integrated treatment variability (attraction weight – relative variability of prior and likelihood, see Materials and methods Equation (3)). This is implying that higher treatment precision (prior) compared to higher variability in new sensory inputs (likelihood) may lead to larger placebo effects. See also Figure 3—figure supplements 1 and 2 for single subject fits. RFX, random effects; r, correlation coefficient.
Figure 3—figure supplement 1
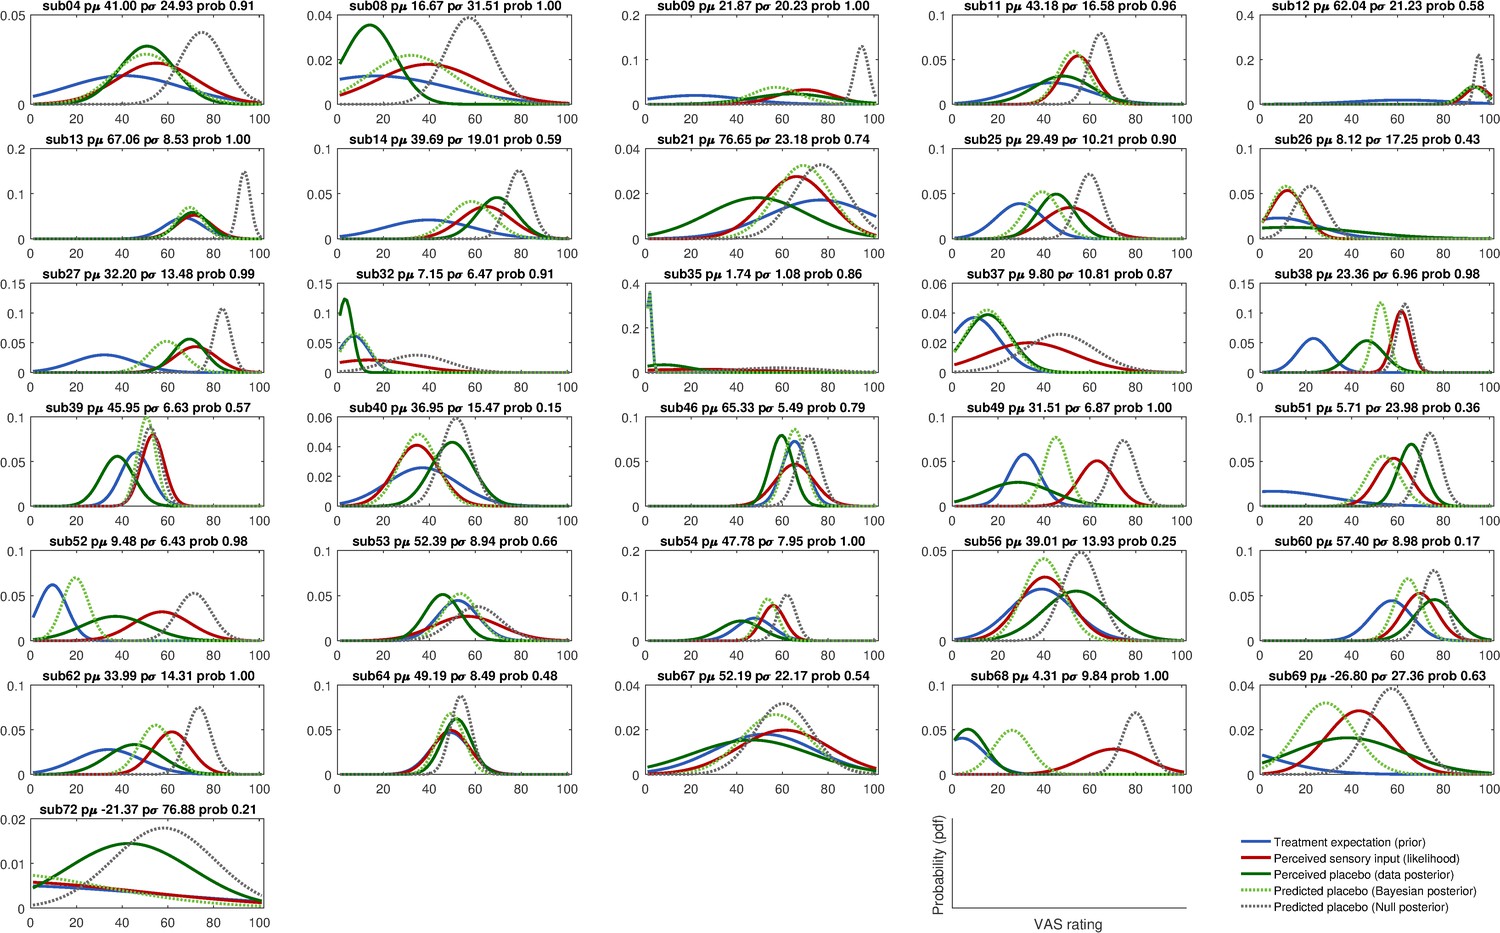
Integration of prior and likelihood of single subjects including predictions for the Bayesian and Null model: high treatment precision subjects (HTP group).
Solid lines represent observed data and dashed lines represent model predictions of the placebo treatment outcome. pµ – prior µ; pσ – prior standard deviation; prob – posterior probability of the Bayesian integration model (compared to the no-learn Null model); pdf – probability density function; VAS – visual analogue scale.
Figure 3—figure supplement 2
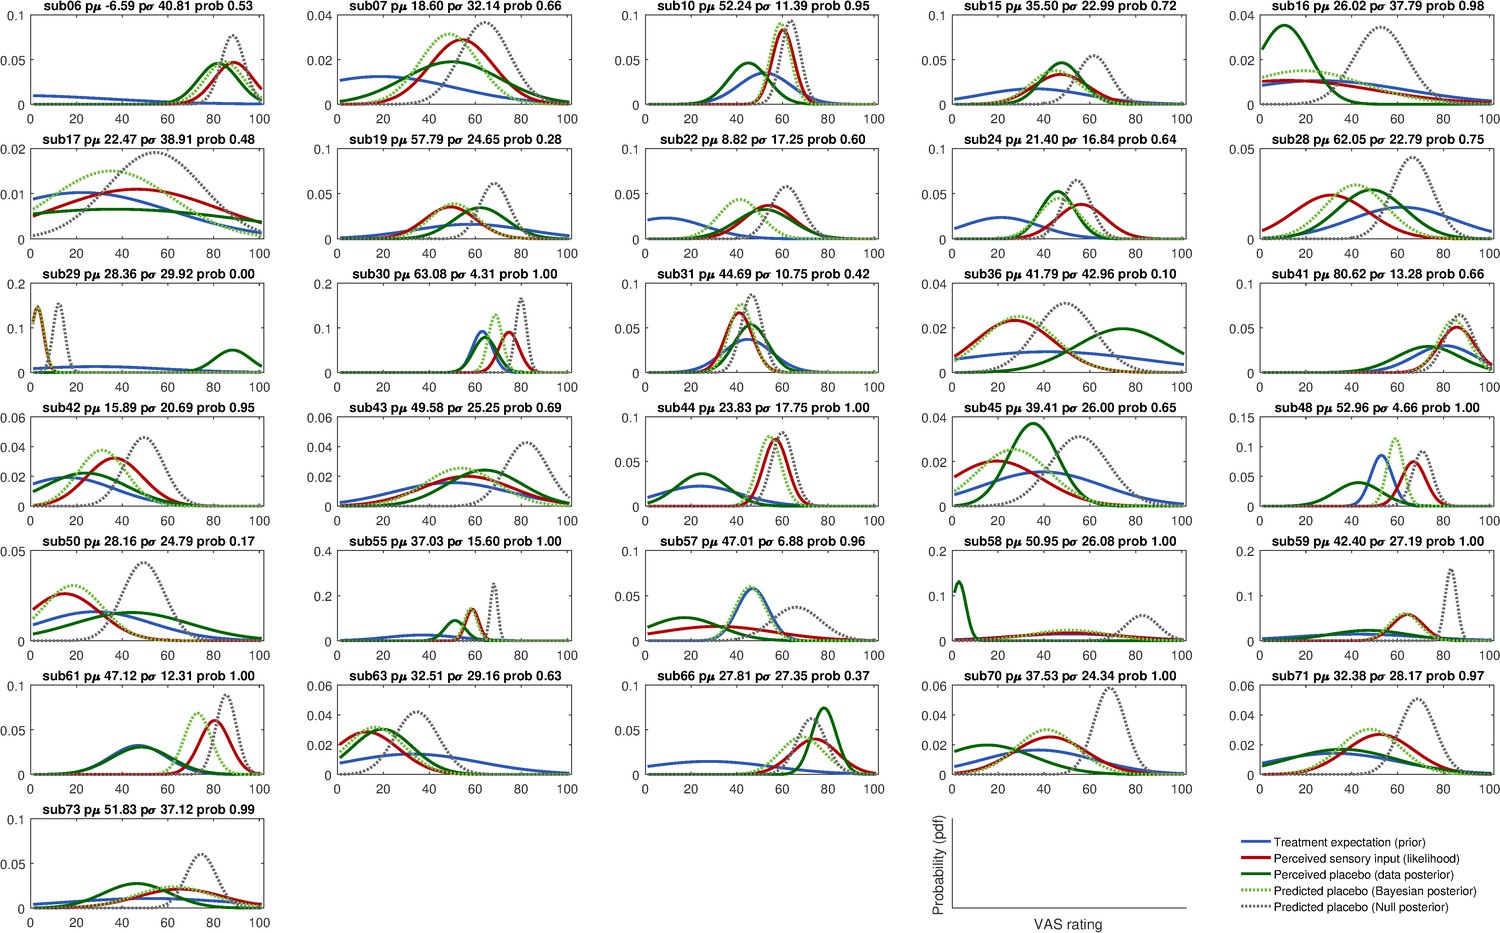
Integration of prior and likelihood of single subjects including predictions for the Bayesian and Null model: low treatment precision subjects (LTP group).
Solid lines represent observed data and dashed lines represent model predictions of the placebo treatment outcome. pµ – prior µ; pσ – prior standard deviation; prob – posterior probability of the Bayesian integration model (compared to the no-learn Null model); pdf – probability density function; VAS – visual analogue scale.
Figure 4 with 5 supplements
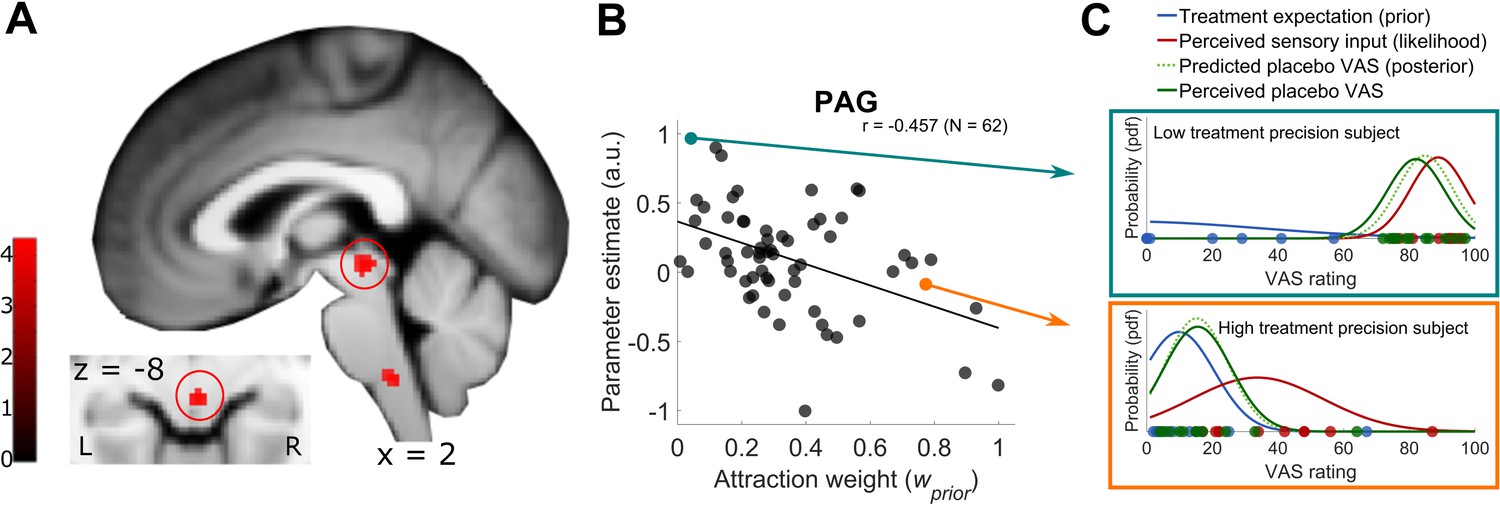
Model-based fMRI approach of PAG signal and Bayesian integrated treatment variability.
(A) One sample t test of the test phase placebo condition with the attraction weight as covariate. Beside the PAG activation, a cluster in the rostral ventromedial medulla (RVM) was observed. Visualization was set to puc <0.001, see also Figure 4—figure supplement 1 for a more detailed visualization and Figure 4—source data 1 as well as Figure 4—source data 2 for first level con-images of the test phase placebo condition. (B) Detailed visualization of the negative relationship between PAG BOLD signal and Bayesian attraction weight as depicted in A, implying increased PAG signal being associated with higher variability in placebo treatment expectations (prior) and lower variability in new sensory inputs (likelihood). Subject’s PAG parameter estimates of the displayed cluster were small volume corrected, extracted per voxel and averaged to result in a mean parameter estimate. (C) Single subject examples of the Bayesian integration for a high and low prior treatment subject. Markers (blue – prior, red – likelihood, green – observed data) represent single trial ratings of the respective fitted Gaussian probability density function (pdf). The predicted posterior displays the integrated Bayesian model prediction of the observed data (dashed light green). L, left; R, right; a.u., arbitrary units; PAG, periaqueductal gray; pdf, probability density function; VAS, visual analogue scale.
-
Figure 4—source data 1
First-level con-images of Figure 4—figure supplement 1 to 4 (HTP group).
- https://doi.org/10.7554/eLife.32930.016
-
Figure 4—source data 2
First-level con-images of Figure 4—figure supplement 1 to 4 (LTP group).
- https://doi.org/10.7554/eLife.32930.017
Figure 4—figure supplement 1
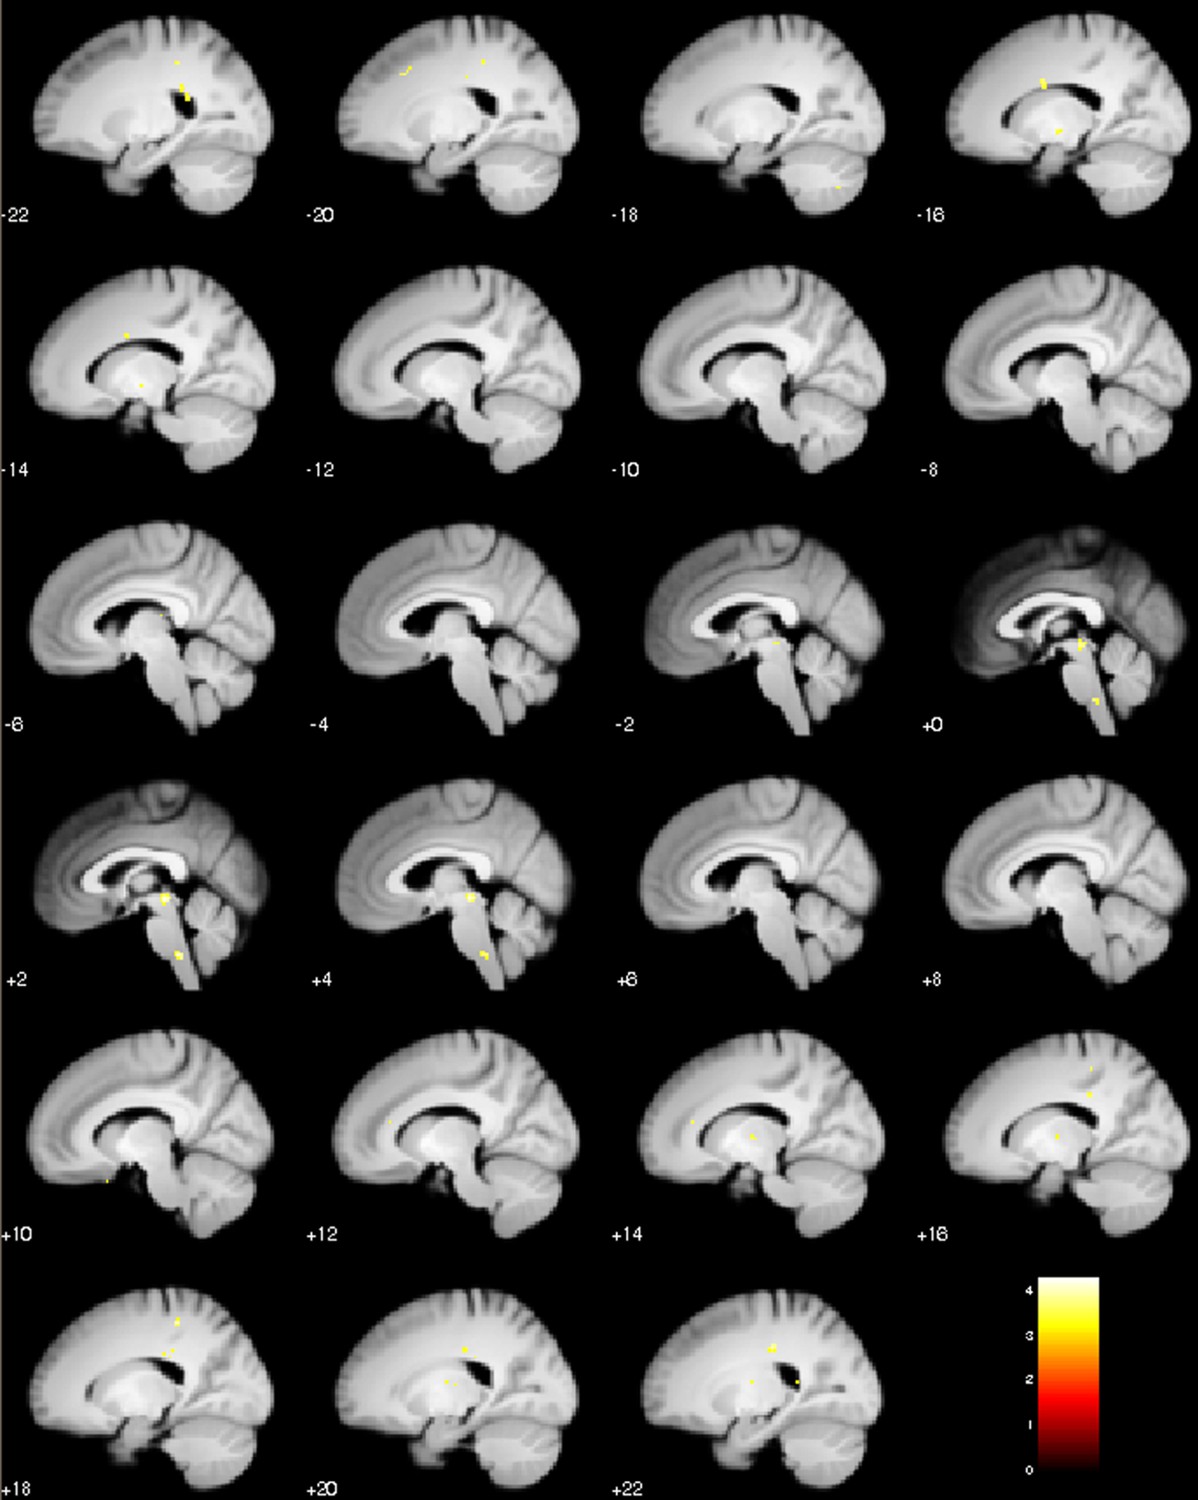
Sagittal slices of test phase placebo treatment with the attraction weight as covariate (relative precision of prior and likelihood).
Negative correlation, peak coordinate PAG [2 -26 -8] (pFWE = 0.001), visualization of puc <0.001.
Figure 4—figure supplement 2

Sagittal slices of test phase placebo treatment with the prior µ as covariate (mean of prior treatment expectation).
Positive correlation, visualization of puc <0.001.
Figure 4—figure supplement 3
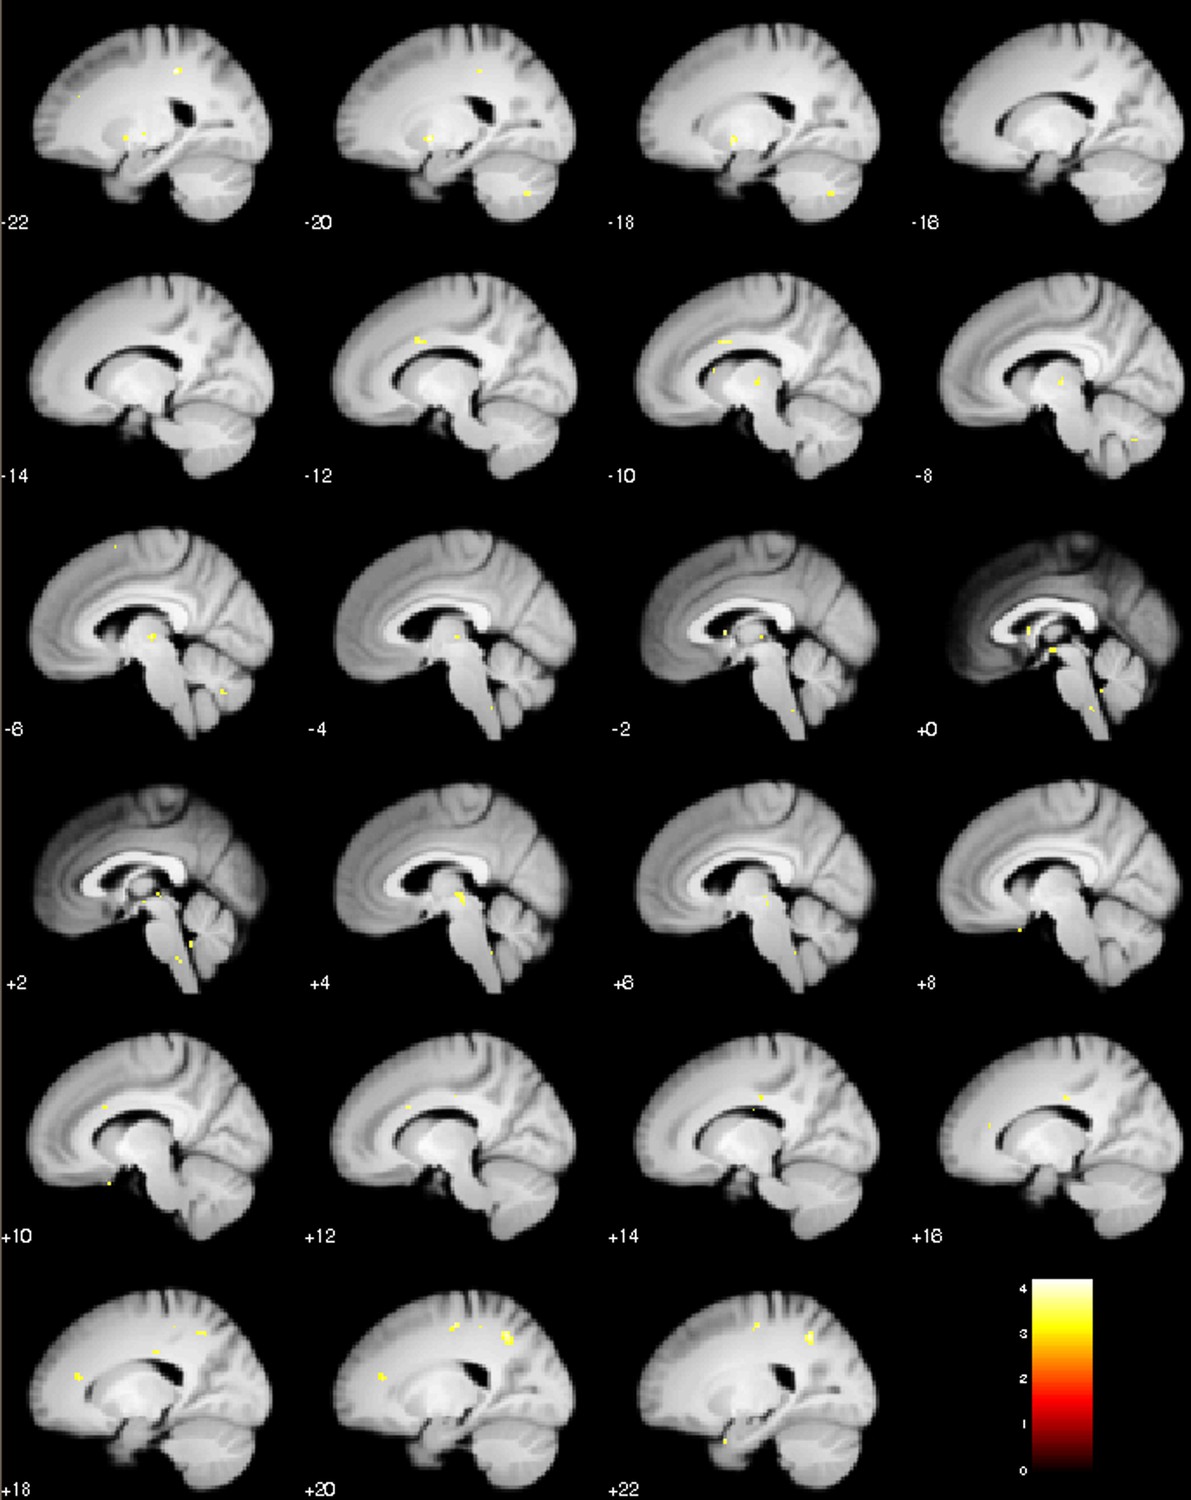
Sagittal slices of test phase placebo treatment with the log-transformed prior σ as covariate (log-transformed standard deviation of prior treatment expectation).
Positive correlation, visualization of puc <0.001.
Figure 4—figure supplement 4

Exploratory results of test phase placebo treatment with the posterior model probability of Bayes over Null model as covariate (blue bars of Figure 3A).
(A) Negative correlation (no regions found with positive correlation) meaning the more likely the observed behavioral data was explained by the optimal Bayesian integration compared to the Null model, the more decreased the signal in these areas was. Reported are whole brain (WBC) and small volume corrected (SVC) findings (see B) on a level of pFWE <0.05. Visualization threshold of puc <0.001. Region (coordinate [x y z], t value, FWE p value): right SII ([32 -16 24], 5.44, 0.033WBC), rACC ([2 40 -6], 4.08, 0.037SVC), right lOFC ([34 34 -16], 3.49, 0.162SVC). (B) Small volume correction (SVC) mask including four ROIs (mm corresponds to radius of sphere). Coordinates to create this mask were PAG [1 -29 -12], Linnman et al., 2012 → 6 mm; rACC [1 34 1], as in supplements of Tinnermann et al., 2017 → 15 mm; right lateral OFC [40 34 -20], Seymour et al., 2005 → 10 mm; left lateral OFC [−34 34–20], Seymour et al., 2005 → 10 mm.
Figure 4—figure supplement 5
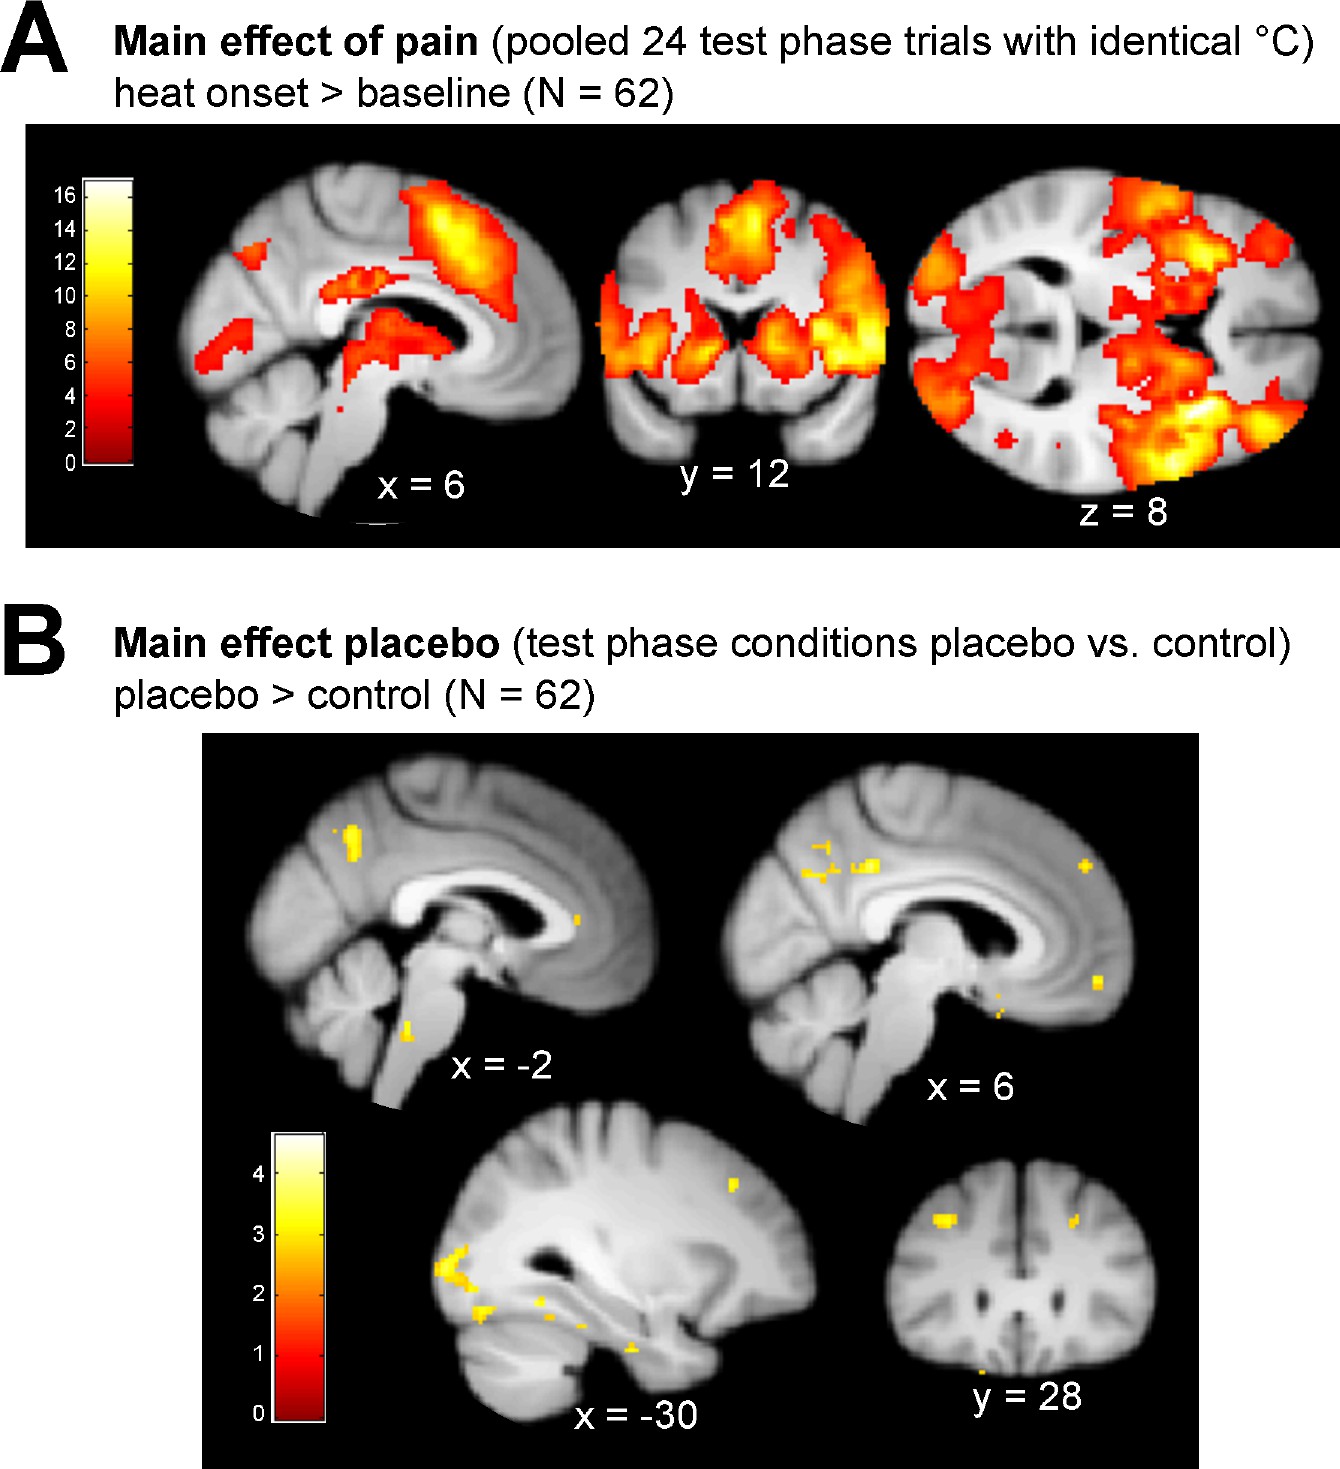
Main pain and placebo effect of the test phase.
(A) Main effect of pain of all 24 pooled test phase heat stimuli (12 per placebo and control condition) reflecting intensities of 50% of individual pain threshold. Activation is expressed in t scores (df = 122) with a visualization threshold of puc <0.001. (B) Main effect of placebo comparing BOLD signal changes between the two conditions of the test phase (no findings in control >placebo). This includes high as well as low prior treatment precision subjects. Activation is expressed in t scores (df = 61) with a visualization of puc <0.005.
Additional files
-
Source data 1
Single trial raw data of VAS ratings including subject ID and group allocation per experimental session (four sessions) for Figures 2 and 3.
- https://doi.org/10.7554/eLife.32930.018
-
Transparent reporting form
- https://doi.org/10.7554/eLife.32930.019
Download links
A two-part list of links to download the article, or parts of the article, in various formats.
Downloads (link to download the article as PDF)
Open citations (links to open the citations from this article in various online reference manager services)
Cite this article (links to download the citations from this article in formats compatible with various reference manager tools)
The periaqueductal gray and Bayesian integration in placebo analgesia
eLife 7:e32930.
https://doi.org/10.7554/eLife.32930


