Electron cryo-microscopy structure of the canonical TRPC4 ion channel
- Max Planck Institute of Molecular Physiology, Germany
- Max Planck Institute of Biophysics, Germany
Figures
Figure 1 with 1 supplement
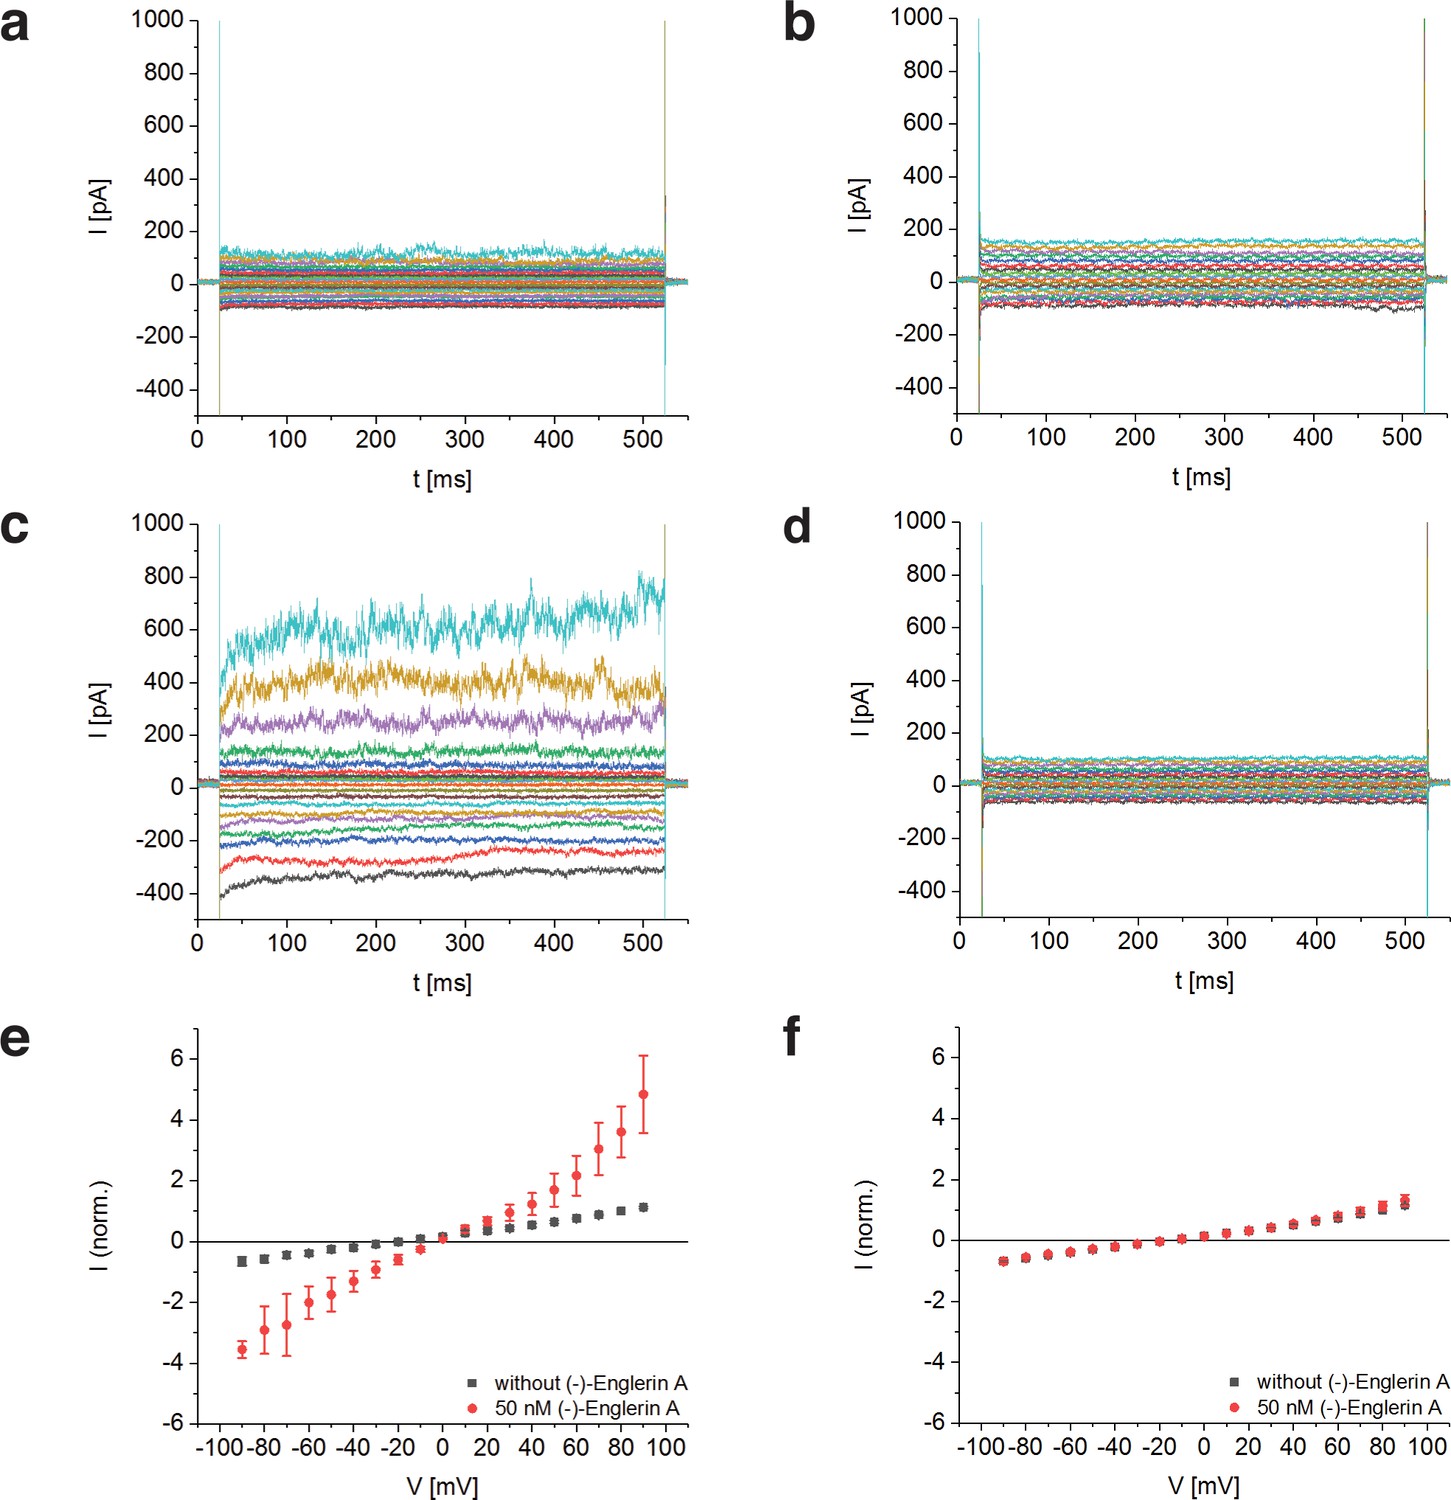
Activation of TRPC4DR by the selective activator (-)-Englerin A.
(a–f) HEK293 cells heterologously expressing TRPC4DR-EGFP (a,c,e) and untransfected control cells (b,d,f) were investigated by voltage-clamp experiments in the whole-cell configuration. The membrane potentials were clamped to values ranging from −90 to +90 mV in the absence (a,b) and in the presence (c,d) of 50 nM (-)-Englerin A. Upon addition of 50 nM of (-)-Englerin A, the current density at −60 mV increased from −3.1 ± 1.9 pA/pF (n = 6) to −16.7 ± 10.7 pA/pF (n = 6). In untransfected control cells, the current density in the absence and presence of the activator was virtually the same with values of −2.1 ± 1.2 pA/pF (V = - 60 mV, n = 5) and −1.8 ± 0.9 pA/pF (V = −60 mV, n = 5) respectively. (e,f) Current-voltage curves in the absence (black squares) and in the presence (red circles) of 50 nM (-)-Englerin A. Currents were normalized to the current value in the absence of (-)-Englerin A at a membrane potential of +80 mV. Note that the measurements in the absence and in the presence of (-)-Englerin A were performed on the same cells. Shown are the normalized mean currents of 6 (e) and 5 (f) different cells. Error bars are ± SEM. The measurements were performed as described in Materials and methods.
Figure 1—figure supplement 1
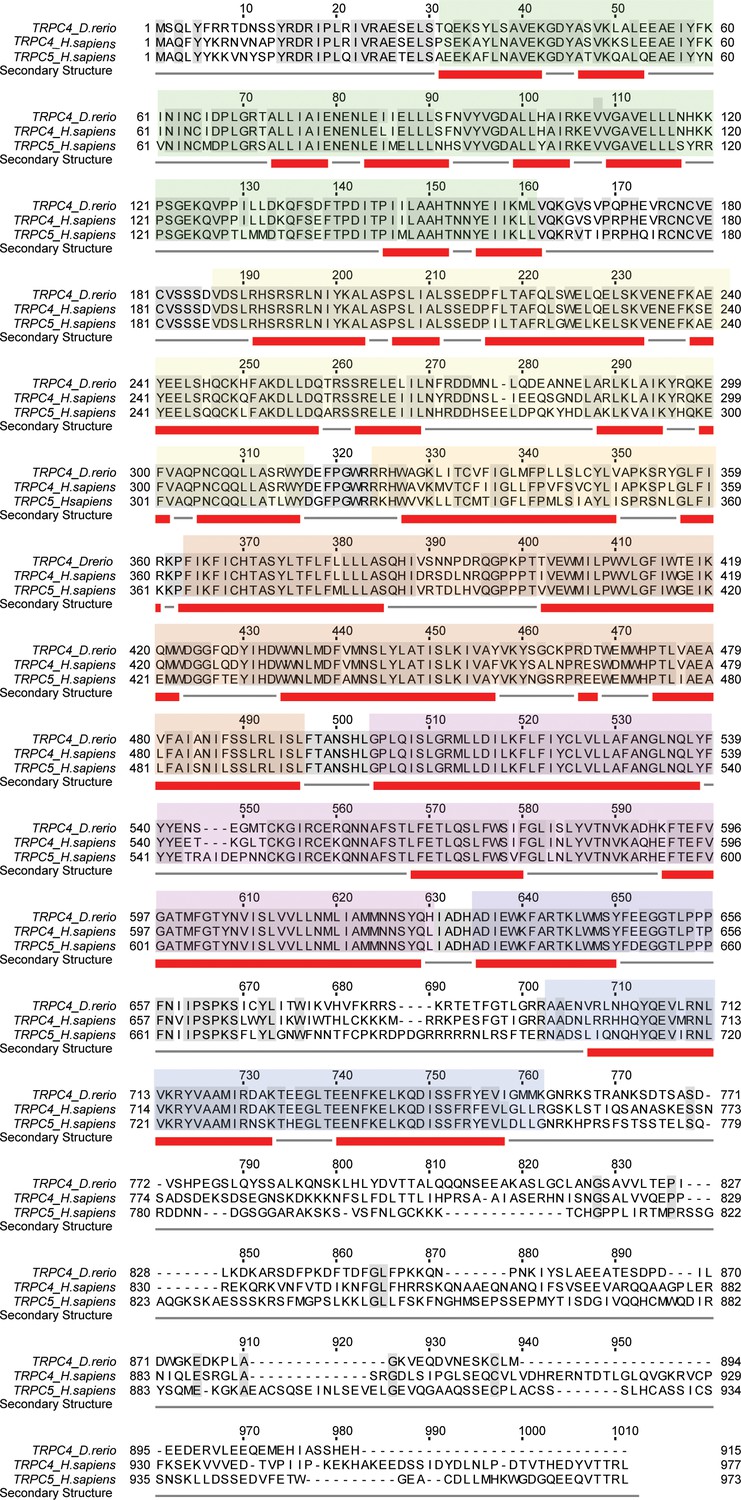
Multiple sequence alignment of TRPC4DR, human TRPC4 and human TRPC5.
The grey-shaded regions highlight conserved residues. Helices are indicated by red bars. Domains are colored according to Figure 2b with high transparency.
Figure 2 with 5 supplements
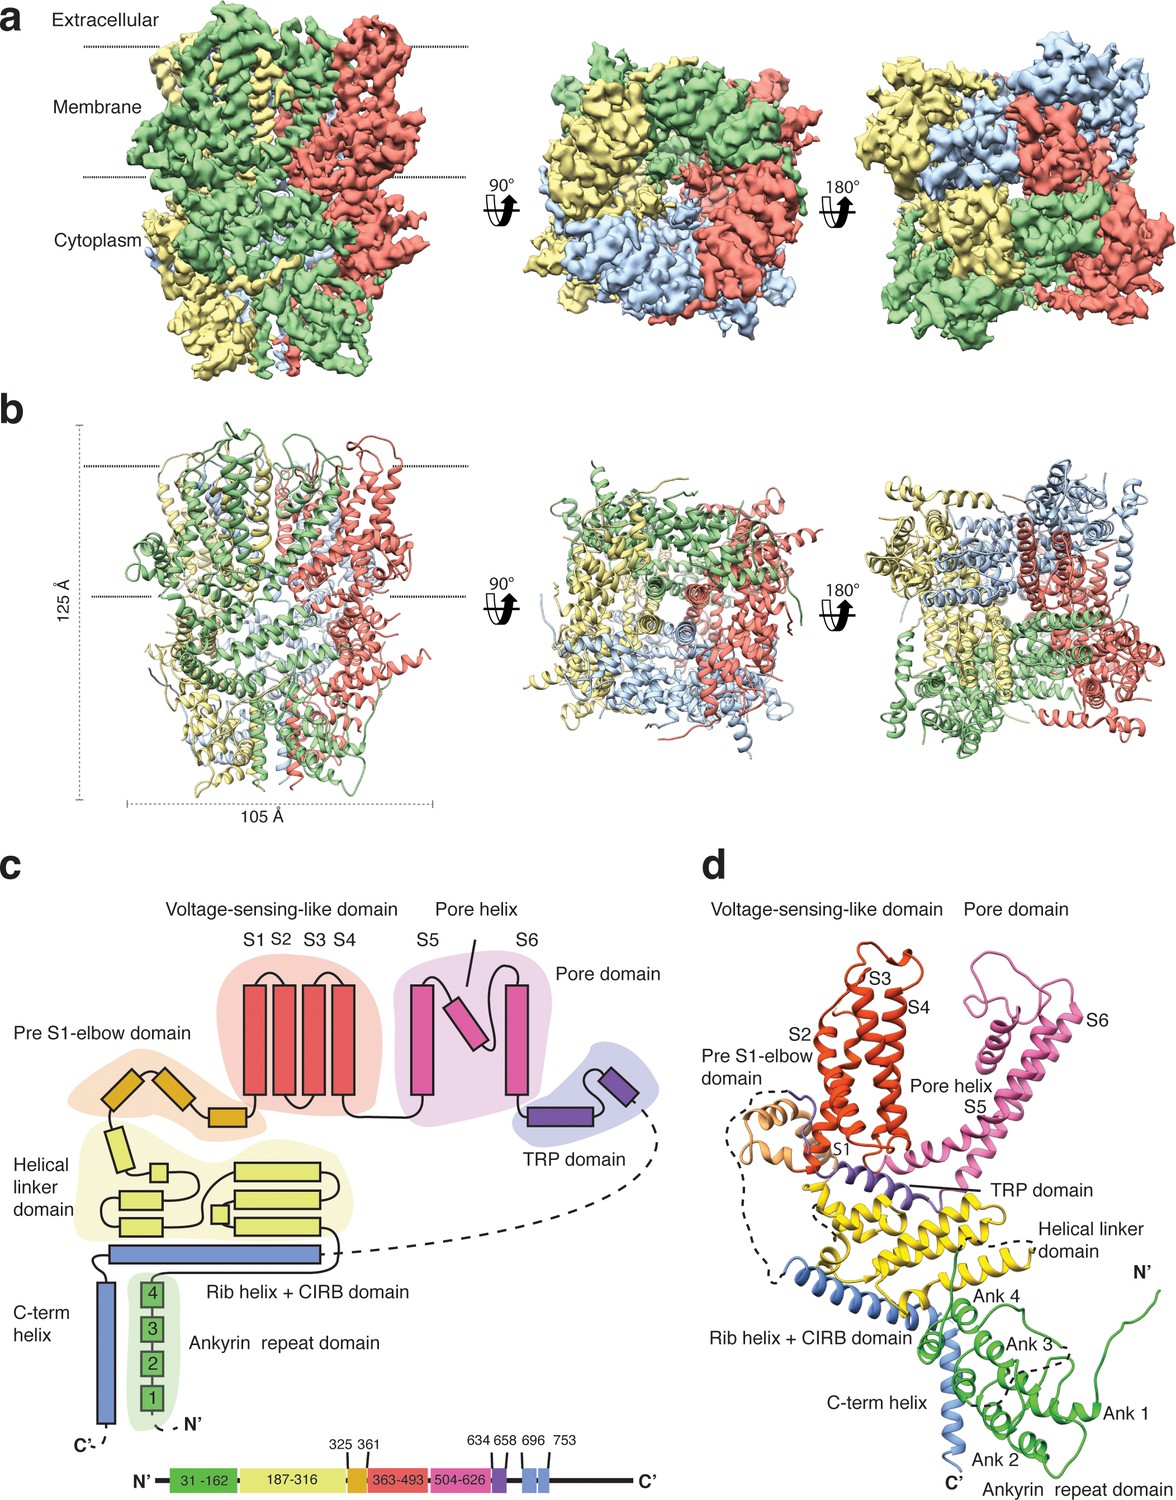
Structure of TRPC4DR.
(a) Cryo-EM density map of TRPC4DR with each protomer colored differently and shown as side, bottom and bottom view. (b) Ribbon representation of the atomic model of TRPC4DR. Colors are the same as in (a). (c) Topology diagram depicting the domain organization of a TRPC4DR protomer. (d) Ribbon representation of a TRPC4DR protomer. Each domain is shown in a different color and labeled accordingly.
Figure 2—figure supplement 1
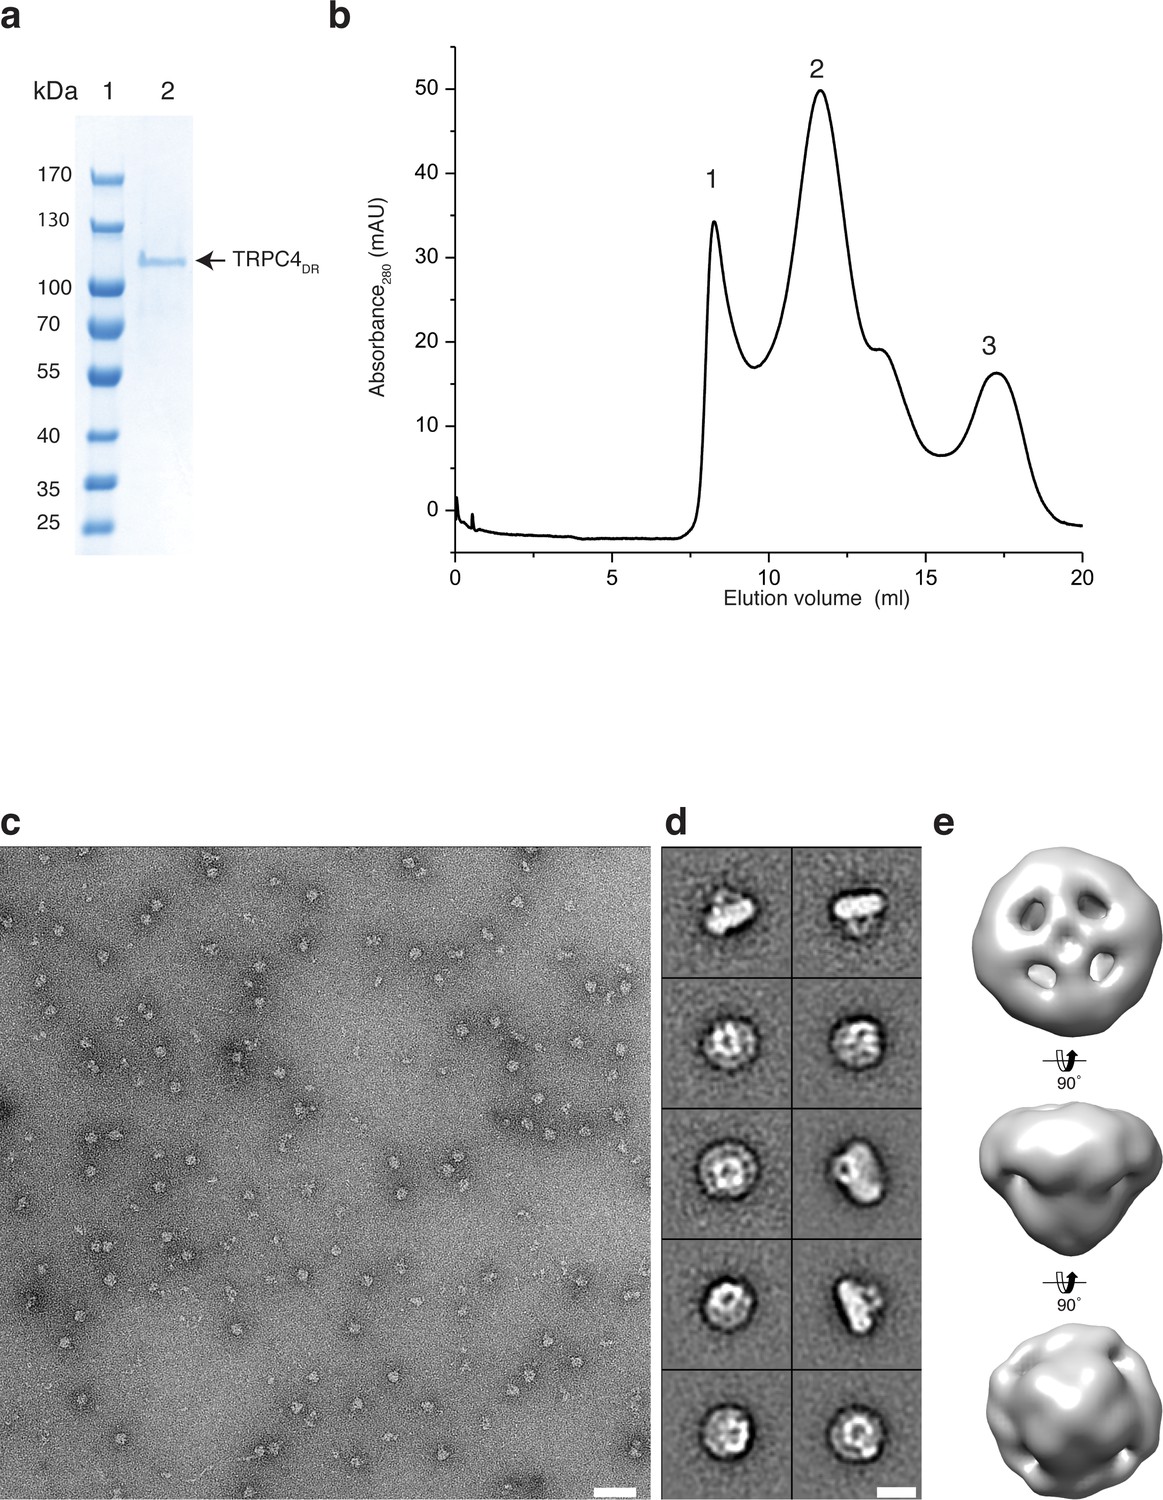
Purification of TRPC4DR and negative stain EM of TRPC4DR in amphipols.
(a) SDS-PAGE of the peak fraction of TRPC4DR in amphipols after size exclusion chromatography. Lane 1: molecular weight marker, lane 2: protein. (b) Size exclusion chromatography profile of TRPC4DR in amphipols. Peak 1, 2 and 3 correspond to the void volume, tetrameric TRPC4DR and cleaved GFP, respectively. (c) Representative negative stain electron micrograph of TRPC4DR. Scale bar, 50 nm, (d) Representative 2-D class averages. Scale bar, 10 nm. (e) 3-D reconstruction of negatively stained TRPC4DR shown in different orientations.
Figure 2—figure supplement 2
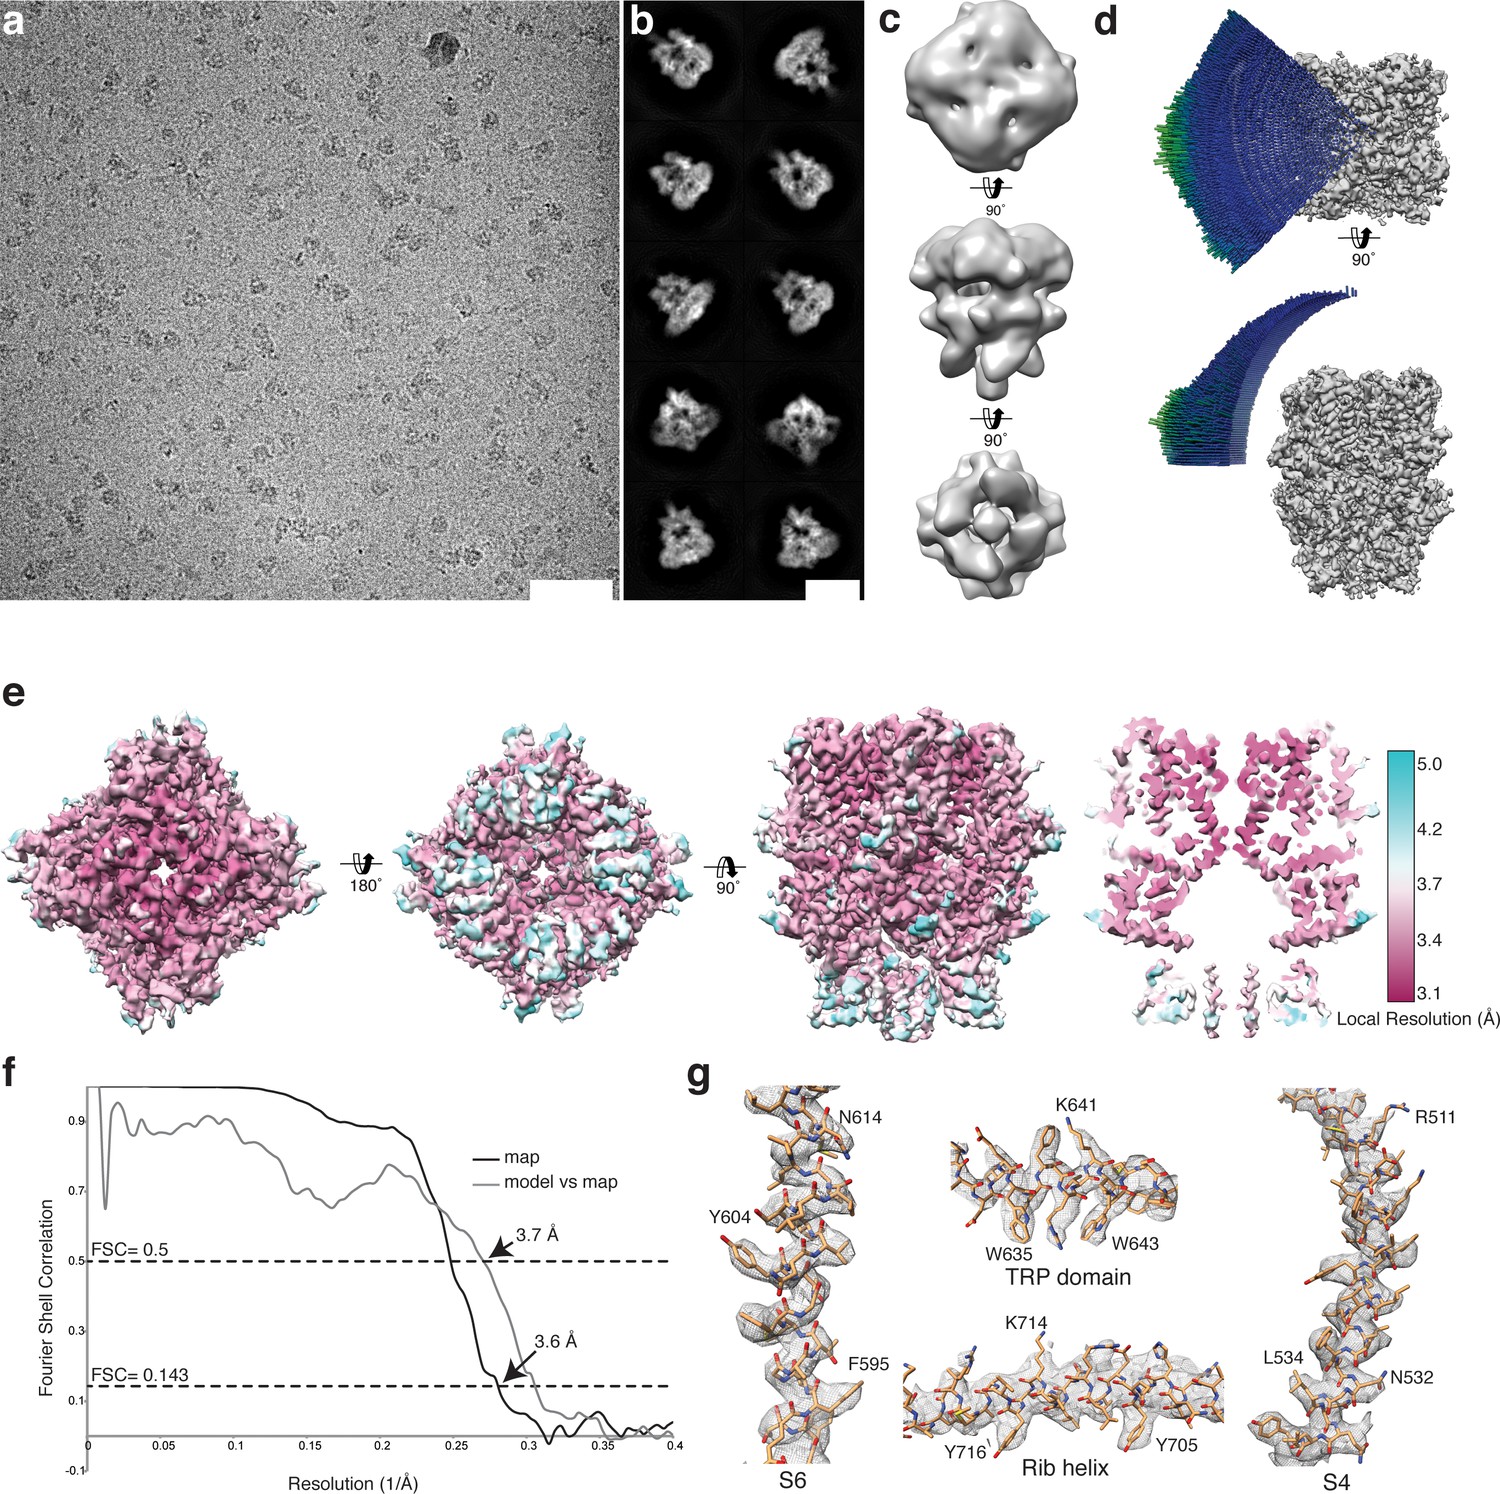
Cryo-EM structure of TRPC4DR.
(a-b) Representative digital micrograph area (a) and selected 2-D class averages (b) of TRPC4DR embedded in vitrified ice. Scale bars, 50 nm (a), and 10 nm (b). (c) The ab initio 3-D reconstruction obtained with RVIPER. (d) Angular distribution of the particles. (e) The cryo-EM density map of TRPC4DR colored according to the local resolution. (f) Fourier Shell Correlation (FSC) curve between maps from two independently refined half data sets (black). The 0.143 criterion indicates an average resolution of 3.6 Å. The grey curve shows the FSC curve between the final map versus the atomic model. (g) Representative regions of the density with fitted atomic model.
Figure 2—figure supplement 3
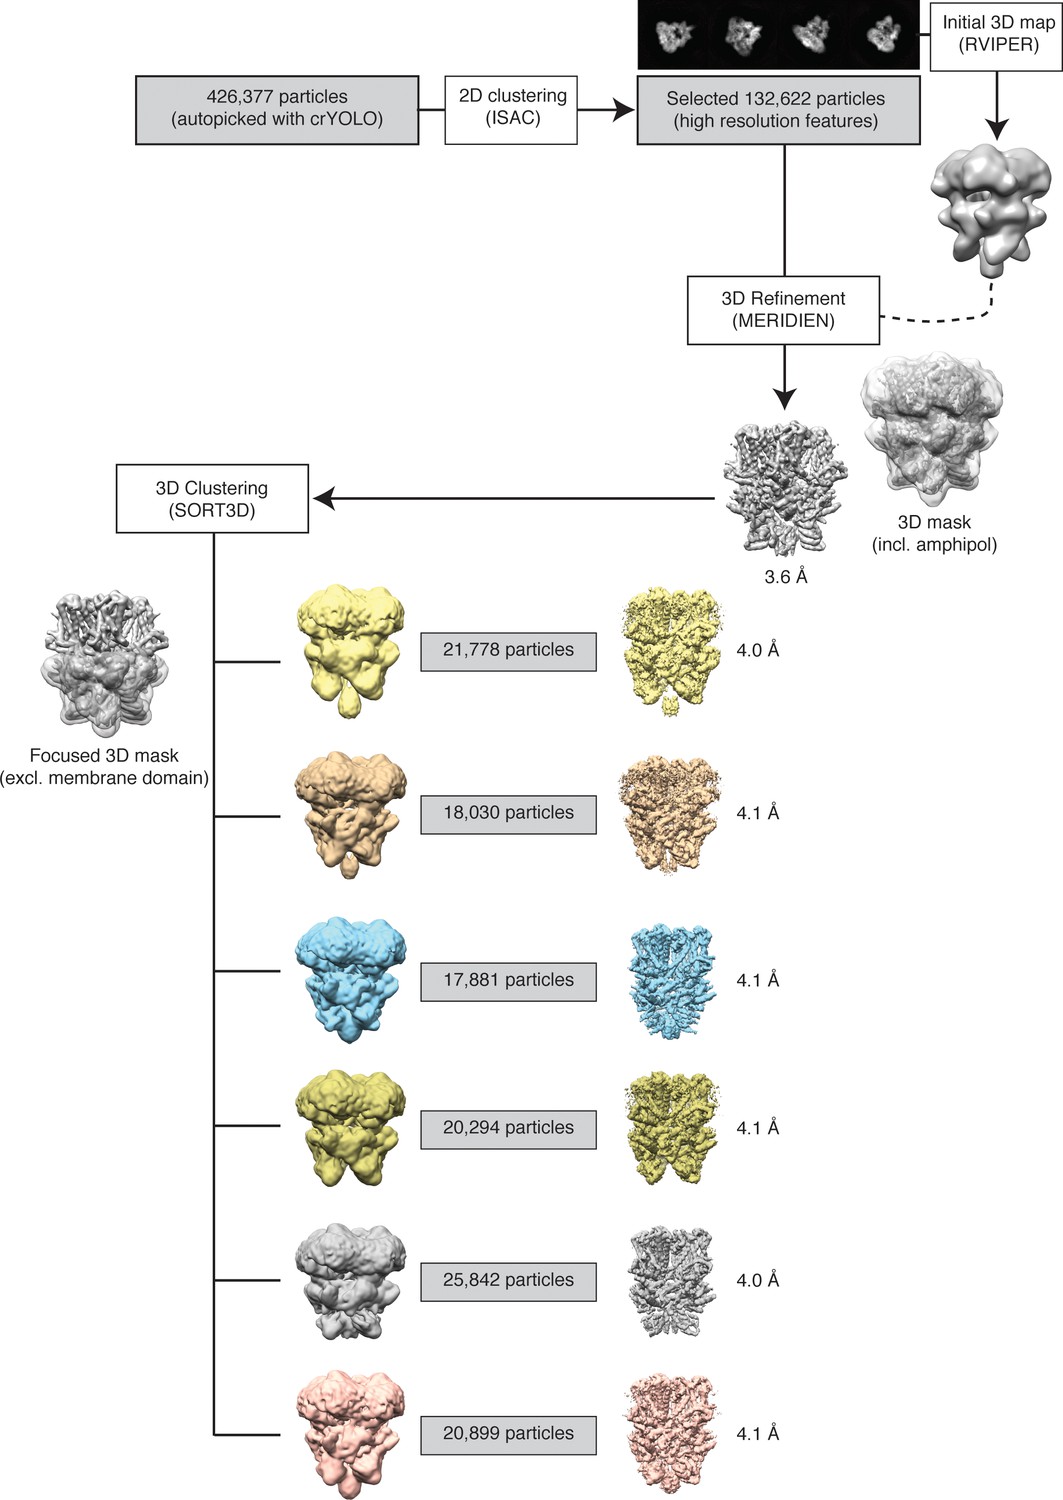
Single particle processing workflow for TRPC4DR structure determination.
https://doi.org/10.7554/eLife.36615.007
Figure 2—figure supplement 4
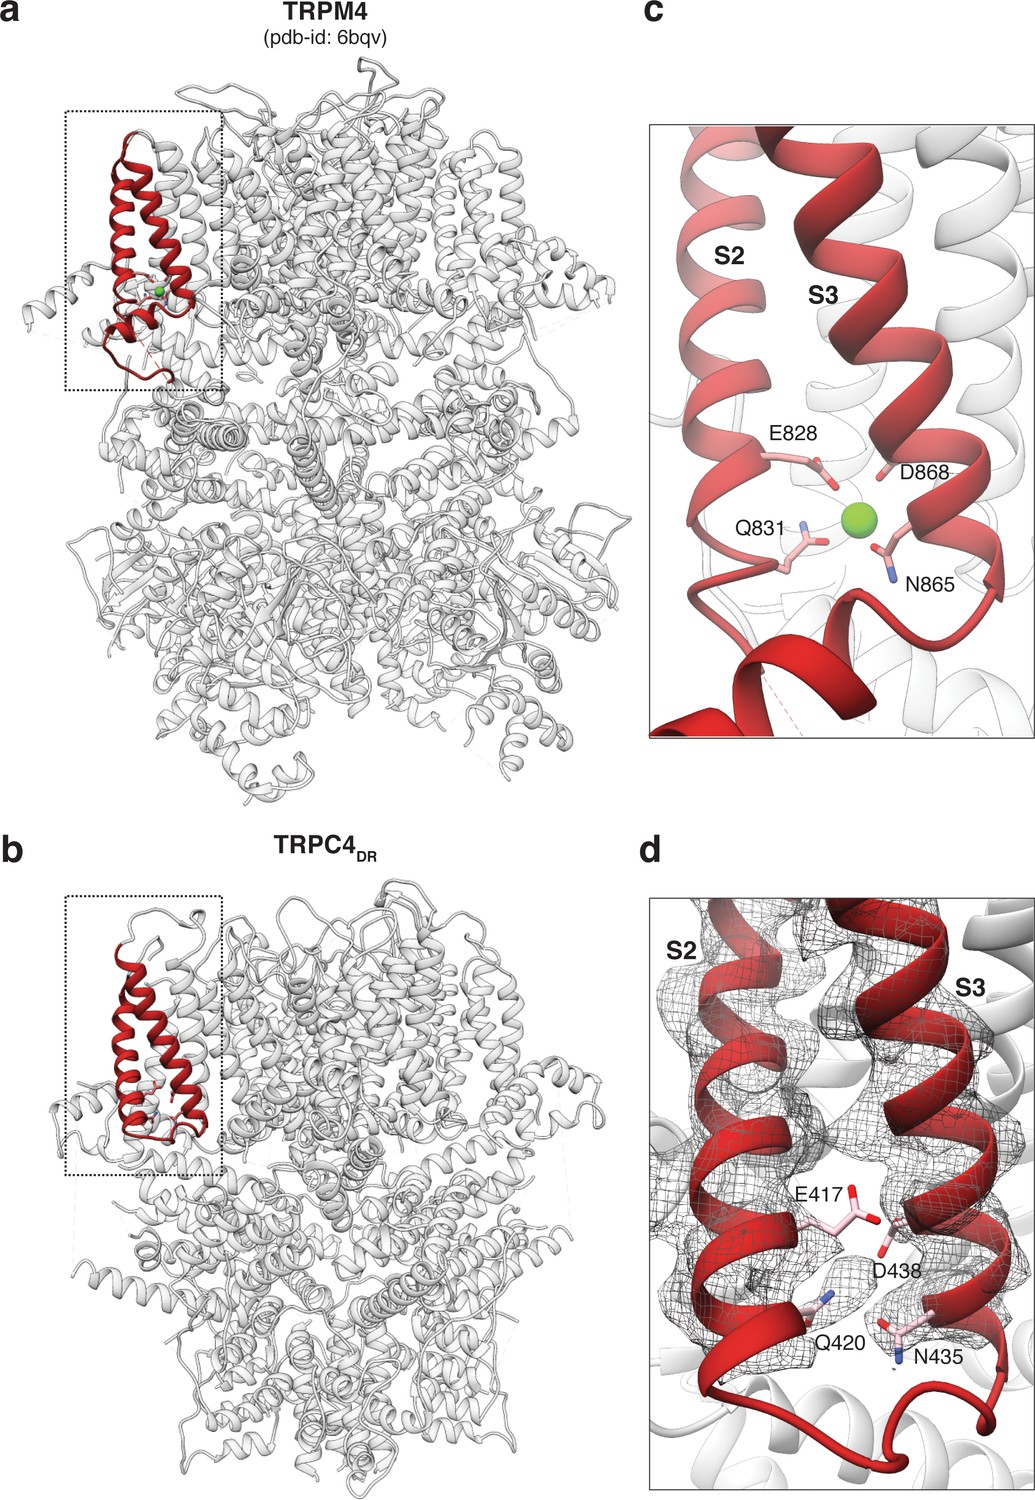
Comparison of the Ca2+ binding site in TRPM4 and TRPC4DR.
(a-b) Side view of TRPM4 (a) and TRPC4DR (b) shown in ribbon representation. Helices involved in Ca2+-binding are shown in red. Zoomed-in view on the Ca2+-binding site in TRPM4 (c) and TRPC4DR (d). Residues involved in Ca2+ binding in TRPM4 and its topologically equivalent residues in TRPC4DR are shown in stick representation. Ca2+ ion is shown as green sphere.
Figure 2—figure supplement 5

LFW motif of the pore region and cysteines involved in disulphide bridges in the TRPC4DR structure.
(a) Extracellular view near the pore axis showing the loops harboring cysteine residues. The loops are shown in ribbon representation with cysteines shown in stick representation. The neighboring glutamate residue is involved in an electrostatic interaction with an arginine. (b) Zoomed-in view on the disulphide bridge region. The chain trace is shown in stick representation including the side chains. The disulphide bridge is indicated by an asterisk. Electron density in (a) and (b) is shown in wired grey mesh. (c) LFW motif region viewed along the pore axis from the extracellular side. Each protomer is colored differently. The LFW motif and interacting residues are shown in stick representation. The interface at the LFW motif is highlighted with a black dotted ellipse. (d) Zoomed-in view on the interface at the LFW motif. The density is shown in wired grey mesh with key residues highlighted.
Figure 3
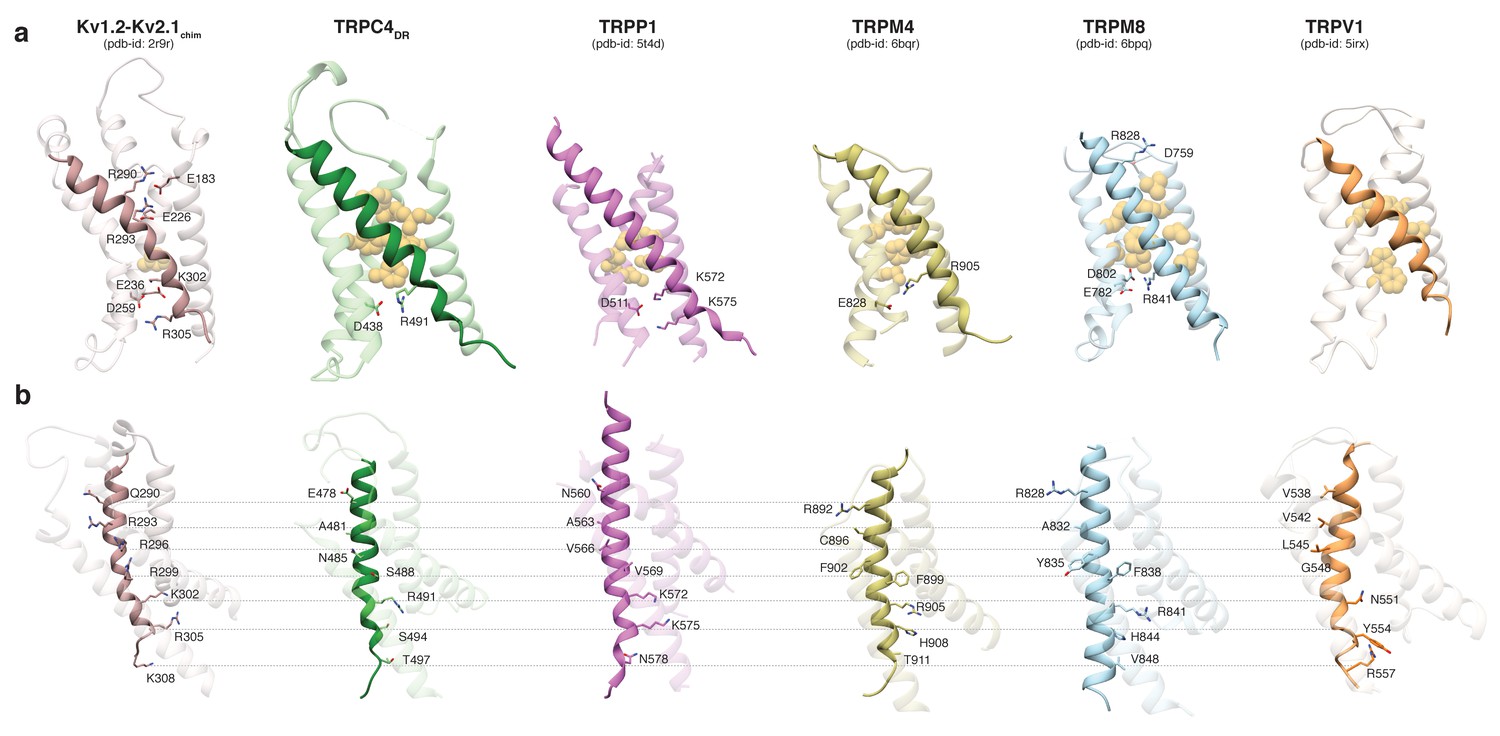
Comparison of the VSL domain of selected TRP family members with the voltage-sensing domain of the chimeric KV1.2-KV2.1 channel.
(a) The voltage-sensing domain of the chimeric KV1.2-KV2.1 channel and the VSL domains of TRPC4DR,TRPP1, TRPM4, TRPM8 and TRPV1 are shown in ribbon representation. The S4 helix in each case is highlighted with dark shaded color. The rest of the domains are shown in light transparent color. The residues which form the hydrophobic patch in the middle of the domain are shown in golden yellow sphere representation with light transparency. The residues involved in ion-pair interactions are shown in stick representation. (b) The structures in (a) are rotated to better view the residues important for voltage sensing in the S4 helix of the chimeric KV1.2-KV2.1 channel and topological equivalent residues of TRP channels are shown in stick representation and labeled.
Figure 4
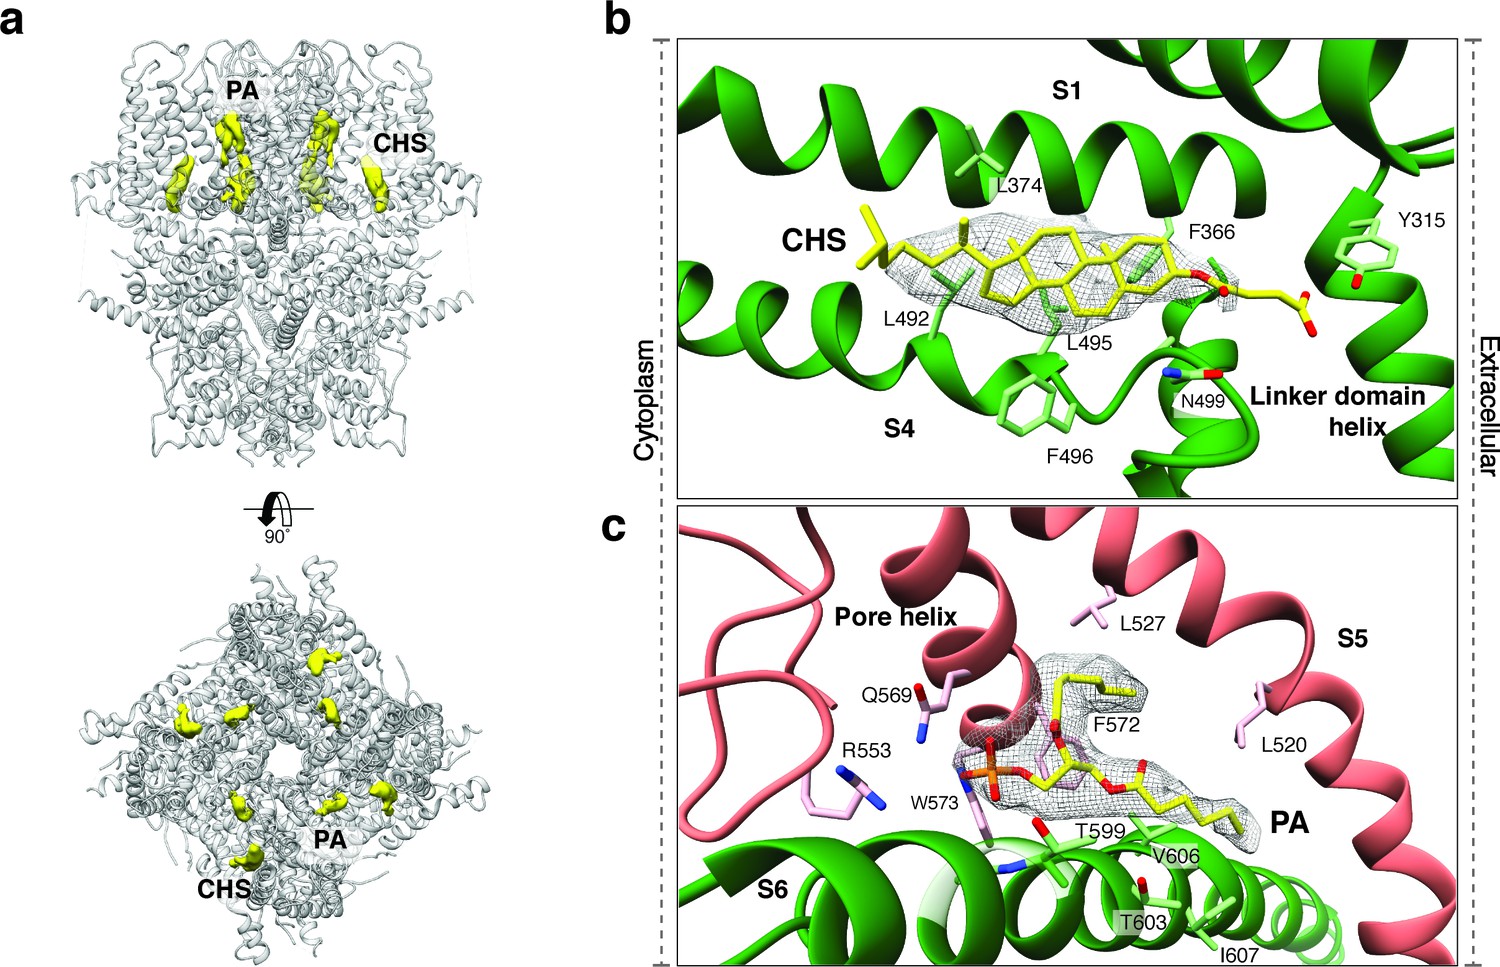
Lipid binding sites in the TRPC4DR structure.
(a) Side and top view of the TRPC4DR structure with lipid densities highlighted in yellow against the model shown in ribbon representation. (b–c) Zoomed-in view on the cholesteryl hemisuccinate (CHS) and phosphatidic acid lipid (PA) binding sites, respectively. CHS and PA molecules are shown in yellow stick representation.
Figure 5
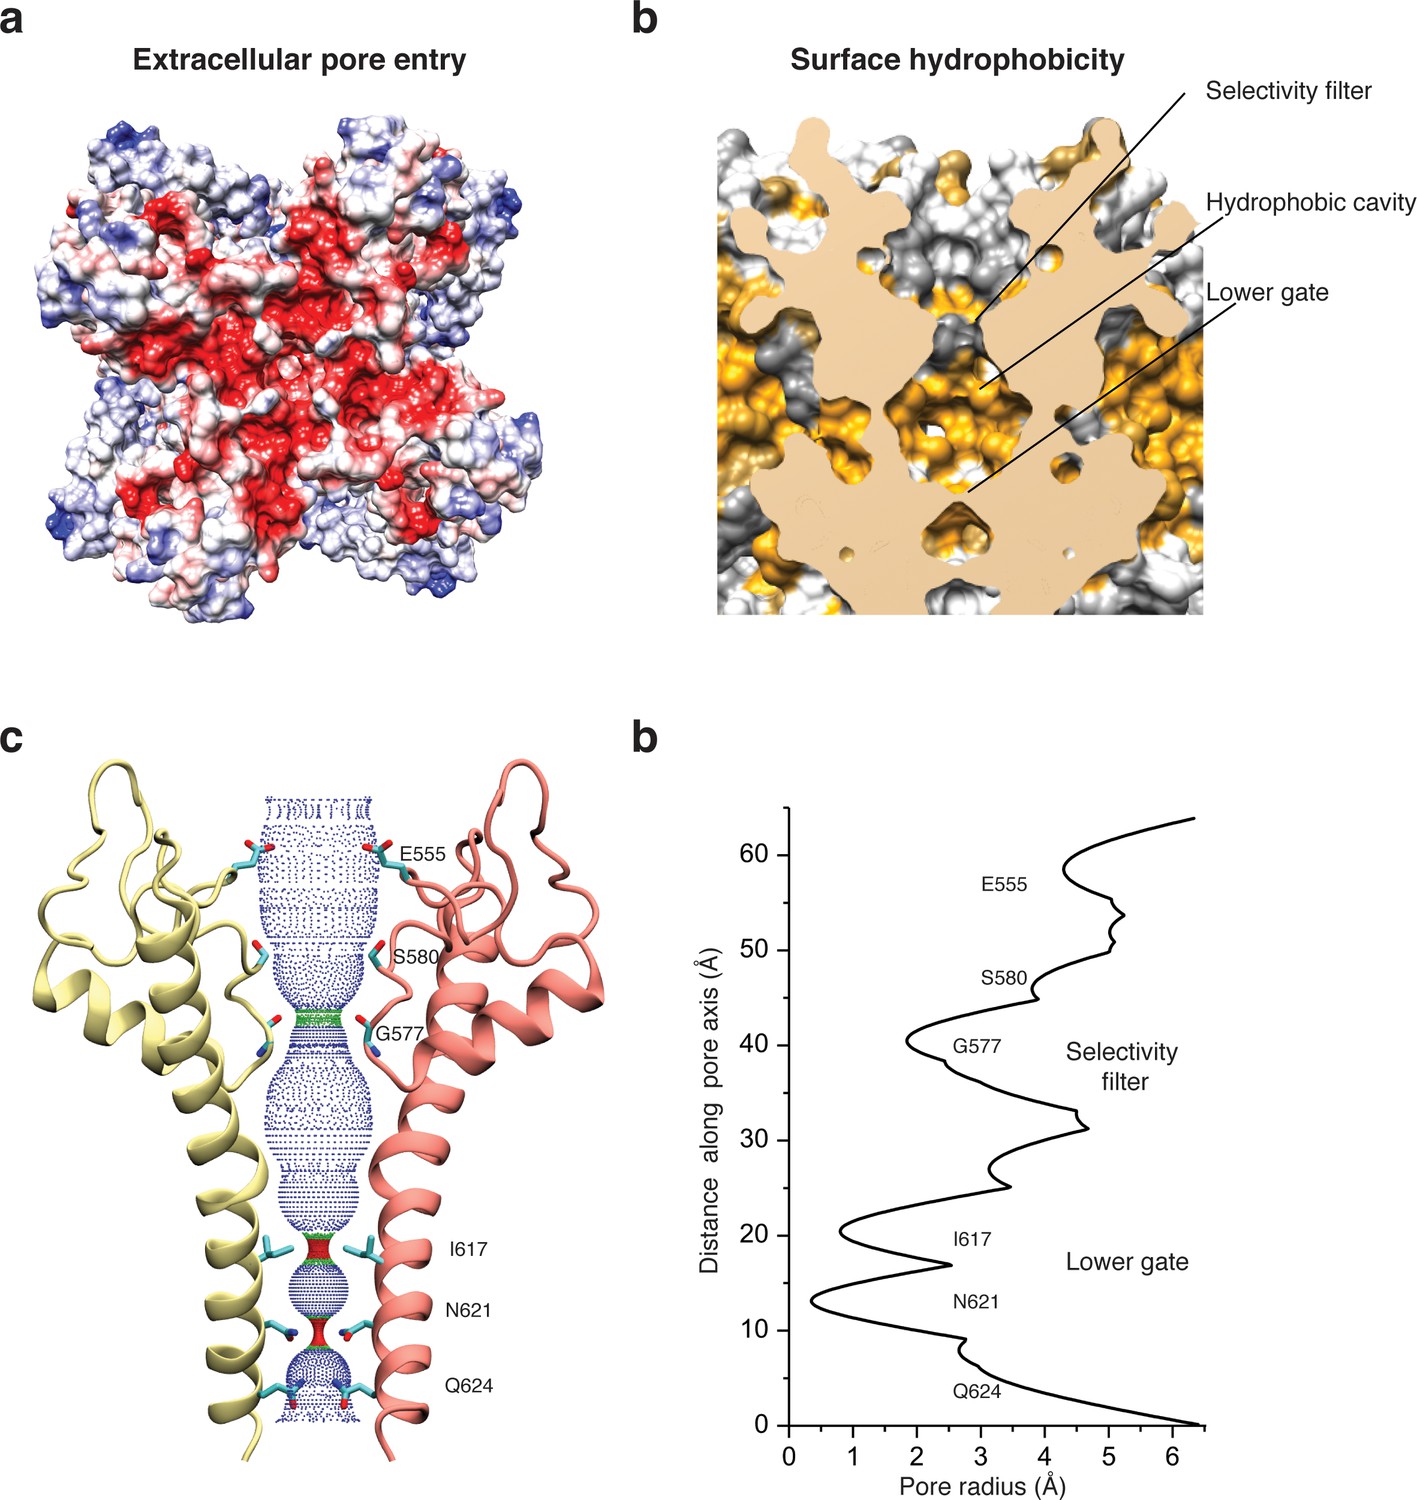
Architecture of the pore domain.
(a) Surface electrostatic Coulomb potential at the extracellular mouth of TRPC4DR. (b) Hydrophobic surface of the pore shown in vertical cross section. Hydrophobic patches are colored orange. (c) Ion conduction pore of TRPC4DR shown with diagonally facing protomers shown in ribbon representation. Critical residues important for gating and selection are shown in stick representation. (d) Pore radius determined along the pore axis using HOLE (Smart et al., 1996).
Figure 6

Interaction of the TRP domain with a conserved glycine in the S4-S5 linker.
(a) Ribbon overview indicating the interaction site between the TRP domain and the S4-S5 linker. Key helices are shown in different colors. The rest of the protein is shown in light grey. (b) Zoomed-in view on the interaction site with key residues labeled. The chain trace is shown in stick representation. (c) Structure-based sequence alignment of TRP family members. The conserved glycine in the M2 motif is highlighted by a red dotted box.
Figure 7 with 1 supplement
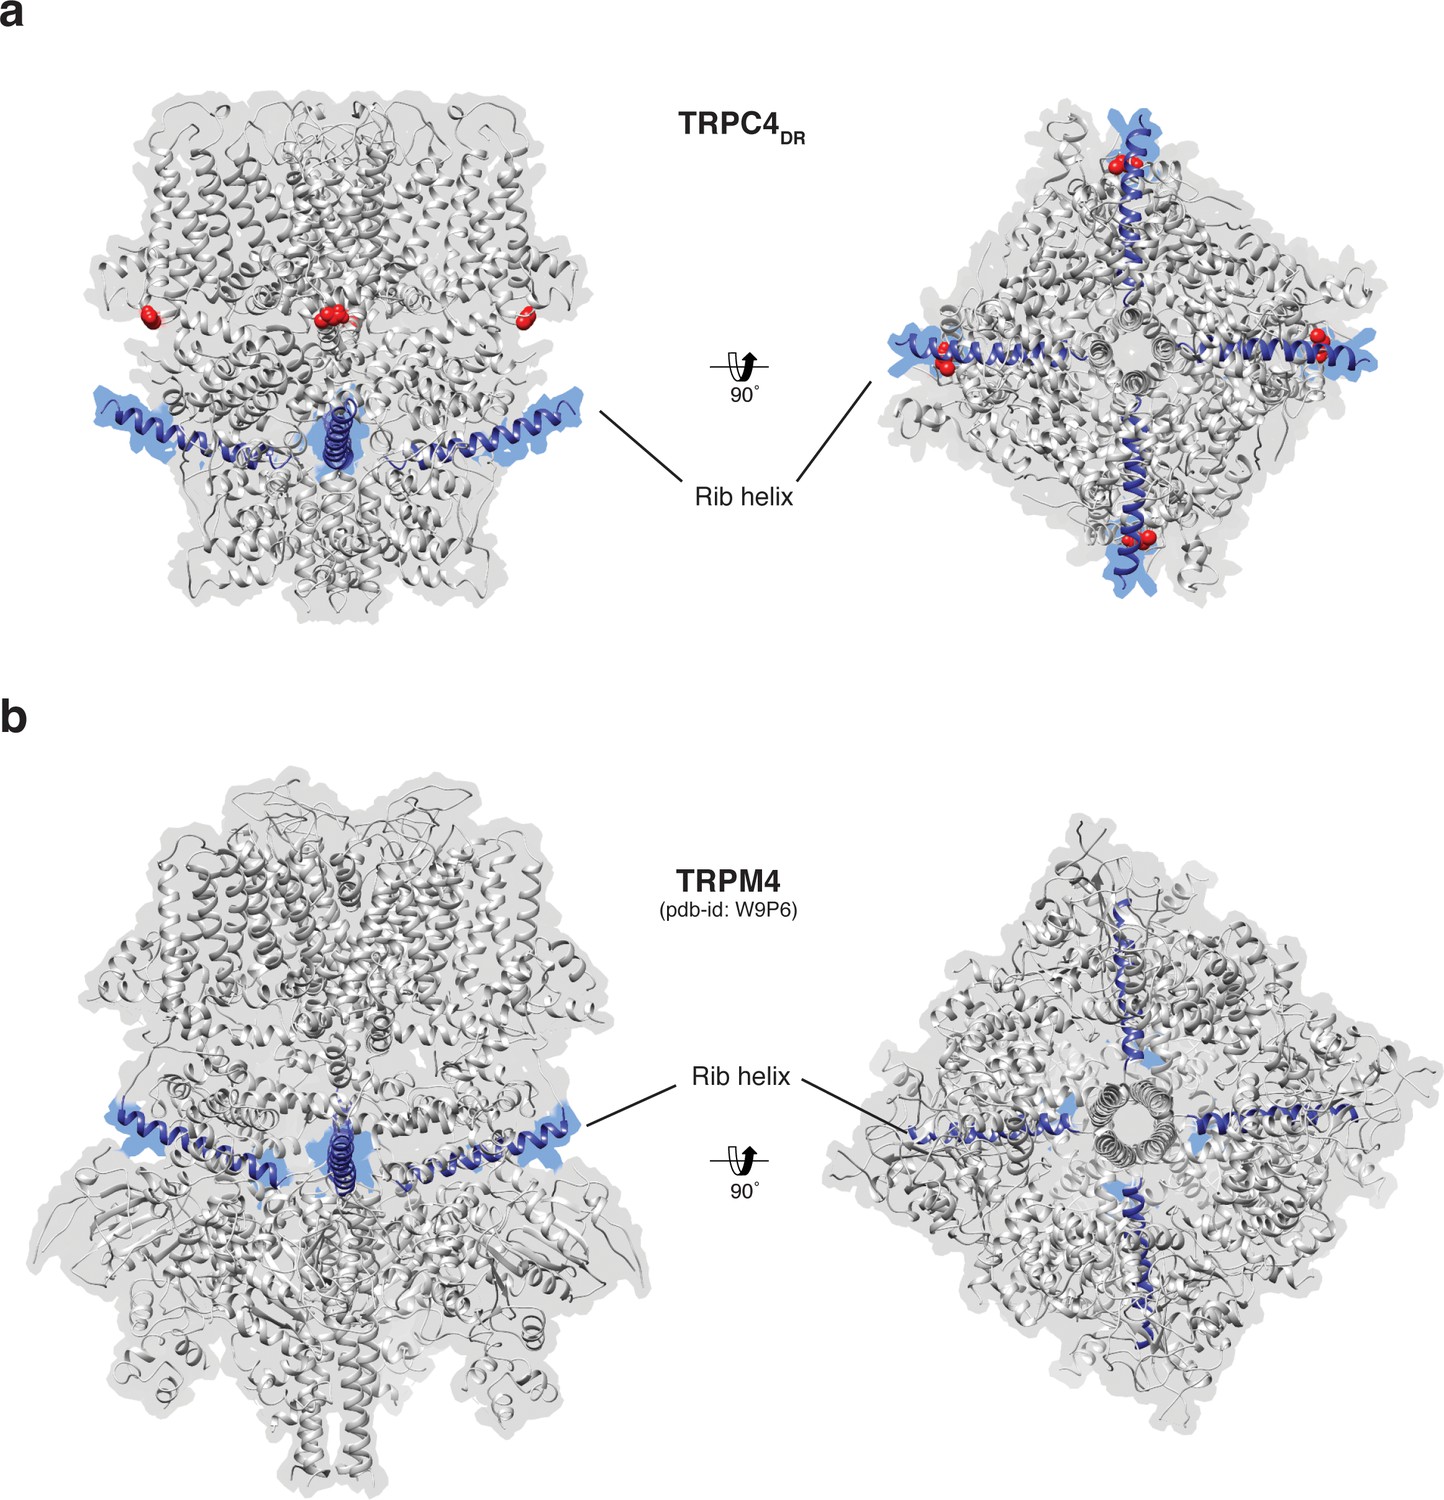
Position of the Rib helix in TRPC4DR and TRPM4.
(a-b) Side and bottom view of the atomic models of TRPC4DR (a), and TRPM4 (b). The Rib helix is highlighted in blue color and the density of the map is shown in the background with high transparency. E648 in TRPC4DR is shown in sphere representation and colored red.
Figure 7—figure supplement 1
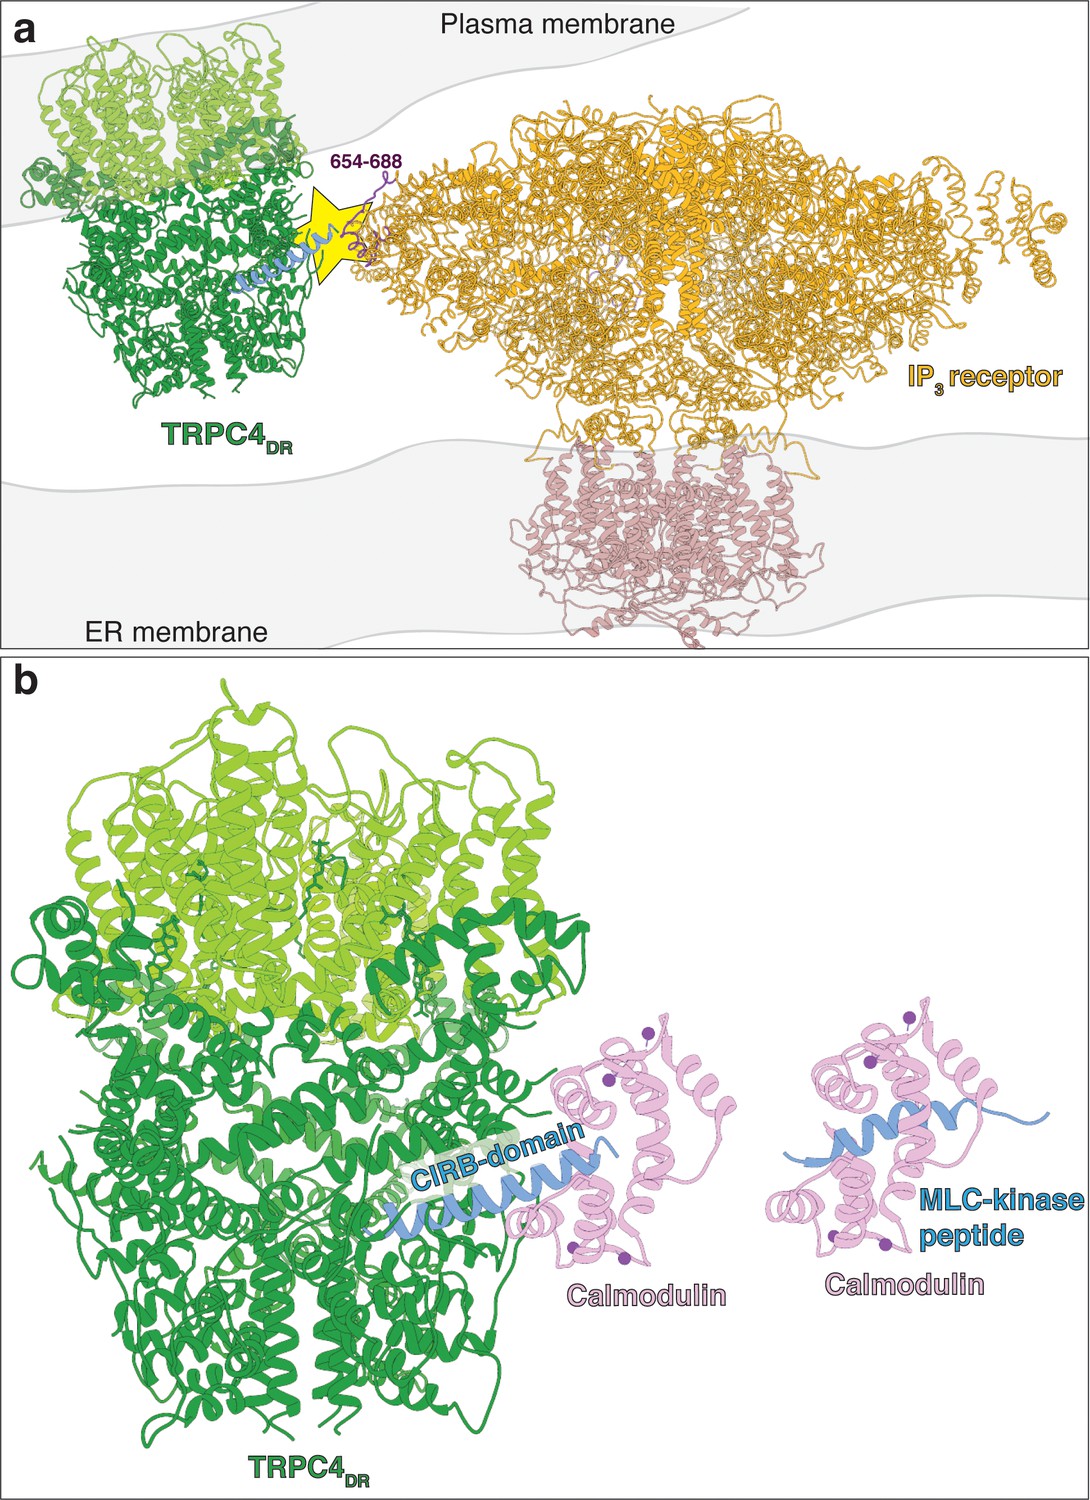
Predicted model of TRPC4DR interaction with IP3 receptors and calmodulin.
(a) Possible interaction of an IP3 receptor with TRPC4DR. The putative site of interaction (Boulay et al., 1999; Tang et al., 2001) is highlighted with a yellow star. The CIRB domain of TRPC4DR is shown in blue. The predicted interacting region of the IP3 receptor is highlighted in dark color. (b) Interaction of calmodulin with the CIRB domain of TRPC4DR. Calmodulin is shown in pink. Calcium is shown as spheres. Calmodulin has been fitted to the structure of TRPC4DR in analogy to the MLC-kinase peptide bound to calmodulin in the crystal structure (PDB-ID: 2LV6).
Figure 8
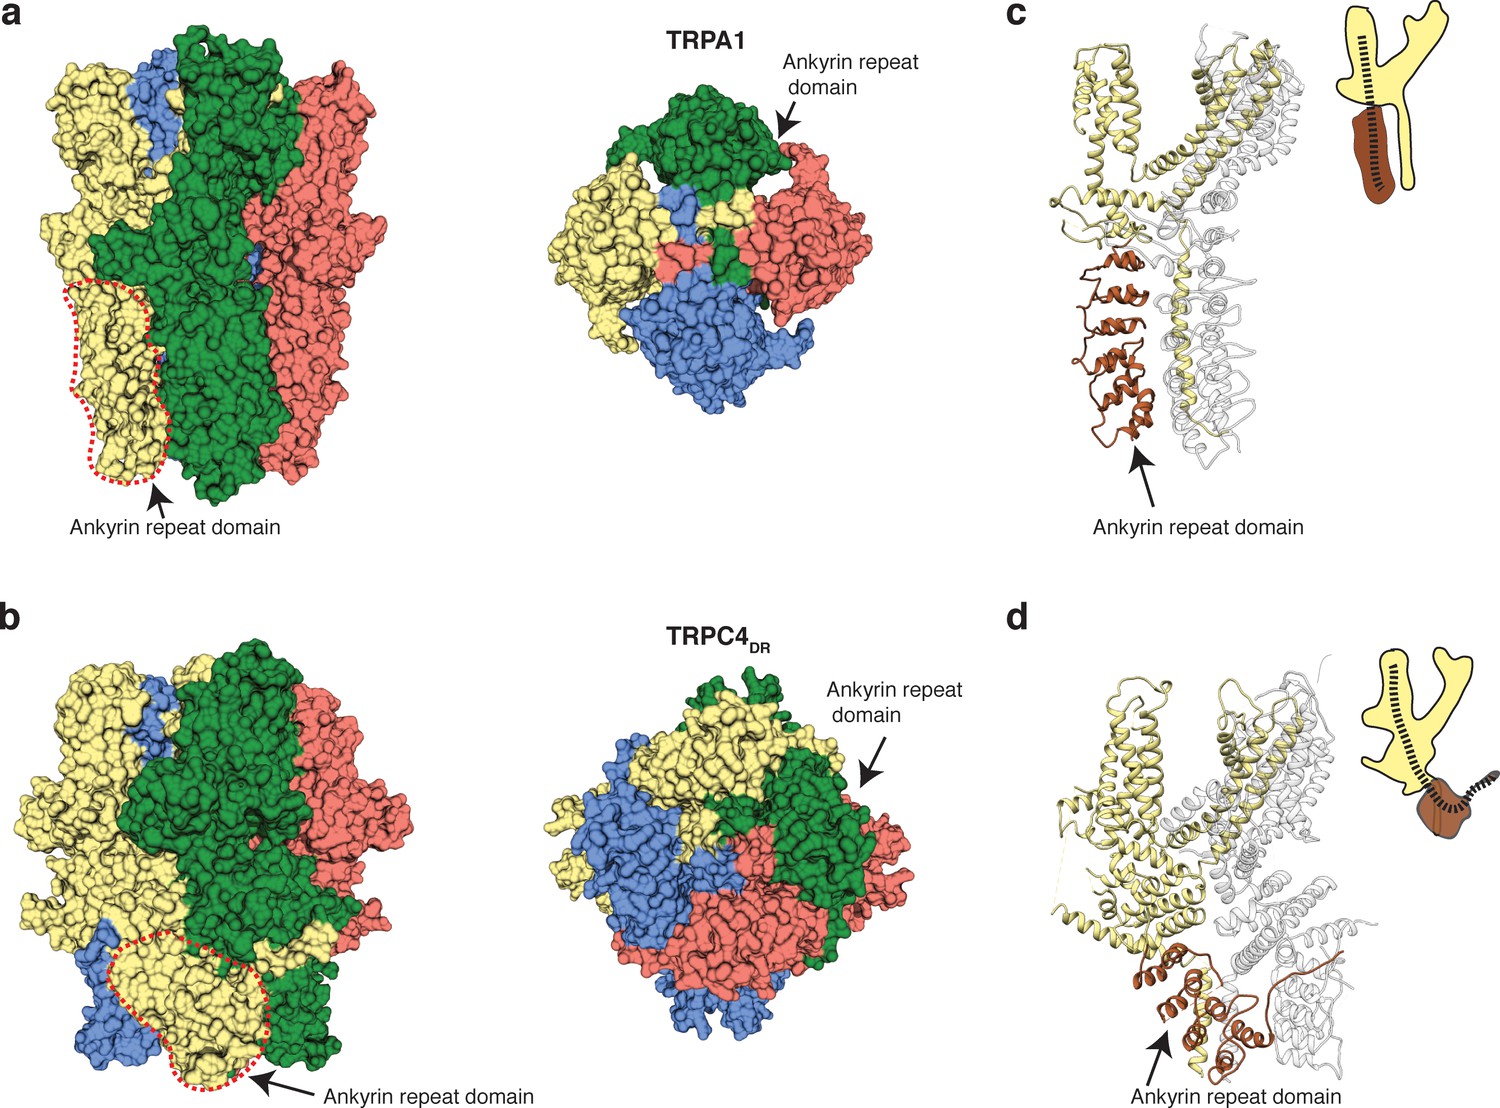
Comparison of the ankyrin domain arrangement of TRPC4DR and TRPA1.
(a-b) Side and bottom view of the structures of TRPA1 (PDB-ID: 3J9P) (a) and TRPC4DR (b) in surface representation. Each subunit is colored with unique colors. (c–d) Ribbon and cartoon representation of TRPA1 (c) and TRPC4DR (d) showing two protomers in side view. The ankyrin repeats of one protomer are highlighted in brown.
Figure 9
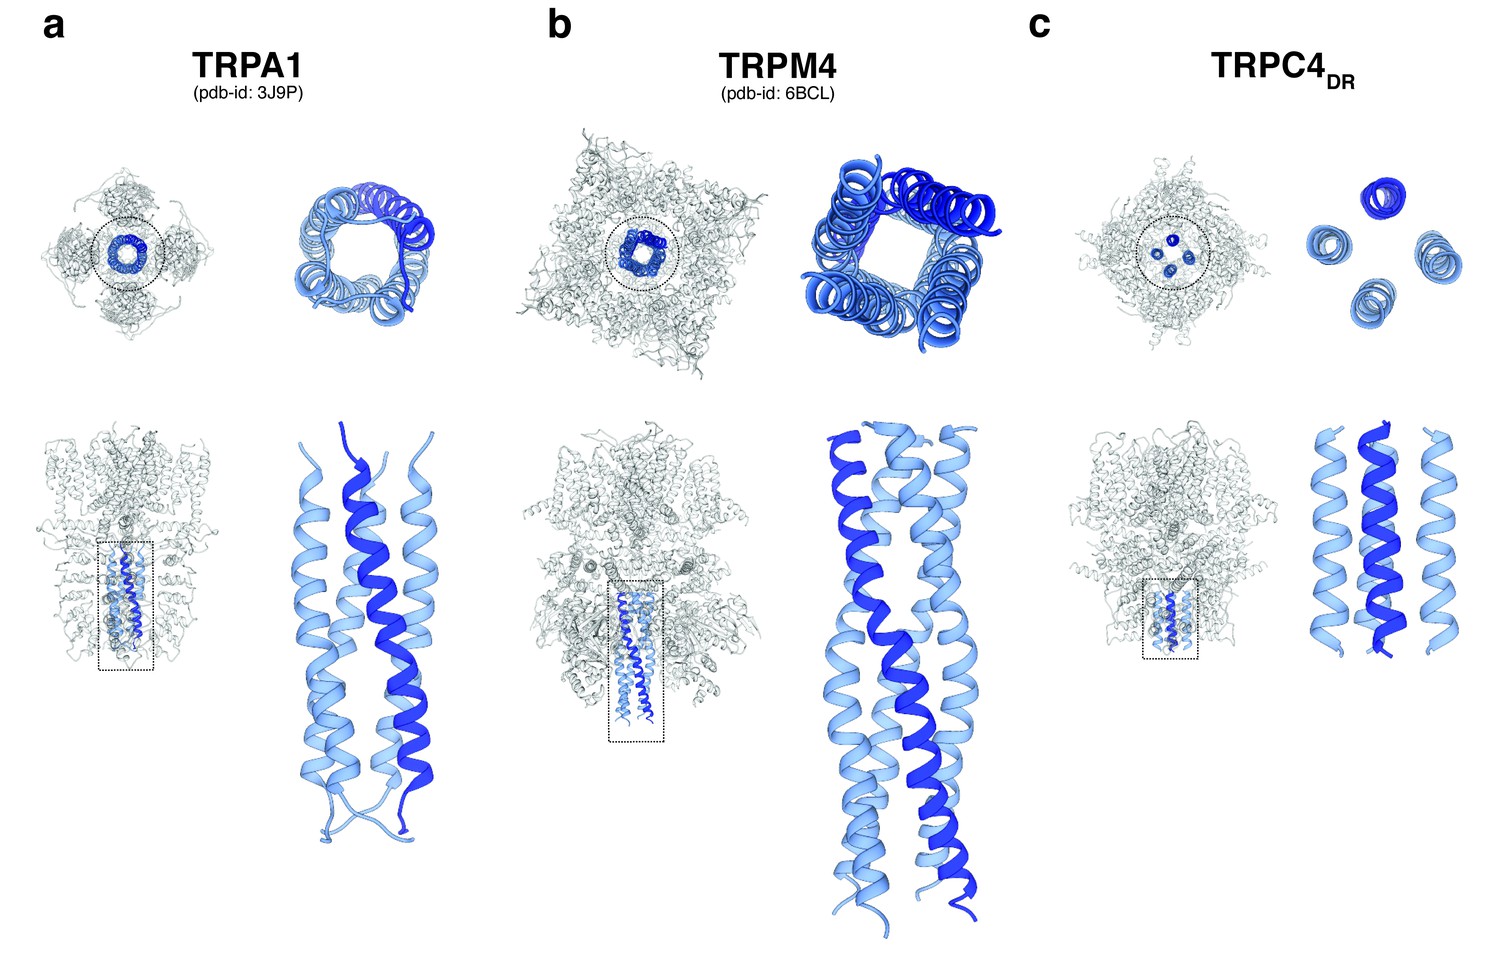
Comparison of the C-terminal helix architecture in TRPA1, TRPM4 and TRPC4DR.
(a-c) Each panel shows the complete tetramer in bottom and side view on the left and the zoomed-in view of the C-terminal helix alone in bottom and side view on the right. The C-terminal helix is shown in blue with one helix highlighted in shaded dark blue.
Videos
Video 1
Overview of the TRPC4DR structure
https://doi.org/10.7554/eLife.36615.011
Video 2
Morph between conformational states of TRPC4DR
https://doi.org/10.7554/eLife.36615.012Tables
Table 1
EM data collection and refinement statistics of TRPC4DR
https://doi.org/10.7554/eLife.36615.010| Data collection | Data set 1 [Data set 2] |
|---|---|
| Microscope | Titan Krios (Cs corrected, XFEG) |
| Voltage (kV) | 300 |
| Camera | K2 summit (Gatan) |
| Pixel size (Å) | 1.09 [1.09] |
| Number of frames | 60 [40] |
| Total electron dose (e-/Å2) | 69 [74] |
| Number of particles | 132,622 |
| Estimated defocus range | 0.844–2.931 |
| Atomic model composition | |
| Non-hydrogen atoms | 21,412 |
| Protein atoms | 21,192 |
| Ligand atoms | 236 |
| Refinement (Phenix) | |
| RMSD bond | 0.01 |
| RMSD angle | 1.11 |
| Model to map fit, CC mask | 0.80 |
| Resolution (FSC@0.143, Å) | 3.6 |
| Map sharpening B-factor (Å2) | −130.0 |
| Validation | |
| Clashscore | 3.53 |
| Poor rotamers (%) | 0.17 |
| Favoured rotamers (%) | 94.48 |
| Ramachandran outliers (%) | 0.0 |
| Ramachandran favoured (%) | 92.38 |
| Molprobity score | 1.62 |
| EMRinger score | 2.42 |
Table 2
Comparison of selectivity filters among TRP family members
https://doi.org/10.7554/eLife.36615.016| TRP family name | Residue | Van der waals diameter (Å) | Selectivity* PCa: PNa | Reference |
|---|---|---|---|---|
| TRPC4DR | G577 | 3.7 | 7 | |
| TRPV1 | G643 | 1.5 | 3.8–9.6 | (Liao et al., 2013) |
| TRPV2 | Gly604 (M606) | 1.9 (1.35) | 3 | (Zubcevic et al., 2016) |
| TRPML3 | G457 (D459) | 2.0 (4.2) | Highly selective for Ca2+ | (Zhou et al., 2017) |
| TRPML1 | G470 (D471) | 1.4 (2.1) | N.D. | (Schmiege et al., 2017) |
| TRPN (NOMPC) | G1506 | 3.8 | N.D. | (Jin et al., 2017) |
| TRPA1 | D915 | 3.2 | 0.8 | (Paulsen et al., 2015) |
| TRPV5 | D542 | 2.6 | >100 | (Hughes et al., 2018) |
| TRPV6 | D541 | 0.9 | >100 | (Saotome et al., 2016) |
| TRPM4 | G972 | 4.3 | PNa: PCa > 100 | (Guo et al., 2017a) |
| TRPP1 (PKD2) | Leu641 (Gly642) | 1.7 (3.6) | PNa: PCa > 100 | (Shen et al., 2016a) |
Key resources table
| Reagent type (species) or resource | Designation | Source or reference | Identifiers | Additional information |
|---|---|---|---|---|
| Gene (Danio rerio) | TRPC4DR | N/A | NCBI Reference sequence: NM_001289881 | Genes ordered from GenScript |
| Cell line (HEK293 GnTI-) | HEK293 GnTI- | ATCC | CRL-3022 | |
| Cell line (HEK293) | HEK293 | ATCC | CRL-1573 | |
| Cell line (Sf9) | Sf9 | N/A | Cat.No.600100 | Purchased from Oxford Expression Technologies Ltd (UK) |
| Recombinant DNA reagent | pcDNA3.1+TRPC4DR(See Materials and methods section for details) | This paper | Cloned by GenScript in the customized pcDNA3.1 vector harbouring Nterm-HIS8tag-TEV- and Cterm-HRV3C-eGFP | |
| Recombinant DNA reagent | pEG BacMam | Eric Gouaux Lab PMID: 25299155 | ||
| Recombinant DNA reagent | pEG BacMam +TRPC4DR(See Materials and methods section for details) | This Paper | Subcloned the pcDNA construct harbouring His-TEV- TRPC4- HRV3C -eGFP into the pEG BacMam with the introduction of StrepII tag. | |
| Chemical compound, drug | (-)Englerin A | N/A | Obtained from Lead Discovery Center GmbH, Dortmund Germany | |
| Software, algorithm | SPHIRE software package | Moriya et al., 2017 PMID: 28570515 | ||
| Software, algorithm | CrYOLO | N/A | Wagner et al., unpublished. manuscript in preparation | |
| Software, algorithm | RosettaCM | Wang et al. (2015) PMID: 27572730 | ||
| Software, algorithm | Rosetta | Wang et al. (2015) PMID: 27572730 | ||
| Software, algorithm | rosettaES | Frenz et al. (2017) PMID: 28628127 | ||
| Software, algorithm | Chimera | Pettersen et al. (2004) PMID:15264254 |
Additional files
-
Transparent reporting form
- https://doi.org/10.7554/eLife.36615.022
Download links
A two-part list of links to download the article, or parts of the article, in various formats.
Downloads (link to download the article as PDF)
Open citations (links to open the citations from this article in various online reference manager services)
Cite this article (links to download the citations from this article in formats compatible with various reference manager tools)
Electron cryo-microscopy structure of the canonical TRPC4 ion channel
eLife 7:e36615.
https://doi.org/10.7554/eLife.36615


