The homophilic receptor PTPRK selectively dephosphorylates multiple junctional regulators to promote cell–cell adhesion
- University of Cambridge, United Kingdom
- Genentech, United States
Figures
Figure 1 with 1 supplement
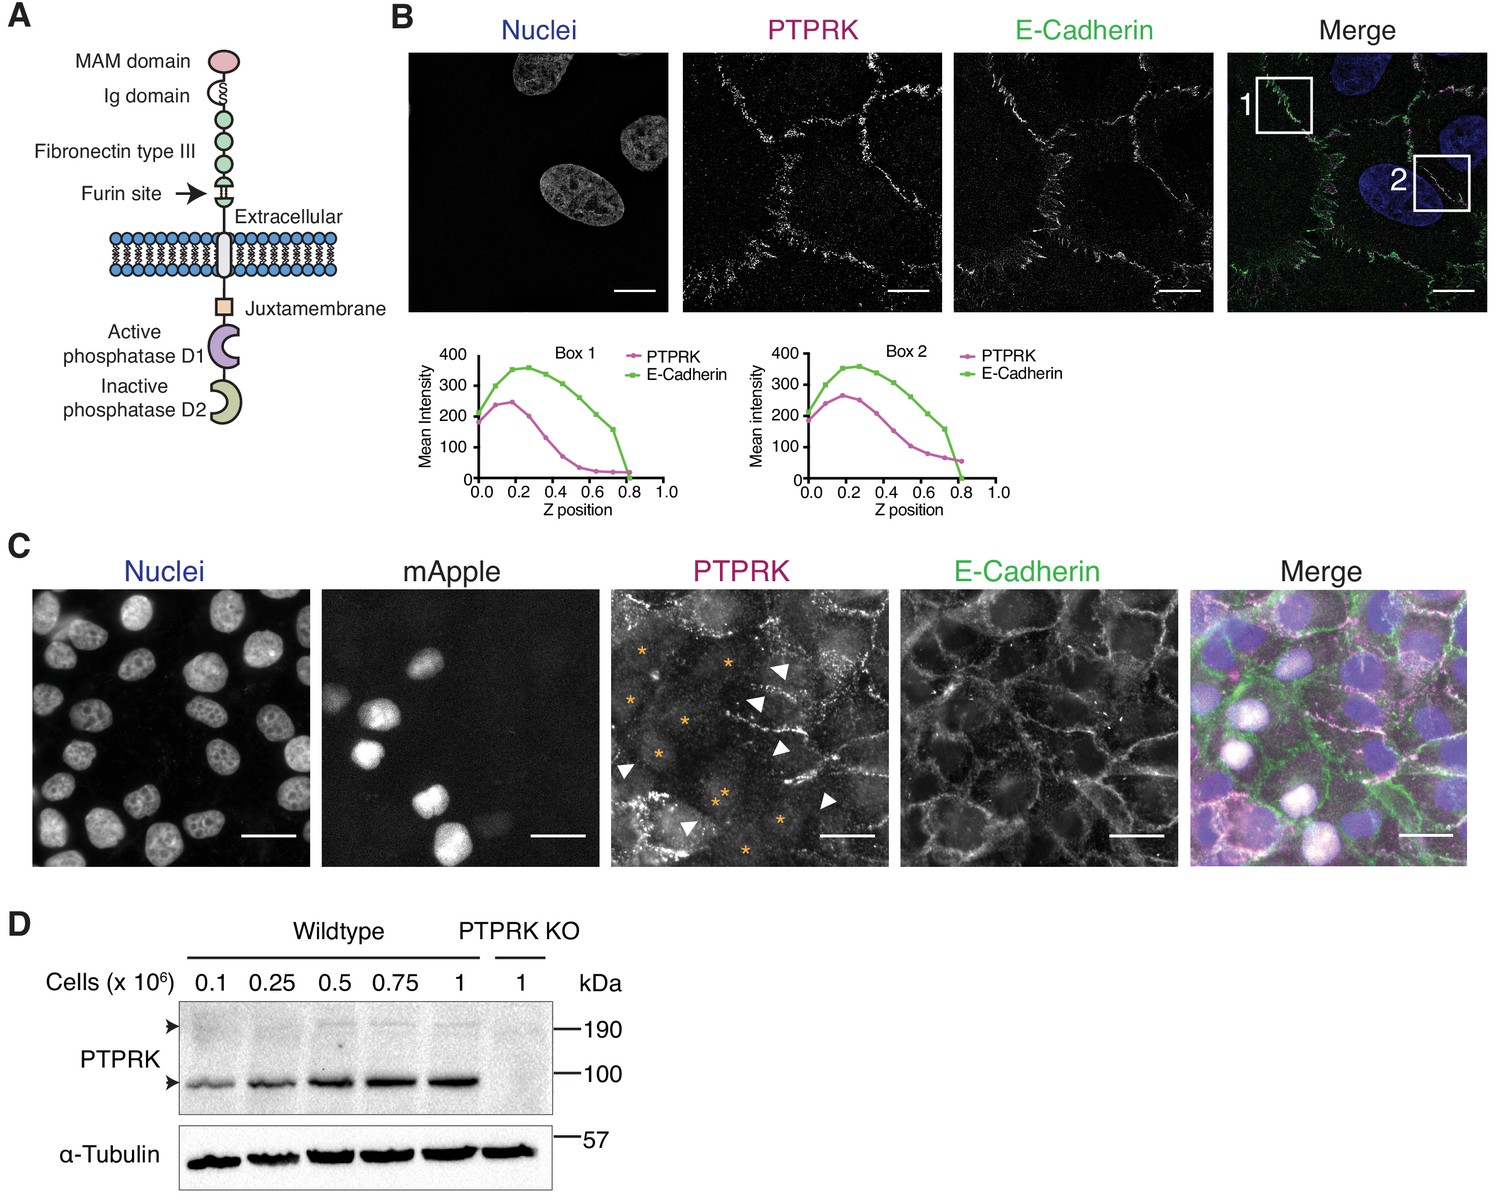
The homophilic receptor PTPRK is stabilized by cell-cell contact.
(A) Schematic of full length PTPRK. The extracellular MAM, Ig and fibronectin domains mediate homophilic interactions. The intracellular domain comprises a juxtamembrane domain and two PTP domains; one active (D1) and one inactive (D2). (B) Structured illumination microscopy images of MCF10As immunostained for PTPRK (F4 clone; magenta) and E-Cadherin (green). Graphs indicate fluorescence intensity through the Z-axis in indicated boxed regions. Scale bars = 10 µm. (C) Fluorescence microscopy images from co-cultures of wildtype and nuclear mApple-expressing PTPRK knockout MCF10As that were immunostained for PTPRK (magenta) and E-Cadherin (green). Nuclei were stained with Hoechst (blue). mApple positive PTPRK KO cells are indicated by orange asterisks. Cell junctions where PTPRK is absent are highlighted by white arrows. Scale bars = 20 µm. (D) MCF10As were plated at indicated densities and analyzed by immunoblot after 3 days in culture. Arrows indicate full length (top) and furin-cleaved PTPRK (bottom). See also Figure 1—figure supplement 1.
Figure 1—figure supplement 1
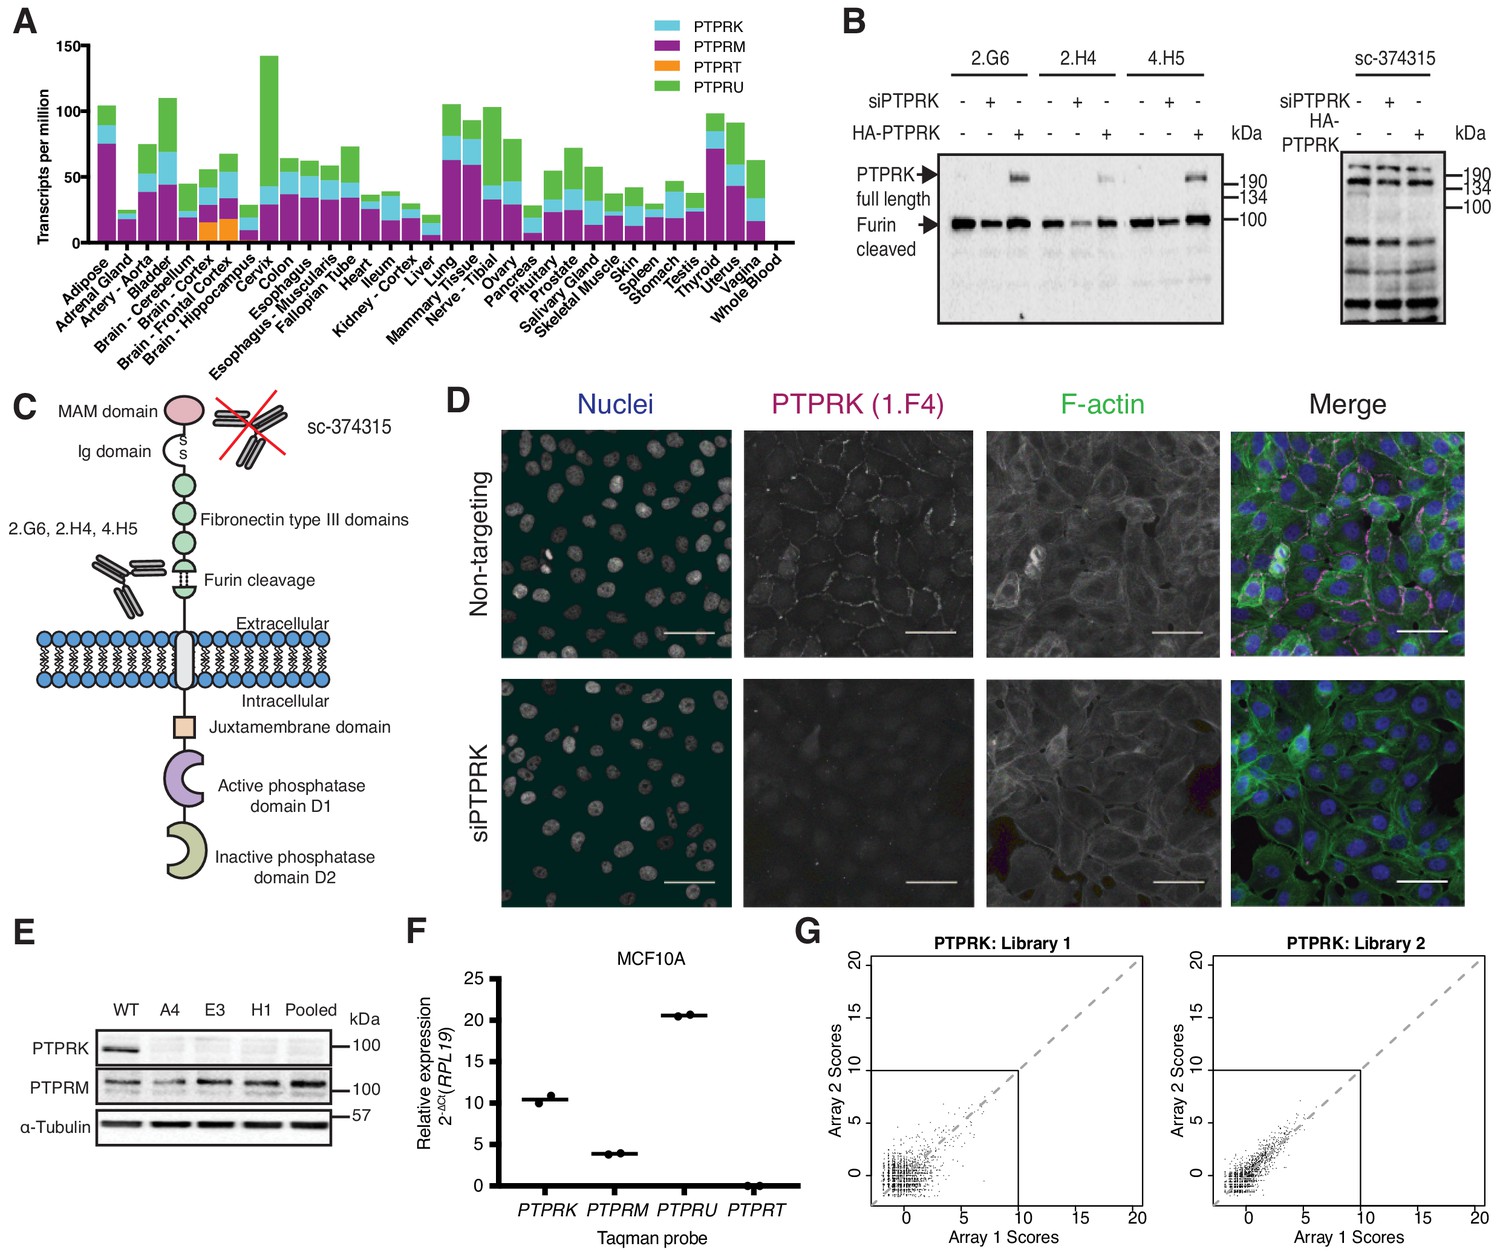
Generation and validation of PTPRK antibodies and interaction screen.
(A) mRNA expression of R2B PTPs in Human tissues. Raw data obtained from Genotype-tissue expression portal (GTExportal.org; GTEx Consortium et al., 2015). (B) 15 rabbit monoclonal antibodies were screened for their ability to specifically detect PTPRK by immunoblot. Immunoblot analysis of lysates generated from HEK293 cells transiently transfected with HA-PTPRK or an siRNA pool targeting PTPRK mRNA. Left: The indicated Rabbit monoclonal antibodies detected bands at 215 kDa (full length PTPRK) and 95 kDa (Furin-cleaved PTPRK), which are depleted by siRNA and increased with PTPRK overexpression. This suggests the antibodies recognize epitopes C-terminal to the Furin-cleavage site. Right panel: immunoblot probed with a commercial mouse monoclonal antibody raised against a PTPRK extracellular fragment (Sc-374315). No bands corresponding to predicted sizes (Full length 215 kDa; Furin-cleaved extracellular fragment:~120 kDa.) or modulated by siRNA depletion or overexpression were observed. (C) PTPRK antibody recognition based on (B). (D) 15 monoclonal antibodies were screened for their ability to specifically detect PTPRK by immunofluorescence. Immunostaining of MCF10As transfected with a non-targeting or PTPRK siRNA using PTPRK rabbit monoclonal antibody clone 1 .F4 (Magenta). F-actin (green) and nuclei (blue) were stained with phalloidin and Hoechst, respectively. Scale bars = 50 µm. (E) MCF10As were transfected with plasmids for the expression of Cas9, eGFP and single guide RNAs targeting PTPRK exons 1 and 2. eGFP-positive cells were cloned and expanded. Lysates from three clones grown individually or pooled were analyzed by immunoblot. PTPRK was detected using a mix of 2 .G6, 2 .H4 and 4 .H5 monoclonal antibodies. (F) Quantitative PCR analysis of confluent MCF10A cDNA using the indicated probes. Ct values relative to the housekeeping gene RPL19 were normalized using 2-ΔCt. The means of technical duplicates are shown. (G) Summary of secreted protein microarray with two purified protein libraries representing more than 1500 genes (≈50% single transmembrane receptors and partial secreted factor coverage) against the recombinant Fc-tagged PTPRK extracellular domain. Each intersection plot represents two independent microarray screens and dots represent average scores for each protein in the library. The lower left square represents all non-hit proteins with a cut-off of 10. Data analysis for hit calling is described in the Materials and methods section.
Figure 2 with 3 supplements
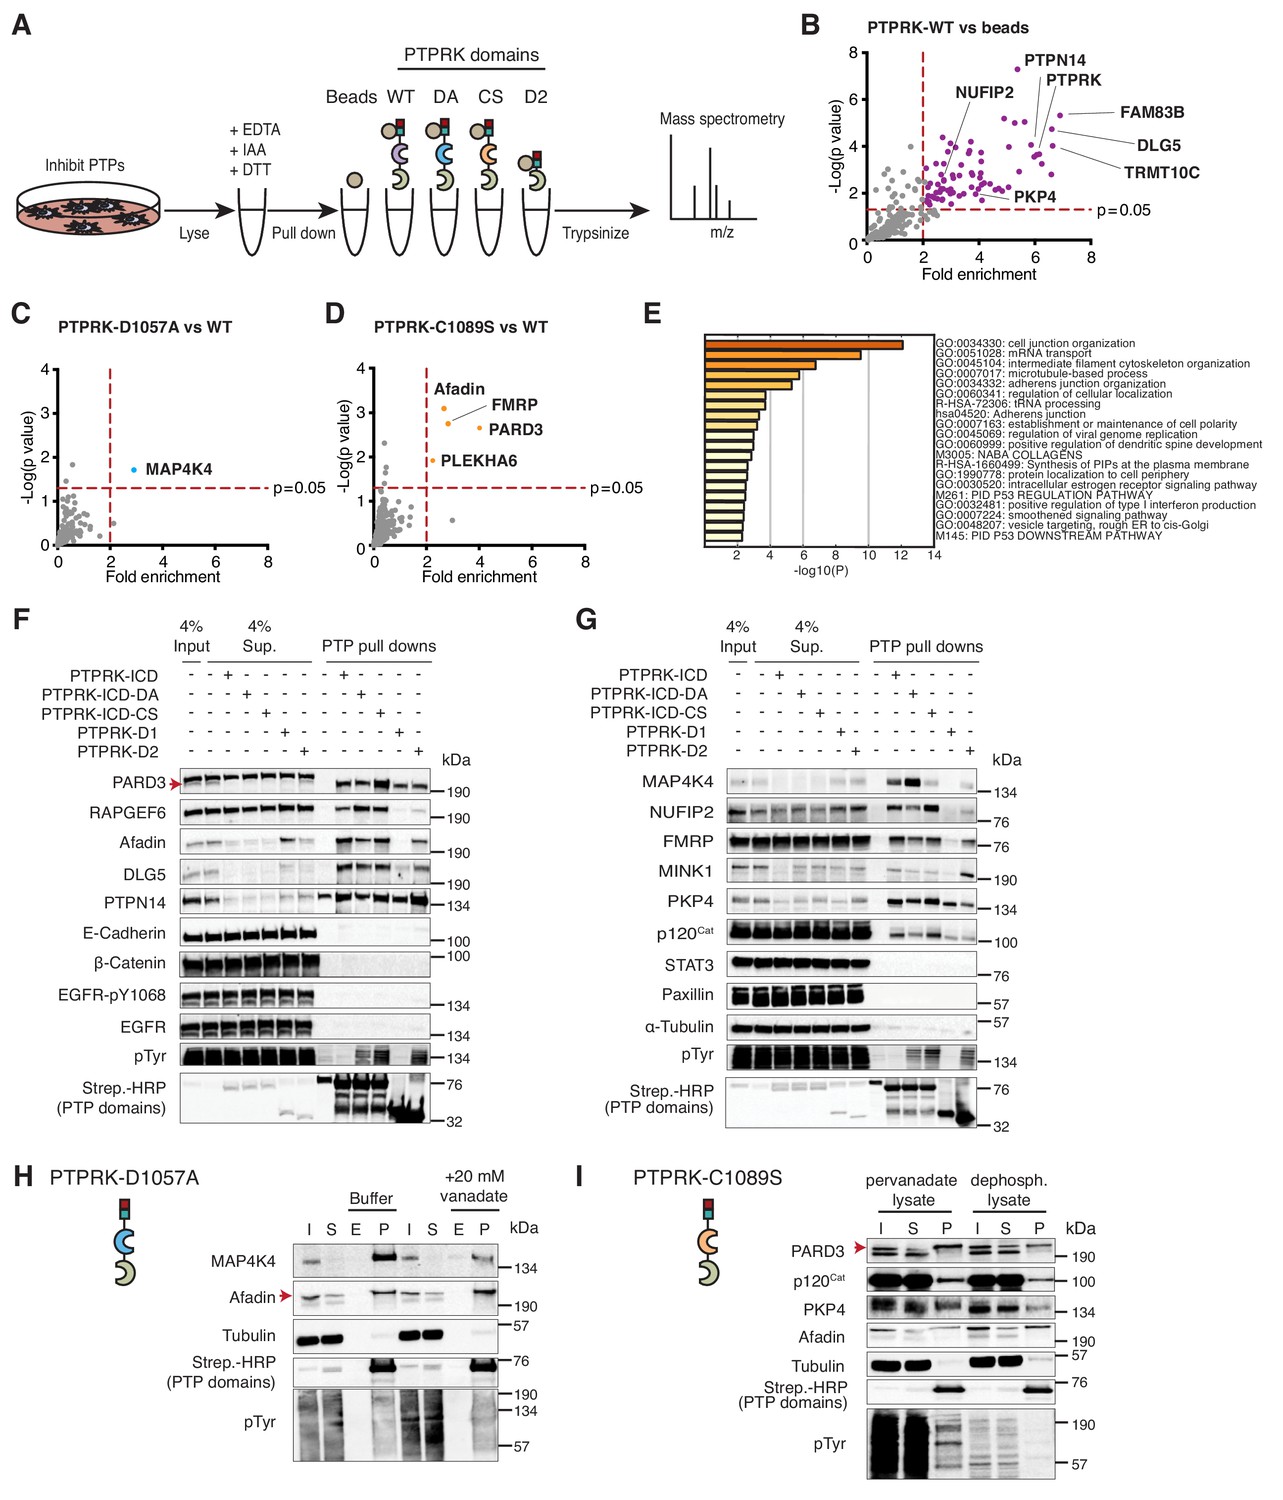
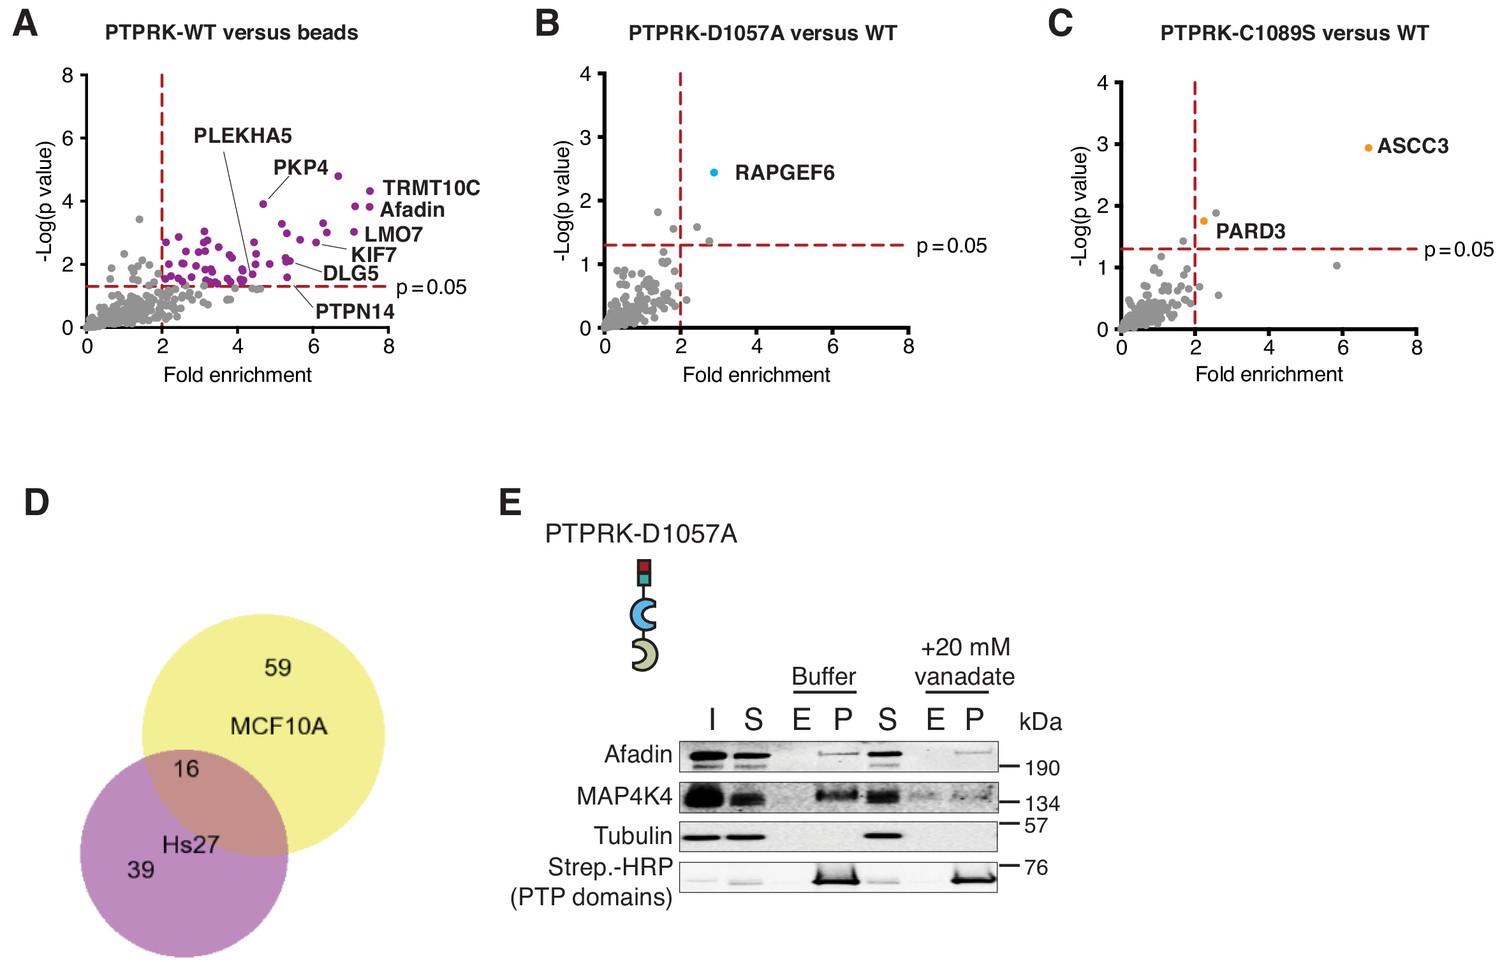
The interactome of the homophilic adhesion receptor PTPRK.
(A) Experimental schematic of PTPRK interactome and substrate trapping studies. DA = D1057A, CS = C1089S. (B–D) Statistically enriched (p<0.05, n = 4) proteins after pull downs from pervanadate treated MCF10A lysates are displayed on volcano plots comparing PTPRK-ICD to beads control (B), PTPRK-ICD-DA to PTPRK-ICD (C) and PTPRK-ICD-CS to PTPRK-ICD (D). (E) GO term analysis of proteins statistically enriched (p<0.05) on PTPRK-ICD domains using Metascape. (F–G) Selected PTPRK interactors identified by mass spectrometry were validated by immunoblot analysis. Input and supernatants reveal the extent of protein depletion by recombinant proteins. Arrow indicates relevant band. See also Figure 2—figure supplements 1, 2 and 3. (H) Confluent, pervanadate-treated MCF10A lysates were used for pull downs with PTPRK D1057A ICD. Where indicated, pull downs were incubated with and without 20 mM vanadate for 30 min. 4% inputs (I), 4% supernatants (S), 4% eluates (E; following vanadate treatment) and pull downs (P) were subjected to immunoblot analysis. (I) Confluent, pervanadate-treated MCF10A lysates were treated with or without CIP to remove protein phosphorylation and were used for pull downs with PTPRK C1089S ICD. 4% inputs (I), 4% supernatants (S) and pull downs (P) were subjected to immunoblot analysis.
-
Figure 2—source data 1
Raw and processed PTPRK interactome proteomic data.
Spreadsheet of all raw Maxquant output files (raw) and Peruses-generated processed data (processed) for the PTPRK pull down proteomic experiments). p values were determined using a two-sample, two-sided t test performed with truncation by a permutation-based FDR (threshold value 0.05; n ≥ 3).
- https://doi.org/10.7554/eLife.44597.008
-
Figure 2—source data 2
PTPRK domain-interaction summary.
Spreadsheet of proteins that were statistically-enriched (p<0.05;>2 fold enrichment) on different PTPRK domains after pull downs and mass spectrometry. p values were determined using a two-sample, two-sided t test performed with truncation by a permutation-based FDR (threshold value 0.05; n ≥ 3).
- https://doi.org/10.7554/eLife.44597.009
Figure 2—figure supplement 1
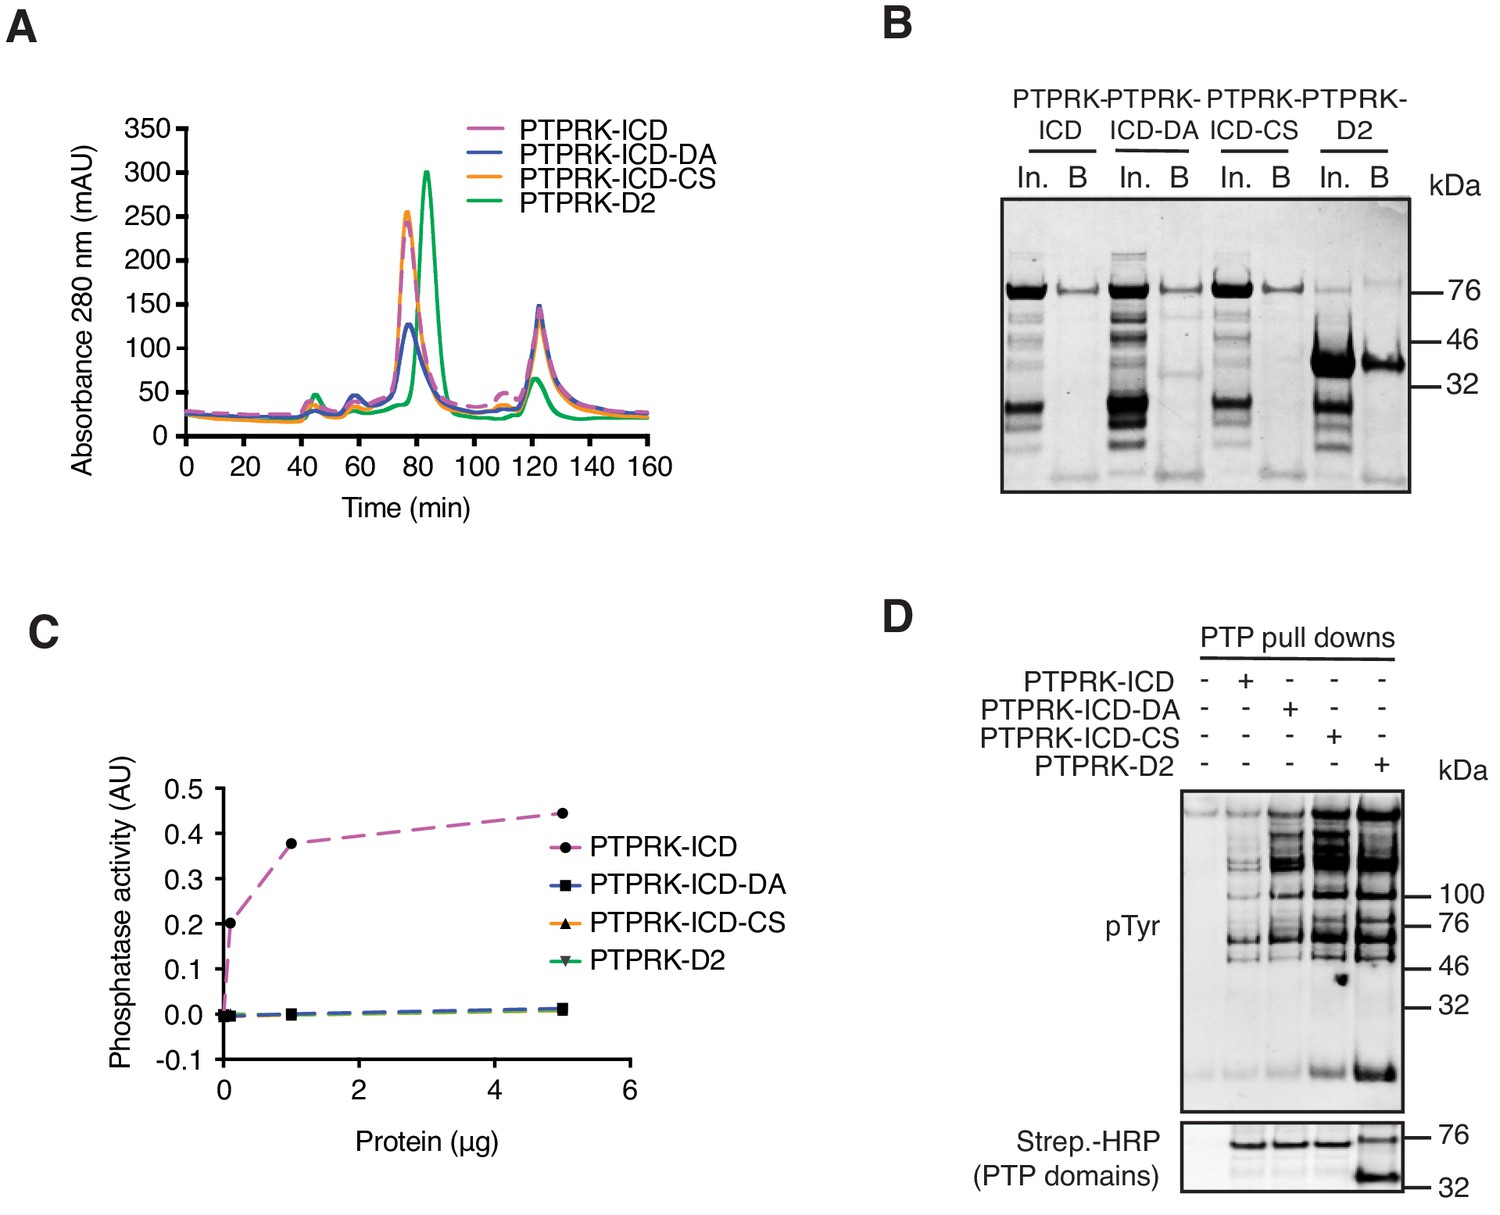
Purification of biotinylated recombinant PTPRK domains.
(A) His- and Avi-tagged PTPRK domains were expressed in E. coli cultured in biotin-supplemented media and purified using Nickel-NTA beads, followed by size exclusion chromatography (SEC). DA = D1057A mutant. CS = C1089S mutant. (B) SEC-purified proteins bound to streptavidin resin were eluted and resolved by SDS-PAGE followed by Coomassie staining. In; input, B; beads. (C) The phosphatase activity of indicated amounts of purified proteins was assessed using the Biomol green assay with two tyrosine phosphorylated peptides as substrates and was quantified at 620 nm. (D) Recombinant proteins bound to streptavidin resin were used in pull down assays from pervanadate treated Hs27 fibroblast lysates. After extensive washing, bound proteins were eluted in sample buffer and analyzed by immunoblot.
Figure 2—figure supplement 2
PTPRK interactome from Hs27 cell lysates and vanadate competition.
(A–C) Volcano plots showing statistically enriched (p<0.05, n = 3) proteins bound to the indicated recombinant proteins after pull downs from pervanadate-treated confluent Hs27 cell lysates comparing PTPRK-ICD to beads control (A), PTPRK-ICD-D1057A to PTPRK-ICD (B) and PTPRK-ICD-C1089S to PTPRK-ICD (C). Grey points that appear significant were consistently found on the beads-only control. (D) Comparison of proteins enriched on the PTPRK-ICD after pulldowns from MCF10A and Hs27 lysates. Protein lists were used as inputs for BioVenn (Hulsen et al., 2008). (E) Pull downs using PTPRK-ICD D1057A and PTPRK-D2 domains from confluent, pervanadate-treated MCF10A lysates were incubated with and without 20 mM vanadate for 30 min. 4% inputs (I), 4% supernatants (S), 4% eluates (E; following treatment) and pull downs (P) were subjected to immunoblot analysis.
Figure 2—figure supplement 3
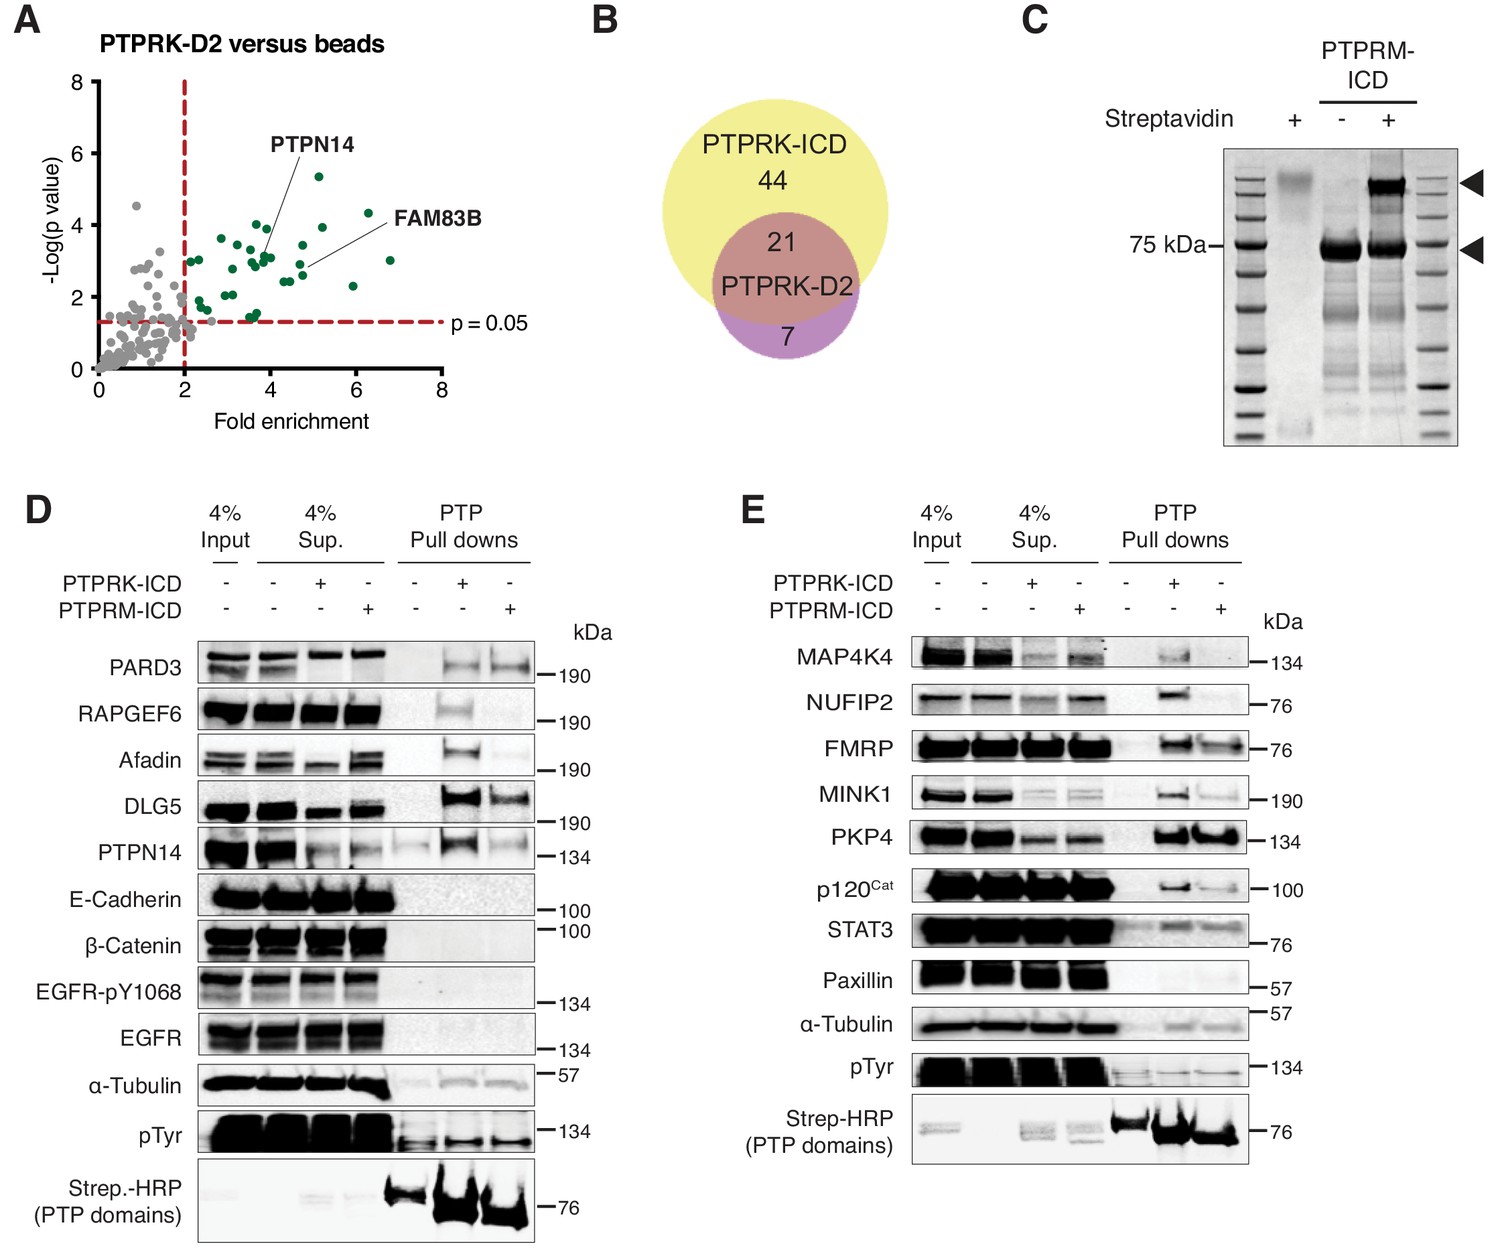
PTPRK-D2 interactome and PTPRM pull downs.
(A) Volcano plot showing statistically enriched (p<0.05, n = 3) proteins bound to the indicated recombinant proteins after pull downs from pervanadate-treated confluent MCF10A cell lysates comparing PTPRK-D2 to beads control. (B) Comparison of proteins enriched on PTPRK-D2 and PTPRK-ICD domains after pulldowns from MCF10A lysates. Protein lists were used as inputs for BioVenn (Hulsen et al., 2008). (C) After size exclusion chromatography (SEC), purified protein was incubated with or without streptavidin and subjected to SDS PAGE followed by Coomassie staining to determine the extent of biotinylation. Arrows indicate the purified domains and the respective streptavidin-induced mobility shift. (D–E) PTPRK interactors identified by mass spectrometry were validated using pull downs with the specified PTPRK and PTPRM protein domains from pervanadate-treated, confluent MCF10A cell lysates followed by immunoblot analysis. Input and supernatants reveal the extent of protein depletion by recombinant proteins.
Figure 3 with 2 supplements
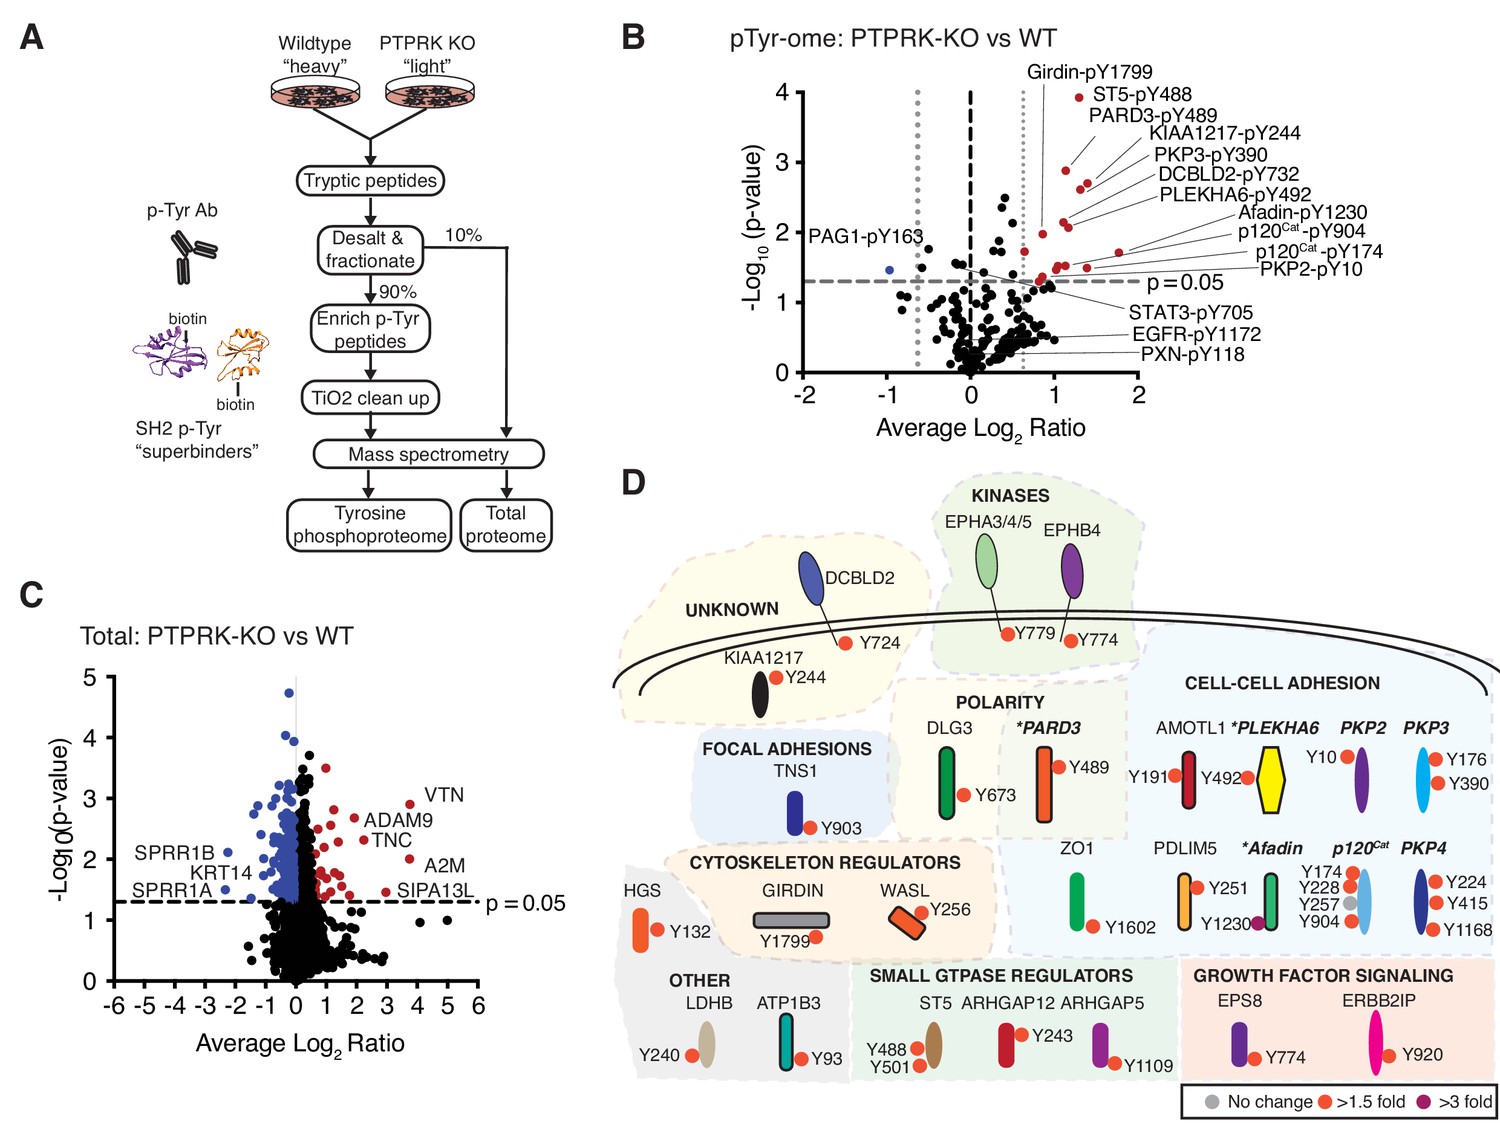
The PTPRK dependent tyrosine phosphoproteome.
(A) Schematic of workflow to enrich and identify phosphotyrosine peptides from SILAC-labeled wildtype and PTPRK KO MCF10As. Equal amounts of wildtype and PTPRK KO cell lysates were combined prior to trypsinization. A 10% sample was reserved for total proteome analysis. Tyrosine phosphorylated peptides were enriched using anti-phosphotyrosine antibodies and SH2 domain ‘superbinders’. (B) Volcano plot of tyrosine phosphosites detected in PTPRK KO and wildtype MCF10As. Phosphosites > 50% enriched in (p<0.05; n = 3) in PTPRK KO cells are labeled red and those enriched in wildtype are blue. FDR = 0.01, two valid values required. (C) Volcano plot of protein abundance. Proteins > 50% more abundant (p<0.05; n = 3) in PTPRK KO MCF10As are shown in red, and wildtype in blue. FDR = 0.01, two valid values required. (D) Overview of proteins with at least one tyrosine phosphorylation site increased in PTPRK KO cells as determined by quantitative proteomics (FDR = 0.01, one valid value required). Tyrosine phosphosite change in PTPRK KO cells compared to wildtype is indicated by colored circles:>3 fold up; purple,>1.5 fold up; red,<1.5 fold up or down (no change); grey. Proteins identified as interactors by AP-MS or immunoblotting in this study are highlighted in bold and italics. *Denotes proteins enriched on substrate traps. See also Figure 3—figure supplements 1 and 2.
-
Figure 3—source data 1
Quantitative total and tyrosine phosphoproteomics.
Spreadsheet of all raw Maxquant output files (raw) and Peruses-generated processed data (processed; requiring either 1 or two valid values) for the total and tyrosine phosphoproteomic experiments. p values were determined using a one-sample, two-sided t test performed with truncation by a Benjamini Hochberg FDR (threshold value 0.05; n = 3).
- https://doi.org/10.7554/eLife.44597.013
-
Figure 3—source data 2
Statistically upregulated proteins and phosphotyrosine sites in PTPRK KO cells following quantitative proteomics.
Spreadsheet of proteins that were statistically-enriched (≥50% + p<0.05) for the total and tyrosine phosphoproteomic experiments (1 and 2 valid values). p values were determined using a one-sample, two-sided t test performed with truncation by a Benjamini Hochberg FDR (threshold value 0.05; n = 3).
- https://doi.org/10.7554/eLife.44597.014
Figure 3—figure supplement 1

The PTPRK-dependent tyrosine phosphoproteome.
(A) After SEC, proteins were incubated with or without streptavidin and subjected to SDS PAGE followed by Coomassie staining to determine the extent of biotinylation. Arrows indicate the purified domains and the respective streptavidin-induced mobility shift. (B) Volcano plot of tyrosine phosphosites detected in PTPRK KO and wildtype MCF10As. Phosphosites > 50% enriched in (p<0.05; n = 3) in PTPRK KO cells are labeled red and those enriched in wildtype are blue. FDR = 0.01, one valid value required. (C) Proteins with upregulated phosphotyrosine sites in PTPRK KO cells that were also identified as PTPRK interactors, either by proteomics or immunoblotting. (D) Weblogo representation of amino acids surrounding phosphotyrosine from candidate substrates in (C). (E) Surface charge representation of PTPRK-D1 (left; PDB: 2C7S Eswaran et al., 2006) showing acetate bound to the active site. Yellow line represents the approximate binding location for a ~ five amino acid phosphopeptide. Scale indicates kcal/mol·e. (F) Phopshopeptide motifs derived from PTPRK candidate substrates ([STEADNR][NPDHLRTY][INSEPGV]pY[VADIEFGSY][DTEGIKNQRS][LFPSTANR]) were used to search the phosphosite plus database. Scramble 1 and 2 correspond to the following searches: [LFPSTANR][DTEGIKNQRS][VADIEFGSY]pY[INSEGPV][INSEGPV][STEADNR] and [INSEGPV][NPDHLRTY][STEADNR]pY[LFPSTANR][DTEGIKNQRS], respectively. Listed are PTPRK-interacting proteins with phosphosites predicted by the consensus. Number of overlapping proteins between phosphosite plus searches and interactors are shown on Venn diagrams.
Figure 3—figure supplement 2
The PTPRK-dependent tyrosine phosphoproteome is enriched for cell junction organization proteins.
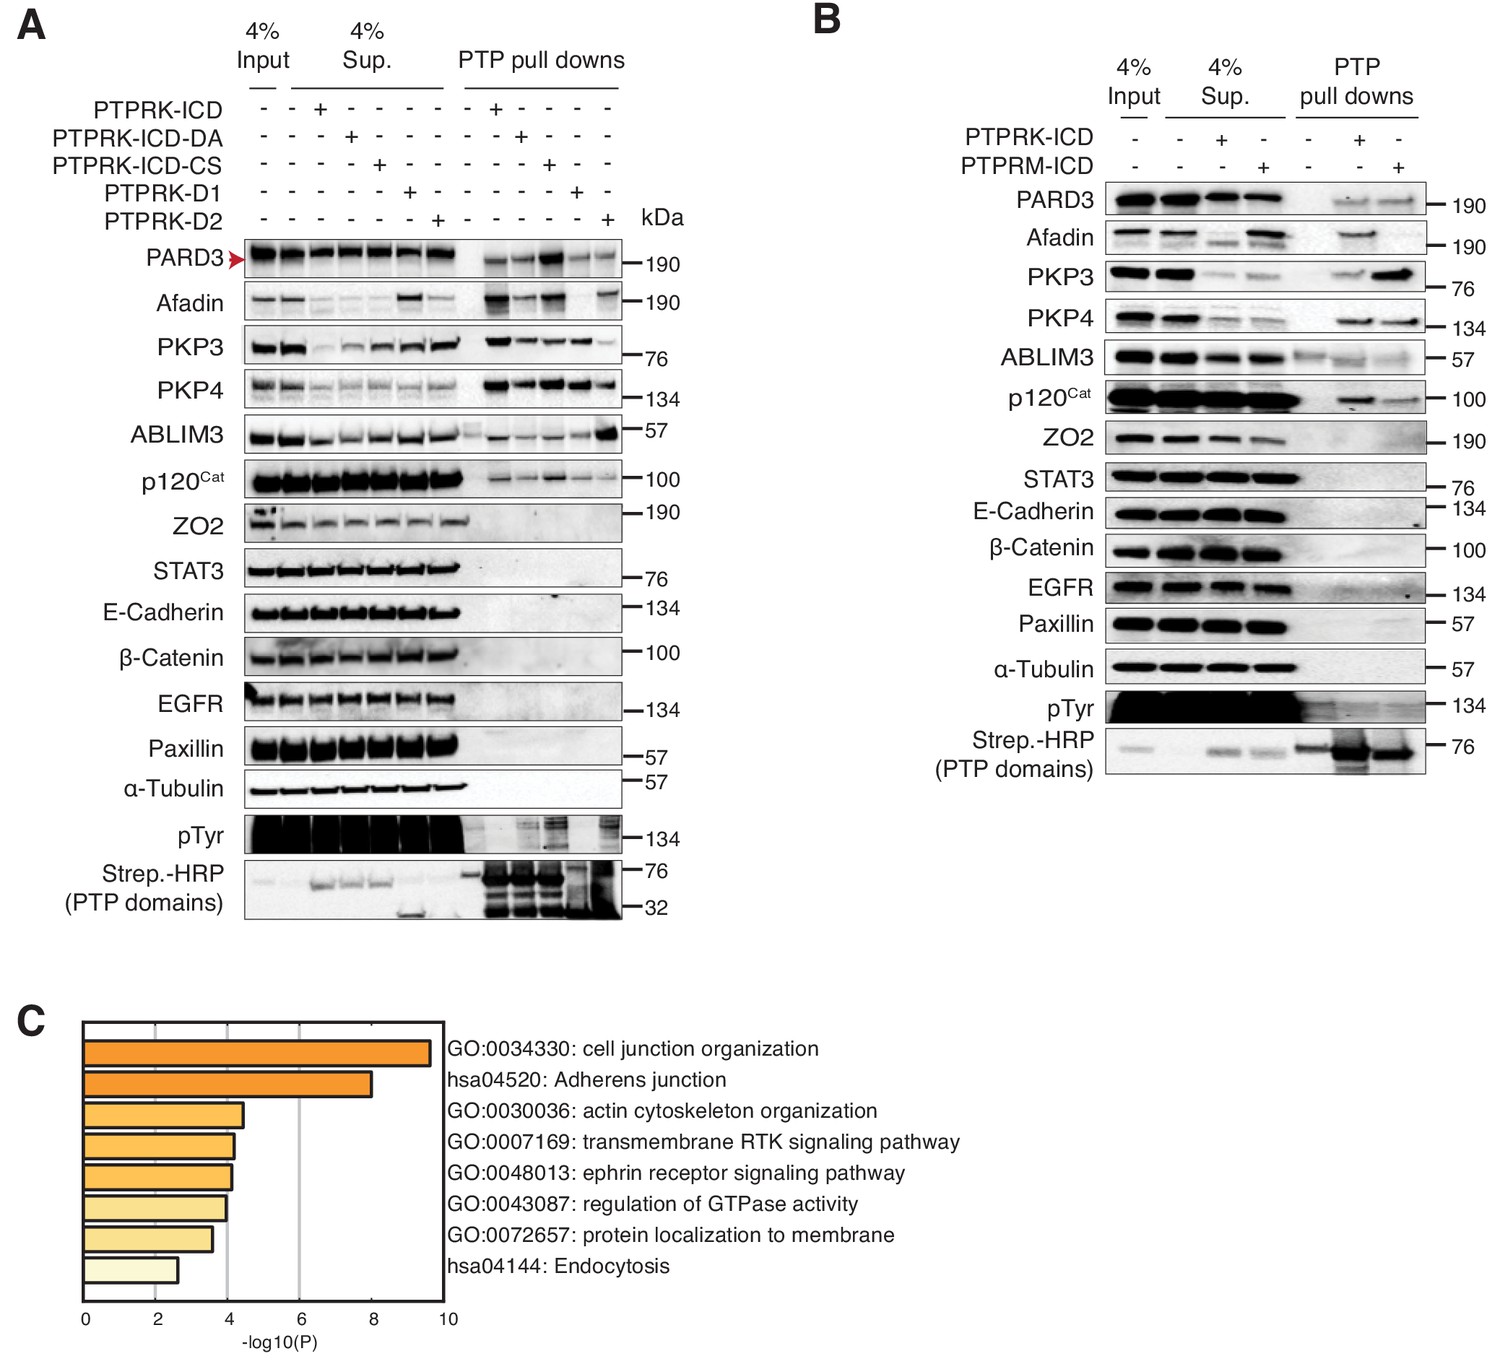
(A–B) PTPRK interactors identified by mass spectrometry were validated using pull downs with the specified PTPRK and PTPRM protein domains from pervanadate-treated, confluent MCF10A cell lysates followed by immunoblot analysis. Input and supernatants reveal the extent of protein depletion by recombinant proteins. (C) GO term analysis using Metascape of proteins with increased tyrosine phosphorylation in PTPRK KO MCF10As. FDR = 0.01, one valid value required.
Figure 4 with 1 supplement
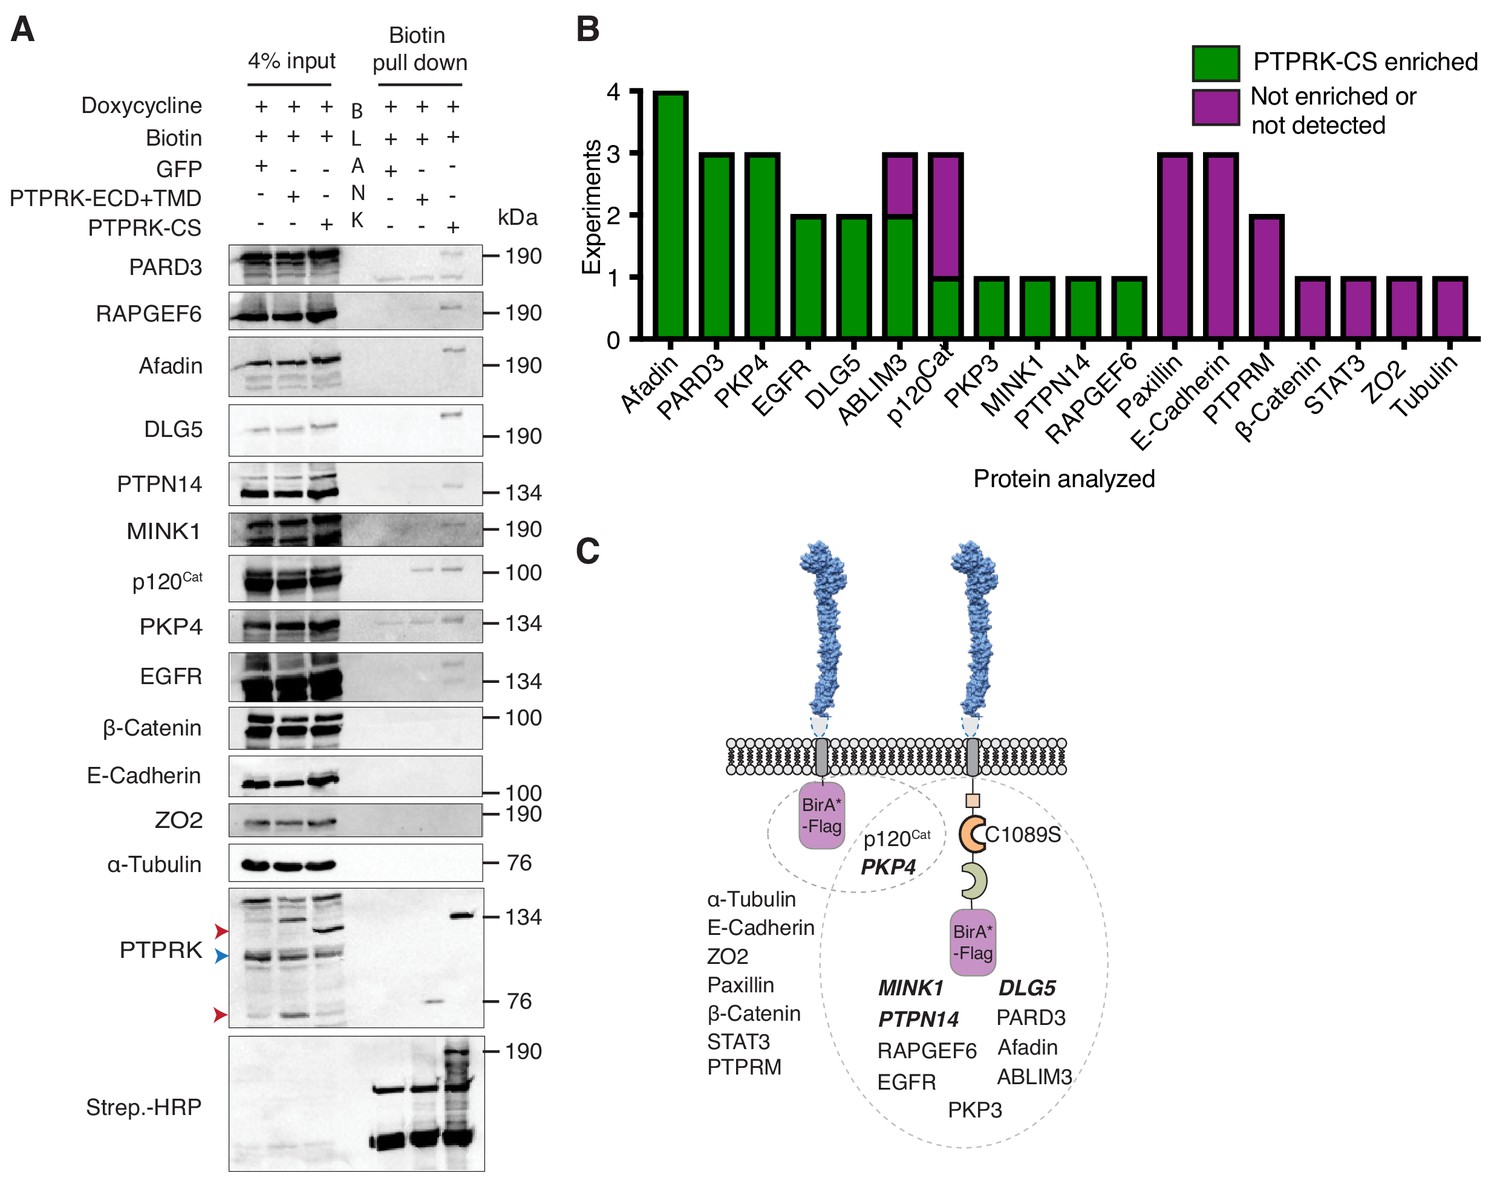
PTPRK interacts with candidate substrates in confluent MCF10A cells.
(A) Representative immunoblot analysis of biotin pull downs from MCF10As expressing tGFP or PTPRK BioID constructs. See Materials and methods for details. Red and blue arrows indicate exogenous and endogenous PTPRK, respectively. (B) Quantification of BioID immunoblots. Green bars indicate the number of times a protein was enriched on PTPRK-C1089S.BirA*-Flag, compared to PTPRK.ECD +TMD.BirA*-Flag in separate experiments. Purple bars indicate the number of times a protein was not enriched or was not detected in any pull downs. n ≥ 1. (C) Schematic representation of PTPRK proximity-labeling by BioID. PTPRK extracellular domain homology model is based on PTPRM (PDB: 2V5Y; Aricescu et al., 2007). Proteins within the dotted lines were detected in pull downs from indicated BioID lysates. Proteins not detectably biotinylated are listed on the left. Proteins in bold and italics were previously identified as PTPRK interactors using BioID in HEK293 cells (St-Denis et al., 2016). See also Figure 4—figure supplement 1.
Figure 4—figure supplement 1
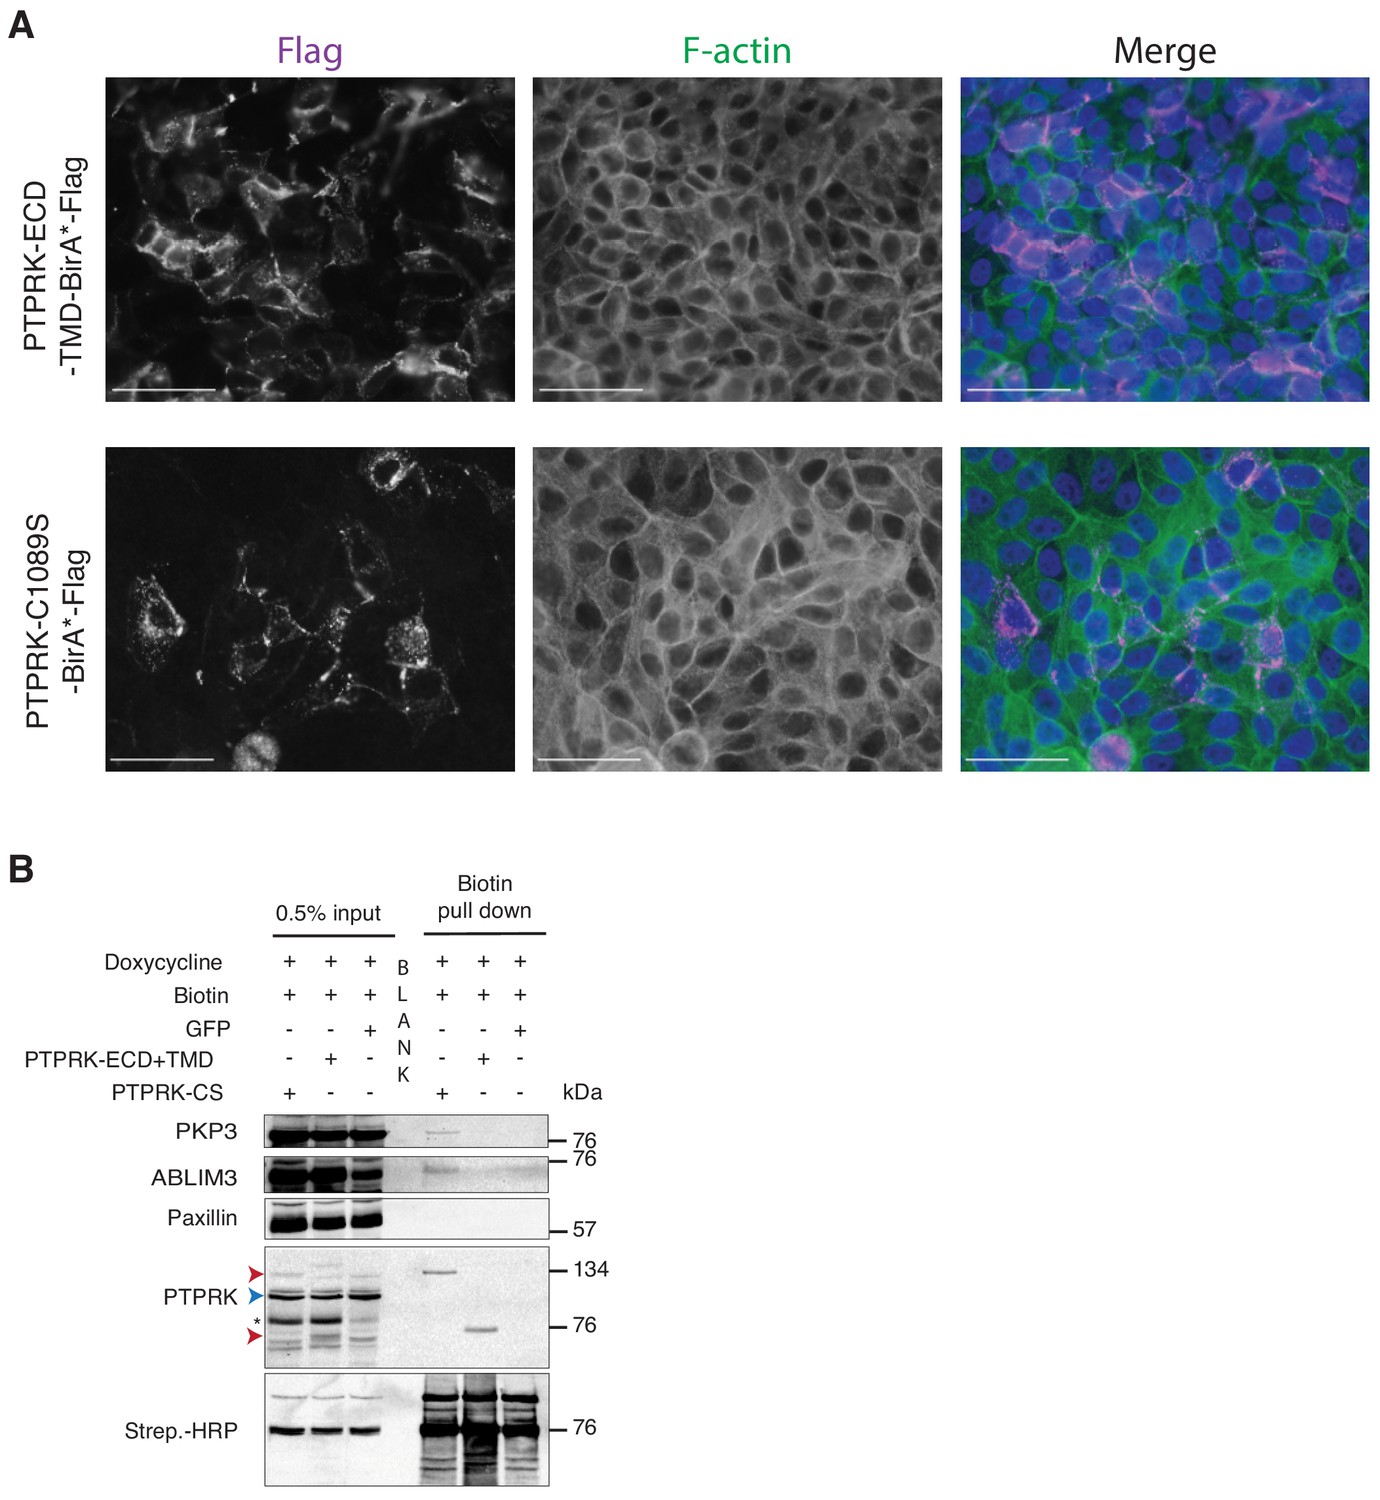
Localization of PTPRK BioID proteins.
(A) MCF10As with stably integrated doxycycline-inducible expression constructs (PTPRK-ECD +TMD-BirA*-Flag and PTPRK-C1089s-BirA*-Flag) were treated with 150 ng/ml and 500 ng/ml doxycycline, respectively, and immunostained using an anti-Flag antibody. F-actin and nuclei were stained with phalloidin and Hoechst, respectively. Scale bars = 50 µm. (B) Representative immunoblot analysis of biotin pull downs from MCF10As expressing tGFP or PTPRK BioID constructs. See Materials and methods for details. Red and blue arrows indicate exogenous and endogenous PTPRK, respectively. * residual ABLIM3 signal.
Figure 5 with 2 supplements
PTPRK directly and selectively dephosphorylates cell junction regulators.
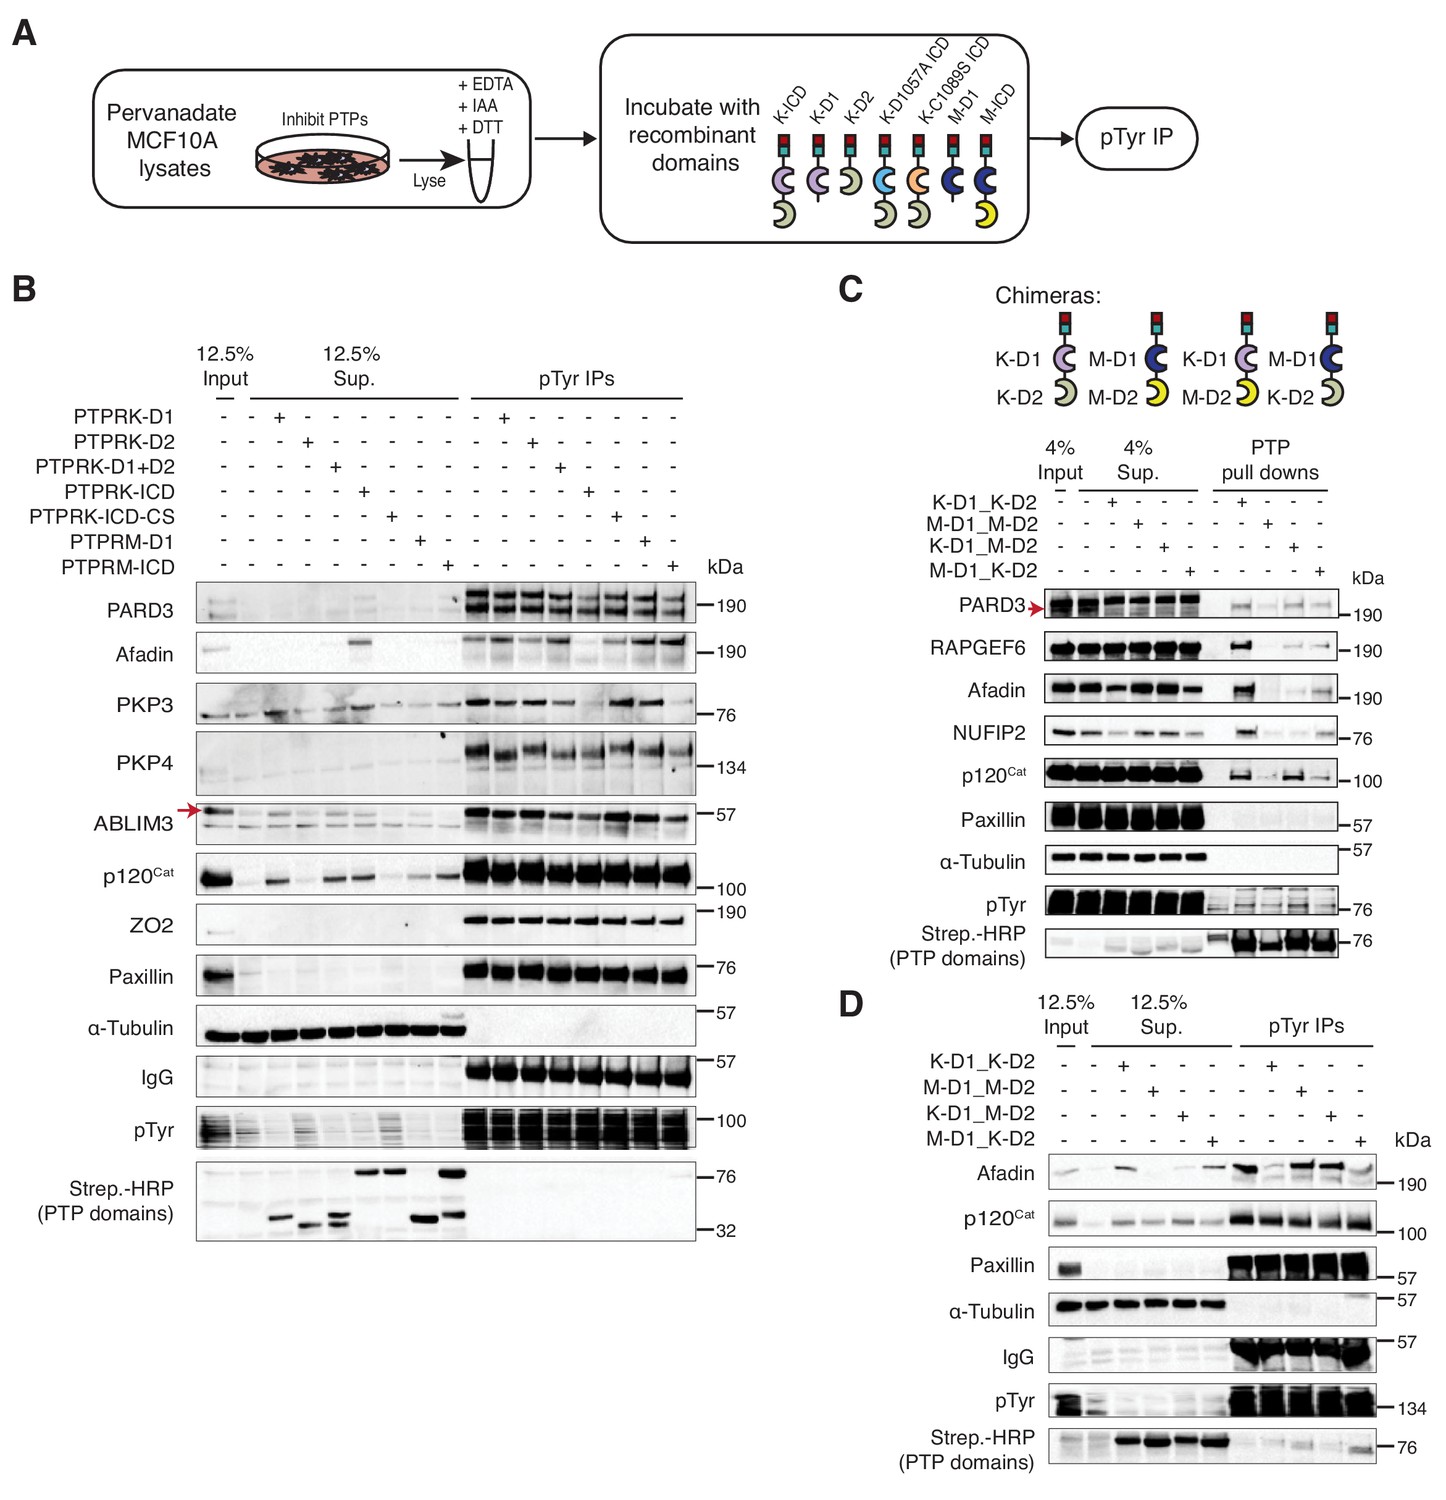
(A) Workflow of in-lysate dephosphorylation assay. Recombinant PTPRK and PTPRM domains were incubated with pervanadate-treated MCF10A lysates for 1.5 hr at 4°C, followed by immunoprecipitation of tyrosine phosphorylated proteins. (B) Pervanadate-treated MCF10A lysates were incubated with the indicated domains at an amount pre-determined to give equal phosphatase-activity prior to phosphotyrosine immunoprecipitation and immunoblot analysis. (C) Pull downs using chimeric RPTPs from confluent, pervanadate-treated MCF10A lysates were subjected to immunoblot analysis. (D) Pervanadate-treated MCF10A lysates were incubated with the indicated domains prior to phosphotyrosine immunoprecipitation and immunoblot analysis. See also Figure 5—figure supplements 1 and 2.
Figure 5—figure supplement 1

In vitro dephosphorylation assays and generation of RPTP chimeras.
(A) The indicated PTPRK and PTPRM domains were assayed for phosphatase activity using the pNPP colorimetric assay. Control wells contained pNPP only. Protein amounts used are shown. (B) Pervanadate-treated MCF10A lysates were incubated with predetermined amounts of the indicated domains to give equal phosphatase-activity, prior to phosphotyrosine immunoprecipitation and immunoblot analysis. (C) Recombinant proteins consisting of combinations of PTPRK and PTPRM D1 and D2 domains were expressed in and using Ni-NTA affinity resin. Purified proteins were then subjected to size exclusion chromatography. (D) Recombinant His- and Avi-tagged PTPRK and PTPRM chimeric domains were purified from E. coli cultured in biotin-supplemented media, incubated ±streptavidin and subjected to SDS-PAGE and Coomassie staining, to determine the extent of biotinylation. Arrows indicate the purified domains and the respective streptavidin-induced mobility shift. (E) The indicated recombinant PTPRK and PTPRM chimeric domains were incubated were assayed for phosphatase activity using the pNPP colorimetric assay. Control wells contained pNPP. Protein amounts used are shown.
Figure 5—figure supplement 2
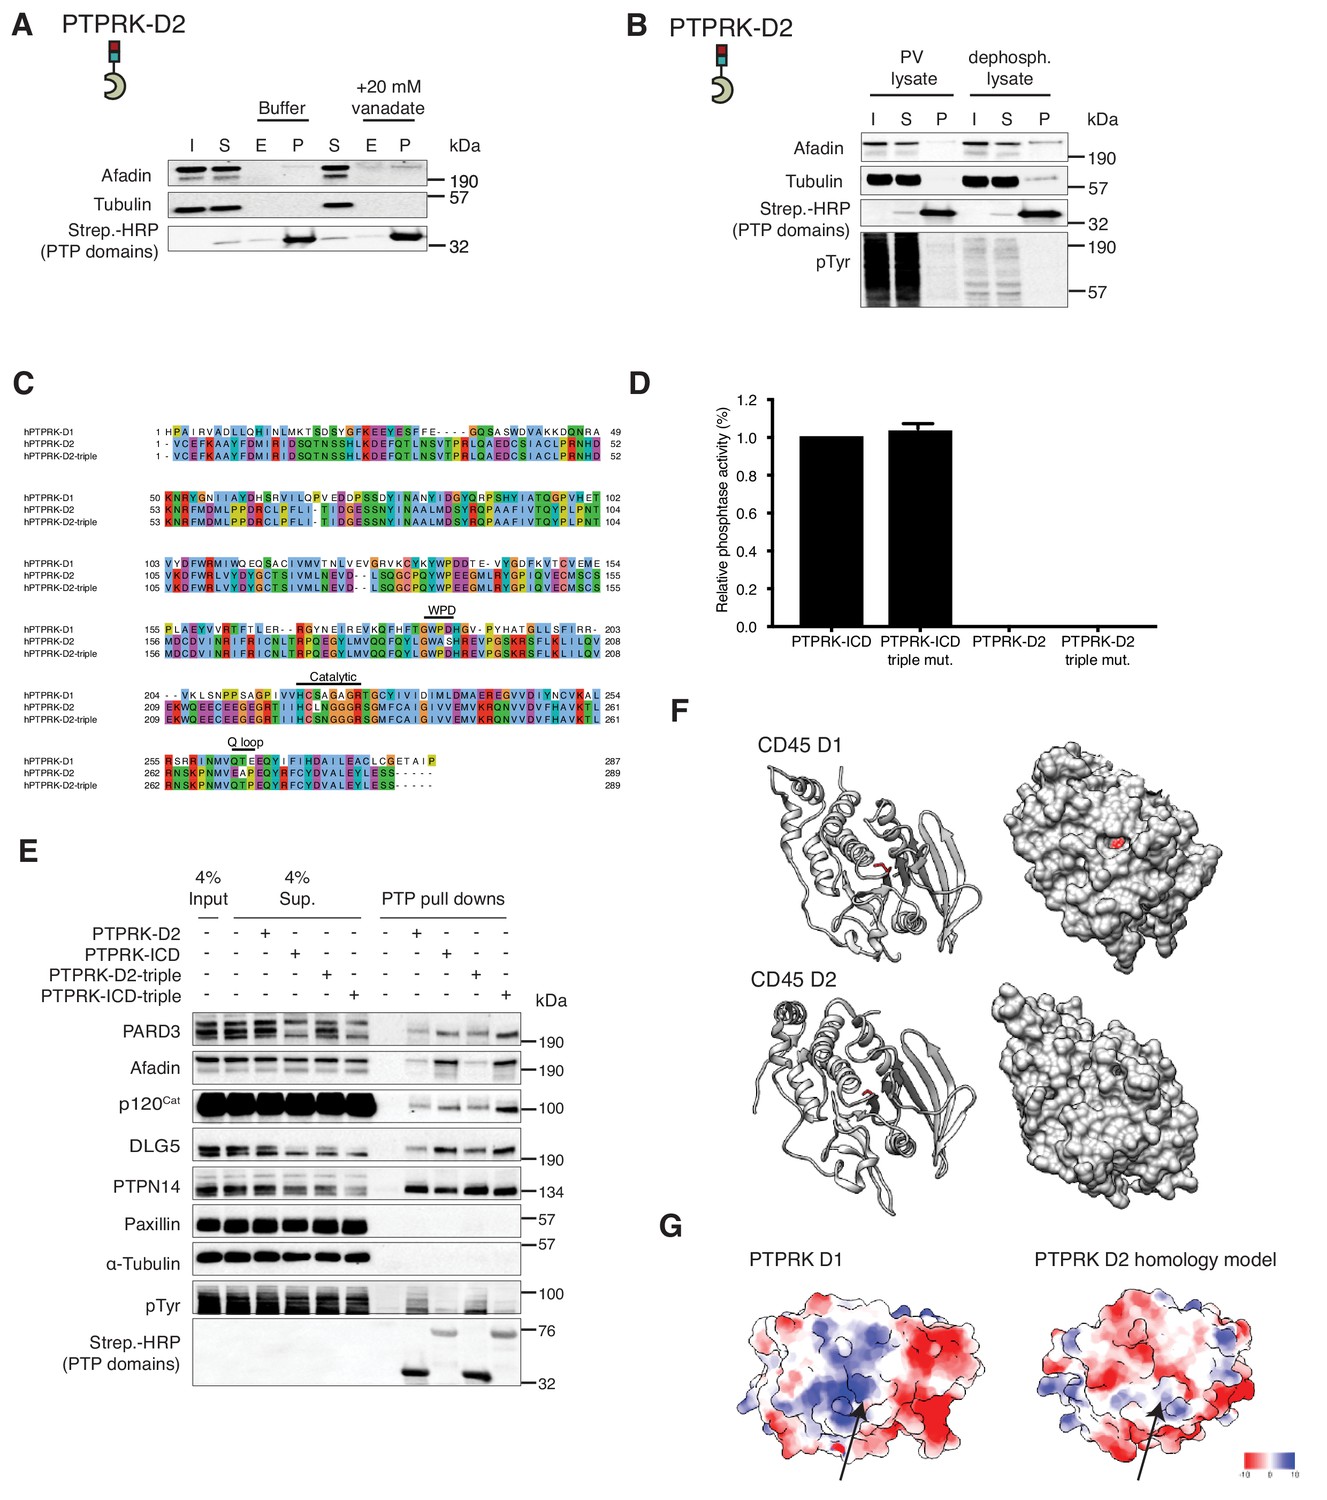
Analysis of PTPRK-D2 domain interactions.
(A) Pull downs using PTPRK-ICD D1057A and PTPRK-D2 domains from confluent, pervanadate-treated MCF10A lysates were incubated with and without 20 mM vanadate for 30 min. 4% inputs (I), 4% supernatants (S), 4% eluates (E; following treatment) and final pull downs (P) were subjected to immunoblot analysis. (B) Confluent, pervanadate-treated MCF10A lysates were treated with or without 20 U/ml CIP at 4°C for 16 hr to remove protein phosphorylation and were used for pull downs with PTPRK D2 domain. 4% inputs (I), 4% supernatants (S) and pull downs (P) were subjected to immunoblot analysis. (C) Clustal Omega alignment of PTPRK-D1 vs PTPRK-D2 vs PTPRK-D2 triple mutant generated using Jalview. (D) The indicated PTPRK domains were assayed for phosphatase activity using the pNPP colorimetric assay. Activity levels relative to PTPRK ICD are shown. Error bars denote ±SEM of technical triplicates. (E) Pull downs using indicated wildtype and mutant PTPRK domains from confluent, pervanadate-treated MCF10A lysates were analyzed by immunoblot. (F) Ribbon and surface representations of CD45 (PTPRC; PDB: 1YGR; Nam et al., 2005). The corresponding ‘active site’ cysteine residues (C828S for D1 and C1144 for D2) are highlighted in red. (G) Surface charge representation of PTPRK-D1 (left; PDB: 2C7S [Eswaran et al., 2006]) and PTPRK-D2 (right; homology model based on PDB: 6D3F (PTPRE-D2; [Lountos et al., 2018])).
Figure 6 with 1 supplement
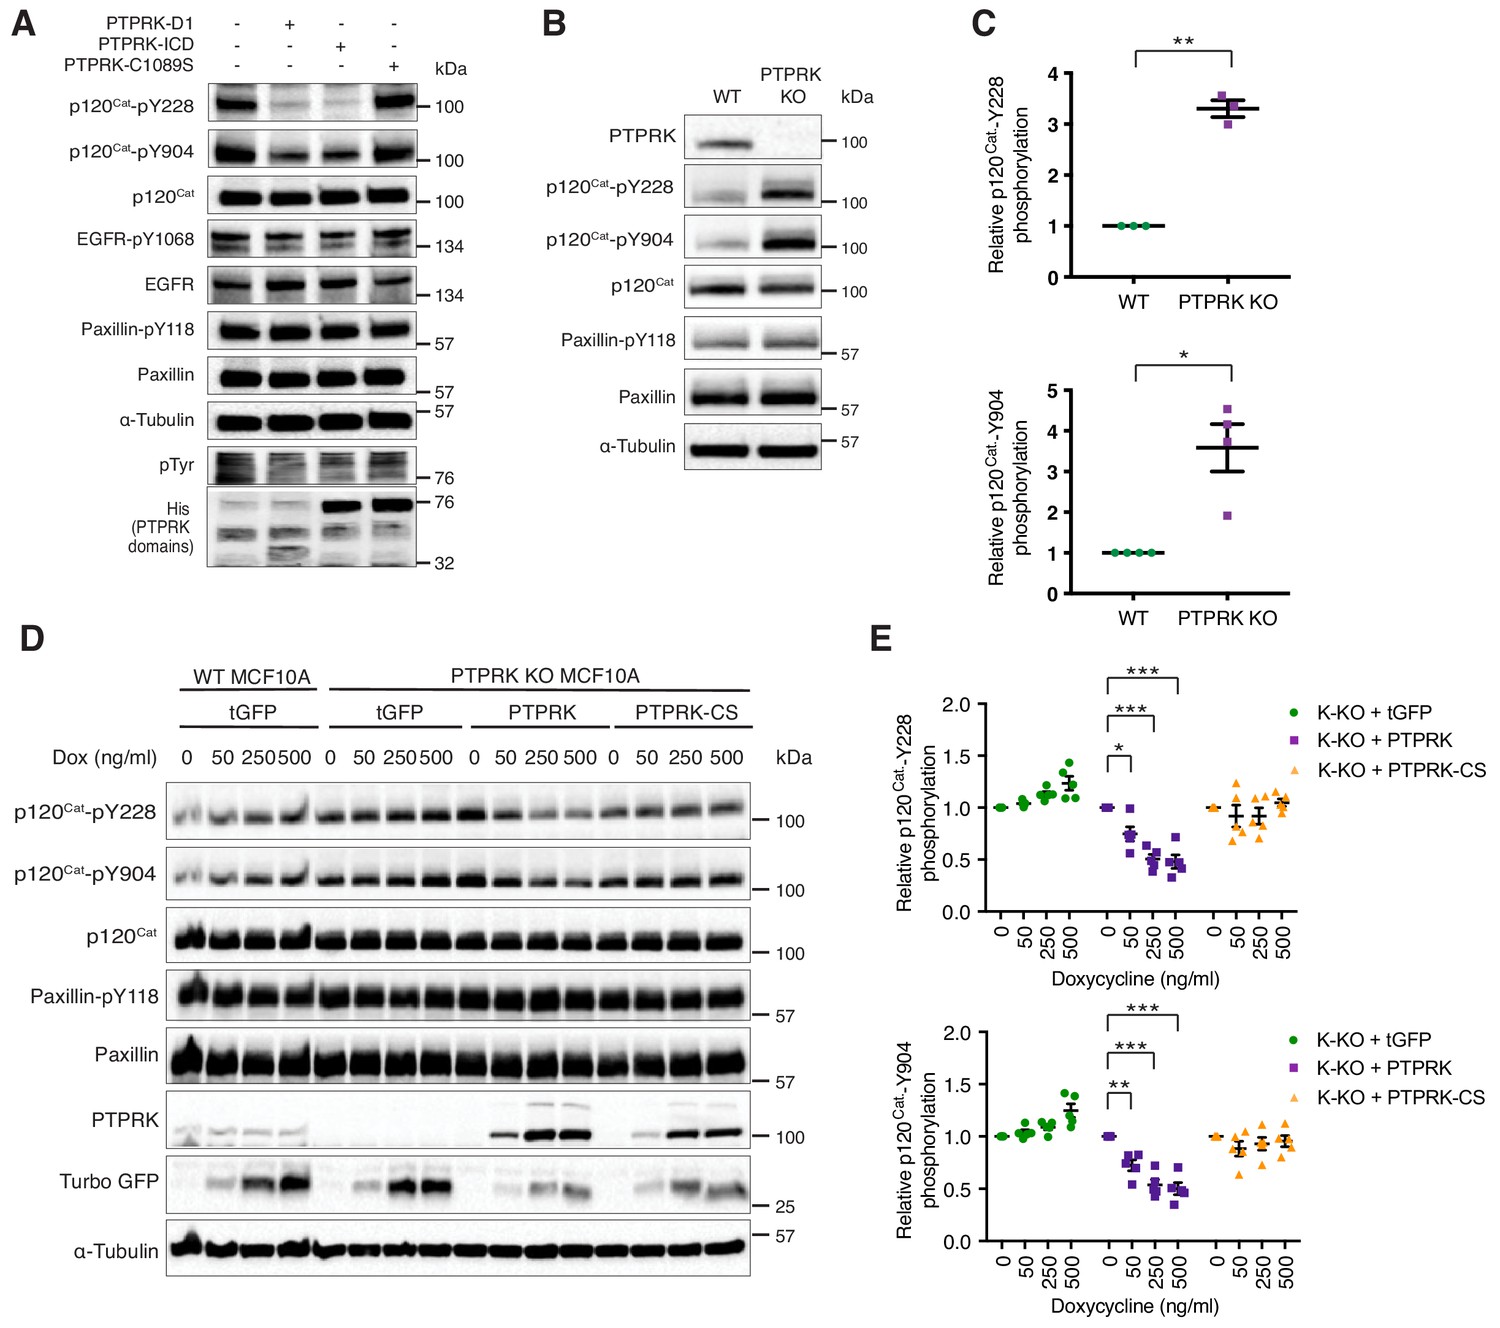
PTPRK dephosphorylates p120Cat Y228 and Y904 in MCF10A cells.
(A) Pervanadate-treated MCF10A lysates were incubated with and without the indicated recombinant PTPRK-D1, PTPRK-ICD or PTPRK-C1089S-ICD for 1.5 hr at 4°C, prior to immunoblot analysis. (B–C) Lysates from confluent wildtype and PTPRK KO MCF10As were analyzed by immunoblot and quantified by densitometry. Error bars denote ±SEM (n ≥ 3). Unpaired, two-tailed t test: *p<0.05, **p<0.005. (D) Wildtype or PTPRK KO MCF10As, with stably-integrated doxycycline-inducible tGFP, PTPRK or PTPRK-C1089S, were cultured for 6 days with indicated concentrations of doxycycline then lysed and subjected to immunoblot analysis. (E) Densitometric quantification of p120Cat phosphorylation normalized against total p120Cat. Error bars denote ±SEM (n = 5). Two-way ANOVA (Tukey’s multiple comparisons test): *p<0.005**, p<0.005, ***p<0.0005. See also Figure 6—figure supplement 1.
-
Figure 6—source data 1
Densitometric analysis of immunoblots.
- https://doi.org/10.7554/eLife.44597.022
Figure 6—figure supplement 1
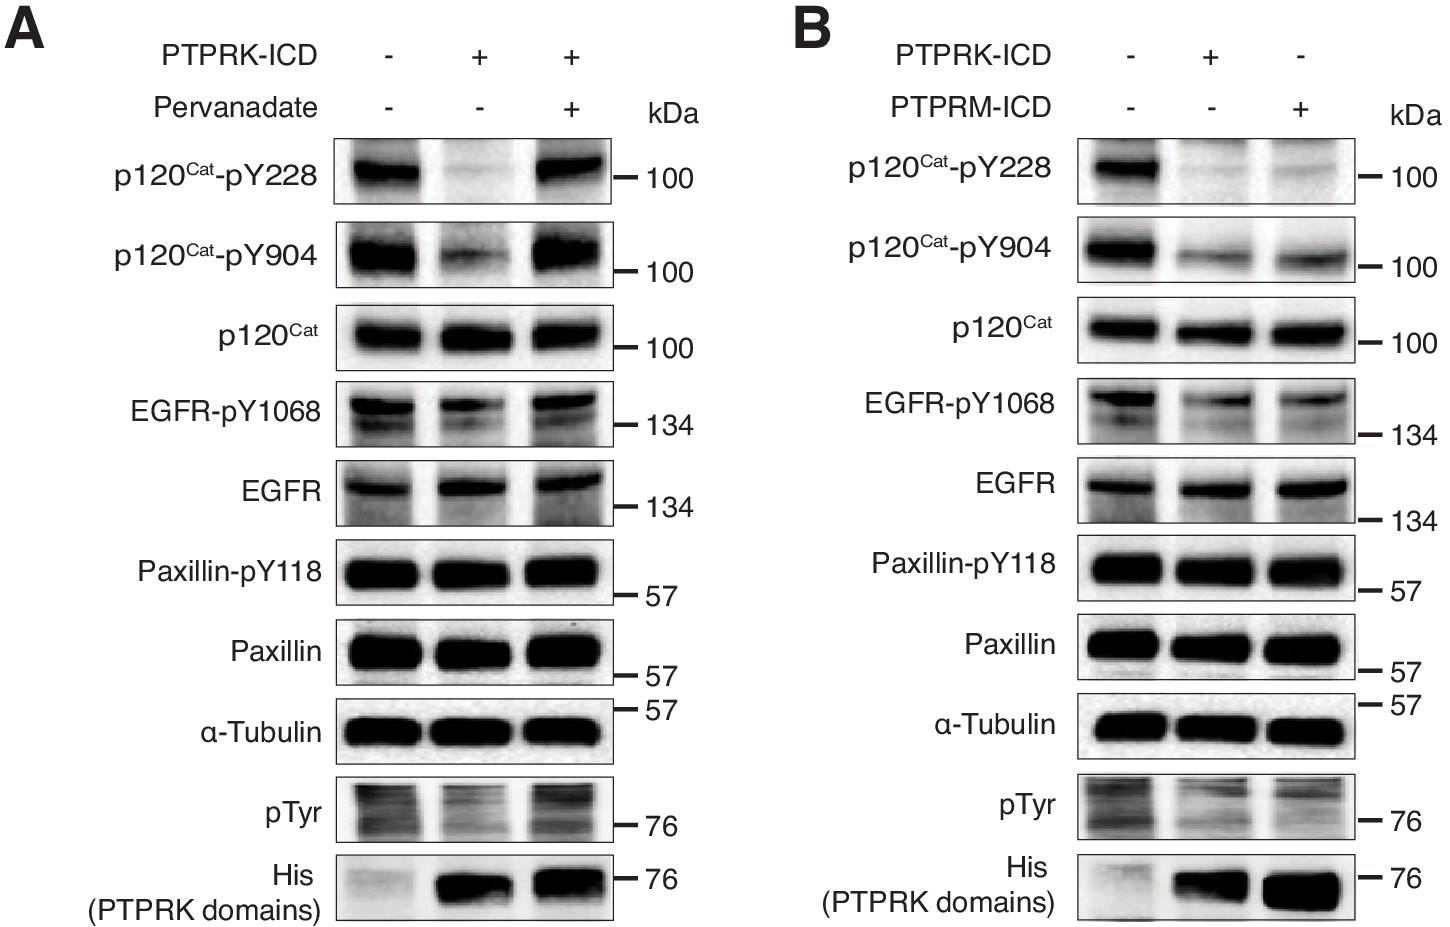
PTPRK dephosphorylates p120Cat-Y228 and Y904.
(A–B) Pervanadate-treated MCF10A lysates were incubated with and without the indicated recombinant PTPRK-ICD or PTPRM-ICD protein domains, with or without pervanadate (10 mM) for 1.5 hr at 4°C, prior to immunoblot analysis.
Figure 7 with 2 supplements
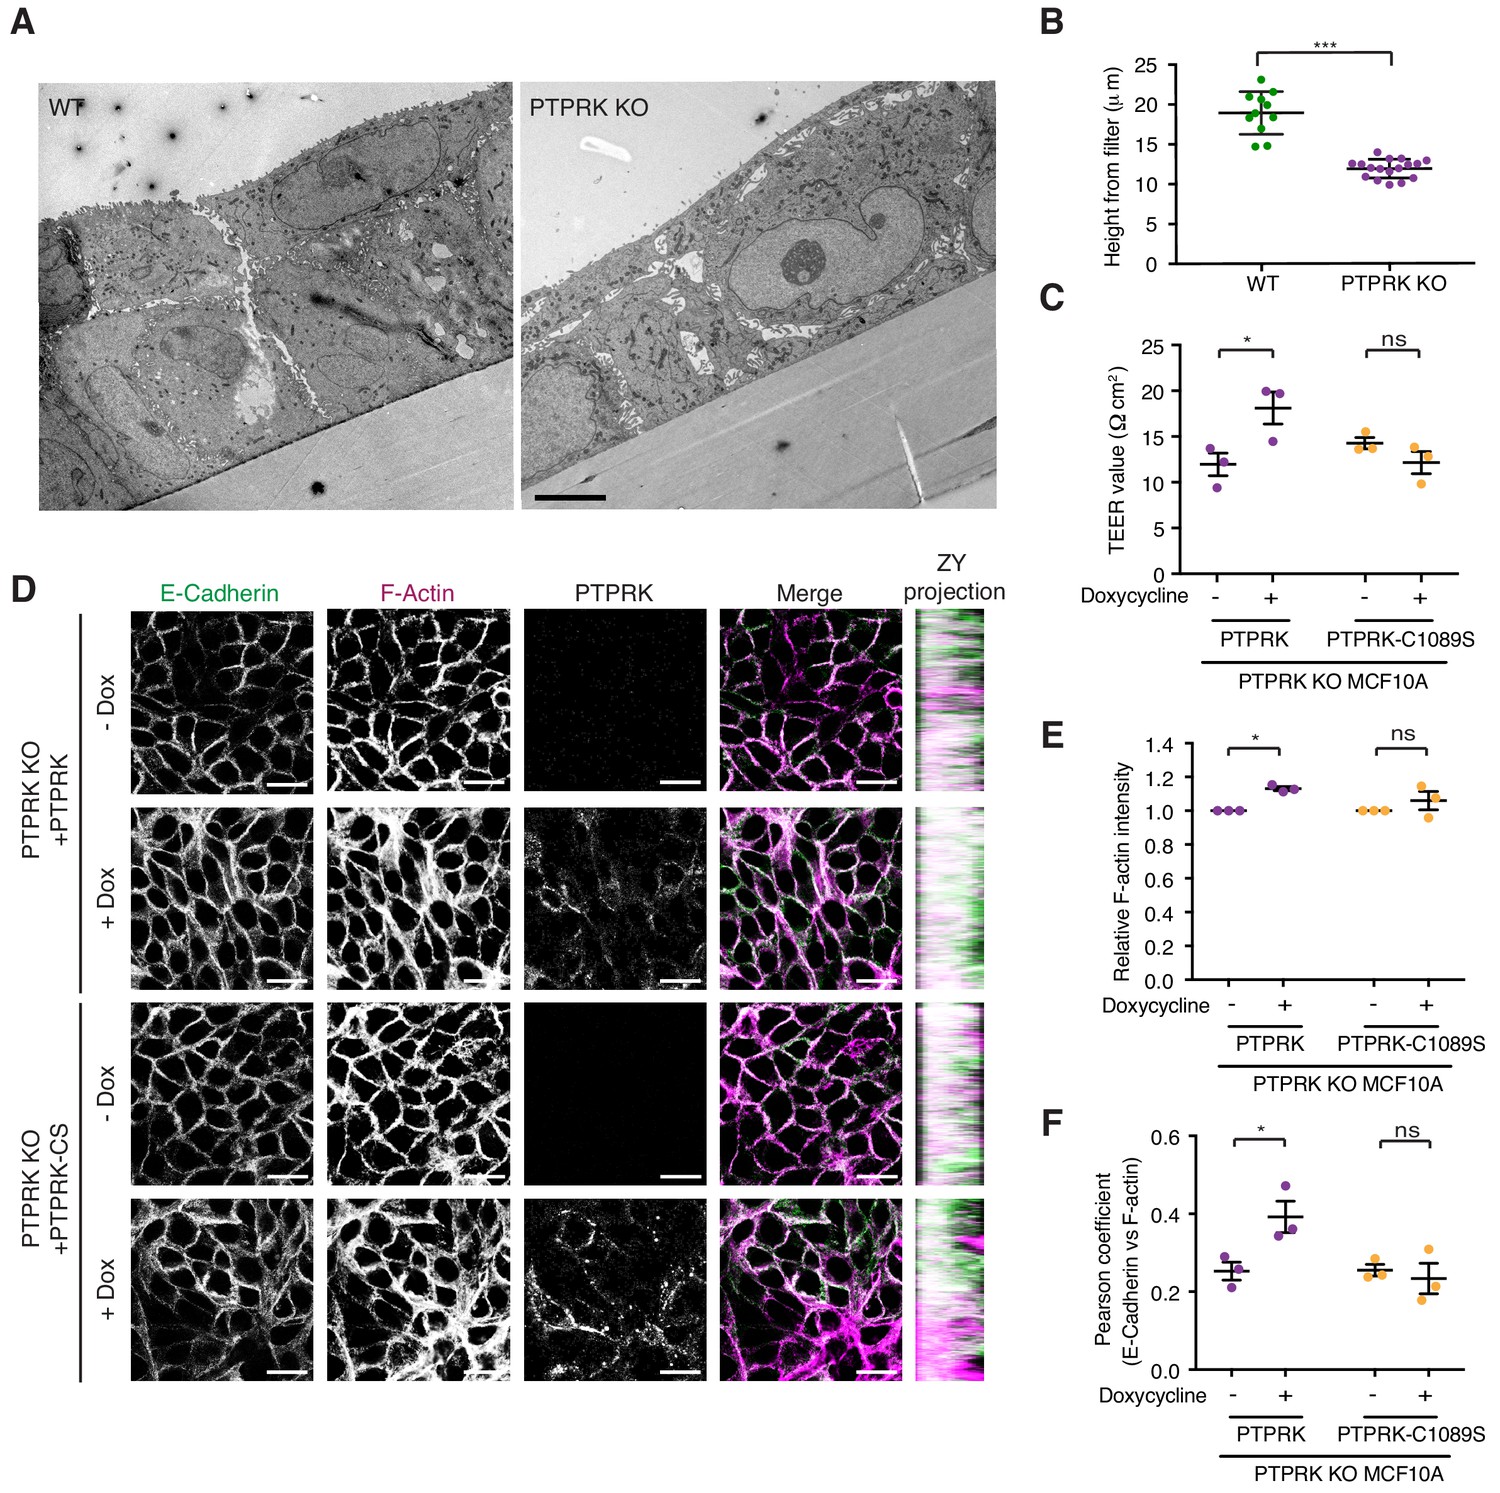
PTPRK promotes junction integrity and organization in epithelial cells.
(A) Wildtype (Left) and PTPRK KO (Right) MCF10As were cultured on transwell filters before being fixed and prepared for conventional electron microscopy (EM). Scale bar = 5 µm. (B) Quantification of cell height relative to transwell filter. Three measurements per image were averaged. Each data point relates to one EM image. Error bars denote ±SEM. Unpaired, two tailed t test ***p<0.0005. (C) Stable PTPRK KO MCF10As were grown to confluence with or without 250 ng/ml doxycycline on 0.4 µm transwell filters prior to TEER analysis. Error bars denote ±SEM (n = 3). Two-way ANOVA (Sidak's multiple comparisons test): *p<0.05. (D) Confluent PTPRK KO MCF10As, with stably-integrated doxycycline-inducible PTPRK or PTPRK-C1089S, were cultured for 6 days with or without 250 ng/ml doxycycline then fixed and stained for E-Cadherin and F-actin. A representative confocal microscopy image is shown. Scale bar = 20 µm. (E) Quantification of relative F-actin staining intensity. 10 random fields/replicate were averaged. Error bars denote ±SEM (n ≥ 3). Two-way ANOVA (Sidak's multiple comparisons test): *p<0.05 (F) Quantification of colocalization (Pearson coefficient) between E-Cadherin and F-actin staining. 10 random fields/biological replicate were averaged. Error bars denote ±SEM (n = 3). Two-way ANOVA (Sidak's multiple comparisons test): *p<0.05. See also Figure 7—figure supplement 1.
-
Figure 7—source data 1
Source data used in graphs.
Spreadsheet of normalized data from Figure 7B,C,E and F. p values were determined using a two-way ANOVA.
- https://doi.org/10.7554/eLife.44597.026
Figure 7—figure supplement 1
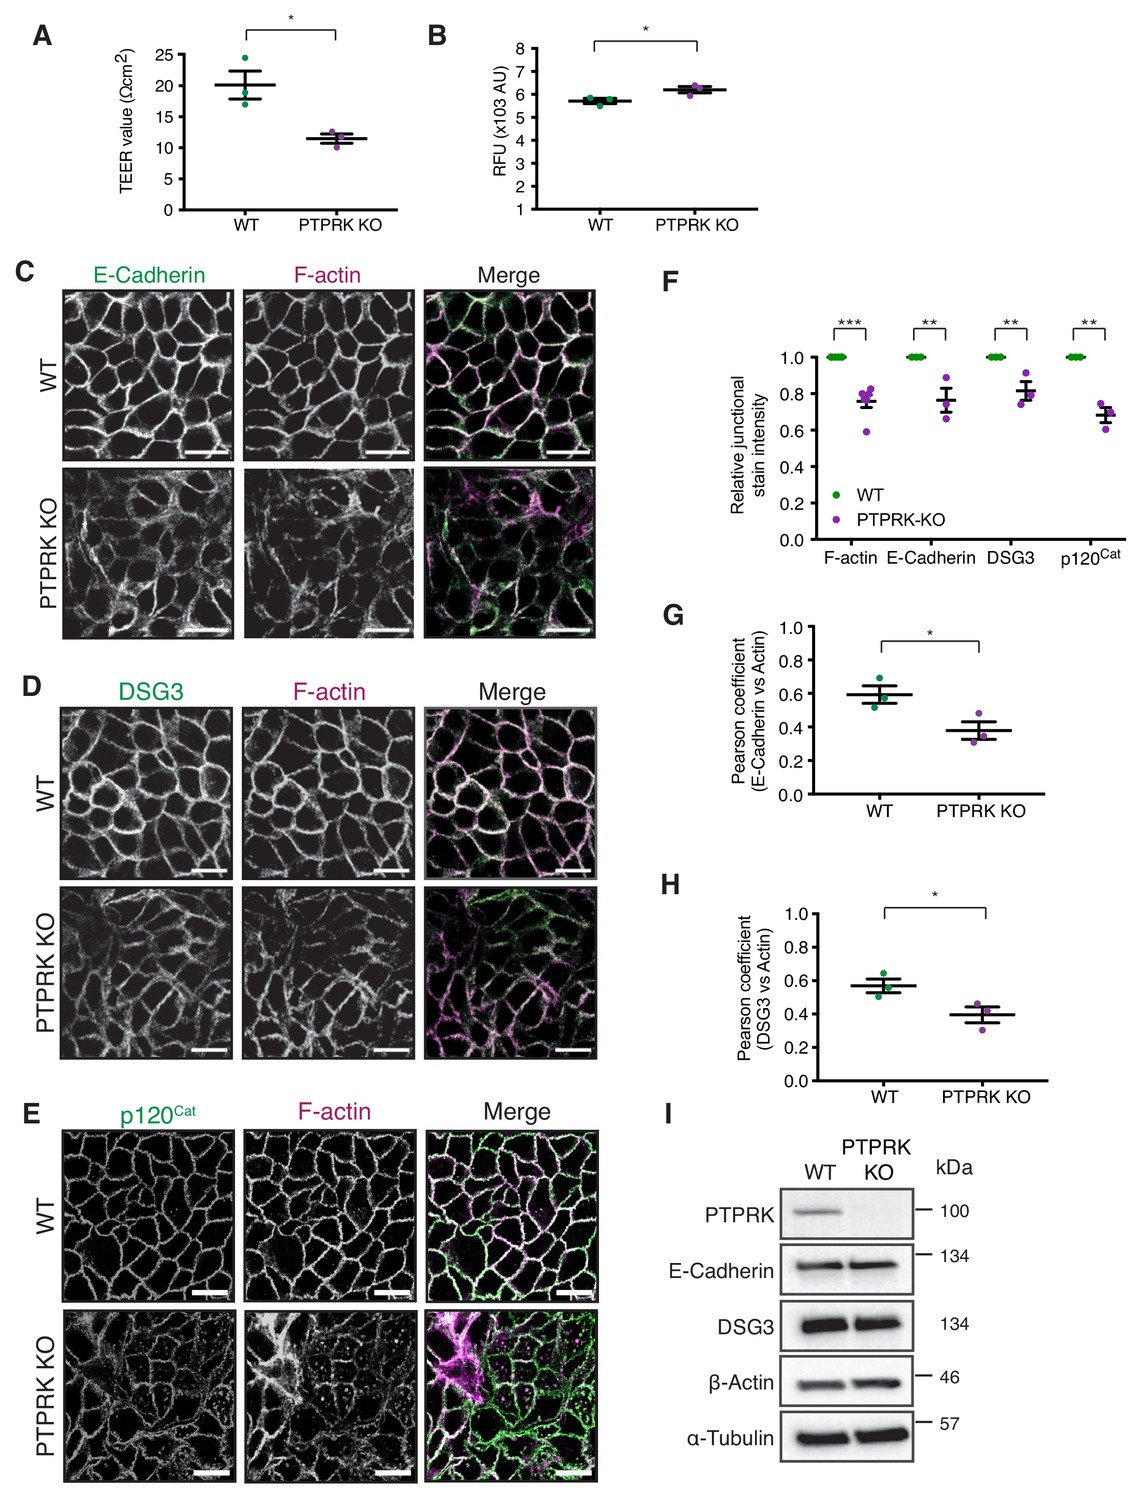
Loss of PTPRK compromises cell junction integrity.
(A) Wildtype and PTPRK KO MCF10As grown to confluence on 0.4 µm transwell filters were subjected to a media change 24 hr prior to TEER analysis. Error bars denote ±SEM (n = 3). Unpaired, two-tailed t test: *p<0.05. (B) Fluorescence intensity of the lower chamber of 0.4 µm transwell filters with wildtype and PTPRK KO MCF10As after incubation with 3 mg/ml 250 kDa FITC Dextran (added to the upper chamber) for 24 hr. (C–D) Confluent wildtype and PTPRK KO MCF10As were fixed and stained for E-Cadherin (C), DSG3 (D) or p120Cat (E) and F-actin. A representative confocal microscopy image is shown. Scale bar = 20 µm. (F) Quantification of relative F-actin, E-Cadherin, DSG3 and p120Cat staining intensity comparing wildtype and PTPRK KO MCF10As. 10 random fields/biological replicate were averaged. Error bars denote ±SEM (n ≥ 3). Two-way ANOVA (Sidak's multiple comparisons test): **p<0.005, ***p<0.0005. (G–H) Quantification of co-localization (Pearson coefficient) between E-Cadherin (F) or DSG3 (G) and F-actin staining comparing wildtype and PTPRK KO MCF10As. Error bars denote ±SEM (n = 3). Unpaired, two-tailed t test: *p<0.05. (I) Immunoblot analysis of confluent wildtype and PTPRK KO MCF10A.
Figure 7—figure supplement 2
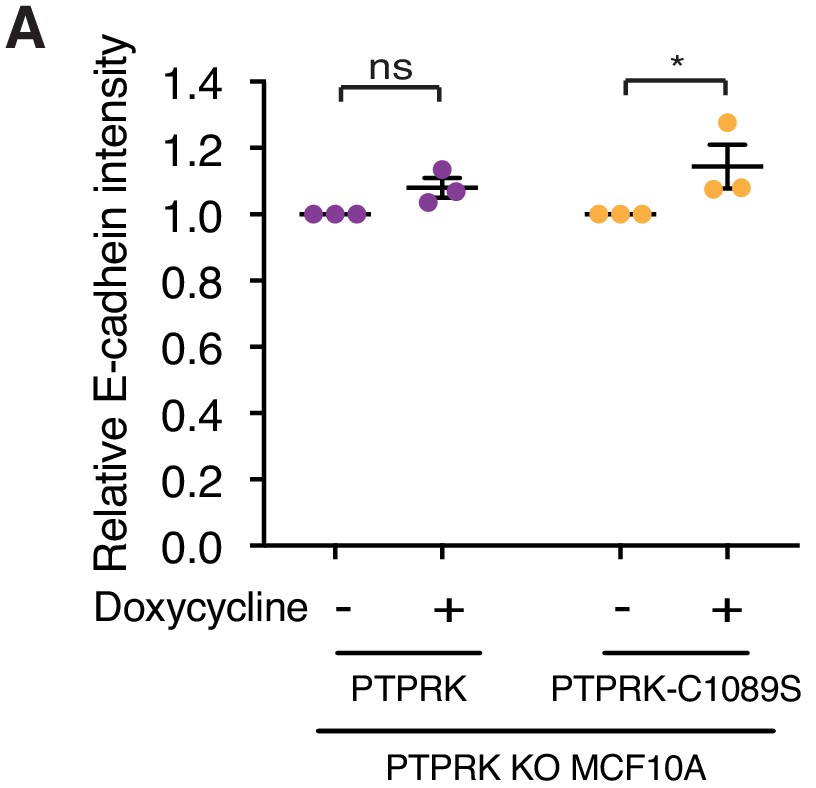
Both PTPRK and PTPRK-C1089S partially rescue E-Cadherin intensity.
(A) Quantification of relative E-Cadherin staining intensity. 10 random fields/replicate were averaged. Error bars denote ±SEM (n ≥ 3). Two-way ANOVA (Sidak's multiple comparisons test): *p<0.05.
Figure 8 with 1 supplement
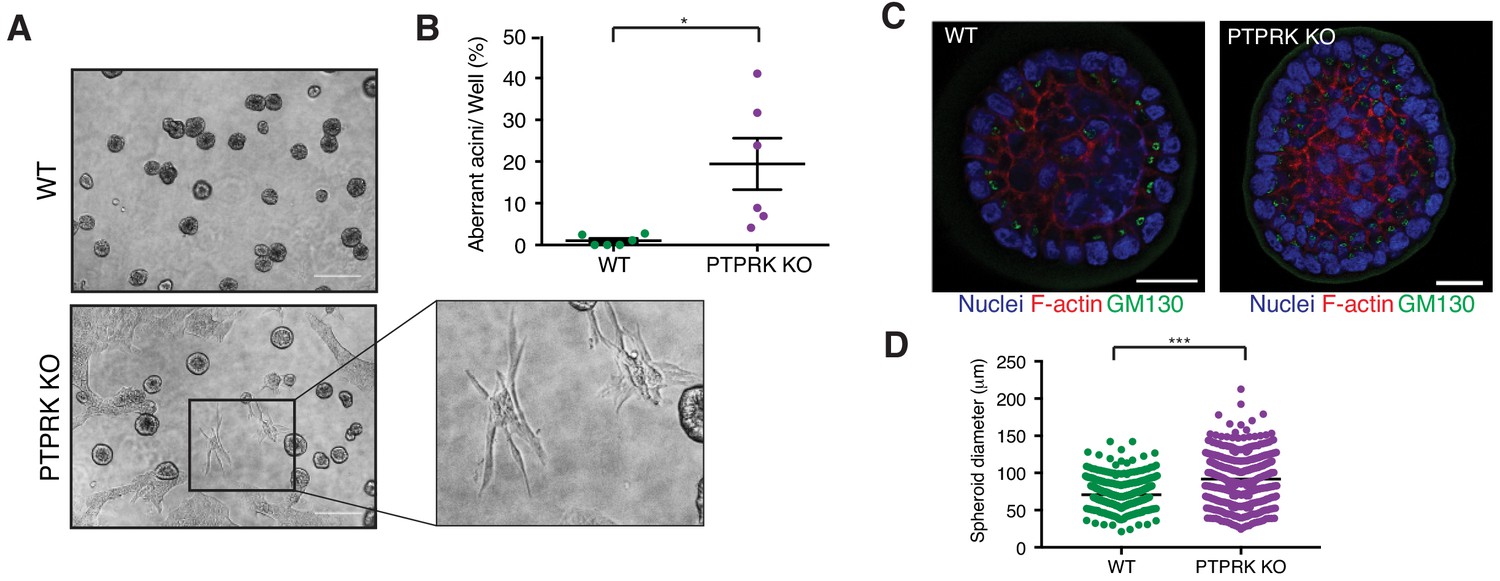
PTPRK promotes organization in epithelial cells.
(A) Phase contrast images of wildtype and PTPRK KO. MCF10A spheroids after 14 day culture in Matrigel. Scale bar = 200 µm. (B) Frequency of aberrant acini observed in six independent wells each of wildtype and PTPRK KO MCF10A spheroids. Unpaired, two-tailed t test: *p<0.05. (C) Representative images of MCF10A spheroids stained for the Golgi marker GM130, F-actin and nuclei (Hoechst), after removal from Matrigel. Scale bar = 20 µm. (D) Circles were traced over cross sections, based on the Hoechst channel, for a total of 563 WT and 551 PTPRK KO immunostained spheroids from three entire slides per genotype and diameters calculated in Zen Pro. Unpaired, two-tailed t test: ***p<0.0005. See also Figure 8—figure supplement 1.
-
Figure 8—source data 1
Source data used in graphs.
- https://doi.org/10.7554/eLife.44597.029
Figure 8—figure supplement 1
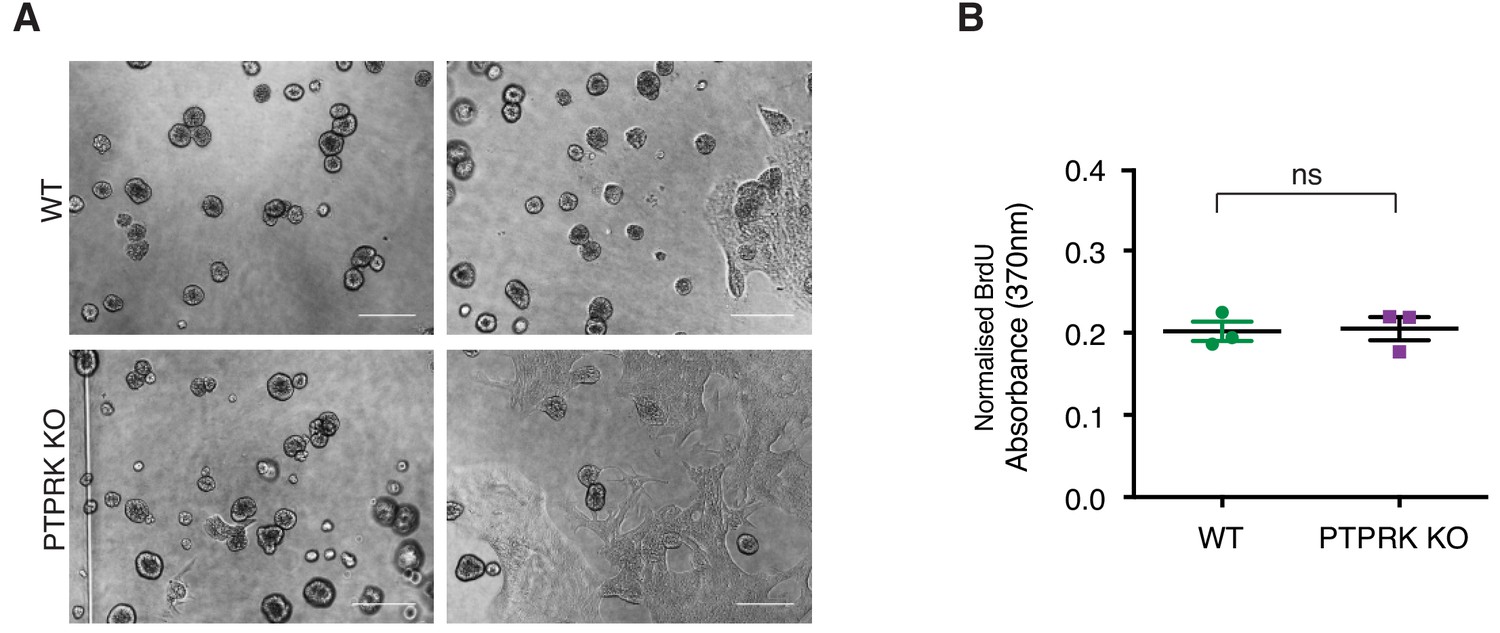
PTPRK loss perturbs epithelial organization.
(A) Phase contrast images of wildtype and PTPRK KO MCF10A spheroids after 14 day culture in Matrigel. Scale bars = 200 µm. (B) BrdU incorporation assay performed on subconfluent WT and PTPRK KO MCF10As (n = 3). Unpaired, two-tailed t test: ns = not significant.
Author response image 1
Tables
Key resources table
| Reagent type (species) or resource | Designation | Source or reference | Identifiers | Additional information |
|---|---|---|---|---|
| Gene (Homo sapiens) | PTPRK | ENSEMBL: ENST00000368213.9 | ||
| Cell line (H. sapiens) | MCF10A | ATCC | CRL-10317 | |
| Cell line (H. sapiens) | HEK293T | D Ron | N/A | |
| Cell line (H. sapiens) | HEK293 | Sigma (ECACC) | 85120602-1VL | |
| Cell line (H. sapiens) | Hs27 Fibroblasts | Sigma (ECACC) | 94041901-1VL | |
| Cell line (H. sapiens) | MCF10A PTPRK KO A4 | This study | CRISPR/Cas9 and clonal selection | |
| Cell line (H. sapiens) | MCF10A PTPRK KO E3 | This study | CRISPR/Cas9 and clonal selection | |
| Cell line (H. sapiens) | MCF10A PTPRK KO H1 | This study | CRISPR/Cas9 and clonal selection | |
| Cell line (H. sapiens) | MCF10A PTPRK KO pooled | This study | ||
| Transfected construct (H. sapiens) | MCF10A PTPRK KO pooled.tGFP | This study | Lentivirally transduced stable cell line | |
| Transfected construct (H. sapiens) | MCF10A PTPRK KO pooled.tGFP.P2A.PTPRK | This study | Lentivirally transduced stable cell line | |
| Transfected construct (H. sapiens) | MCF10A PTPRK KO pooled.tGFP.P2A.PTPRK.C1089S | This study | Lentivirally transduced stable cell line | |
| Transfected construct (H. sapiens) | MCF10A.tGFP | This study | Lentivirally transduced stable cell line | |
| Transfected construct (H. sapiens) | MCF10A.tGFP.P2A.PTPRK.ECD-TMD.BirA*-Flag | This study | Lentivirally transduced stable cell line | |
| Transfected construct (H. sapiens) | MCF10A.tGFP.P2A.PTPRK.C1089S.BirA*-Flag | This study | Lentivirally transduced stable cell line | |
| Transfected construct (H. sapiens) | MCF10A PTPRK KO pooled.nuclear mApple | This study | Lentivirally transduced stable cell line | |
| Transfected construct (H. sapiens) | MCF10A.nuclear mApple | This study | Lentivirally transduced stable cell line | |
| Antibody | Rabbit monoclonal anti-PTPRK | This study | 2 .G6 | Western blot: 1:1000 |
| Antibody | Rabbit monoclonal anti-PTPRK | This study | 2 .H4 | Western blot: 1:1000 |
| Antibody | Rabbit monoclonal anti-PTPRK | This study | 2 .H5 | Western blot: 1:1000 |
| Antibody | Rabbit monoclonal anti-PTPRK | This study | 1 .F4 | FACS (1:200) and Immunofluorescence (IF; 1:200) |
| Antibody | Mouse anti-PTPRK | Santa Cruz Biotechnology | Cat#Sc- 374315 | Western blot: 1:1000 (note: we did not observe any specific signal for PTPRK with this antibody) |
| Antibody | Rabbit anti-PARD3 | Sigma | Cat#HPA030443 (lot: C105765) | Western blot: 1:1000 |
| Antibody | Rabbit anti-PARD3 | Merck Millipore | Cat#07–330 | Western blot: 1:1000 |
| Antibody | Mouse anti-RAPGEF6 | Santa Cruz Biotechnology | Cat#sc-398642 (F-8) | Western blot: 1:1000 |
| Antibody | Mouse anti-Afadin | BD Transduction Labs | Cat#610732 | Western blot: 1:1000 |
| Antibody | Mouse anti-DLG5 | Santa Cruz Biotechnology | Cat#SC374594 (A-11) | Western blot: 1:1000 |
| Antibody | Mouse anti-PTPN14 | R and D Systems | Cat#MAB4458 | Western blot: 1:1000 |
| Antibody | Mouse anti-E-Cadherin | BD Transduction Labs | Cat#610181 | Western blot: 1:1000 IF: 1:100 |
| Antibody | Rabbit anti-b-Catenin | Cell Signaling Technology | Cat#9562S | Western blot: 1:1000 |
| Antibody | Rabbit anti-Phospho-EGFR (Y1068) | Cell Signaling Technology | Cat#3777S | Western blot: 1:1000 |
| Antibody | Rabbit anti-EGFR | Cell Signaling Technology | Cat#4267S | Western blot: 1:1000 |
| Antibody | Rabbit anti-phospho-tyrosine(P-Tyr-1000) | Cell Signaling Technology | Cat#8954 | Western blot: 1:2000 |
| Antibody | Rabbit anti-MAP4K4 | Cell Signaling Technology | Cat#5146 | Western blot: 1:1000 |
| Antibody | Rabbit anti-NUFIP2 | Bethyl Laboratories, Inc | Cat#A301-600A | Western blot: 1:1000 |
| Antibody | Rabbit anti-FMRP1 | ThermoFisher Scientific | Cat#MA5-15499 | Western blot: 1:1000 |
| Antibody | Rabbit anti-MINK1/MAP4K6 | ThermoFisher Scientific | Cat#PA5-28901 | Western blot: 1:1000 |
| Antibody | Rabbit anti-PKP4 | Bethyl Laboratories, Inc | Cat#A304-649A | Western blot: 1:1000 |
| Antibody | Mouse anti-P120 catenin | BD Transduction Laboratories | Cat#610133 | Western blot: 1:1000 IF: 1:100 |
| Antibody | Mouse anti-GM130 | BD Transduction Laboratories | Cat#610822 | Western blot: 1:1000 |
| Antibody | Rabbit anti-STAT3 | Cell Signaling Technology | Cat#4904S | Western blot: 1:1000 |
| Antibody | Rabbit anti-Paxillin | Cell Signaling Technology | Cat#12065 (D9G12) | Western blot: 1:1000 |
| Antibody | Mouse anti-Tubulin (Alpha) | Sigma | Cat#T6199 | Western blot: 1:1000 |
| Antibody | Mouse anti-PTPRM | Santa Cruz | Cat#sc-56959 | Western blot: 1:1000 |
| Antibody | Rabbit anti-PKP3 | Abcam | Cat#AB109441 | Western blot: 1:10000 |
| Antibody | Rabbit-anti-ABLIM3 | Sigma | Cat#HPA003245 | Western blot: 1:1000 |
| Antibody | Rabbit-Anti-ZO2 | ThermoFisher Scientific | Cat#711400 | Western blot: 1:1000 |
| Antibody | Rabbit-anti-Phospho-P120 catenin (Y904) | Cell Signaling Technology | Cat#2910 | Western blot: 1:1000 |
| Antibody | Rabbit-anti-Phospho-P120 catenin (Y228) | Cell Signaling Technology | Cat#2911 | Western blot: 1:1000 |
| Antibody | Rabbit polyclonal anti-Phospho-Paxillin (Y118) | Cell Signaling Technology | Cat#2541 | Western blot: 1:1000 |
| Antibody | Rabbit-anti-b-Actin | SIGMA | Cat#A2066 | Western blot: 1:1000 |
| Antibody | Mouse-anti-DSG3 | Bio-Rad | Cat#MCA2273T | Western blot: 1:5000 |
| Antibody | HRP conjugated-Donkey anti-Rabbit IgG | Jackson Immuno-Research | Cat#711-035-152 | Western blot: 1:5000 |
| Antibody | HRP conjugated- Donkey anti-Mouse IgG | Jackson Immuno-Research | Cat#711-035-152 | Western blot: 1:5000 |
| Antibody | HRP conjugated- Mouse anti-Rabbit IgG (Conformation specific) | Cell Signaling Technology | Cat#5127S | Western blot: 1:2000 |
| Antibody | Atto-488 Goat Anti-mouse IgG | Sigma | Cat#62197 | IF: 1:400 |
| Antibody | Atto-488 Goat Anti-mouse IgG | Sigma | Cat#62197 | IF: 1:400 |
| Antibody | Alexa Fluor-647 Goat Anti Rabbit IgG | Jackson Immuno-Research | Cat#111-605-003 | IF: 1:400 |
| Recombinant DNA reagent | pCW57.tGFP.P2A.MCS | Addgene | Cat#71783 | |
| Recombinant DNA reagent | pRK.HA.PTPRK.flag | Genentech | Corresponds to Uniprot identifier: Q15262-3 | |
| Recombinant DNA reagent | pRK.PTPRK(1-752).IgG1 | Genentech | ||
| Recombinant DNA reagent | pET15b | J. Deane | ||
| Recombinant DNA reagent | pSP.Cas9.(BB).eGFP | D Ron | ||
| Recombinant DNA reagent | pMD2.G | Addgene | Cat#12259 | |
| Recombinant DNA reagent | psPAX2 | Addgene | Cat#12260 | |
| Recombinant DNA reagent | pLenti-puro | Addgene | Cat#39481 | |
| Recombinant DNA reagent | PTPRK-BirA-R118G-Flag | A-C Gingras | ||
| Recombinant DNA reagent | pCW57.tGFP.P2A.PTPRK | This study | ||
| Recombinant DNA reagent | pCW57.tGFP.P2A.PTPRK.C1089S | This study | ||
| Recombinant DNA reagent | pCW57.tGFP.P2A.PTPRK(1-785).BirA-R118G.Flag | This study | ||
| Recombinant DNA reagent | pCW57.tGFP.P2A.PTPRK.C1089S.BirA-R118G.Flag | This study | ||
| Recombinant DNA reagent | pET15b.His.TEV.Avi | This study | ||
| Recombinant DNA reagent | pET15b.His.TEV.Avi.PTPRK.ICD | This study | ||
| Recombinant DNA reagent | pET15b.His.TEV.Avi.PTPRK.ICD.D1057A | This study | ||
| Recombinant DNA reagent | pET15b.His.TEV.Avi.PTPRK.ICD.C1089S | This study | ||
| Recombinant DNA reagent | pET15b.His.TEV.Avi.PTPRK.D1 | This study | ||
| Recombinant DNA reagent | pET15b.His.TEV.Avi.PTPRK.D2 | This study | ||
| Recombinant DNA reagent | pET15b.His.TEV.Avi. PTPRK.D2.triple | This study | Mutations: A1346P, S1347D, L1384S, E1427Q, A1428T | |
| Recombinant DNA reagent | pET15b.His.TEV.Avi.PTPRM.ICD | This study | ||
| Recombinant DNA reagent | pET15b.His.TEV.Avi.PTPRM.D1 | This study | ||
| Recombinant DNA reagent | pET15b.His.TEV.Avi. PTPRK-D1_K-D2. | This study | ||
| Recombinant DNA reagent | pET15b.His.TEV.Avi.PTPRM-D1_M-D2 | This study | ||
| Recombinant DNA reagent | pET15b.His.TEV.Avi.PTPRK-D1_M-D2. | This study | ||
| Recombinant DNA reagent | pET15b.His.TEV.Avi.PTPRM-D1_K-D2. | This study | ||
| Recombinant DNA reagent | pET15b.His.TEV.Avi.Src.sbSH2 | This study | ||
| Recombinant DNA reagent | pET15b.His.TEV.Avi.Grb2.sbSH2 | This study | ||
| Recombinant DNA reagent | pSP.Cas9.PTPRK.sgRNA1 | This study | ||
| Recombinant DNA reagent | pSP.Cas9.PTPRK.sgRNA2 | This study | ||
| Sequence-based reagent | ON-TARGETplus Human PTPRK siRNA | Dharmacon, GE Healthcare | Cat#J-004204–06 | |
| Sequence- based reagent | ON-TARGETplus Non-targeting pool siRNA | Dharmacon, GE Healthcare | Cat#D-001810-10-05 | |
| Sequence- based reagent | PTPRK CRISPR, BbsI.PTPRKgRNA1.Fwd | SIGMA | CACCGCATGGATACGACTGCGGCGG | |
| Sequence- based reagent | PTPRK CRISPR, BbsI.PTPRKgRNA1.Rev | SIGMA | AAACCCGCCGCAGTCGTATCCATGC | |
| Sequence- based reagent | PTPRK CRISPR, BbsI.PTPRKgRNA2.Fwd | SIGMA | CACCGATCTCGGGTGGTAGATAATG | |
| Sequence- based reagent | PTPRK CRISPR, BbsI.PTPRKgRNA2.Rev | SIGMA | AAACCATTATCTACCACCCGAGATC | |
| Sequence- based reagent | TaqMan probe: Hs02338565_gH (RPL19) | Thermo Fisher Scientific | Cat#4331182 | |
| Sequence- based reagent | TaqMan probe: Hs00267788_m1 (PTPRK) | Thermo Fisher Scientific | Cat#4331182 | |
| Sequence- based reagent | TaqMan probe: Hs00267809_m1 (PTPRM) | Thermo Fisher Scientific | Cat#4331182 | |
| Sequence- based reagent | TaqMan probe: Hs00179247_m1 (PTPRT) | Thermo Fisher Scientific | Cat#4331182 | |
| Sequence- based reagent | TaqMan probe: Hs00963911_m1 (PTPRU) | Thermo Fisher Scientific | Cat#4351372 | |
| Peptide, recombinant protein | DADE-pTyr-LIPQQG- phospho-peptide | Cambridge Research Biochemicals | Cat#crb1000746 | |
| Peptide, recombinant protein | END-pTyr-INASL-phospho-peptide | Cambridge Research Biochemicals | Cat#crb1000745 | |
| Peptide, recombinant protein | Catalase | Sigma | Cat#C134514 | |
| Peptide, recombinant protein | Cholera Toxin | Sigma | Cat#C-8052 | |
| Peptide, recombinant protein | Insulin | Sigma | Cat#I-1882 | |
| Peptide, recombinant protein | Epidermal Growth Factor | Peprotech | Cat#AF-100-15-1MG | |
| Peptide, recombinant protein | Lysyl endopeptidase (LysC) | Wako | Cat#129–02541 | |
| Peptide, recombinant protein | Trypsin (proteomics grade) | Thermo Fisher Scientific | Cat#90058 | |
| Commercial assay or kit | BIOMOL Green reagent | ENZO | Cat#BML-AK111-0250 | |
| Commercial assay or kit | Phosphate standard | ENZO | Cat#BML-KI102-0001 | |
| Commercial assay or kit | Q5 High-Fidelity DNA Polymerase | New England Biolabs | Cat#M0491S | |
| Commercial assay or kit | Phusion Hot Start II DNA polymerase | Thermo Fisher Scientific | Cat#F549L | |
| Commercial assay or kit | EZ-ECL substrate | Geneflow | Cat#K1-0170 | |
| Commercial assay or kit | NuPAGE MES (2-ethanesulfonic acid) SDS running buffer | ThermoFisher Scientific | Cat#NP0002 | |
| Commercial assay or kit | InstantBlue | Expedeon | Cat#ISB1L | |
| Commercial assay or kit | Phosphatase inhibitor cocktail | Roche | Cat#04906845001 | |
| Commercial assay or kit | TaqMan Universal Master Mix II | Applied Biosystems | Cat#4440040 | |
| Commercial assay or kit | MycoAlertTM PLUS Mycoplasma Detection Kit | Lonza | #LT07-705 | |
| Commercial assay or kit | MycoProbe Mycoplasma Detection Kit | R and D Systems | #CUL001B | |
| Chemical compound, drug | Hydrogen peroxide | Thermo Fisher Scientific | Cat#H/1750/15 | |
| Chemical compound, drug | Sodium orthovanadate | Alfa Aesar | Cat#J60191 | |
| Chemical compound, drug | 250 kDa-FITC-dextran | Sigma | Cat#FD250S-100MG | |
| Chemical compound, drug | Para-Nitrophenol-phosphate (pNPP) | New England Biolabs | Cat#P0757 | |
| Chemical compound, drug | IPTG | Generon | Cat#GEN-S-02122 | |
| Chemical compound, drug | D-biotin | Sigma | Cat#B4639 | |
| Chemical compound, drug | L-glutamine | Sigma | Cat#G7513 | |
| Chemical compound, drug | Hydrocortisone | Sigma | Cat#H-0888 | |
| Chemical compound, drug | Puromycin | Thermo Fisher Scientific | Cat#A11138-03 | |
| Chemical compound, drug | Phosphate free H2O | Thermo Fisher Scientific | Cat#10977–035 | |
| Chemical compound, drug | 8M Guanidine HCl | Thermo Fisher Scientific | Cat#24115 | |
| Chemical compound, drug | EPPS pH 8.5 | Alfa Aesar | Cat#561296 | |
| Chemical compound, drug | Trifluoroacetic Acid (TFA) | Thermo Fisher Scientific | Cat#28904 | |
| Chemical compound, drug | Acetonitrile | VWR | Cat#8364.290 | |
| Chemical compound, drug | Sodium phosphate dibasic (Na2HPO4) | Acros Organics | Cat#343811000 | |
| Chemical compound, drug | NH4OH | Acros Organics | Cat#460801000 | |
| Chemical compound, drug | Methanol-free 16% (w/v) paraformaldehyde (PFA) | Thermo Fisher Scientific | Cat#28906 | |
| Software, algorithm | Maxquant | Computational Systems Biochemistry | Max Planck Institute of Biochemistry | |
| Software, algorithm | Perseus | Computational Systems Biochemistry | Max Planck Institute of Biochemistry | |
| Software, algorithm | FIJI/ImageJ | Laboratory for Optical and Computational Instrumentation | University of Wisconsin-Madison | |
| Software, algorithm | Zen Blue | Zeiss | ||
| Software, algorithm | Zen Black | Zeiss | ||
| Software, algorithm | Graphpad | Prism | ||
| Software, algorithm | Chimera | UCSF | ||
| Other | HRP-conjugated Streptavidin | Thermo Fisher Scientific | Cat#434323 | |
| Other | STABLE competent E. coli | NEB | Cat#C3040I | |
| Other | DH5alpha competent E. coli | Invitrogen | Cat#18265017 | |
| Other | BL21 DE3 Rosetta E. coli | J Deane | N/A | |
| Other | DMEM | Thermo Fisher Scientific | Cat#41965–039 | |
| Other | Ham's F-12 | Sigma | Cat#N4888 | |
| Other | Horse Serum | Thermo Fisher Scientific | Cat#16050–122 | |
| Other | Fibroblast growth medium (FGM) | Promocell | Cat#C-23010 | |
| Other | Fetal Bovine Serum | Sigma | Cat#F7524-500ml | |
| Other | Trypsin-EDTA solution | Sigma | Cat#T3924 | |
| Other | GeneJuice transfection reagent | Merck Millipore | Cat#70967–3 | |
| Other | EDTA-free protease inhibitors | Roche | Cat#11836170001 | |
| Other | Lipofectamine RNAiMax | Invitrogen | Cat#13778075 | |
| Other | OptiMEM | Thermo Fisher Scientific | Cat#31985070 | |
| Other | Lipofectamine LTX | ThermoFisher Scientific | Cat#15338100 | |
| Other | Protein G agarose beads | Merck Millipore | Cat#16–266 | |
| Other | Ni-NTA agarose | QIAGEN | Cat#1018244 | |
| Other | Streptavidin-coated magnetic beads | New England Biolabs | Cat#S1420S | |
| Other | Streptavidin agarose | ThermoFisher Scientific | Cat#20357 | |
| Other | DMEM SILAC media | Thermo Fisher Scientific | Cat#PI89985 | |
| Other | Ham's F-12 SILAC media | Thermo Fisher Scientific | Cat#88424 | |
| Other | Heavy Arginine + 10 | Sigma | Cat#608033–250 mg | |
| other | Heavy Lysine + 8 | Sigma | Cat#608041–100 mg | |
| Other | Proline | Sigma | Cat#P0380 | |
| Other | Light Arginine | Sigma | Cat#A5006 | |
| Other | Light Lysine | Sigma | Cat#L5501 | |
| Other | Hoechst 33342 | Thermo Fisher Scientific | Cat#62249 | |
| Other | BODIPY 558/568 phalloidin | Invitrogen | Cat#B3475 | IF: 1:400 |
| Other | ProLong Gold antifade | Invitrogen | Cat#P36934 | |
| Other | Normal Serum Block | BioLegend | Cat#927502 | |
| Other | Matrigel | Corning | Cat#356231 | |
| Other | 0.2 mm nitrocellulose membrane | GE Healthcare | Cat#15289804 | |
| Other | 0.4 mm pore size Transwell filter | Corning | Cat#353095 | |
| Other | 24-well companion plates for Transwell filters | Corning | Cat#353504 | |
| Other | Millicell ERS-2 Volt/Ohm meter | Merck Millipore | Cat#MERS00002 | |
| Other | Superdex 200 16/600 column | GE Healthcare | Cat#28-9893-35 | |
| Other | Superdex 75 16/600 column | GE Healthcare | Cat#28-9893-33 | |
| Other | Ultracel-3K regenerated cellulose centrifugal filter | Merck Millipore | Cat#UFC900324 | |
| Other | Ultracel-10 K regenerated cellulose centrifugal filter | Merck Millipore | Cat#UFC901024 | |
| Other | Ultracel-30 K regenerated cellulose centrifugal filter | Merck Millipore | Cat#UFC903024 | |
| Other | NuPAGE 4–12% Bis-Tris gel | Thermo Fisher Scientific | Cat#NP0321BOX | |
| Other | 1.5 ml low protein binding centrifuge tubes | Eppendorf | Cat#0030 108. 116 | |
| Other | 1cc/50 mg Sep-Pak Vac tC18 cartridges | Waters | Cat#WAT054960, | |
| Other | 1.5 ml Diagenode sonicator tubes | Diagenode | Cat#C30010010 | |
| Other | 5 ml low protein binding centrifuge tubes | Eppendorf | Cat#0030 108.302 | |
| Other | 2 ml low protein binding centrifuge tubes | Thermo Fisher Scientific | Cat#88379 | |
| Other | Graphite spin columns | Thermo Fisher Scientific | Cat#88302 | |
| Other | Titansphere Phos-TiO Tips (200 ml/3 mg) | GL Sciences Inc | Cat#5010–21311 | |
| Other | 18 mm x 18 mm,1.5 mm thick high- performance coverslips | Zeiss | Cat#474030-9000-000 |
Additional files
-
Transparent reporting form
- https://doi.org/10.7554/eLife.44597.030
Download links
A two-part list of links to download the article, or parts of the article, in various formats.
Downloads (link to download the article as PDF)
Open citations (links to open the citations from this article in various online reference manager services)
Cite this article (links to download the citations from this article in formats compatible with various reference manager tools)
The homophilic receptor PTPRK selectively dephosphorylates multiple junctional regulators to promote cell–cell adhesion
eLife 8:e44597.
https://doi.org/10.7554/eLife.44597


