Mammalian cell growth dynamics in mitosis
- University College London, United Kingdom
- Massachusetts Institute of Technology, United States
Figures
Figure 1 with 2 supplements
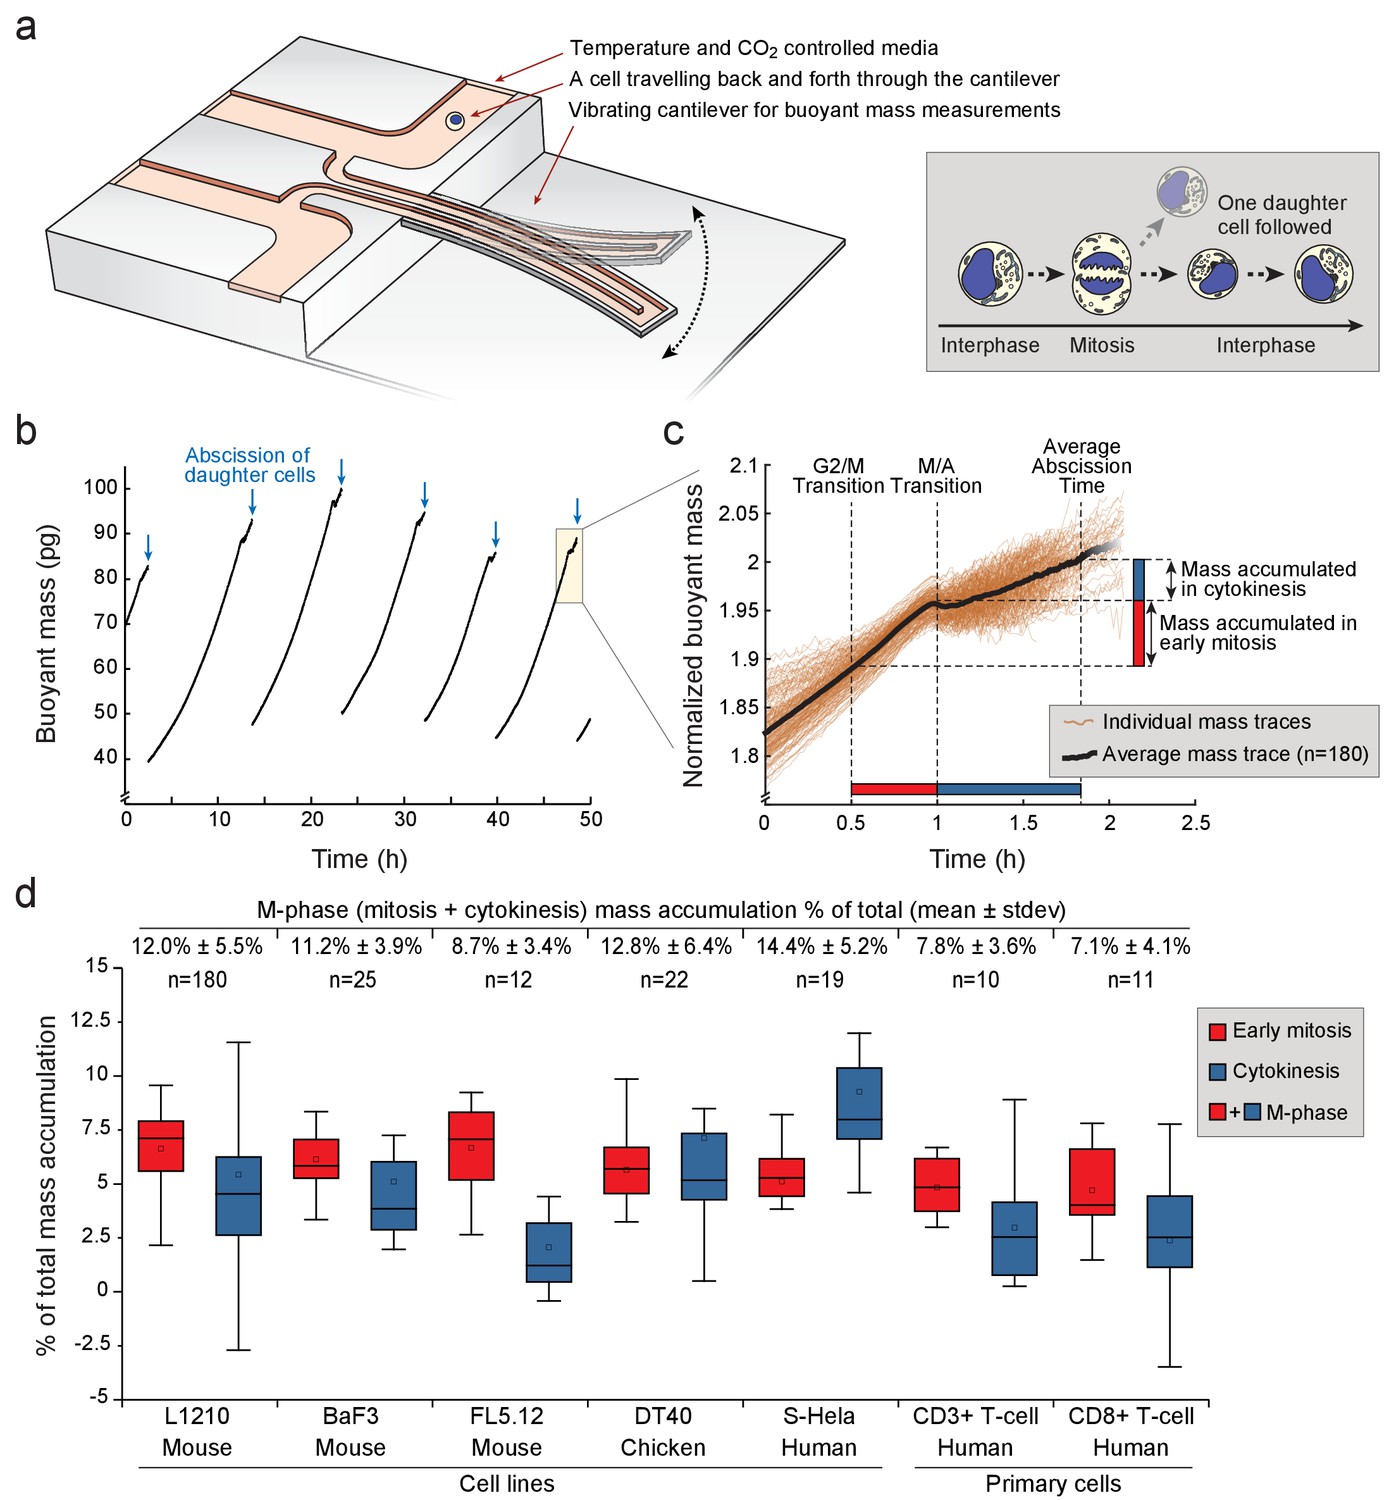
Various animal cell types grow during mitosis and cytokinesis.
(a) Left, schematic of a suspended microchannel resonator (SMR). Single-cell buoyant mass is repeatedly measured as the cell flows back and forth through the vibrating cantilever. Right, at cell division, one of the daughter cells is randomly selected and monitored, while the other daughter cell is discarded from the SMR. (b) Buoyant mass trace of a single L1210 cell and its progeny over five full generations. The interdivision time (~9 hr) for cells growing in the SMR and in normal cell culture condition is equivalent. Blue arrows indicate the abscissions of daughter cells. (c) Overlay of 180 individual L1210 cell buoyant mass traces (transparent orange) and the average trace (black) around mitosis. Each mass trace has been normalized so that the typical cell abscission mass is 2. (d) Mass accumulation in mitosis (before metaphase/anaphase transition, red) and cytokinesis (blue) relative to the total mass accumulated during the cell cycle for various animal cell types Total relative mass accumulation in M-phase (sum of mitosis and cytokinesis) is indicated on top. Note that while the relative mass accumulation in cytokinesis varies between cell types, all cell types display similar mass accumulation % in early mitosis. n refers to the number of individual cells analyzed. Boxplot line: median, box: interquartile range, whiskers: ± 1.5 x interquartile range.
-
Figure 1—source data 1
L1210 buoyant mass measurement data.
- https://doi.org/10.7554/eLife.44700.005
Figure 1—figure supplement 1

Suspended microchannel resonator (SMR) setups and noise characterization.
(a) Left, schematic of automated fluid control strategy for continuous single-cell mass measurements. Steps in order: 1) A single cell (pink circle) flows left to right. Flow direction is depicted in blue dashed lines. 2) Once cell reaches right side of the cantilever, flow is stopped (~50 s). 3) Flow direction is reversed, and the cell flows to the left side. 4) Flow is stopped again (~50 s). These steps (1-4) are repeated to continuously measure the buoyant mass of the cell as it grows within the SMR. Right, schematic of SMR resonant frequency readout during steps depicted on left. Cell buoyant mass (i.e. height of the two side peaks) increases between each measurement, which corresponds to cell growth. (b) SMR measurement noise quantification by repeated buoyant mass measurements of a single 12 µm polystyrene bead. (n = 102 repeated measurements). (c) Representative 40 min buoyant mass trace of a L1210 cell (n = 180 individual cells). Pink dots depict each measurement and gray error bars depict the 99% confidence interval (CI) obtained from the repeated bead measurement shown in (b). (d) Orientation-dependent noise in mass measurements. Representative buoyant mass trace of a L1210 near mitosis is shown (n = 180 individual cells). Before anaphase L1210 cells are highly spherical and orientation-dependent noise is minimal (left inset, red box). The SD is comparable to the noise obtained from repeated bead measurement. After cell elongation (singlet to doublet), noise increases due to orientation-dependent error (right inset, green box). See Materials and methods for additional details. (e) Cell elongation induced buoyant mass measurement bias in cytokinesis. Representative buoyant mass trace of a L1210 near mitosis is shown with (red) and without (grey) the cell elongation correction in data analysis (n = 180 individual cells). The yellow area represents the duration of cell elongation, as in panel (d). See Materials and methods for additional details.
Figure 1—figure supplement 2
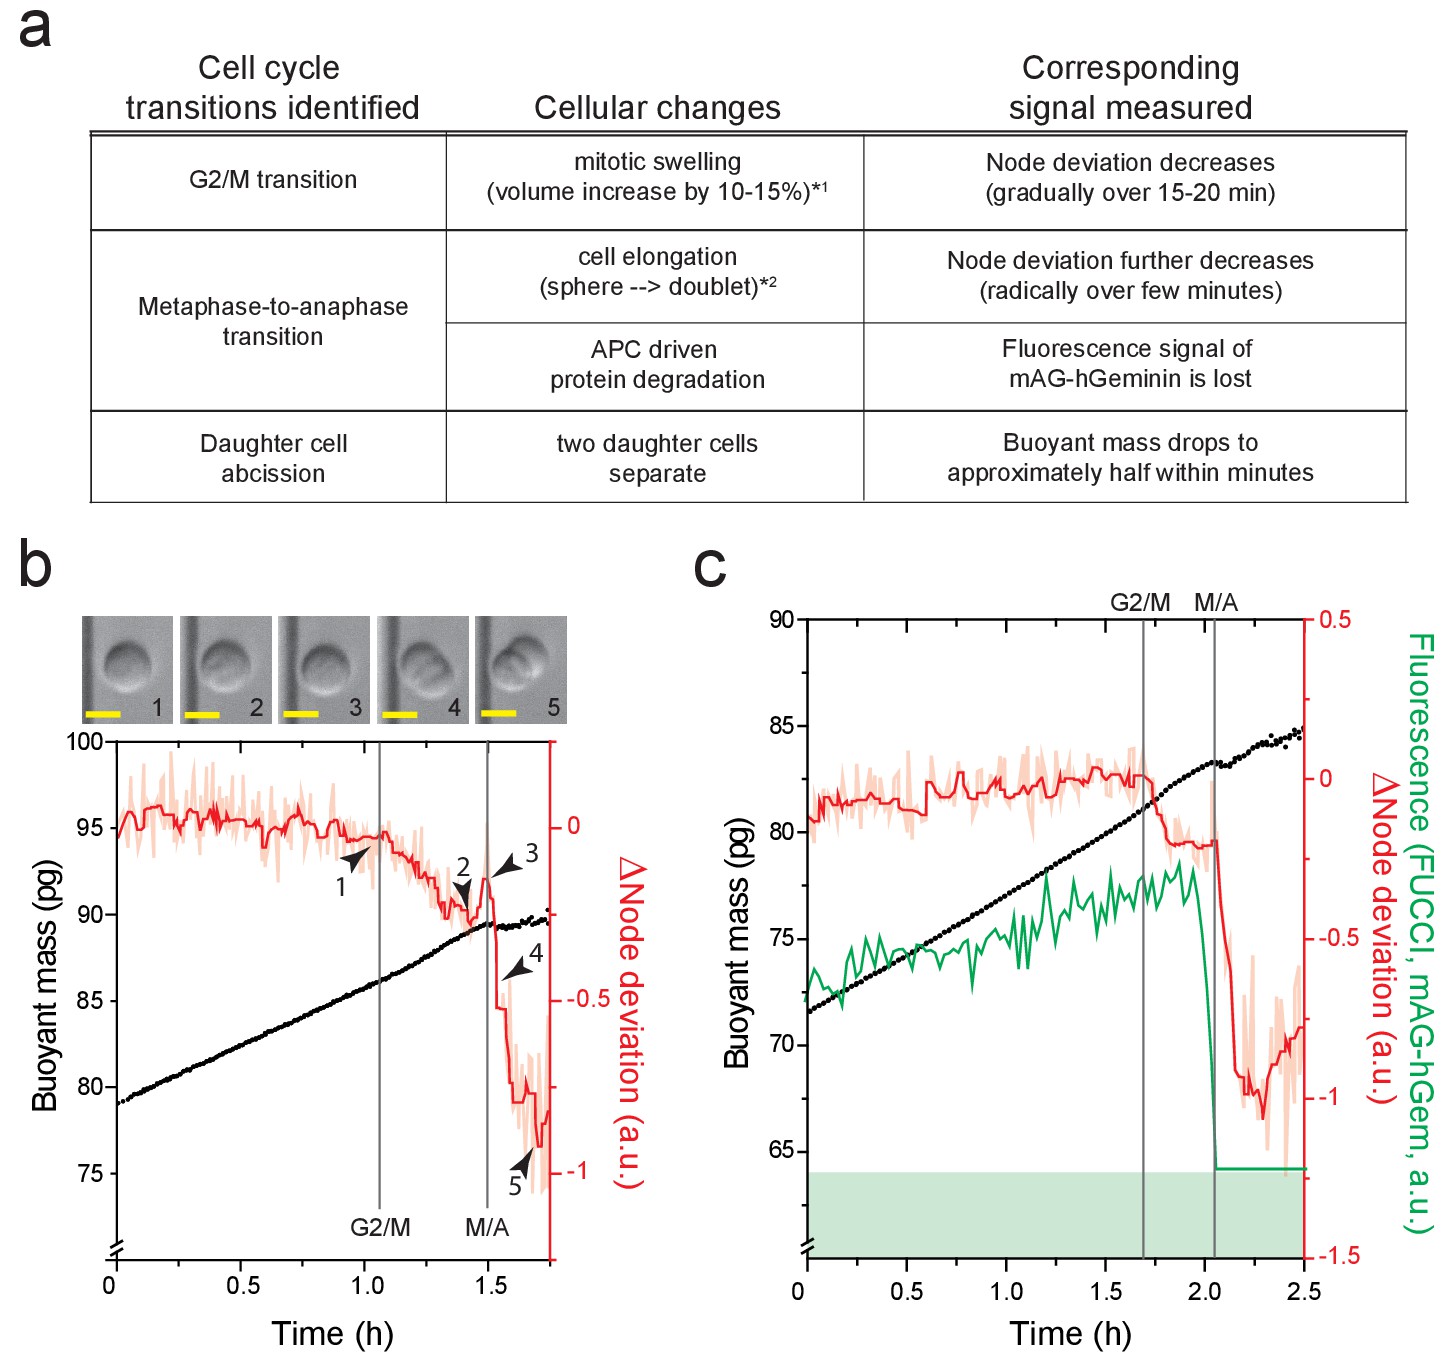
Detection of cell cycle transitions.
(a) A table summarizing cellular changes and corresponding signals measured in SMR. (*one refers to Son et al., 2015a; *two refers to Kang et al., 2019). Node deviation is an acoustics-based measurement that depends on cell shape and stiffness (Kang et al., 2019). (b) Example buoyant mass (black) and node deviation (raw: light red, filtered: red) traces of a L1210 during G2 and M-phase (n = 180 individual cells). ∆Node deviation represents a change in node deviation compared to median of first 15 data points. Node deviation decreases as a cell enters mitosis (arrowhead #1) due to cell swelling (Kang et al., 2019), which starts immediately after mitotic entry (Son et al., 2015a; Zlotek-Zlotkiewicz et al., 2015). This is followed by another rapid decrease in node deviation after metaphase-to-anaphase transition (arrowheads #3 and #4). Vertical lines mark G2/M and metaphase-to-anaphase (M/A) transition, respectively. A cell morphology acquired by on-chip imaging at indicated time points (arrow heads and numbers) are shown on top. Scale bars denote 10 µm. (c) Example buoyant mass (black), node deviation (raw: light red, filtered: dark red) and FUCCI (green, mAG-hGem) traces of a L1210 FUCCI cell during G2 and M-phase (n = 12 individual cells). Fluorescence detection limit of our system is shown by a green band in the bottom. An abrupt loss of FUCCI signal (degradation of mAG-hGem) marks the metaphase-to-anaphase transition.
Figure 2 with 2 supplements
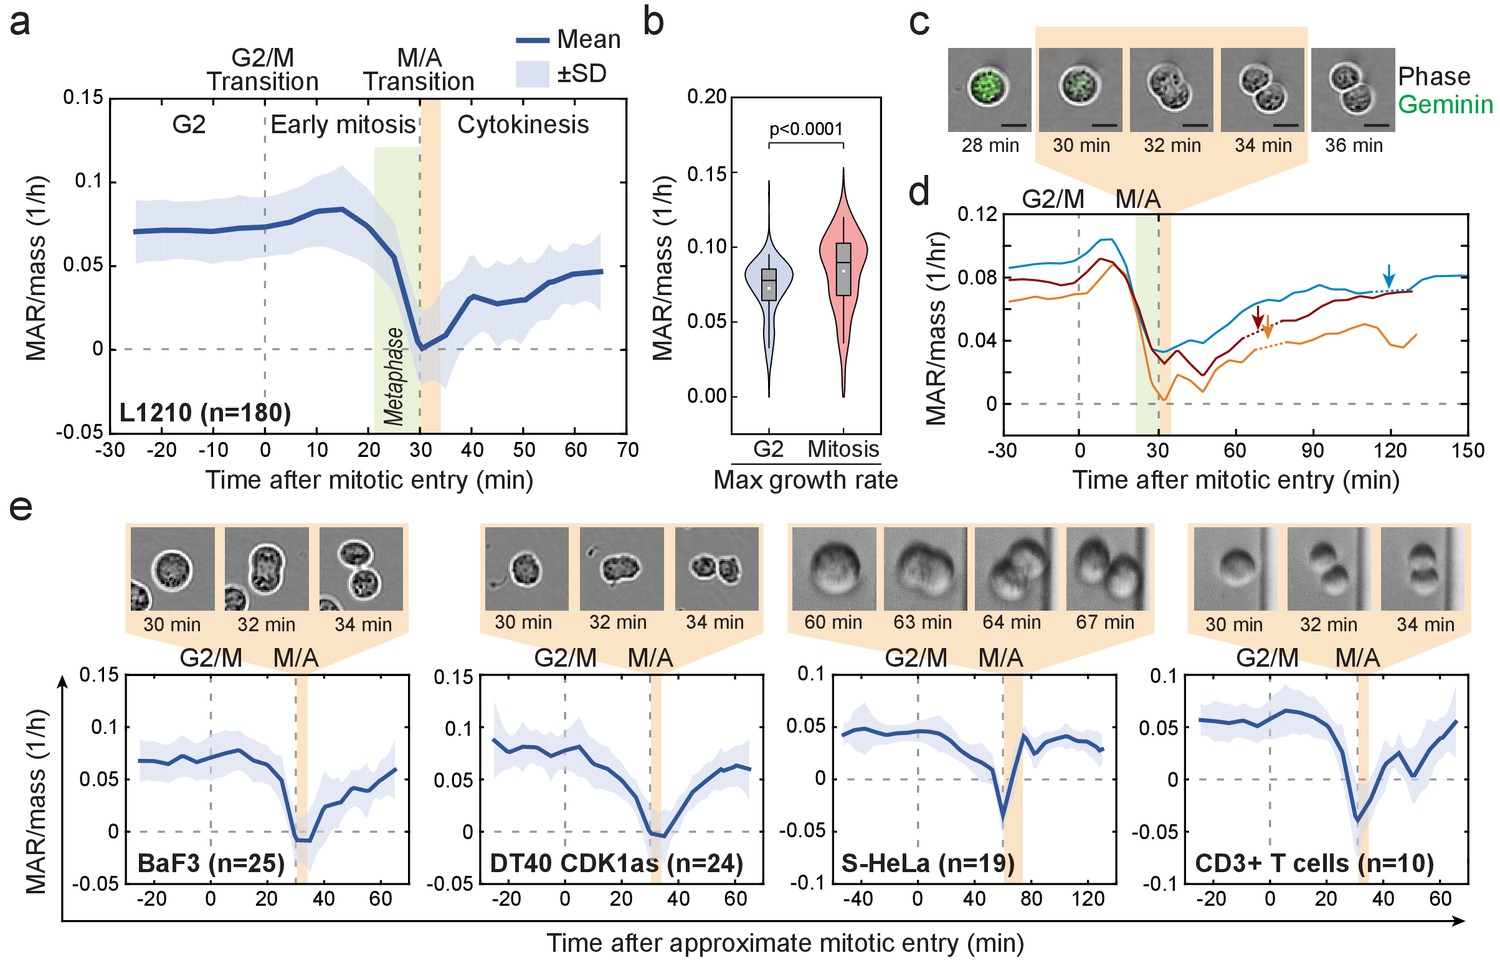
Cell mass accumulation persists through prophase, stops as cells approach metaphase-to-anaphase transition and recovers during late cytokinesis.
(a) Mass-normalized mass accumulation rate (MAR) of L1210 cells in late G2 and M-phase. G2/M and metaphase-to-anaphase transitions are indicated with dashed vertical lines. Typical durations of metaphase and cell elongation (singlet to doublet) are indicated in green and light brown areas, respectively. n refers to number of individual cells analyzed. (b) Quantification of L1210 cell maximal growth rate in late G2 and in mitosis (n = 180 cells). p-Values obtained using two-tailed Welch’s t-test. In boxplots, line: median, box: interquartile range, whiskers: 5–95%. (c) Representative L1210 cell phase contrast (grey) and mAG-hGeminin cell cycle reporter (green) images (n = 18 cells). Times correspond to (a) and (d). Note that the physical separation of daughter cells takes place when cells are not accumulating mass. (d) Examples of individual L1210 mass-normalized MAR traces in late G2, M-phase and early G1. Arrows indicate the final abscission of daughter cells, around which mass-normalized MAR is indicated with dashed lines. M/A denotes the metaphase-to-anaphase transition, G2/M denotes the approximate mitotic entry, both of which are indicated with dashed vertical lines. (e) Mass-normalized MAR of indicated cell types along with representative images displaying the duration of the physical separation of daughter cells. BaF3 and DT40 cells were imaged separately, whereas S-HeLa and CD3 +T cells were imaged on-chip simultaneously with MAR measurements. M/A denotes the metaphase-to-anaphase transition, G2/M denotes the approximate mitotic entry, both of which are indicated with dashed vertical lines. Solid dark blue lines indicate the mean and light blue areas represent ± SD. n refers to number of individual cells analyzed.
Figure 2—figure supplement 1
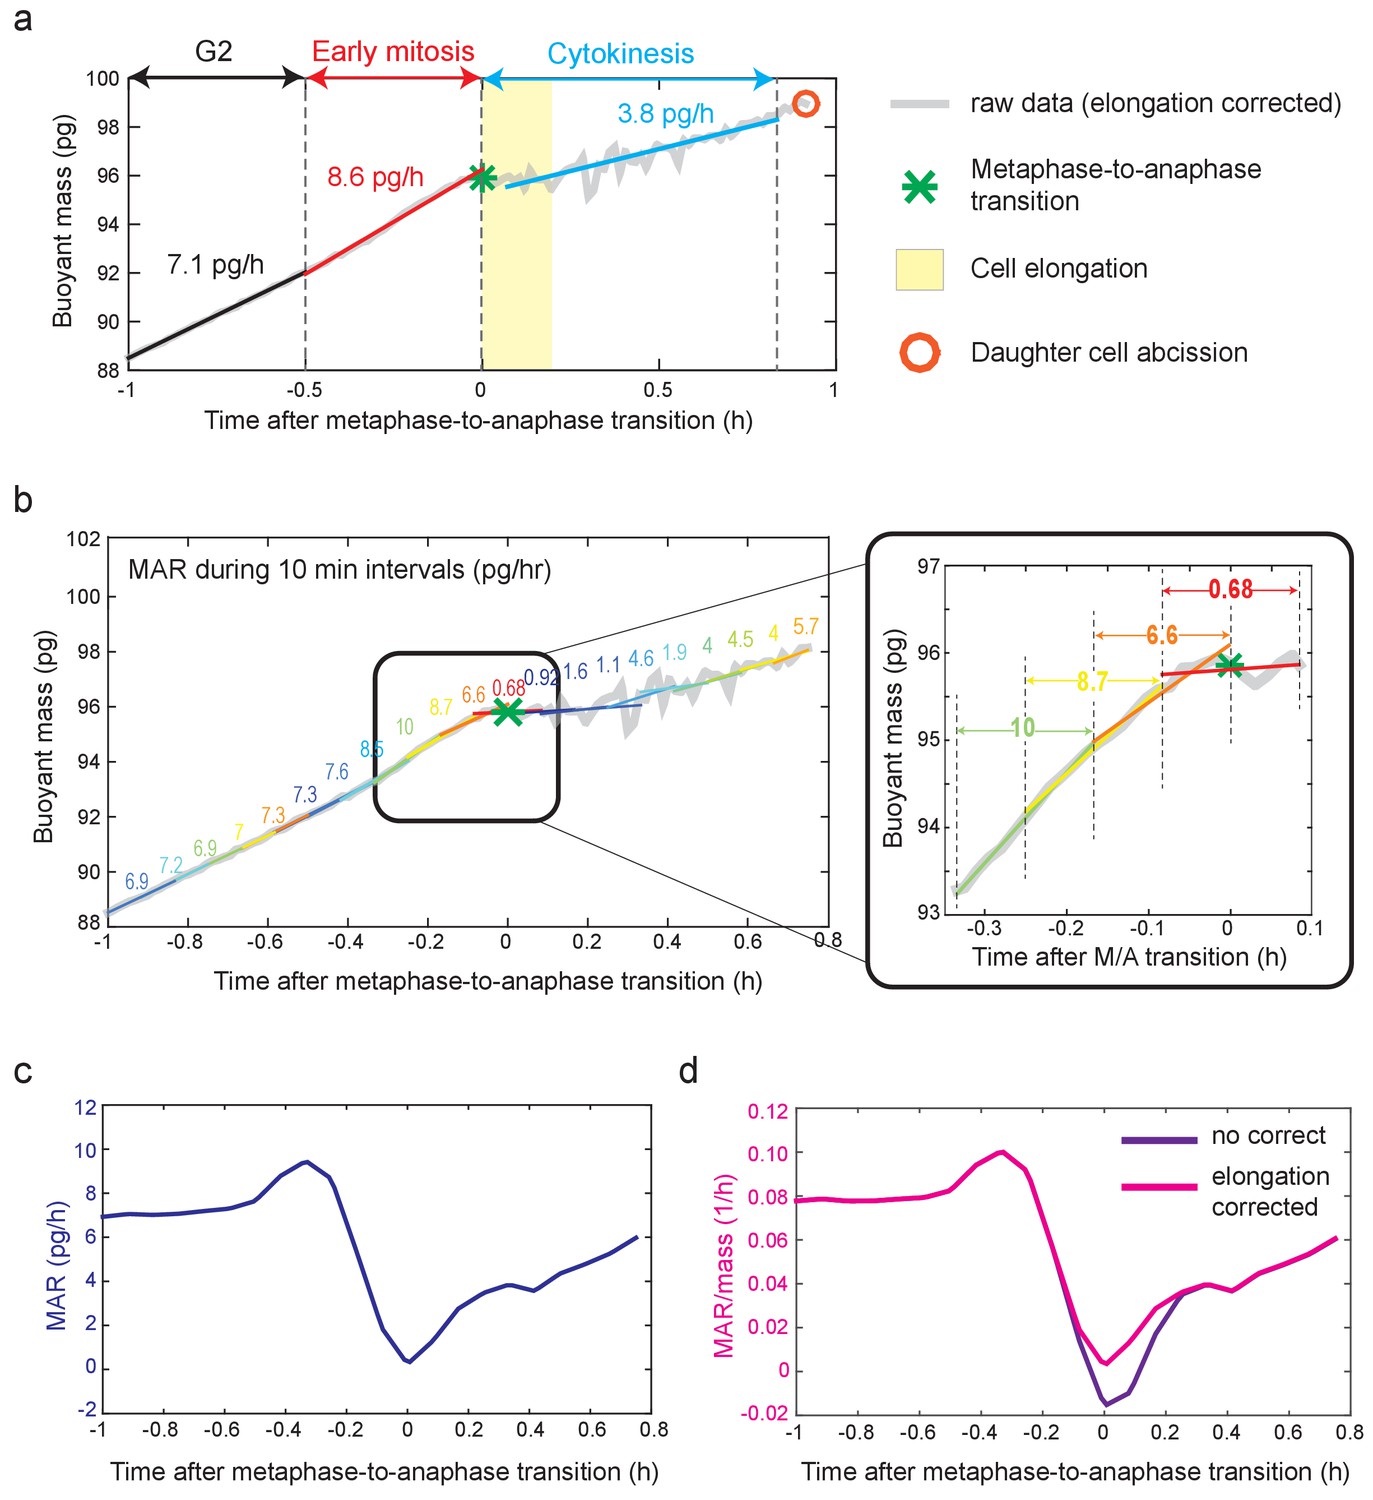
Mass accumulation rate (MAR) analysis.
(a) Schematic of obtaining the average MAR/mass for late G2, early mitosis and cytokinesis. The following steps have been performed in order. First, metaphase-to-anaphase transition (green star) and approximate mitotic entry were specified based on biophysical and fluorescence markers (see Figure 1—figure supplement 2). Second, late G2, early mitosis and cytokinesis were selected as described in the Materials and methods. Briefly, for L1210 cells shown here, cytokinesis was set as a 50 min period after metaphase-to-anaphase transition; early mitosis was set as a 30 min period before metaphase-to-anaphase transition, and late G2 was set as 30 min period prior to the start of early mitosis. Vertical dashed lines separate each stage. Third, buoyant mass traces (grey) during each stage were linearly fitted and the slope of each line represents the MAR. Finally, MAR of each stage was divided by the average mass within that stage. Cell elongation period (12 min for L1210 cells) is depicted in yellow. Orange circle denotes daughter cell abscission. (b) Schematic of obtaining MAR with high-temporal resolution. The following steps has been performed in order. First, metaphase-to-anaphase transition (green star) was specified as described above. Second, a 10-min period around metaphase-to-anaphase is selected (i.e. ± 5 min around metaphase-to-anaphase). Third, the rest of the buoyant mass trace is divided in to additional 10 min periods, each shifted by 5 min. Fourth, each section is then fitted with a linear line, and the slope of each fitted line represents MAR at the center of that line. For example, 0.68, which represents the slope of 10 min period around metaphase-to-anaphase transition, represents MAR at t = 0 (see inset on right). Lastly, the MAR at each period is divided by the average mass of that 10 min period to obtain MAR/mass. Note that for Figure 5, similar analysis was carried out using 4 min periods, each shifted by 2 min. (c) MAR vs time trace that was obtained from data in panel (b) after smoothing of the buoyant mass trace. (d) MAR/mass vs time trace obtained from panel (b) after smoothing of the buoyant mass trace. MAR/mass trace of elongation corrected (magenta) and uncorrected (purple) are plotted together for comparison.
Figure 2—figure supplement 2
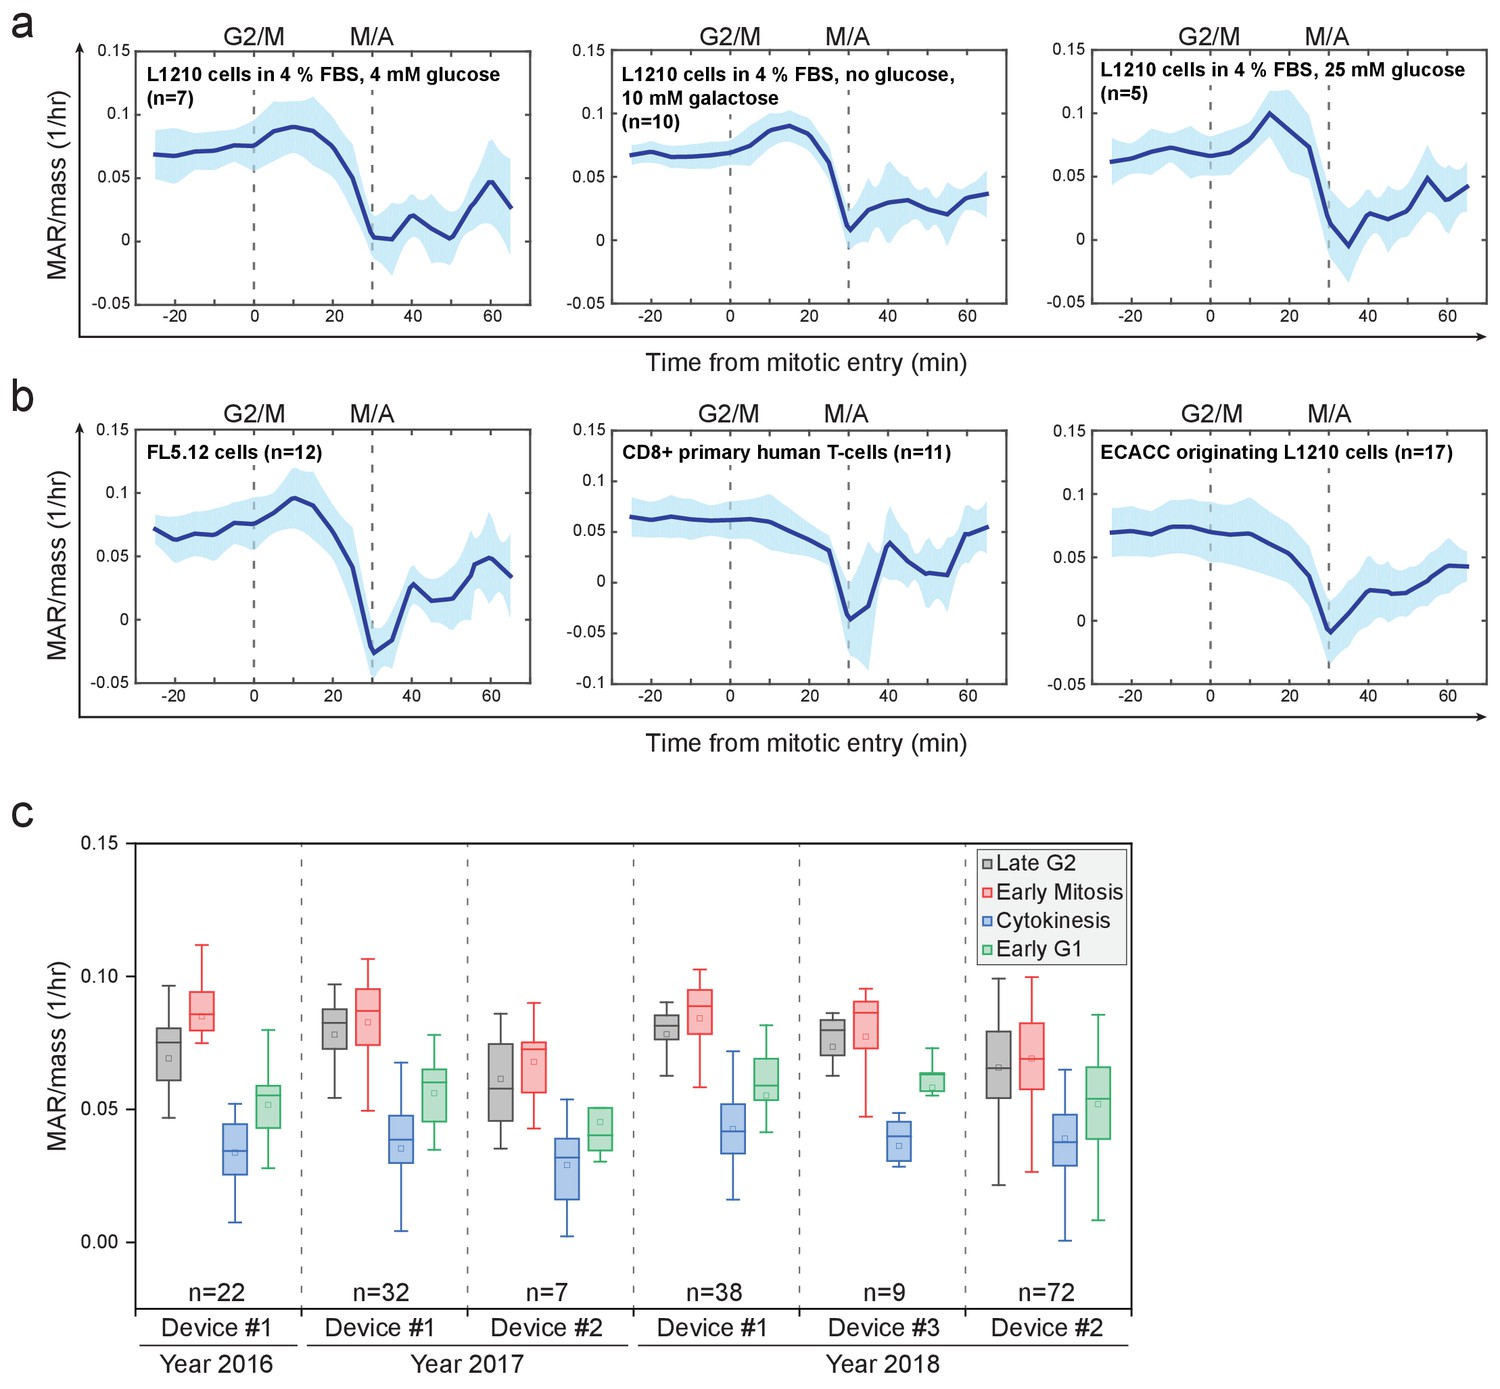
MAR in different growth conditions and cell types.
(a) Mass-normalized MAR of L1210 cells in late G2 and M-phase when grown under indicated FBS and glucose conditions. For comparison, in Figure 2a (as well as all other figures), L1210 cells were grown in 10% FBS and 11 mM glucose conditions. M/A denotes the metaphase-to-anaphase transition, G2/M denotes the approximate mitotic entry, both of which are indicated with dashed vertical lines. Solid dark blue lines indicate the mean and light blue areas represent ± SD. n refers to number of individual cells analyzed. (b) Mass-normalized MAR of indicated cell types in late G2 and M-phase. Note that L1210 cells obtained from ECACC did not display an increase in MAR in early mitosis. All other L1210 experiments were done with cells obtained from ATCC. M/A denotes the metaphase-to-anaphase transition, G2/M denotes the approximate mitotic entry, both of which are indicated with dashed vertical lines. Solid dark blue lines indicate the mean and light blue areas represent ± SD. n refers to number of individual cells analyzed. (c) Reproducibility of L1210 cell mitotic growth dynamics between different SMR devices and over multiple years. Note that multiple batches of L1210 cells were analyzed over the duration of this study and similar mass accumulation behavior was always observed. n refers to number of individual cells analyzed.
Figure 3 with 1 supplement

Mitotic protein synthesis dynamics are consistent with mass accumulation dynamics.
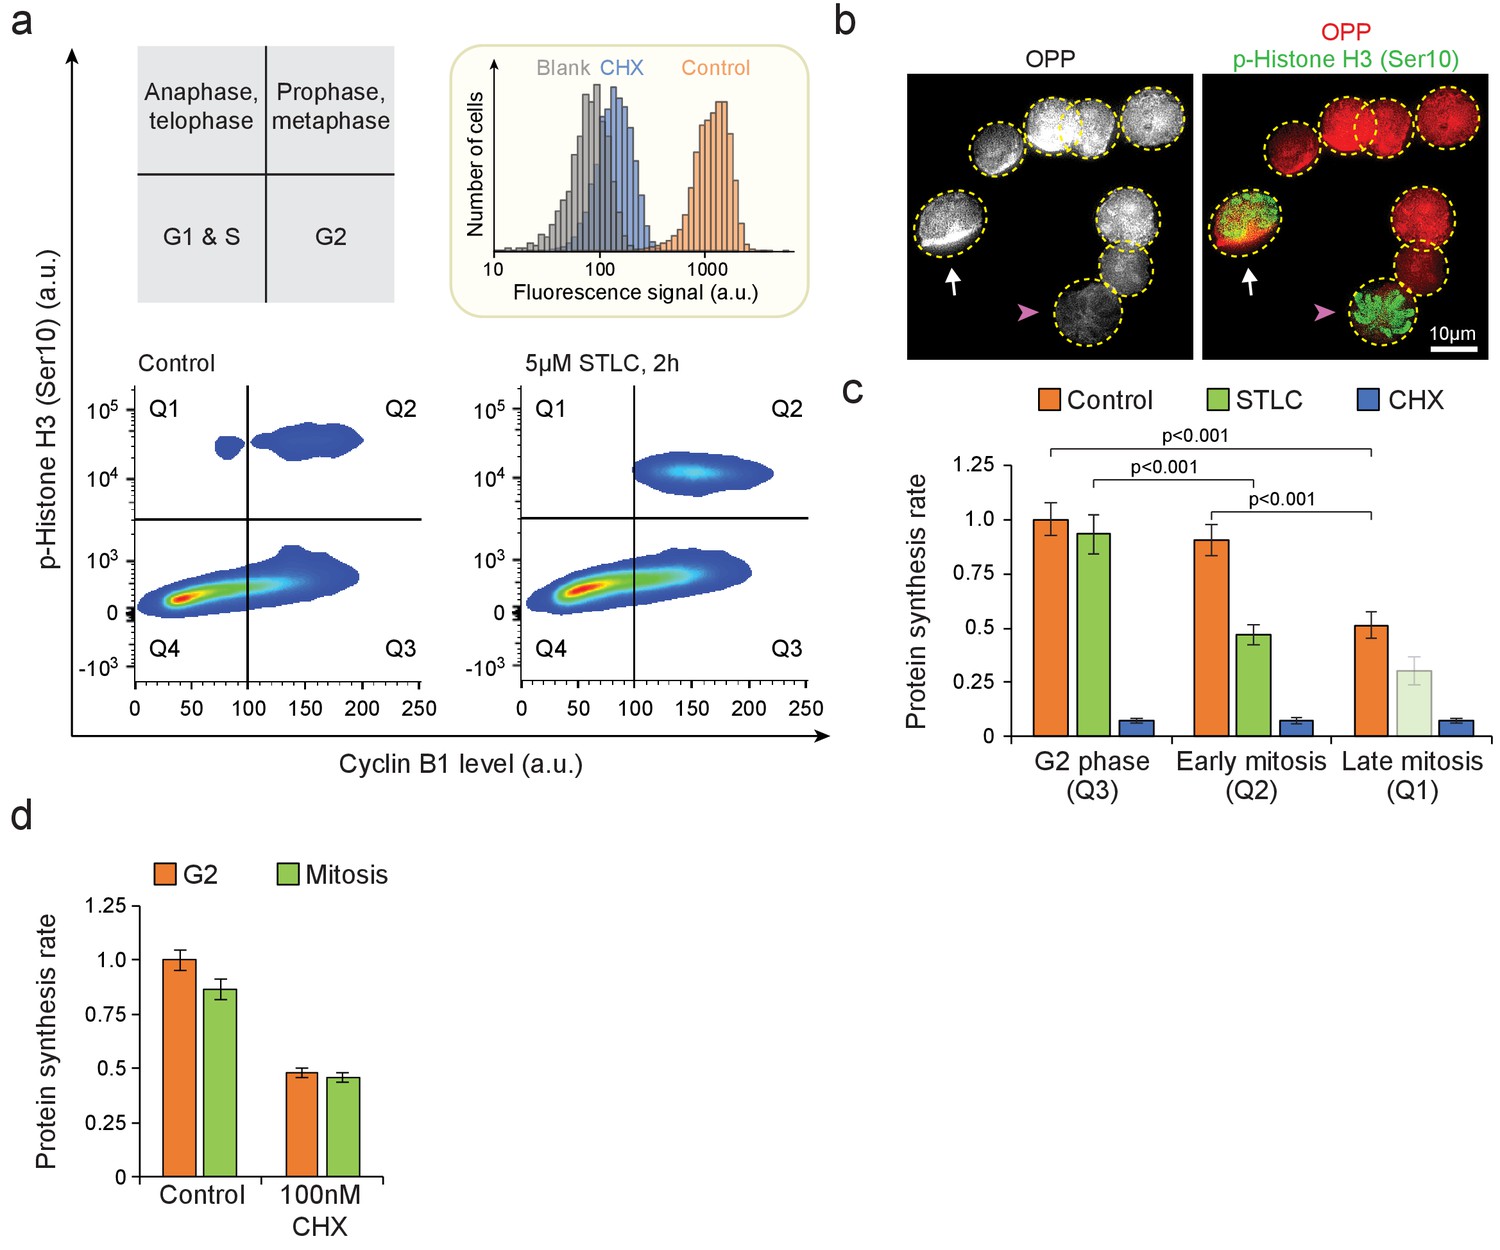
(a) Top, schematic of the protocol for quantifying mitotic protein synthesis rates using O-propargyl-puromycin (OPP). G2 synchronization was achieved by double thymidine block followed by RO-3306 mediated G2 arrest. Bottom, representative FACS scatter plots indicating L2110 cell cycle synchrony (n = 3 independent experiments). Phospho-Histone H3 (Ser10) was used as a mitotic marker. (b) Ratio of protein synthesis rate (blue) between mitotic and G2 L1210 cells after release from G2 arrest. Light green area displays the typical protein synthesis ratio between mitotic and G2 cells in the absence of cell cycle synchronization. The relative portion of mitotic cells is shown in orange. Each data point represents an individual replicate. (n = 3 separate cultures for each timepoint). Time of G2 release and the typical time to reach metaphase-to-anaphase transition are indicated with dashed vertical lines. (c) Representative FACS scatter plot indicating the separation of early (prophase) and late (metaphase to telophase) mitotic L1210 cells using Cyclin A antibody staining. (d) Protein synthesis rate of G2, early mitotic and late mitotic L1210 cells. (n = 6 separate cultures). Early and late mitotic cells were separated as shown in (g). p-Values obtained using ANOVA followed by Tukey’s posthoc test.
Figure 3—figure supplement 1
Single-cell protein synthesis assays in mitotic cells.
(a) Top left, schematic indicating the approximate cell cycle stages separated by Cyclin B1 and phospho-Histone H3 (Ser10) antibody labeling. Bottom, representative FACS scatter plots indicating the separation of early (prophase to metaphase) and late (anaphase to telophase) mitotic L1210 cells. Arresting cells to metaphase using STLC increases the number of cells in early mitosis but decreases the number of cells in late mitosis, validating the cell cycle separation. Top right, a histogram indicating O-propargyl-puromycin (OPP) protein synthesis assay specificity, by comparing control (orange) and 100 µM cycloheximide (CHX) (blue) treated samples. (n = 6 separate cultures for control, three separate cultures for Blank, CHX and STLC samples). (b) Representative image of control L1210 cells labeled with OPP and phospho-Histone H3 (Ser10) antibody (n = 12 fields of view). An early mitotic cell (white arrow), with phospho-Histone H3 (Ser10) labeling but not fully compacted chromatin, displays OPP incorporation comparable to OPP incorporation in non-mitotic cells (cells without arrows). A metaphase cell (pink arrowhead), with phospho-Histone H3 (Ser10) labelling and compacted chromatin, displays low OPP incorporation. Dashed yellow lines indicate cell outlines. (c) Protein synthesis rates of G2, early mitotic and late mitotic L1210 cells. Early and late mitotic cells were separated as shown in (a). Chemical treatment with 5 µM STLC lasted 2 hr and with 100 µM CHX lasted 30 min. Data in late mitosis after STLC treatment is indicated with light green bar, as this population had too few cells for a reliable analysis. (n = 3–6 separate cultures). (d) Protein synthesis rates of G2 and mitotic L1210 cells after 4 hr treatment with 100 nM CHX. (n = 4 separate cultures). In (c) and (d), data depicts mean ± SD. p-Values obtained using ANOVA followed by Tukey’s posthoc test.
Figure 4

Mitotic arrests result in growth inhibition independently of the mechanism of arrest.
(a) Mass-normalized MAR of 5 µM STLC or 1 mg/ml Nocodazole treated L1210 cells in late G2 and mitosis. Dashed vertical line indicates the approximate mitotic entry. Solid dark lines indicate the mean and light areas represent ± SD. n refers to number of individual cells analyzed. Drug treatments started 1–4 hr prior to mitotic entry and were maintained through the experiment. (b) Ratio of protein synthesis rate (blue) between mitotic and G2 L1210 cells after release from G2 arrest in to 5-µM STLC-mediated mitotic arrest. Light green area displays the typical protein synthesis ratio between mitotic and G2 cells in the absence of cell cycle synchronization. The relative portion of mitotic cells is shown in orange. Each data point represents an individual replicate (n = 3 separate cultures for each timepoint). Cells were synchronized to G2 as in (Figure 3a). (c) Protein synthesis rates of G2 (blue) and mitotic (red) L1210 cells after 4 hr treatment with indicated mitotic inhibitors. The proportion of mitotic cells relative to control is indicated below (mean ± SD). (n = 4 separate cultures). p-Values obtained using ANOVA followed by Tukey’s posthoc test. (d) Mass-normalized MAR of 10 nM Vinblastine or 10 nM Vincristine-treated L1210 cells in late G2 and mitosis. Dashed vertical line indicates the approximate mitotic entry. Solid dark lines indicate the mean and light areas represent ± SD. n refers to number of individual cells analyzed. Drug treatments started 1–4 hr prior to mitotic entry and were maintained through the experiment.
Figure 5 with 2 supplements
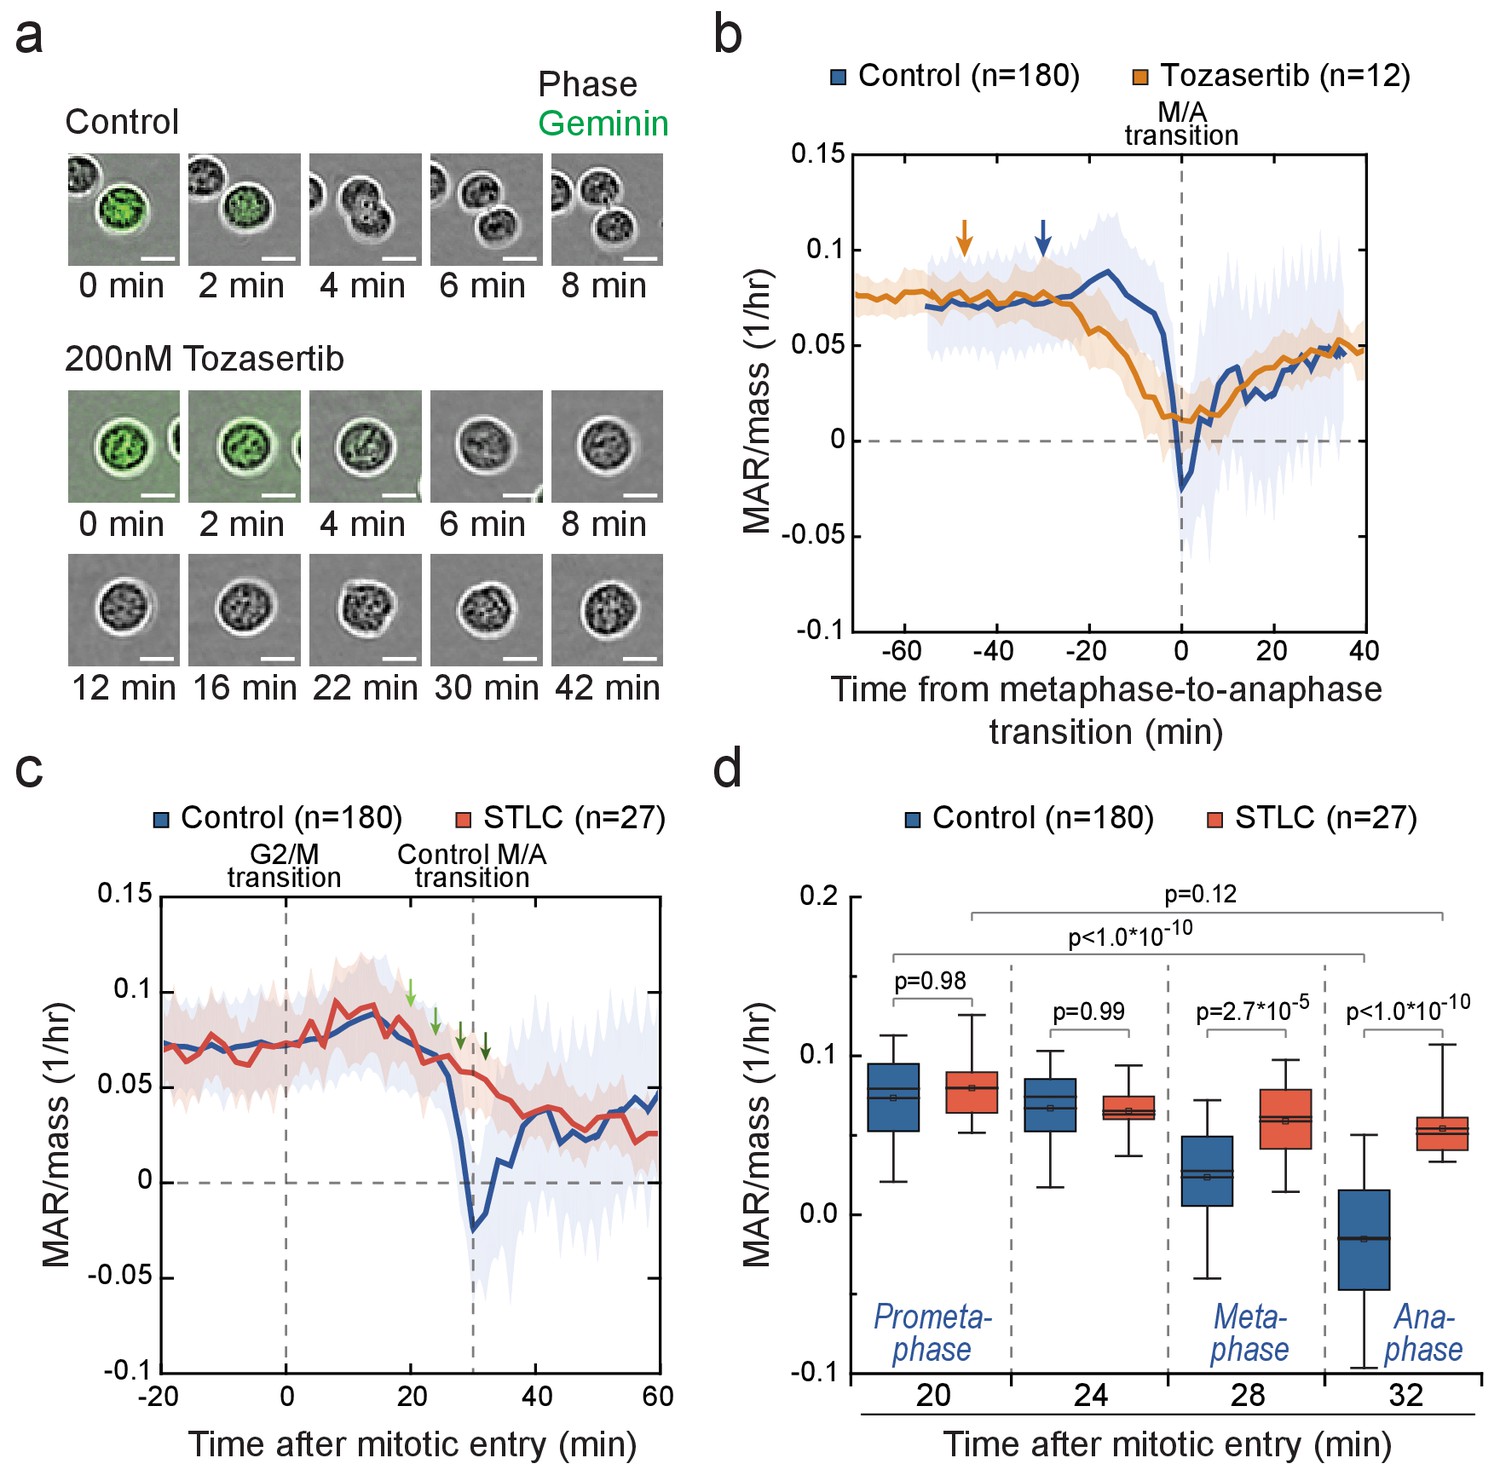
Cells in metaphase and anaphase display stage-specific mass accumulation regulation independently of cell elongation.
(a) Representative L1210 cell phase contrast (grey) and mAG-hGeminin cell cycle reporter (green) images in control (n = 9 cells) and 200 nM Tozasertib (n = 6 cells) treated cells. The degradation of mAG-hGeminin indicates metaphase-to-anaphase transition. No cytokinesis takes place under Tozasertib treatment. (b) Mass-normalized MAR of control (blue) and 200 nM Tozasertib (orange) treated L1210 cells. Note that Tozasertib prolonged early mitosis, but most cells still displayed increased MAR after G2/M transition (see Figure 5—figure supplement 2a). Dashed vertical line indicates the metaphase-to-anaphase transition. Solid dark lines indicate the mean and light areas represent ± SD. n refers to number of individual cells analyzed. Arrows reflect typical time of G2/M transition for each sample. Drug treatment started 1–4 hr prior to mitotic entry and was maintained through the experiment. (c, d) Mass-normalized MAR of control (blue) and 5 µM STLC (red) treated L1210 cells (f). Dashed vertical lines indicate the approximate mitotic entry (for both samples) and metaphase-to-anaphase transition (only applies to control). Solid dark lines indicate the mean and light areas represent ± SD. Arrows indicate time points from which data was extracted to generate the boxplot in (g). n refers to number of individual cells analyzed. p-Values were obtained using ANOVA followed by Tukey’s posthoc test. In all boxplots, line: median, box: interquartile range, whiskers: 5–95%. See Materials and methods for details on MAR analysis resolution for this figure.
Figure 5—figure supplement 1
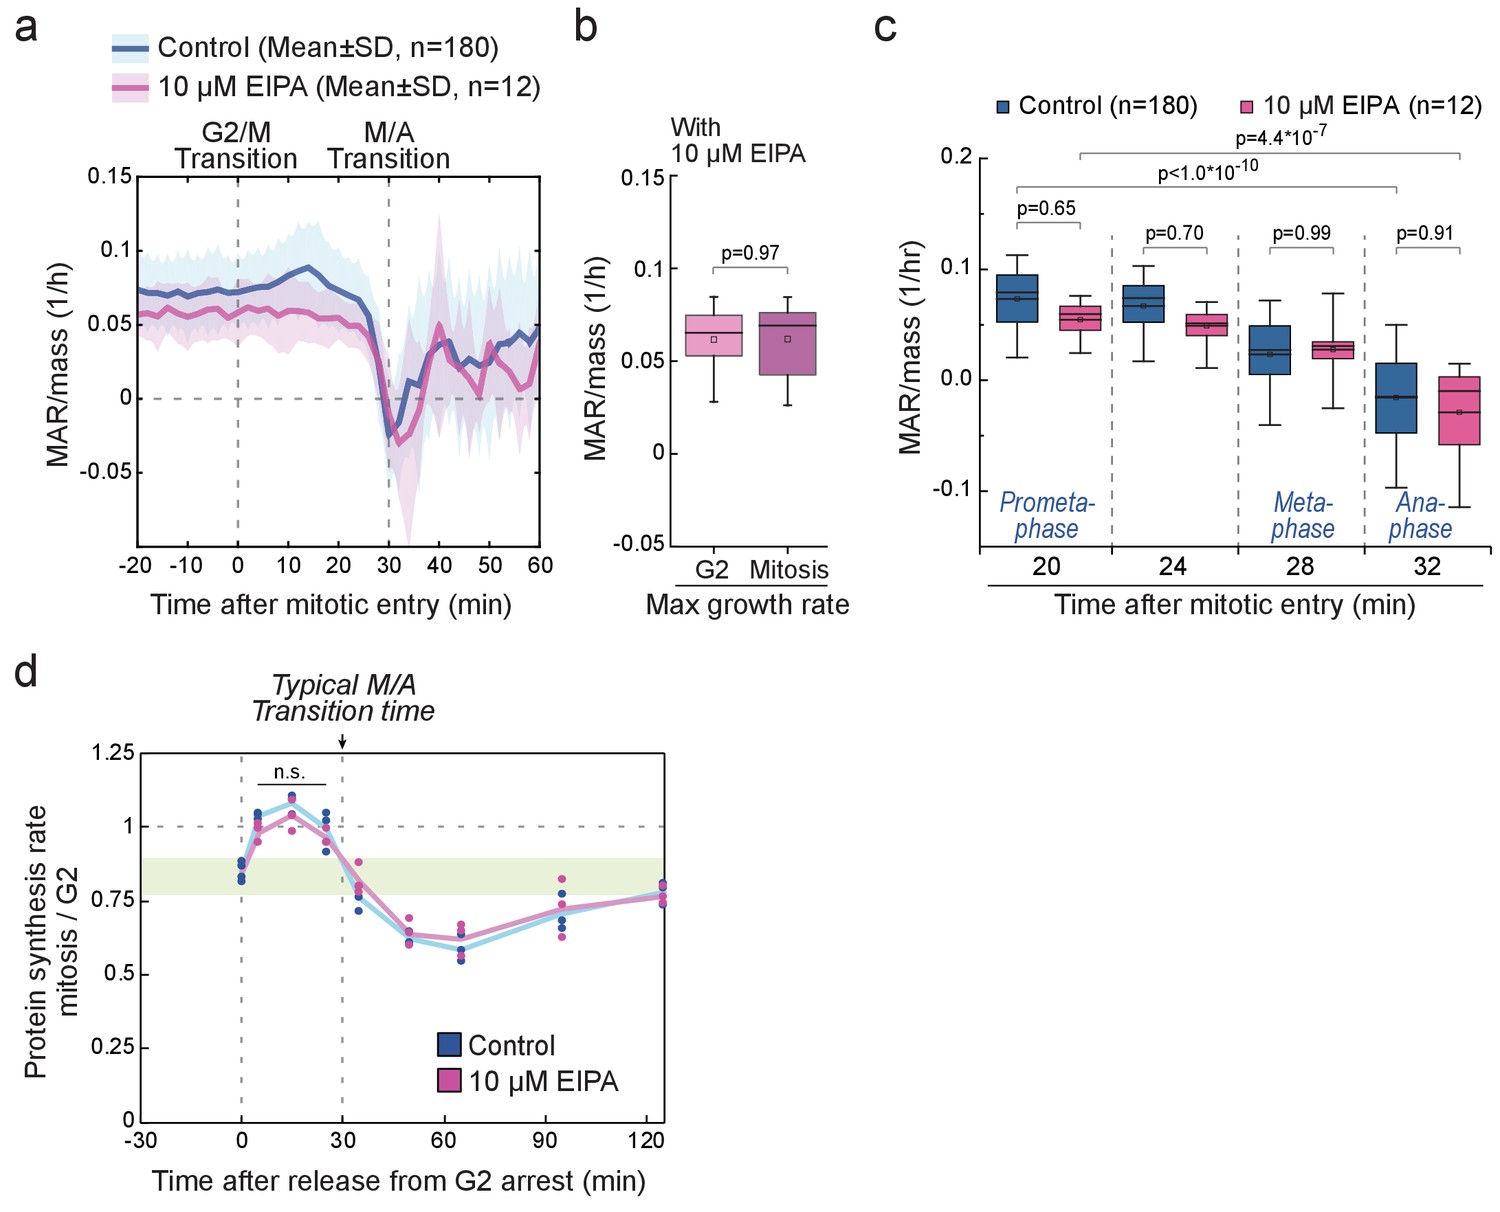
Mitotic cell swelling affects MAR, but not protein synthesis in early mitosis.
(a) Mass-normalized MAR of control (blue) and 10 µM EIPA (pink) treated L1210 cells. Dashed vertical lines indicate the approximate mitotic entry and metaphase-to-anaphase transition. Solid dark lines indicate the mean and light areas represent ± SD. n refers to number of individual cells analyzed. Drug treatment started 1–4 hr prior to mitotic entry and was maintained through the experiment. (b) Quantification of L1210 cell maximal growth rate observed in late G2 and in mitosis when treated with 10 µM EIPA (n = 12 cells, each an independent experiment). p-Values obtained using two-tailed Welch’s t-test. (c) Quantifications of data displayed in panel a. Mass-normalized MAR of control (blue) and EIPA (pink)-treated L1210 cells were analyzed as a function of time after mitotic entry. n refers to number of individual cells analyzed. p-Values were obtained using ANOVA followed by Tukey’s posthoc test. (d) Ratio of protein synthesis rate between mitotic and G2 L1210 cells after release from G2 arrest in to control (blue) or 10 µM EIPA (pink). Light green area displays the typical protein synthesis ratio between mitotic and G2 cells in the absence of cell cycle synchronization. Each data point represents an individual replicate (n = 3 separate cultures for each timepoint). Cells were synchronized to G2 as in (Figure 3a). In all boxplots, line: median, box: interquartile range, whiskers: 5–95%. See Materials and methods for details on MAR analysis resolution for this figure.
Figure 5—figure supplement 2
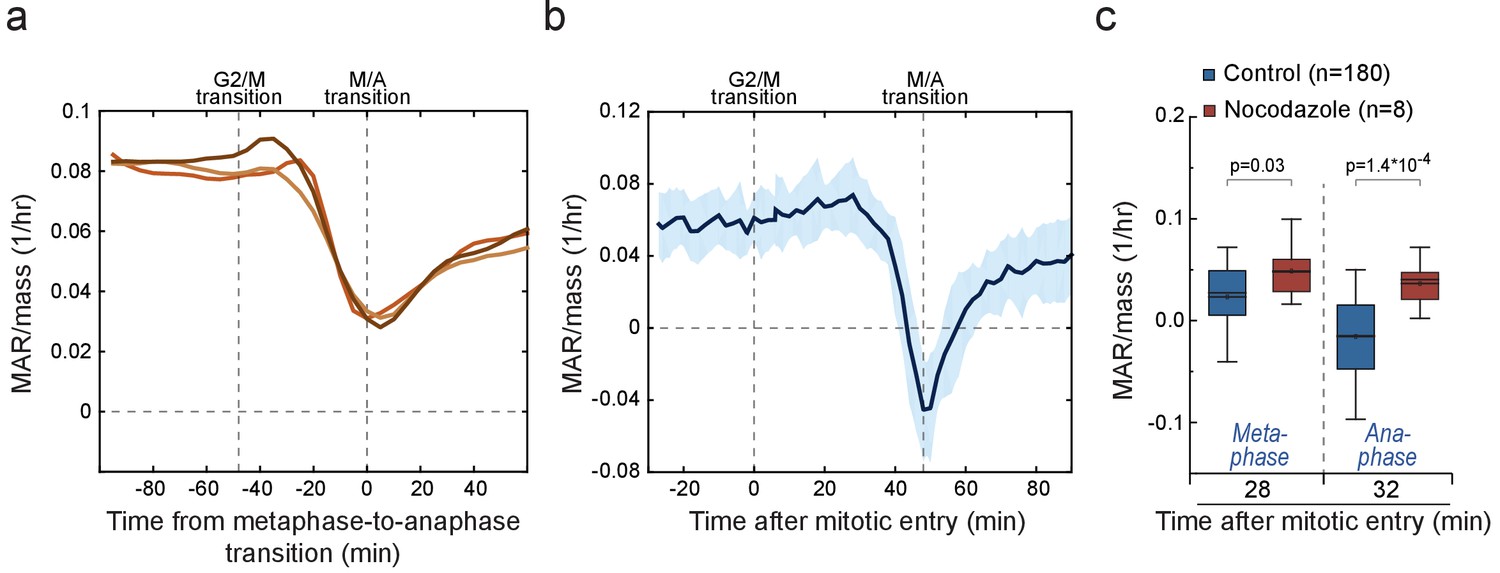
The low MAR in metaphase and anaphase are not explained by cell elongation or time spent in mitosis.
(a) Examples of individual 200 nM Tozasertib treated L1210 mass-normalized MAR traces. Note that although MAR remains positive around metaphase-to-anaphase transition, the absence of cytokinesis in these cells does not remove the overall dynamics of MAR (See Figure 2d for control dynamics). Dashed vertical lines indicate the approximate mitotic entry and metaphase-to-anaphase transition. Drug treatment started 1–4 hr prior to mitotic entry and was maintained through the experiment. (b) Mass-normalized MAR of 25 µM Blebbistatin-treated L1210 cells. Solid dark blue line indicates the mean and light areas represent ± SD (n = 9 individual cells, each from separate experiment). Dashed vertical lines indicate the approximate mitotic entry and metaphase-to-anaphase transition. Drug treatment started 1–4 hr prior to mitotic entry and was maintained through the experiment. (c) MAR/mass of control (blue) and Nocodazole (dark red)-treated L1210 cells were analyzed as a function of time after mitotic entry. n refers to number of individual cells analyzed. p-Values obtained using two-tailed Welch’s t-test. In boxplots, line: median, box: interquartile range, whiskers: 5–95%. See Materials and methods for details on MAR analysis resolution for this figure.
Figure 6 with 4 supplements
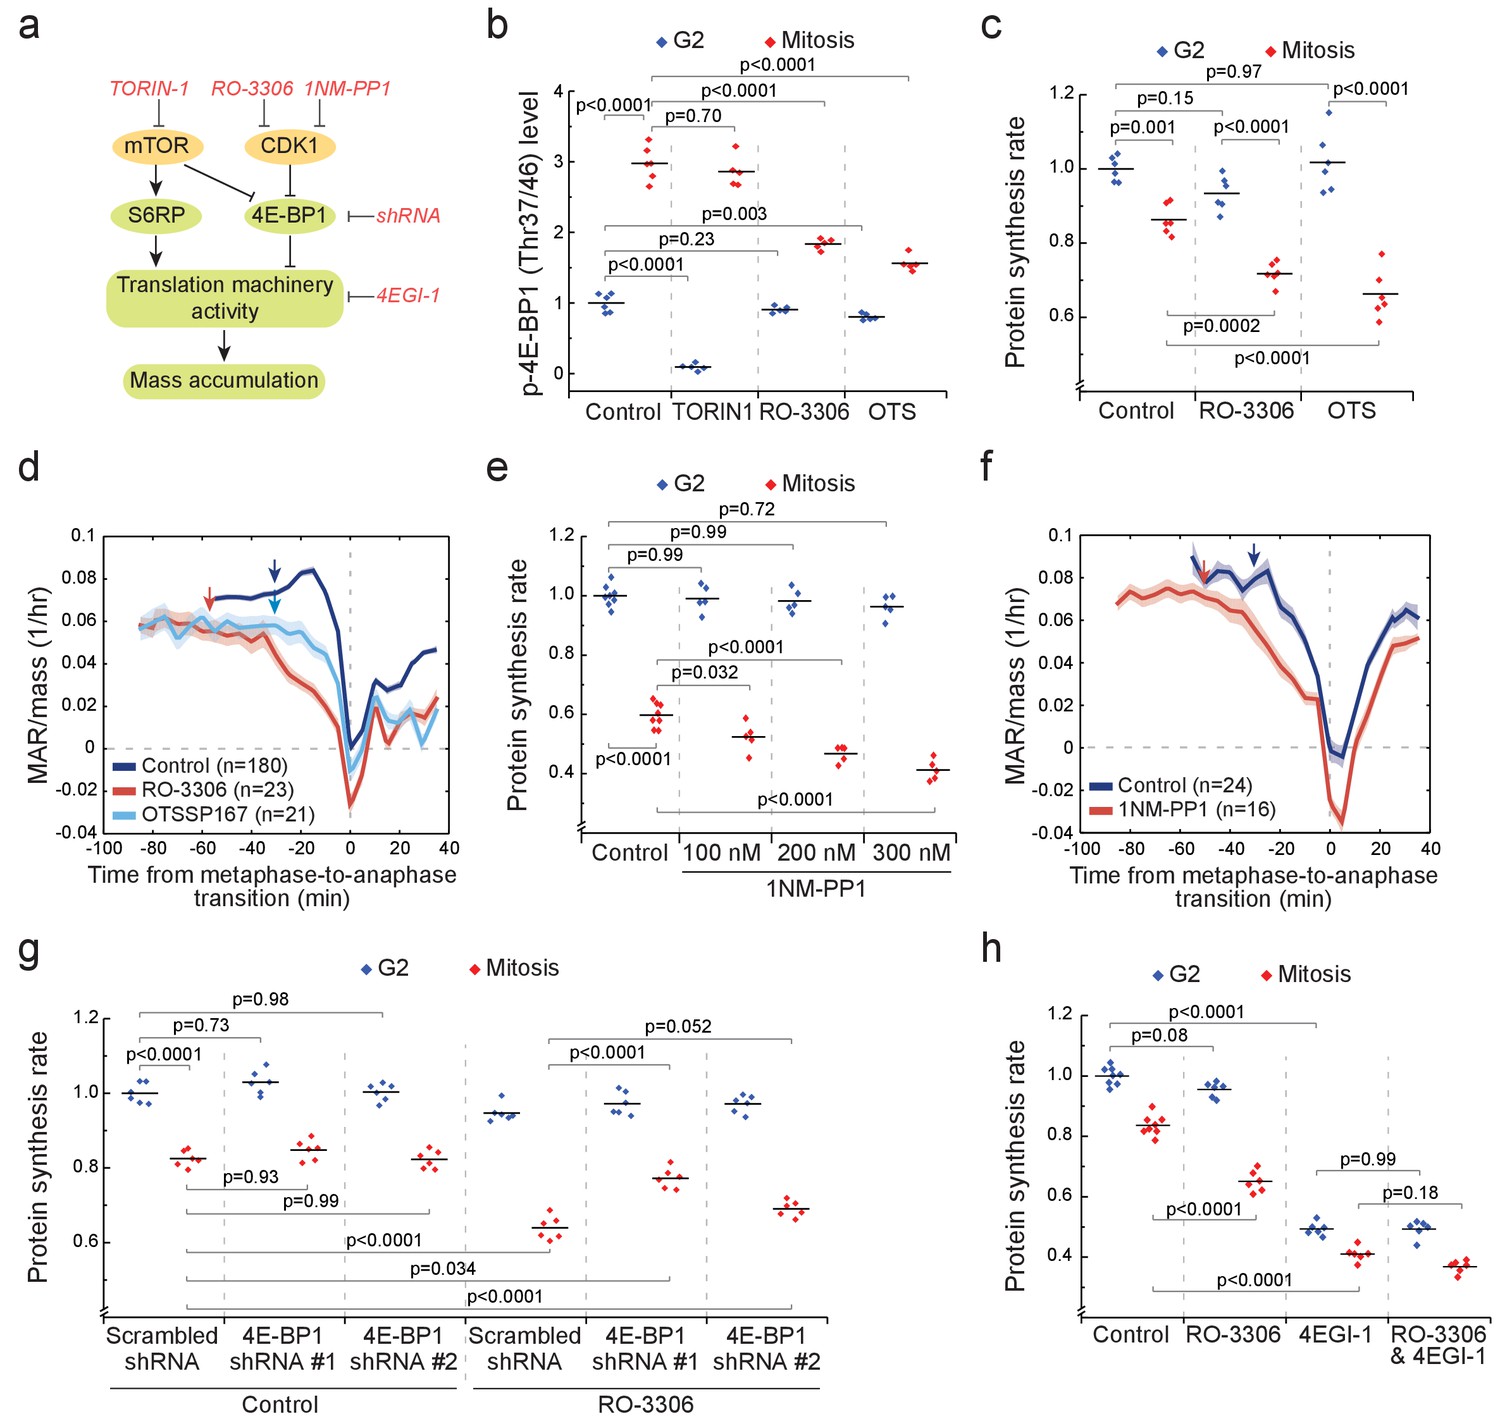
CDK1 drives mitotic growth through 4E-BP1 and cap-dependent protein synthesis.
(a) Schematic of growth regulation pathways. Chemical and genetic inhibitors (red), kinases (yellow) and the measured downstream consequences (green) are shown. 1NM-PP1-mediated inhibition of CDK1 is dependent on kinase mutation. (b) L1210 cell levels of phosphorylated 4E-BP1 (Thr37/46) in G2 (blue) and mitosis (red) after 2 hr treatment with 250 nM TORIN-1, 1 µM RO-3306 or 50 nM OTSSP167. (n = 5–6 separate cultures). (c) Protein synthesis rates of G2 (blue) and mitotic (red) L1210 cells after 2 hr treatment with 1 µM RO-3306 or 50 nM OTSSP167. (n = 6 separate cultures). (d) Mass-normalized MAR of control, 1 µM RO-3306 or 30 nM OTSSP167-treated L1210 cells. Solid dark lines indicate the mean and light areas represent ± SEM. Arrows reflect typical time of G2/M transition for each sample. n refers to number of individual cells analyzed. Drug treatments started 1–4 hr prior to mitotic entry and were maintained through the experiment. (e) DT40 CDK1as cell protein synthesis rates in G2 (blue) and mitosis (red) after 5 hr treatment with 1NM-PP1. (n = 5–8 separate cultures). (f) Mass-normalized MAR of control or 200 nM 1NM-PP1-treated DT40 CDK1as cells. Solid dark lines indicate the mean and light areas represent ± SEM. Arrows reflect typical time of G2/M transition for each sample. n refers to number of individual cells analyzed. Drug treatments started 1–4 hr prior to mitotic entry and were maintained through the experiment. (g) Protein synthesis rates of G2 (blue) and mitotic (red) L1210 cells expressing scrambled or 4E-BP1 targeting shRNAs. The cells were treated for 2 hr with 1 µM RO-3306 before sample preparation. (n = 6 separate cultures). (h) Protein synthesis rates of G2 (blue) and mitotic (red) L1210 cells after 2 hr treatment with 1 µM RO-3306, 5 hr treatment with 50 µM 4EGI-1 or combined treatment with RO-3306 and 4EGI-1. (n = 6–8 separate cultures). All p-Values were obtained using ANOVA followed by Tukey’s posthoc test.
Figure 6—figure supplement 1
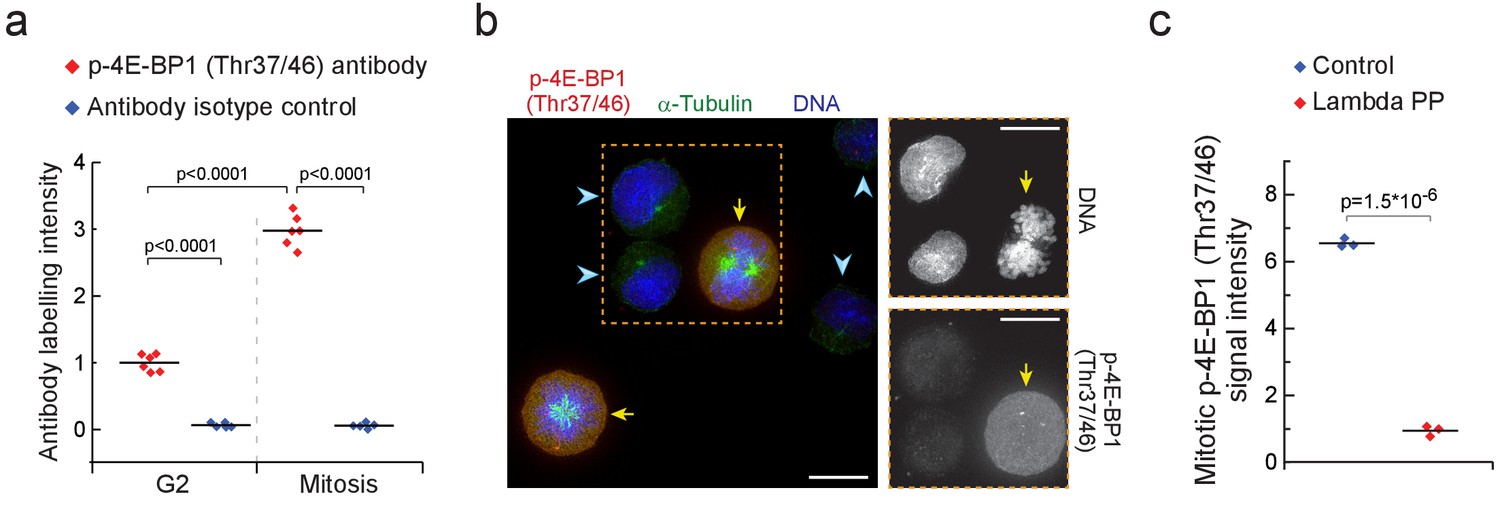
4E-BP1 is phosphorylated in mitosis.
(a) L1210 cell levels of phosphorylated 4E-BP1 (Thr37/46) in mitosis and G2. Antibody isotype control is shown as a specificity control. (n = 5–6 separate cultures). p-Values obtained using ANOVA followed by Tukey’s posthoc test. (b) Representative image of L1210 cells in interphase (light blue arrow heads) and in early mitosis (yellow arrows) with DNA, α-Tubulin and p-4E-BP1 (Thr37/46) labeling (n = 15 fields of view). Mitotic cells were identified based on DNA condensation and α-Tubulin morphology. DNA and p-4E-BP1 (Thr37/46) labeling within the orange box are shown separately on the right. Scale bars denote 10 µm. (c) L1210 cell levels of phosphorylated 4E-BP1 (Thr37/46) in mitotic cells treated with or without Lambda protein phosphatase. (n = 3 separate cultures). p-Values obtained using two-tailed Welch’s t-test. See Materials and methods for experimental details.
Figure 6—figure supplement 2

mTOR is active in mitosis but is not required for mitotic protein synthesis.
(a) L1210 cell levels of phosphorylated S6RP (Ser235/236) in mitosis and G2. Antibody isotype control is shown as a specificity control. (n = 5–6 separate cultures). (b) L1210 cell levels of phosphorylated S6RP (Ser235/236) in G2 (blue) and mitosis (red) after 2 hr treatment with 250 nM TORIN-1, 1 µM RO-3306 or 50 nM OTSSP167. (n = 5–6 separate cultures). (c) Protein synthesis rates of G2 (blue) and mitotic (red) L1210 cells after 2 hr treatment with 250 nM TORIN-1. (n = 4 separate cultures). All p-values obtained using ANOVA followed by Tukey’s posthoc test.
Figure 6—figure supplement 3
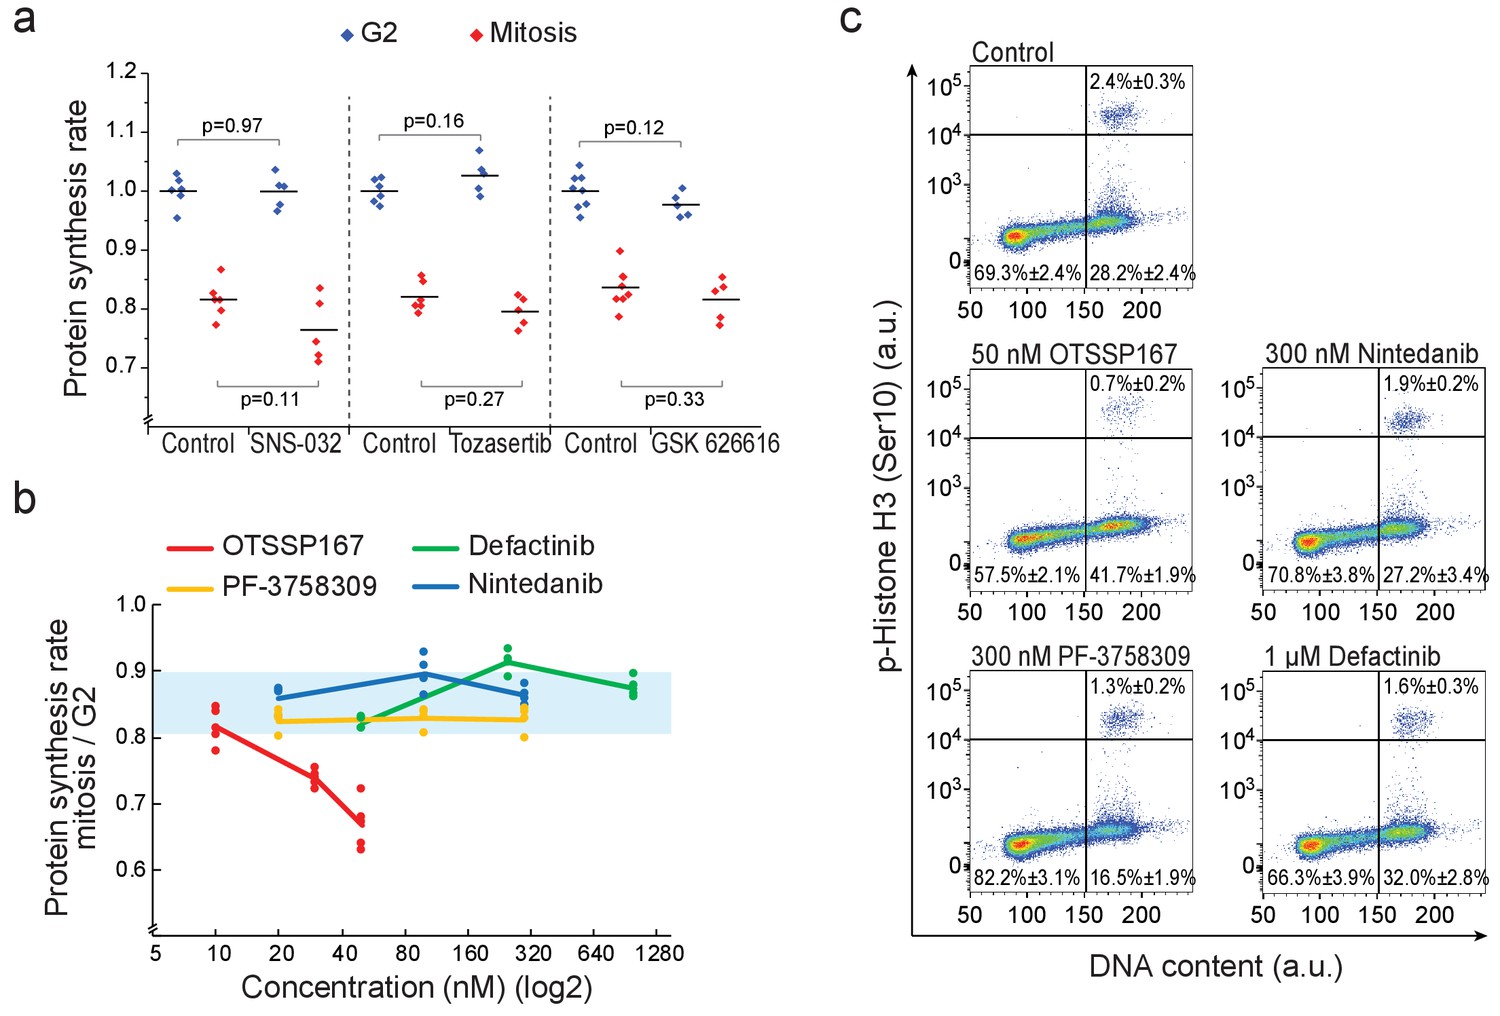
Kinase inhibitors which have MELK kinase as an off-target do not reduce mitotic protein synthesis.
(a) Protein synthesis rates of G2 (blue) and mitotic (red) L1210 cells after 3 hr treatment with 1 µM SNS-032 (CDK2 inhibitor) or 50 nM Tozasertib (Aurora kinase inhibitor), or 5 hr treatment with 1 µM GSK 626616 (DYRK kinase inhibitor). (n = 5–8 separate cultures). p-Values obtained using two-tailed Welch’s t-test. (b) Ratio of protein synthesis rates between mitotic and G2 L1210 cells after 3 hr treatment with OTSSP167, Defactinib (also known as PF-04554878), PF-3758309 (also known as PF-309) or Nintedanib (also known as BIBF 1120), all of which inhibit MELK kinase with sub-micromolar affinity (Klaeger et al., 2017). Light blue area indicates the typical range observed in control cells. (n = 4 separate cultures). Note that OTSSP167 is a nonspecific multikinase inhibitor (Klaeger et al., 2017), making it likely that MELK kinase does not contribute to the drug-induced mitotic growth reduction. (c) Representative FACS scatter plots indicating the cell cycle distribution after 6 hr treatment with indicated chemicals. The relative portion of cells in G1/S, G2 and mitosis are indicated (mean ± SD). (n = 4–6 separate cultures). Note that OTSSP167 reduced mitotic entry, a phenotype typical for CDK1 inhibition, while the alternative MELK inhibitors did not display similar cell cycle profile. CDK1 is one of the off-targets of OTSSP167 (Klaeger et al., 2017).
Figure 6—figure supplement 4

shRNA-mediated knockdown of 4E-BP1 in L1210 cells.
(a) Histogram of 4E-BP1 protein levels analyzed by immunostaining and flow cytometry in L1210 cells stably expressing the indicated shRNAs. (b) Quantifications of data in panel (a). n = 3 separate cultures. Note that the difference in 4E-BP1 knockdown efficiency between the two 4E-BP1 targeting shRNAs is likely to explain the differences observed between these two cell lines in Figure 6e. (c) Proliferation rate of control and 4E-BP1 knockdown cells. Note that the lack of strong proliferation phenotypes likely reflects the optimal growth conditions where 4E-BP1 is maintained phosphorylated and inactivated.
Figure 7 with 3 supplements
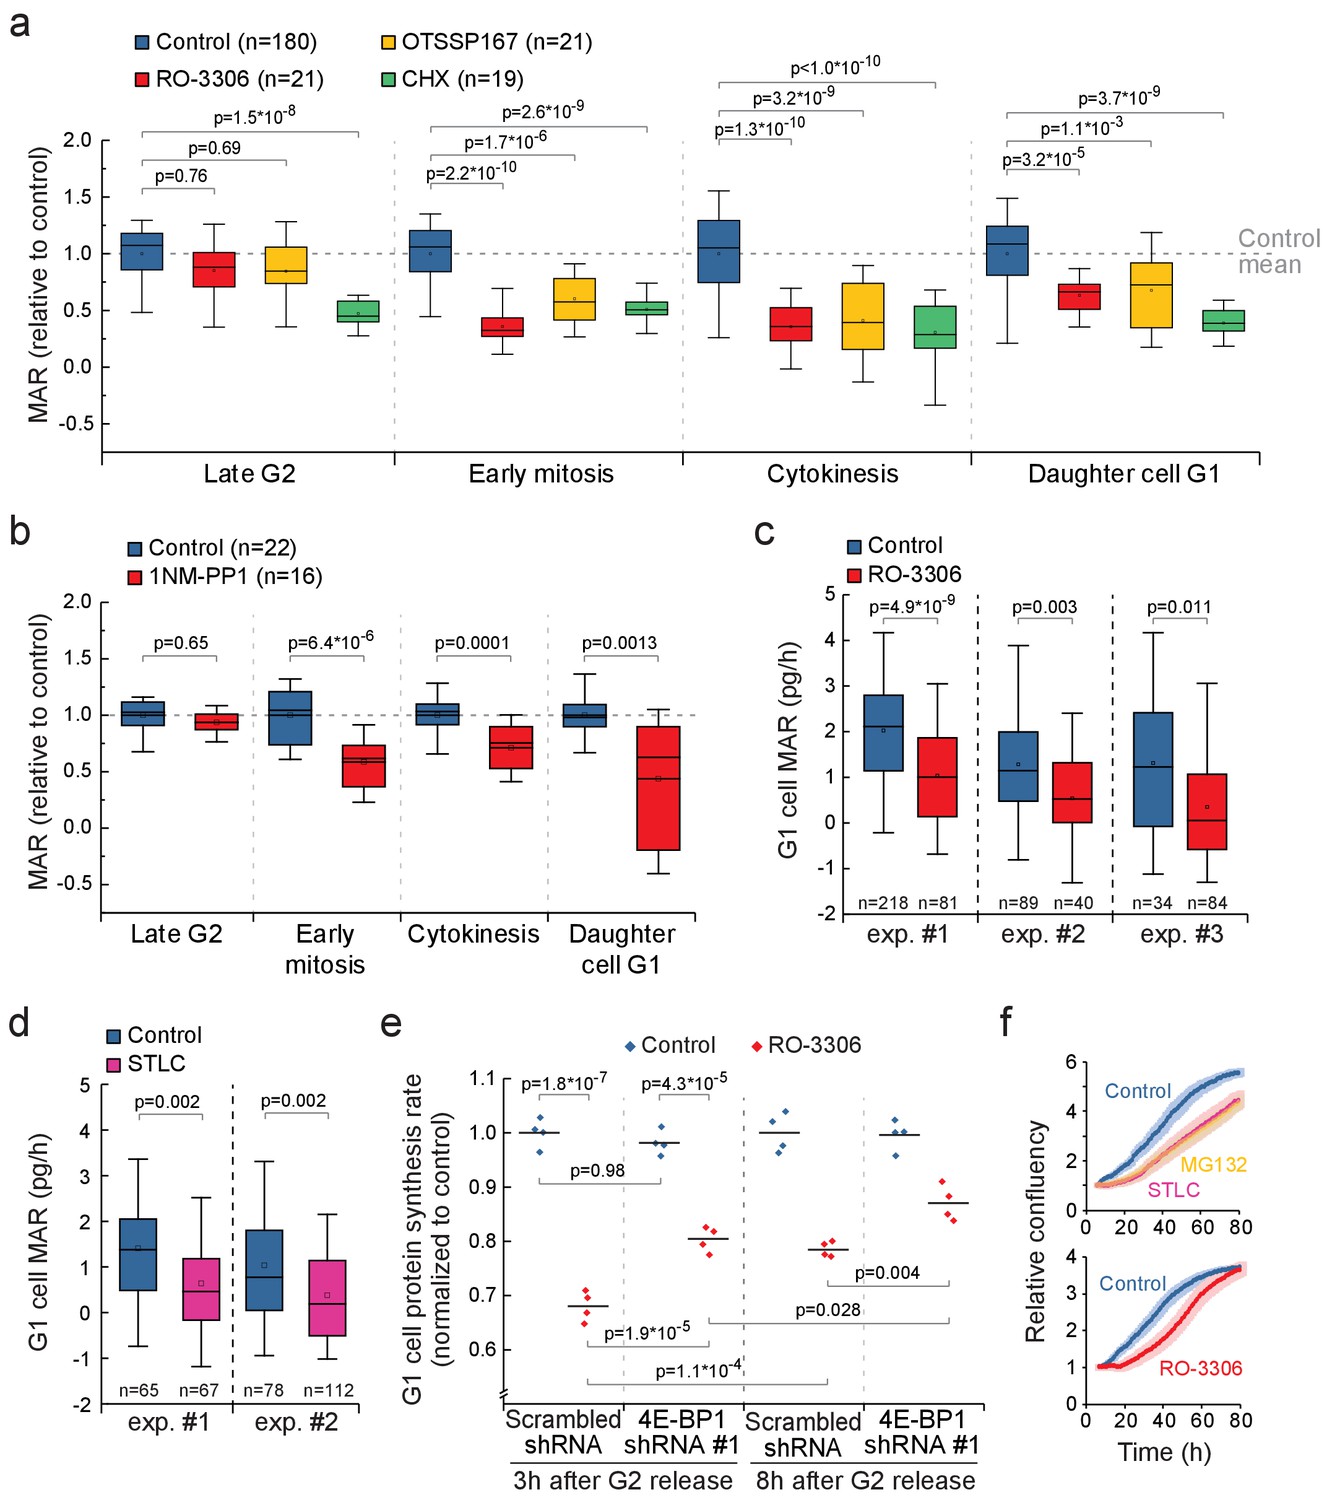
CDK1-driven mitotic protein synthesis supports daughter cell growth.
(a) MAR during indicated stages of cell cycle in control, 1 µM RO-3306, 30 nM OTSSP167 or 100 nM cycloheximide (CHX) treated L1210 cells. The MAR values were normalized to control mean at each stage. n refers to number of individual cells analyzed. Drug treatments started 1–4 hr prior to mitotic entry and were maintained through the experiment. (b) MAR during indicated stages of cell cycle in control or 200 nM 1NM-PP1-treated DT40 CDK1as cells. The MAR values were normalized to control mean at each stage. n refers to number of individual cells analyzed. Drug treatment started 1–4 hr prior to mitotic entry and was maintained through the experiment. (c and d) MAR of newborn L1210 G1 cells from control and from cells that have undergone mitosis in the presence of 1 µM RO-3306 (c) or from cells that have been arrested to mitosis for 4 hr with STLC before releasing to undergo cytokinesis (d). Data acquired using serial SMR (see Figure 7—figure supplement 2 for details). n refers to number of individual cells analyzed. (e) Protein synthesis rates of G1 L1210 cells expressing a scrambled or 4E-BP1 targeting shRNA after the cells progressed through mitosis in the presence or absence of 1 µM RO-3306. Two timepoints (3 hr and 8 hr) after G2 release are shown. (n = 4 separate cultures). (f) Long-term growth, as measured by cell confluency, in L1210 cells that have been arrested to mitosis for 4 hr with STLC or MG132 before releasing to undergo cytokinesis (n = 5 separate cultures, top), or have undergone mitosis in the presence of 1 µM RO-3306 (n = 6 separate cultures, bottom). Dark colors indicate mean and light areas indicate ± SEM. In (a) and (e), p-values obtained using ANOVA followed by Tukey’s posthoc test. In (b–d), p-values obtained using two-tailed Welch’s t-test. In boxplots, line: median, box: interquartile range, whiskers: 5–95%.
Figure 7—figure supplement 1
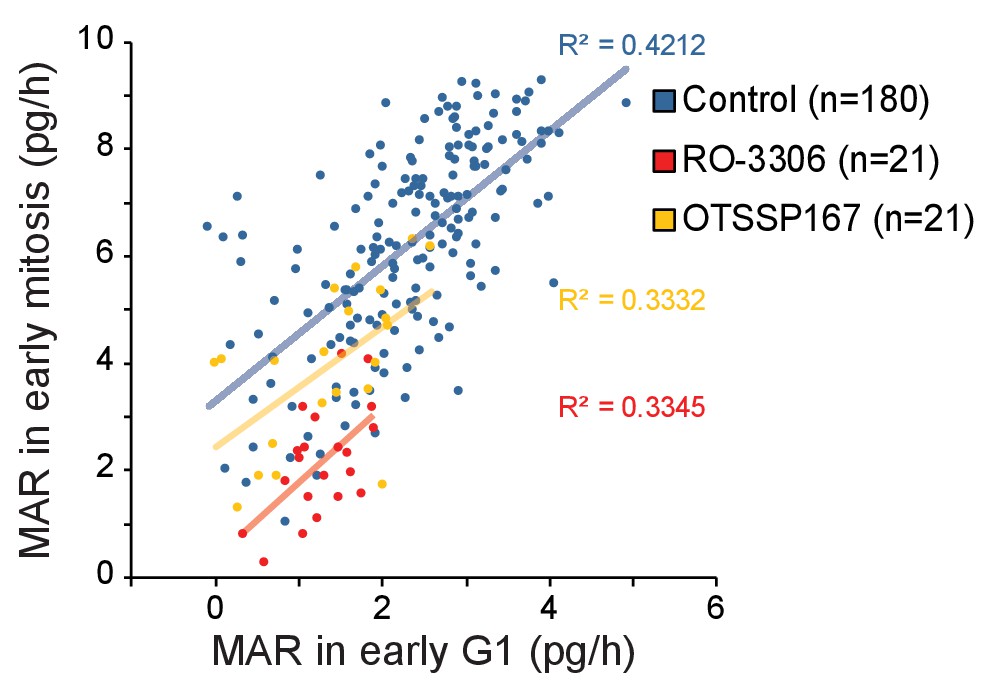
Correlations between mitotic and G1 cell MAR.
Correlation plot between mother cell MAR in early mitosis (30 min section prior to M/A transition) and daughter cell MAR in early G1 (first 30 min after abscission) for control, 1 µM RO-3306 and 50 nM OTSSP167 treatments. R-squared values are depicted on right.
Figure 7—figure supplement 2
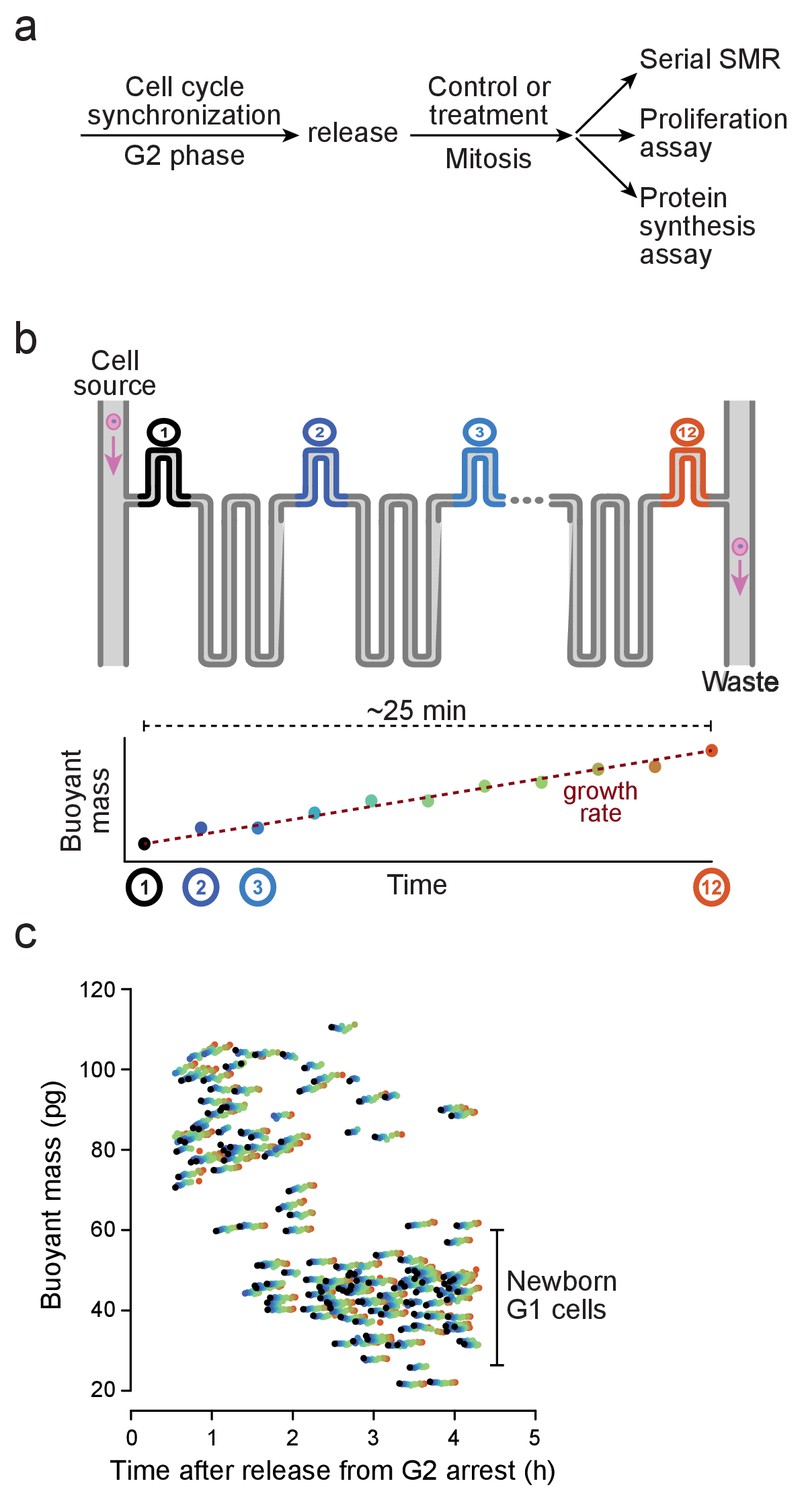
Daughter cell growth rate measurement workflow.
(a) Workflow for measuring MAR, protein synthesis and proliferation rate of G1 cells that have passed through mitosis under control or drug perturbed conditions. Mitotic RO-3306 treatments were washed away 3 hr after G2 release. (b) Top, schematic of serial SMR. Cells (pink circles) flow through 12 mass sensing cantilevers separated by delay channels to obtain consecutive mass measurements before being discarded. Bottom, the consecutive mass measurements (colored data points) are used to assign a growth (mass accumulation) rate (dashed red line) for each cell. The serial SMR does not allow long-term monitoring of growth but enables much higher MAR measurement throughput than the single cantilever SMR shown in (Figure 1—figure supplement 1a). (c) Representative serial SMR data from control L1210 cells (n = 4 independent experiments). G2 synchronized cells were released and the single-cell MAR was monitored by continuously sampling the population. Buoyant mass measured at each cantilever is displayed with different color, as shown at the bottom of (a). The G1 cell growth rates can be quantified by analyzing MAR only from the small (25 to 60 pg) cells.
Figure 7—figure supplement 3
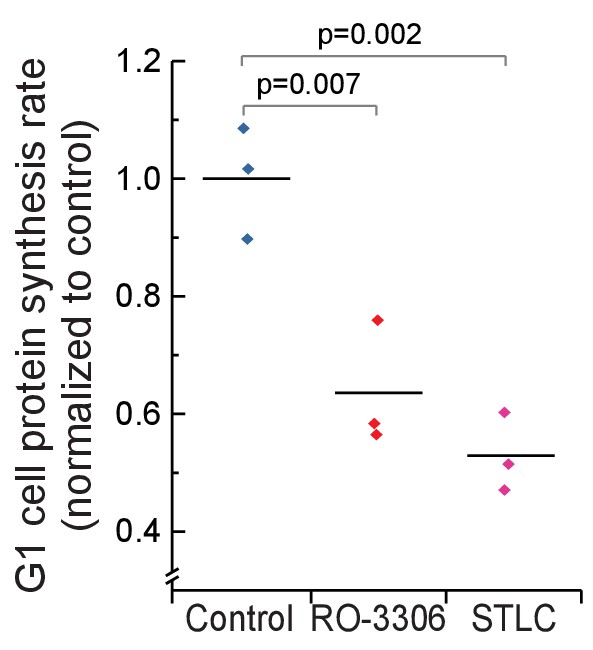
Daughter cells protein synthesis rates in G1 following mitotic growth inhibitions.
Protein synthesis rates of G1 L1210 cells from control (normal mitosis) and from cells that have undergone mitosis in the presence of 1 µM RO-3306 or from cells that have been arrested to mitosis for 4 hr with STLC before releasing to undergo cytokinesis. (n = 3 separate cultures).
Author response image 1
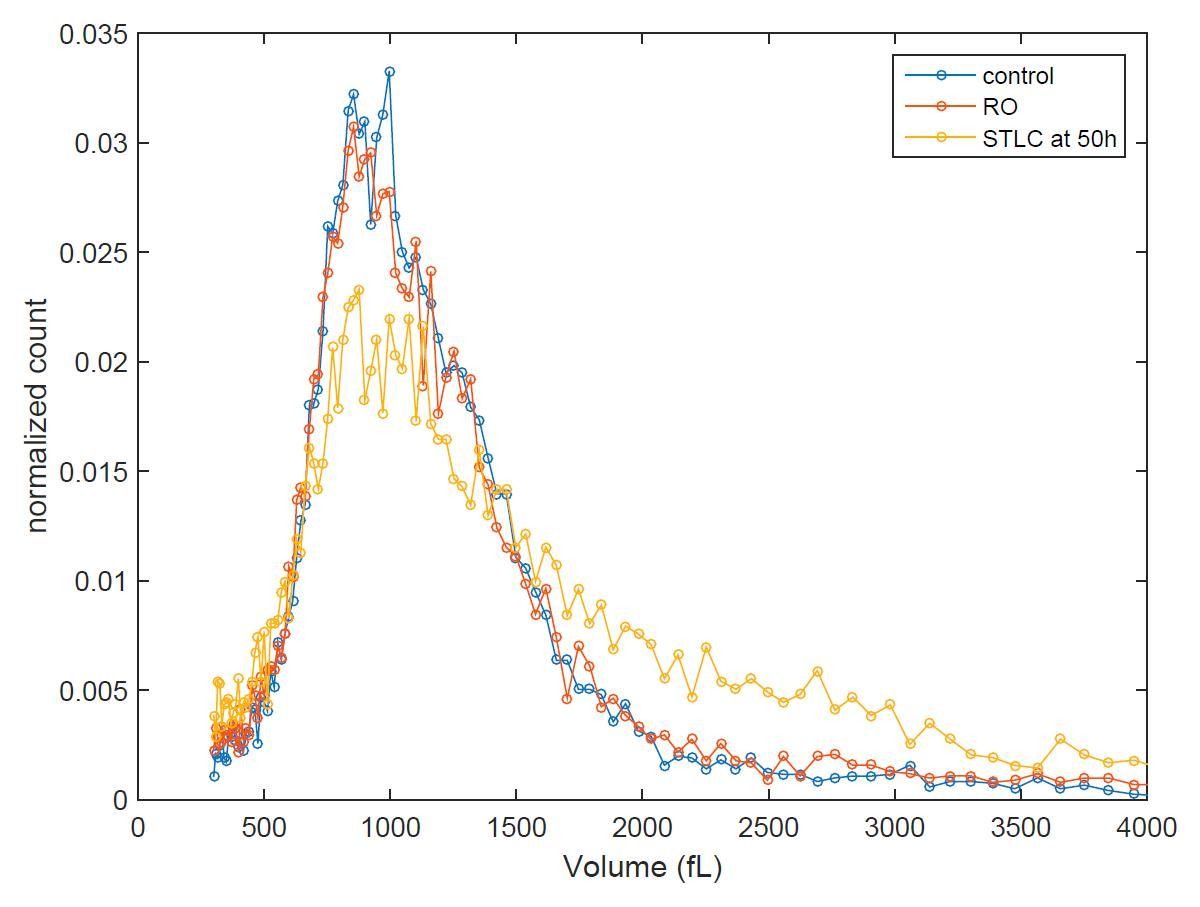
Cell size histograms of control (blue), RO-3306 (red) and STLC (yellow) treated L1210 cells 50 h after release from G2 (or mitotic for STLC) arrest.
Author response image 2
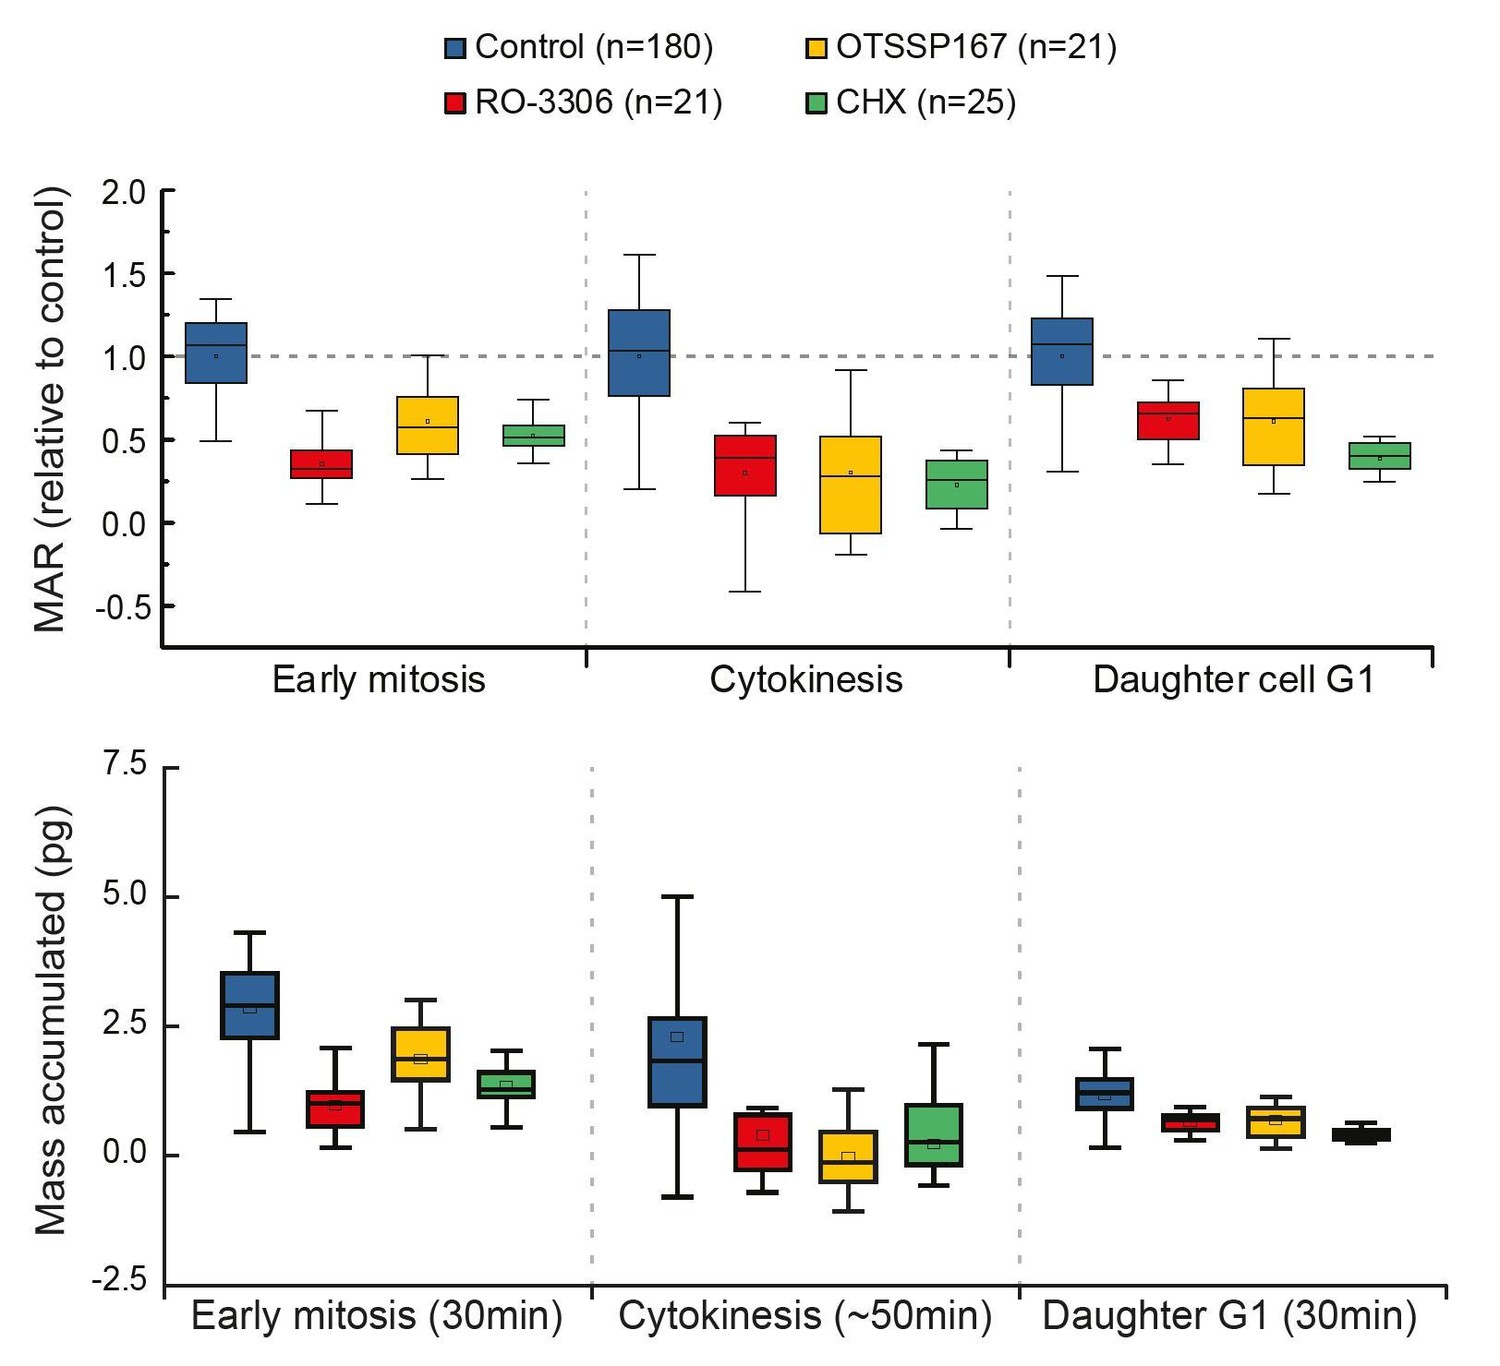
Comparison of cell growth in early mitosis, cytokinesis and early G1 after indicated drug treatments.
Normalized mass accumulation rate is displayed on top, while total mass accumulated is displayed on the bottom. Both formats of data presentation lead to the same conclusion.
Tables
Key resources table
| Reagent type (species) or resource | Designation | Source or reference | Identifiers | Additional information |
|---|---|---|---|---|
| Cell line (M. musculus) | L1210 | ATCC | Cat#CCL-219; RRID:CVCL_0382 | |
| Cell line (M. musculus) | L1210 - FUCCI | Other | Generated in a previous study (Son et al., 2012), Nature Methods), cells originate from ATCC (Cat#CCL-219). | |
| Cell line (M. musculus) | L1210 - ECACC | ECACC | Cat#87092804 | |
| Cell line (M. musculus) | Fl5.12 | Other | Kindly provided by laboratory of Prof. Matthew Vander Heiden from MIT | |
| Cell line (M. musculus) | BaF3 | RIKEN BioResource Center | Cat#RCB4476 | |
| Cell line (G. gallus) | DT40-CDK1as | Other | Kindly provided by laboratory of Prof. Bill Earnshaw from University of Edinburgh | |
| Cell line (H. sapiens) | S-HeLa | Other | Kindly provided by laboratory of Kevin Elias from Brigham And Women's Hospital | |
| Transfected construct (M. musculus) | Scrambled shRNA | VectorBuilder | Cat#LVS (VB151023-10034) | Refers to a lentiviral construct used to transfect and express the indicated shRNA. |
| Transfected construct (M. musculus) | 4E-BP1 shRNA #1 | VectorBuilder | Cat#LVS (VB181217-1124dqm)-C | Refers to a lentiviral construct used to transfect and express the indicated shRNA. |
| Transfected construct (M. musculus) | 4E-BP1 shRNA #2 | VectorBuilder | Cat#LVS (VB181217-1125ypy)-C | Refers to a lentiviral construct used to transfect and express the indicated shRNA. |
| Biological sample (H. sapiens) | Unpurified buffy coat for isolation of T-cells | Research Blood Components | NA | |
| Antibody | Phospho-Histone H3 (Ser10) (D2C8) XP Rabbit monoclonal Ab (Alexa Fluor 647 Conjugate) | Cell Signaling Technology | Cat#3458; RRID:AB_10694086 | Dilution 1/100 in PBS supplemented with 5% BSA |
| Antibody | Phospho-Histone H3 (Ser10) (D2C8) XP Rabbit monoclonal Ab (Alexa Fluor 488 Conjugate) | Cell Signaling Technology | Cat#3465; RRID:AB_10695860 | Dilution 1/100 in PBS supplemented with 5% BSA |
| Antibody | Cyclin B1 (V152) Mouse monoclonal Ab (Alexa Fluor 488 Conjugate) | Cell Signaling Technology | Cat#4112; RRID:AB_491024 | Dilution 1/50 in PBS supplemented with 5% BSA |
| Antibody | Phospho-4E-BP1 (Thr37/46) (236B4) Rabbit monoclonal Ab (PE Conjugate) | Cell Signaling Technology | Cat#7547; RRID:AB_10949897 | Dilution 1/100 in PBS supplemented with 5% BSA |
| Antibody | Phospho-S6 Ribosomal Protein (Ser235/236) (D57.2.2E) XP Rabbit monoclonal Ab (Alexa Fluor 647 Conjugate) | Cell Signaling Technology | Cat#4851; RRID:AB_10695457 | Dilution 1/100 in PBS supplemented with 5% BSA |
| Antibody | Rabbit (DA1E) monoclonal Ab IgG XP Isotype Control (PE Conjugate) | Cell Signaling Technology | Cat#5742; RRID:AB_10694219 | Dilution 1/100 in PBS supplemented with 5% BSA |
| Antibody | α-Tubulin (11H10) Rabbit monoclonal Ab (Alexa Fluor 488 Conjugate) | Cell Signaling Technology | Cat#5063; RRID:AB_10694858 | Dilution 1/200 in PBS supplemented with 5% BSA |
| Antibody | Cyclin A Mouse monoclonal Ab (H-3) (FITC Conjugate) | Santa Cruz Biotechnology | Cat#sc-271645; RRID:AB_10707658 | Dilution 1/25 in PBS supplemented with 5% BSA |
| Antibody | 4E-BP1 (53H11) Rabbit monoclonal Ab (PE Conjugate) | Cell Signaling Technology | Cat#34470 | Dilution 1/100 in PBS supplemented with 5% BSA |
| Antibody | Phospho-4EBP1 (Thr37, Thr46) Rabbit monoclonal Ab (4EB1T37T46-A5) | Thermo Fisher Scientific | Cat#MA5-27999; RRID:AB_2745012 | Dilution 1/100 in PBS supplemented with 5% BSA |
| Antibody | Goat polyclonal anti-Rabbit IgG (H + L) Cross-Adsorbed Secondary Antibody (Alexa Fluor 568 Conjugate) | Thermo Fisher Scientific | Cat#A-11011; RRID:AB_143157 | Dilution 1/1000 in PBS supplemented with 5% BSA |
| Commercial assay or kit | Click-iT Plus OPP Alexa Fluor 594 Protein Synthesis Assay Kit | Thermo Fisher Scientific | Cat#C10457 | |
| Commercial assay or kit | T-cell isolation kit | Miltenyi Biotec | Cat#130-096-495 | |
| Commercial assay or kit | Lambda Protein Phosphatase | New England Biolabs | Cat#P0753S | |
| Chemical compound, drug | O-propargyl-puromycin (OPP) | Jena Bioscience | Cat#NU-931–5; CAS:1416561-90-4 | |
| Chemical compound, drug | S-trityl-l-cysteine (STLC) | Sigma-Aldrich | Cat#164739; CAS:2799-07-7 | |
| Chemical compound, drug | Nocodazole | Sigma-Aldrich | Cat#M1404; CAS:31430-18-9 | |
| Chemical compound, drug | MG132 | Sigma-Aldrich | Cat#474787; CAS:133407-82-6 | |
| Chemical compound, drug | proTAME | Thermo Fisher Scientific | Cat#I44001M; CAS:1362911-19-0 | |
| Chemical compound, drug | Vinblastine | Cayman Chemical | Cat#11762; CAS:143-67-9 | |
| Chemical compound, drug | Vincristine | Cayman Chemical | Cat#11764; CAS:2068-78-2 | |
| Chemical compound, drug | TORIN-1 | Tocris Bioscience | Cat#4247; CAS: 1222998-36-8 | |
| Chemical compound, drug | RO-3306 | Cayman Chemical | Cat#15149; CAS:872573-93-8 | We observed the chemical loses its activity within a month when stored in −20°C. All experiments were done using a stock under 2 weeks old. |
| Chemical compound, drug | OTSSP167 (OTS) | Cayman Chemical | Cat#16873; CAS:1431698-10-0 | |
| Chemical compound, drug | 1NM-PP1 | Sigma-Aldrich | Cat#529581; CAS:221244-14-0 | |
| Chemical compound, drug | 4EGI-1 | Cayman Chemical | Cat#15362; CAS:315706-13-9 | |
| Chemical compound, drug | Cycloheximide (CHX) | Cayman Chemical | Cat#14126; CAS:66-81-9 | |
| Chemical compound, drug | Defactinib | Cayman Chemical | Cat#17737; CAS:1073154-85-4 | |
| Chemical compound, drug | PF-3758309 | Cayman Chemical | Cat#19186; CAS:898044-15-0 | |
| Chemical compound, drug | Nintedanib | Cayman Chemical | Cat#11022; CAS:656247-17-5 | |
| Chemical compound, drug | SNS-032 | Cayman Chemical | Cat#17904; CAS:345627-80-7 | |
| Chemical compound, drug | Tozasertib | Cayman Chemical | Cat#13600; CAS:639089-54-6 | Alternative Names : MK 0457, VX 680 |
| Chemical compound, drug | GSK 626616 | R and D Systems | Cat#6638; CAS:1025821-33-3 | |
| Chemical compound, drug | EIPA | Sigma-Aldrich | Cat#A3085; CAS:1154-25-2 | |
| Chemical compound, drug | (-)-Blebbistatin | Sigma-Aldrich | Cat#B0560; CAS:856925-71-8 | |
| Software, algorithm | MATLAB R2014b | MathWorks | Used to analyze the SMR raw data and generate data plots. | |
| Software, algorithm | OriginPro 2019 | OriginLab | Used to perform statistical analyses and generate data plots. | |
| Software, algorithm | Mass accumulation rate analysis code | This paper | Used to analyze the SMR data. Code can be found attached to this manuscript. |
Additional files
-
Source code 1
Mass accumulation rate analysis code.
- https://doi.org/10.7554/eLife.44700.024
-
Transparent reporting form
- https://doi.org/10.7554/eLife.44700.025
Download links
A two-part list of links to download the article, or parts of the article, in various formats.
Downloads (link to download the article as PDF)
Open citations (links to open the citations from this article in various online reference manager services)
Cite this article (links to download the citations from this article in formats compatible with various reference manager tools)
Mammalian cell growth dynamics in mitosis
eLife 8:e44700.
https://doi.org/10.7554/eLife.44700


