Structural mechanisms of phospholipid activation of the human TPC2 channel
- University of Texas Southwestern Medical Center, United States
- Howard Hughes Medical Institute, University of Texas Southwestern Medical Center, United States
- Zhejiang University School of Medicine, China
Figures
Figure 1 with 4 supplements
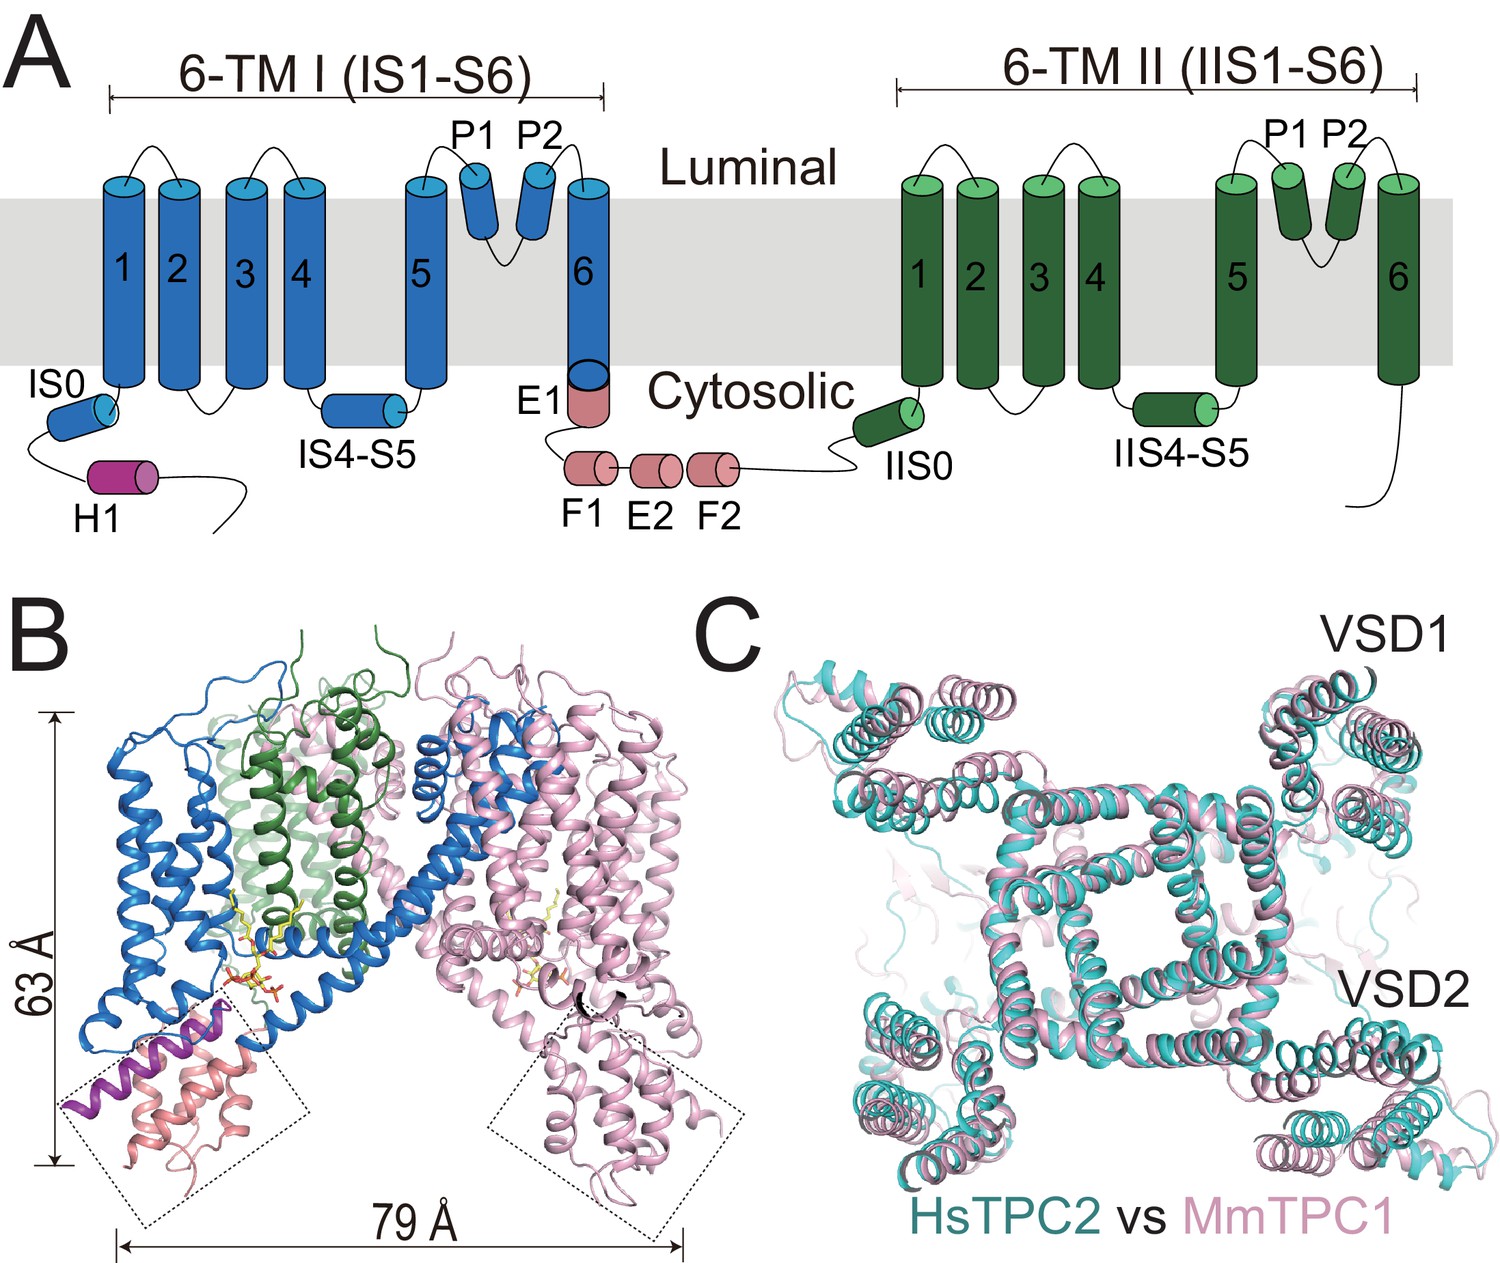
Overall structure of HsTPC2.
(A) Topology and domain arrangement of an HsTPC2 subunit. (B) Cartoon representation of HsTPC2 with one subunit colored as that in (A) and another in pink. PI(3,5)P2 are shown as yellow sticks. The two EF-hand domains are boxed. (C) Overall structural alignment of HsTPC2 (cyan) and MmTPC1 (pink).
-
Figure 1—source data 1
Cryo-EM data collection and model statistics.
- https://doi.org/10.7554/eLife.45222.007
Figure 1—figure supplement 1
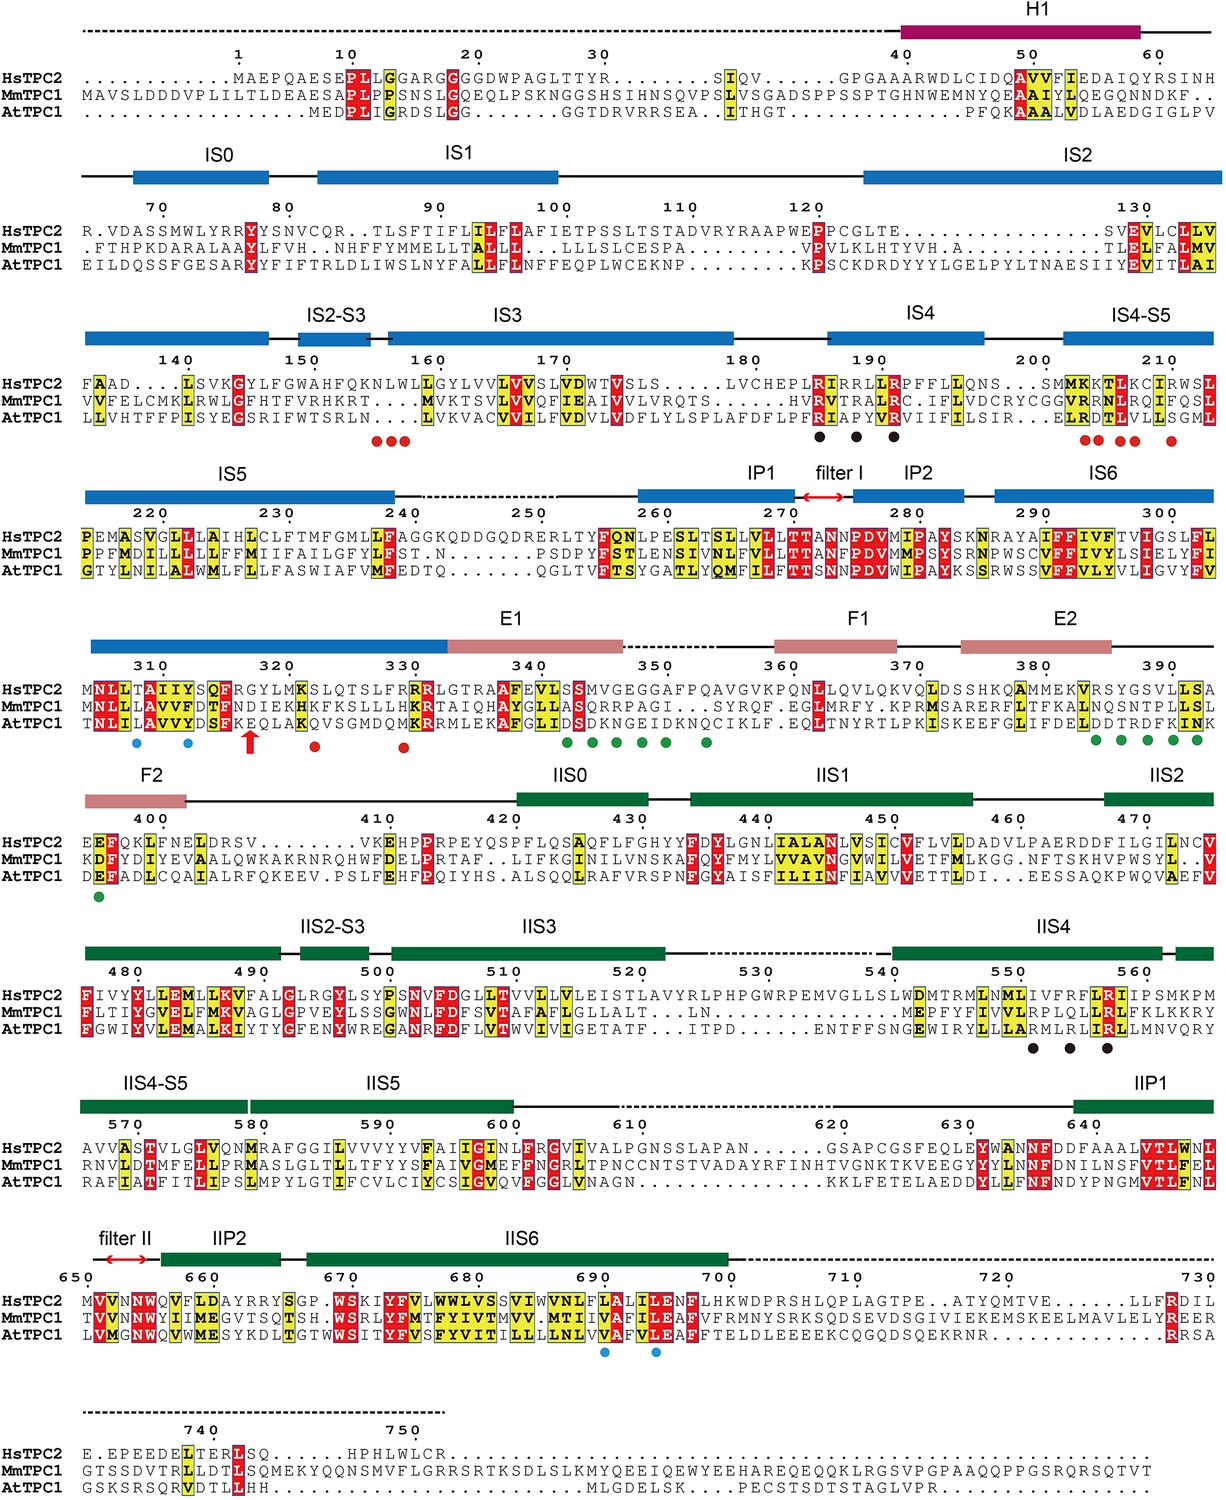
Sequence alignment of HsTPC2, MmTPC1 and AtTPC1.
Secondary structure assignments are based on the PI(3,5)P2-bound open HsTPC2 structure. Red dots indicate the ligand binding residues; black dots indicate the S4 arginine residues; cyan dots indicate the key S6 gating residues; green dots indicate the residues predicted to participate in calcium coordination in the EF-hand domains of AtTPC1; red arrow indicates the Gly317 on IS6 where the helix breaks in the closed state.
Figure 1—figure supplement 2
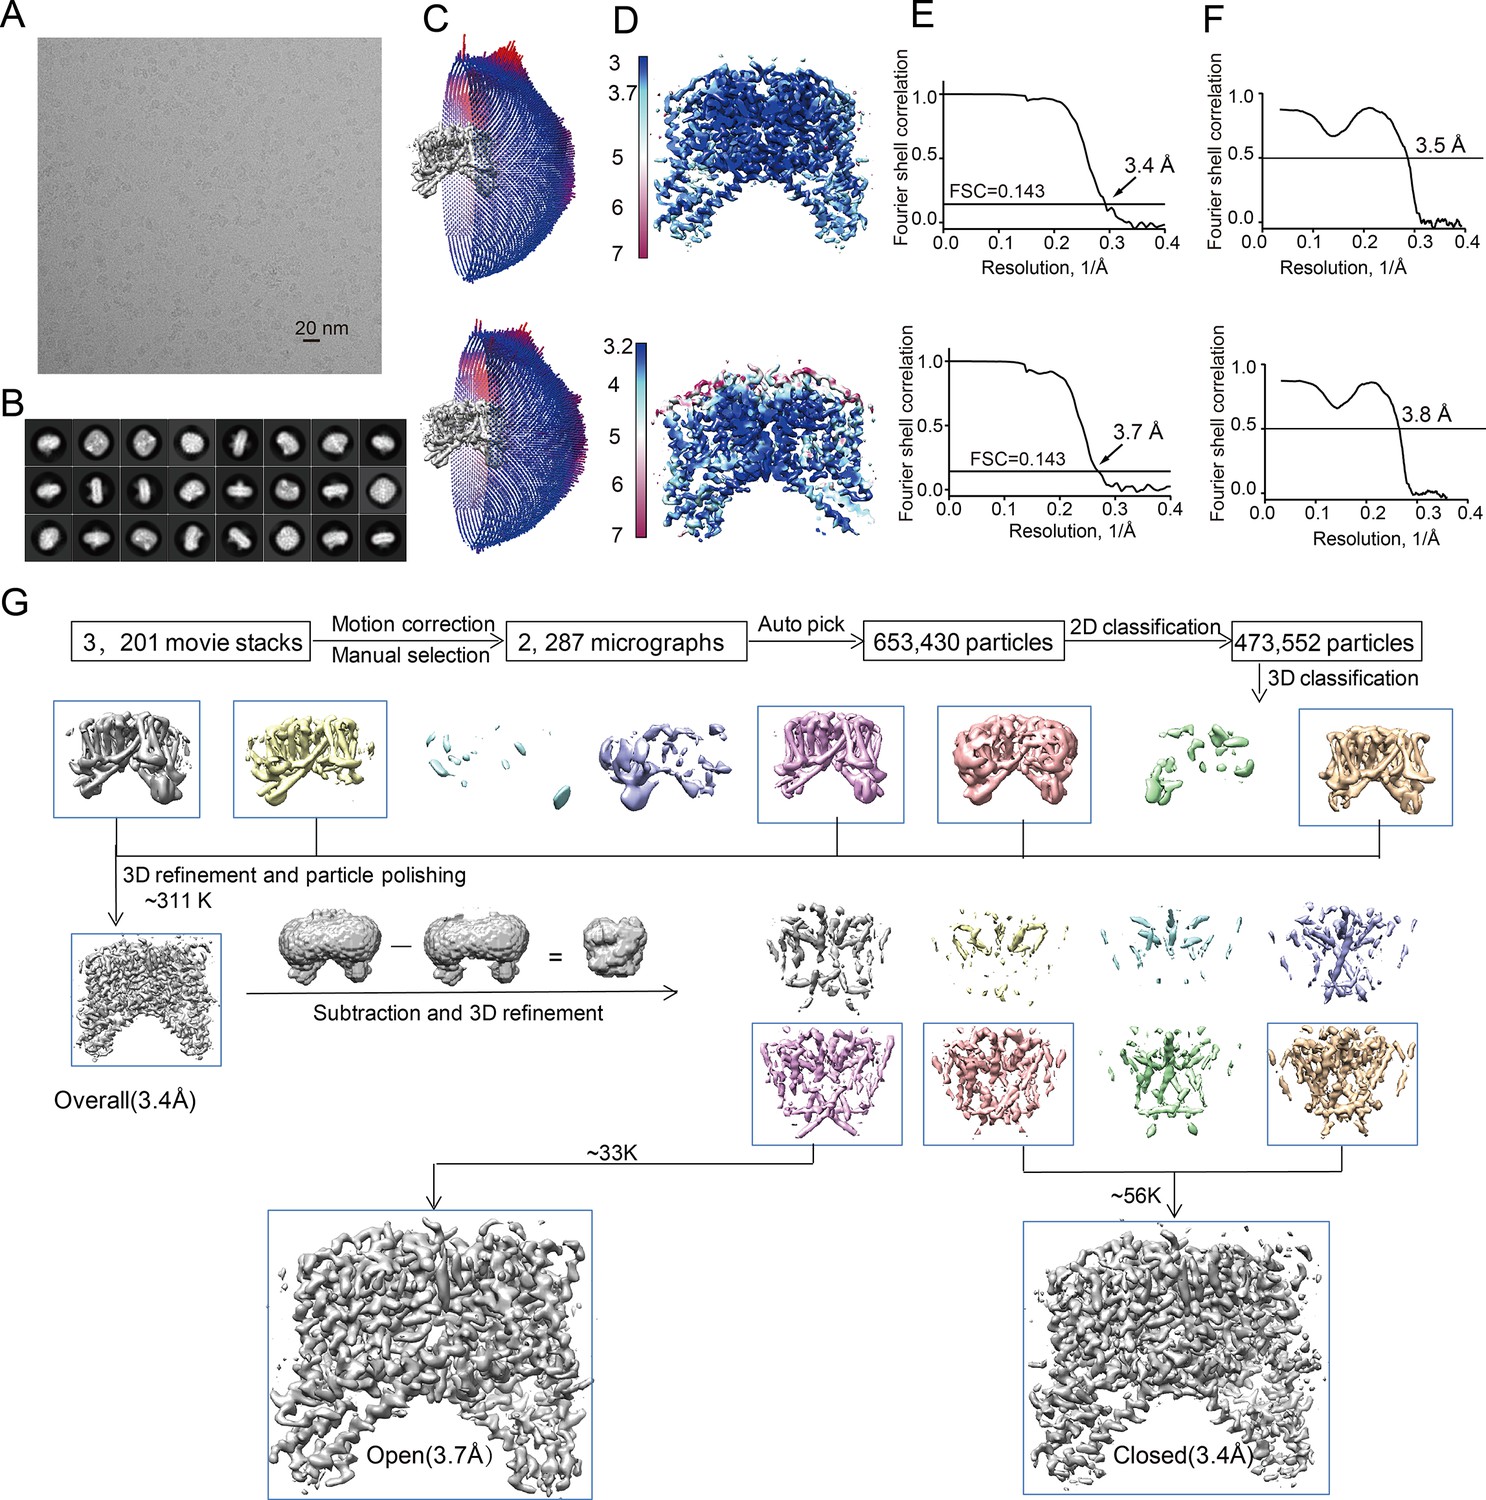
Structure determination of the PI(3,5)P2-bound HsTPC2.
(A) Representative electron micrograph of the PI(3,5)P2-bound HsTPC2. (B) 2D class averages. (C–F) The PI(3,5)P2-bound closed state (upper panel) and PI(3,5)P2-bound open state (bottom panel): (C) Euler angle distribution of particles used in the final 3D reconstruction, with the heights of the cylinders corresponding to the number of particles; (D) Final density maps colored by local resolution; (E) Gold-standard FSC curves of the final 3D reconstructions; (F) FSC curves for cross-validation between the models and the maps. (G) Flowchart of EM data processing for the PI(3,5)P2-bound HsTPC2 particles.
Figure 1—figure supplement 3
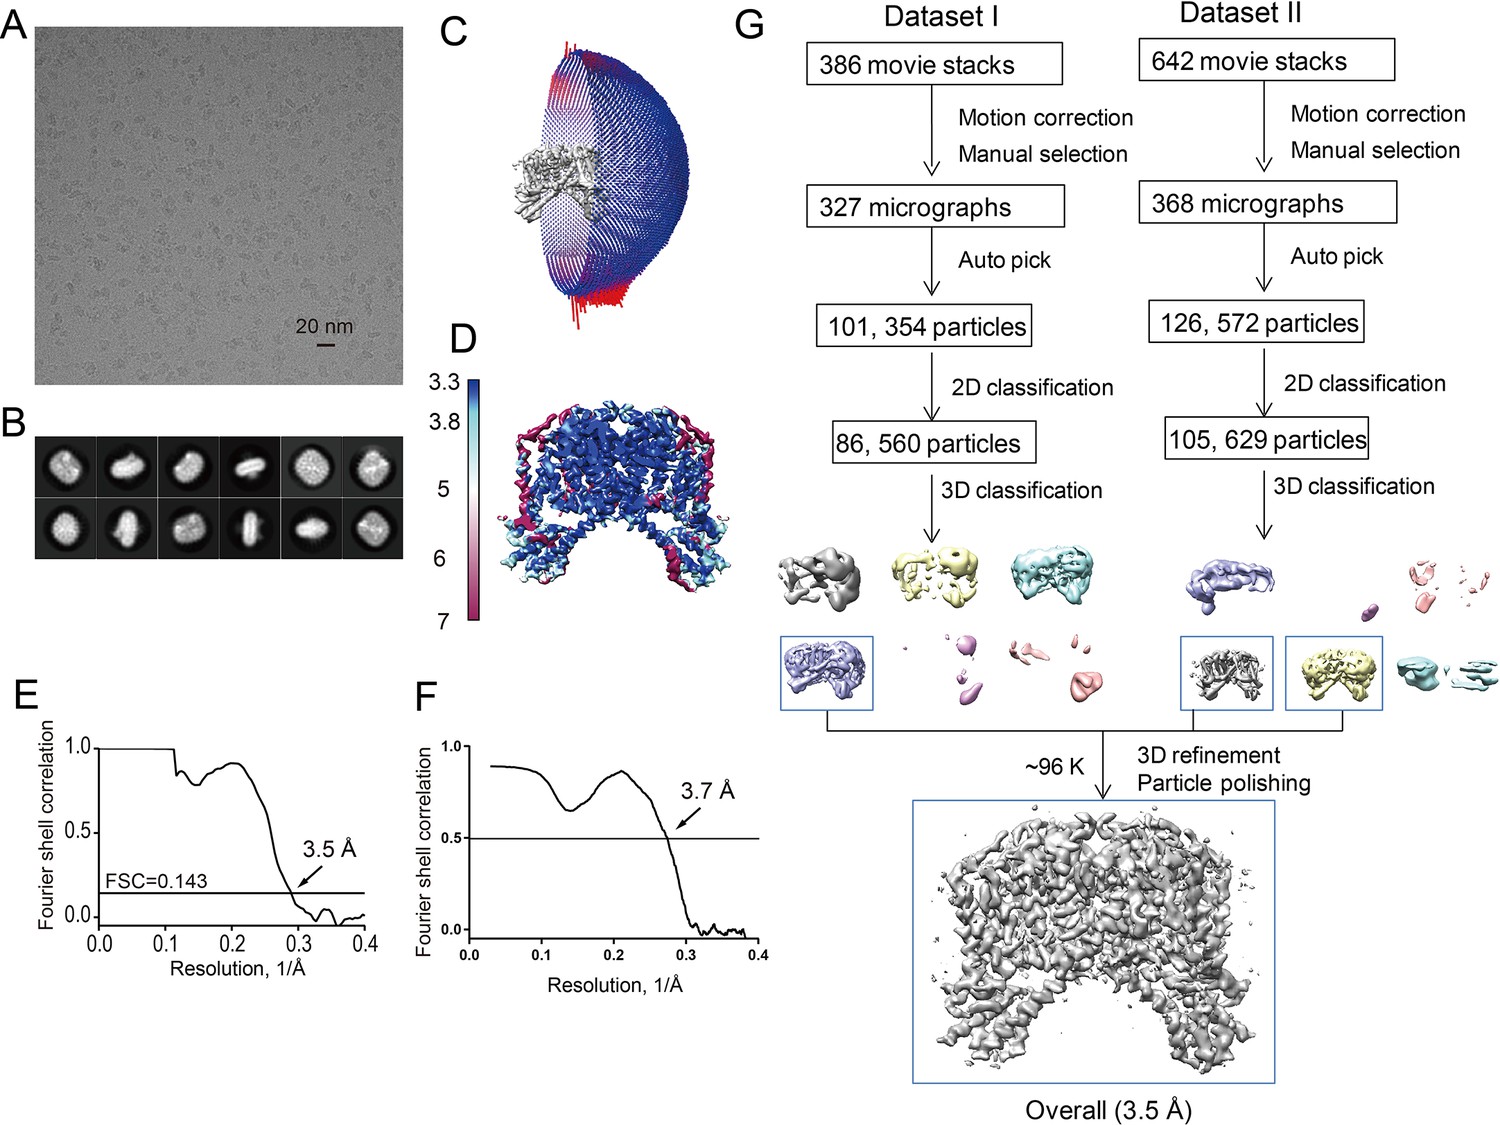
Structure determination of the apo HsTPC2.
(A) Representative electron micrograph of apo HsTPC2. (B) 2D class averages. (C) Euler angle distribution of particles used in the final 3D reconstruction, with the heights of the cylinders corresponding to the number of particles. (D) Final density maps colored by local resolution. (E) Gold-standard FSC curves of the final 3D reconstructions. (F) FSC curves for cross-validation between the model and map. (G) Flowchart of EM data processing for the apo HsTPC2 particles.
Figure 1—figure supplement 4
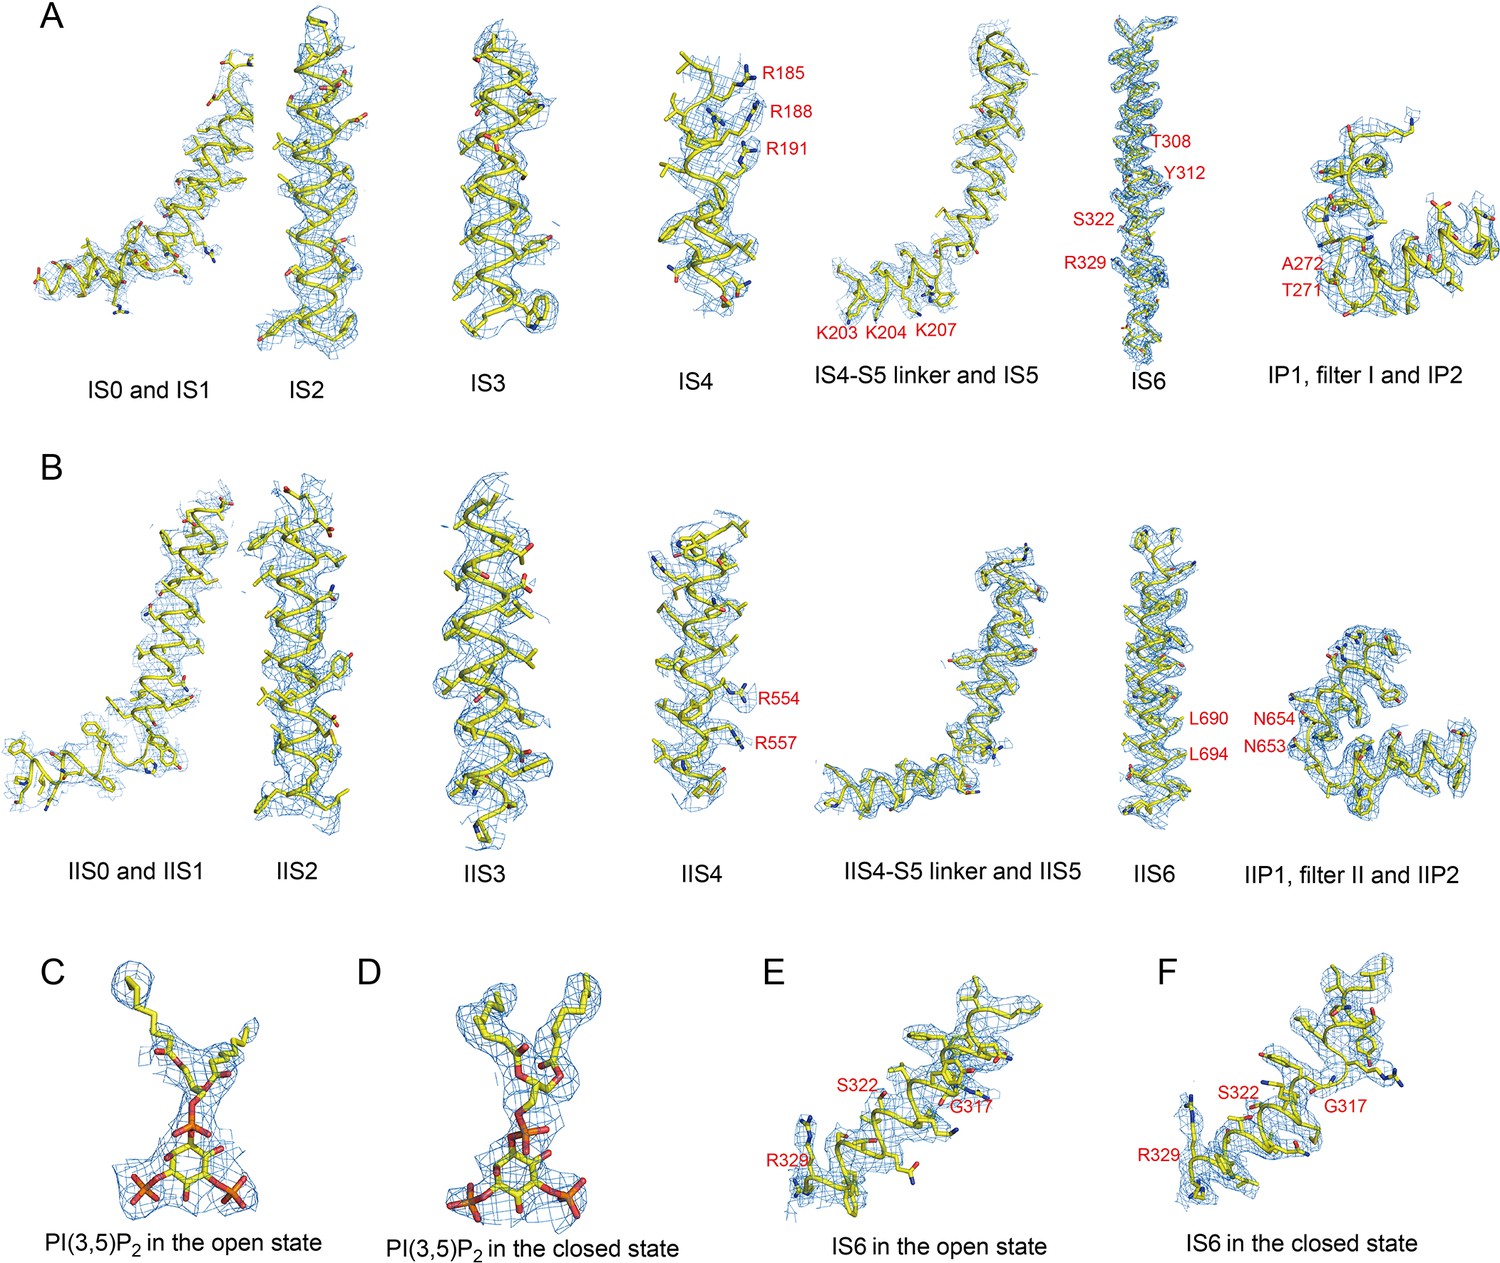
Sample EM density maps (blue mesh) for HsTPC2.
(A and B) Sample EM density maps for various parts of the PI(3,5)P2-bound open HsTPC2 structure: IS1-S6 and filter I (A), IIS1-S6 and filter II (B). (C and D) The EM density maps of the PI(3,5)P2 structure in the open (C) and closed (D) states. (E and F) The EM density maps of parts of IS6 in the open (E) and closed (F) states. The map of the open state is low-pass filtered to 3.7 Å and sharpened with a temperature factor of −121.09 Å2; the map of the closed state is low-pass filtered to 3.4 Å and sharpened with a temperature factor of −125.71 Å2. Key residues discussed in the main text are labeled in red.
Figure 2
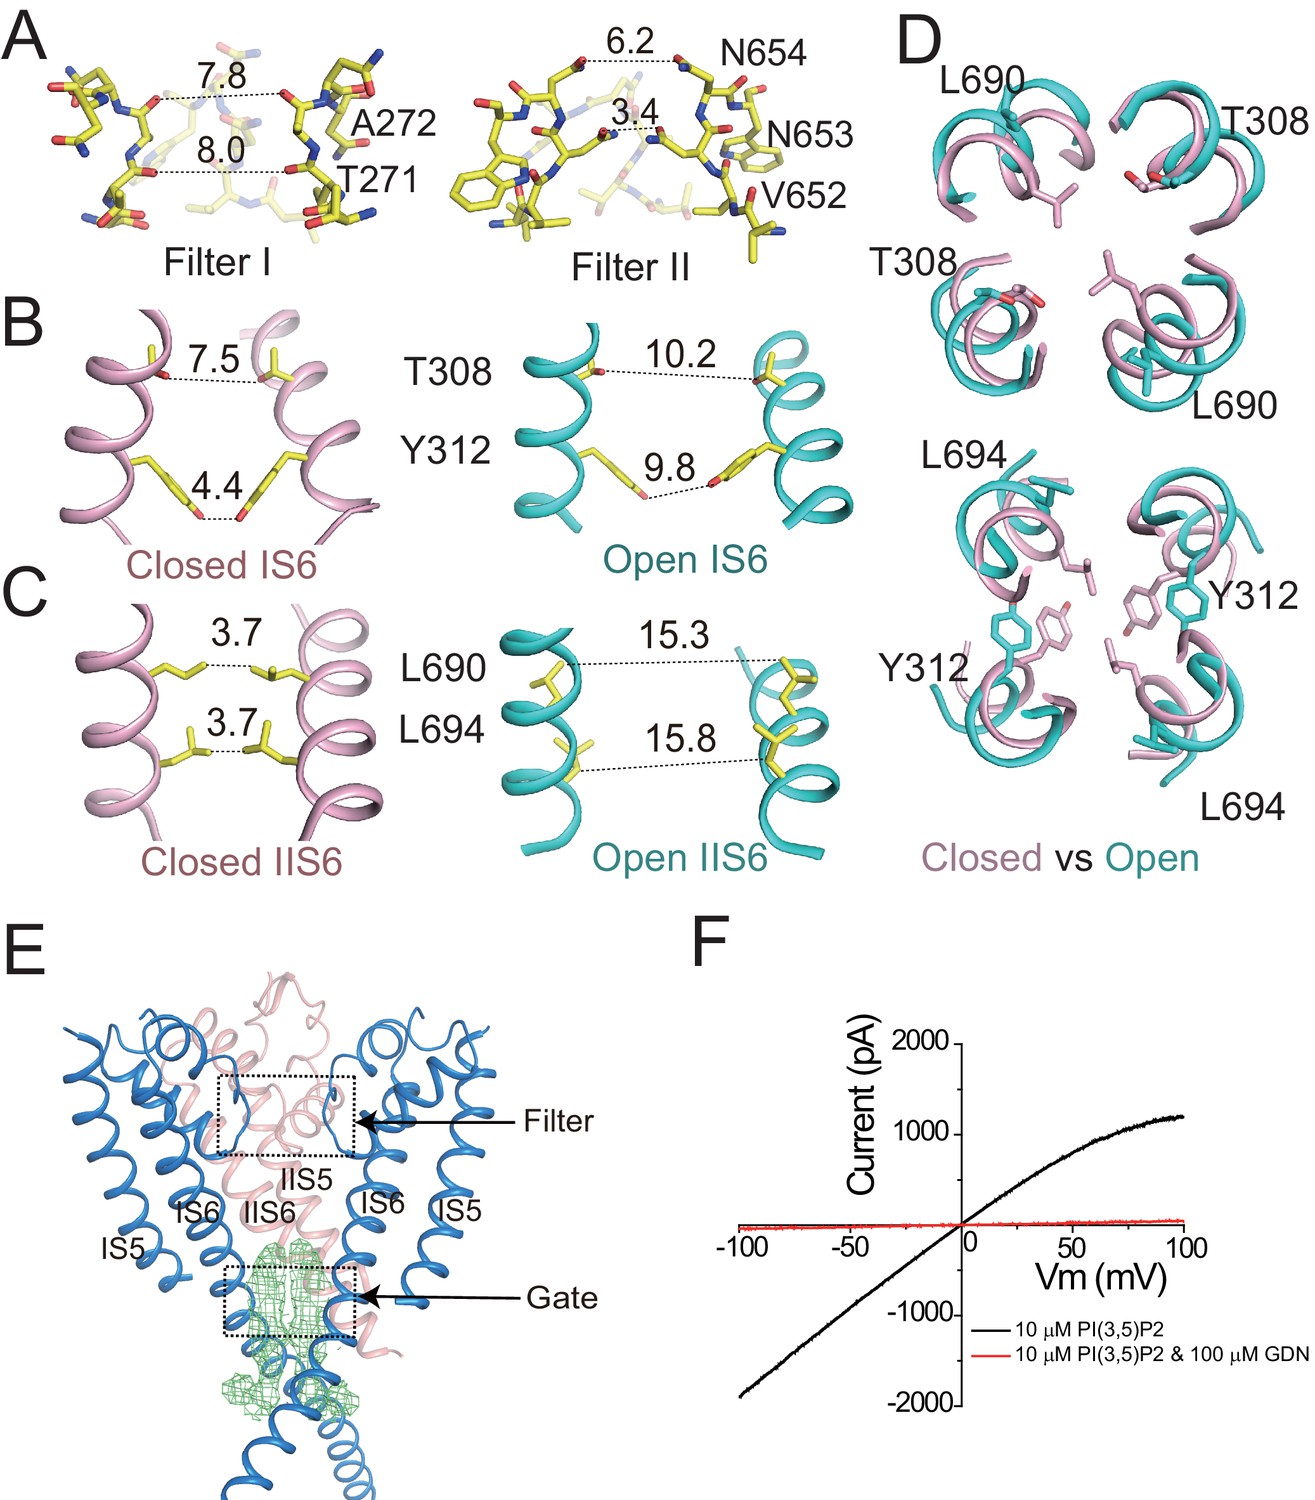
Ion conduction pore of HsTPC2.
(A) The selectivity filter formed by filter I and filter II with the front subunit removed for clarity. (B and C) Side view of the bundle crossing formed by IS6 (B) and IIS6 (C) in the PI(3,5)P2-bound closed (pink) and PI(3,5)P2-bound open (cyan) states. Numbers are cross distances (in Å) at the constriction points. (D) Structural comparison of the cytosolic gate between the closed and open states viewed from the cytosolic side in two sections: Thr308/Leu690 (top) and Tyr312/Leu694 (below). (E) Side view of the EM density (green mesh) in the cytosolic gate of PI(3,5)P2-bound open structure. The filter region and the cytosolic gate are boxed. (F) Sample I–V curves of HsTPC2 recorded using inside-out patches with or without GDN in bath solutions. Data shown in (F) were repeated five times independently with similar results.
Figure 3
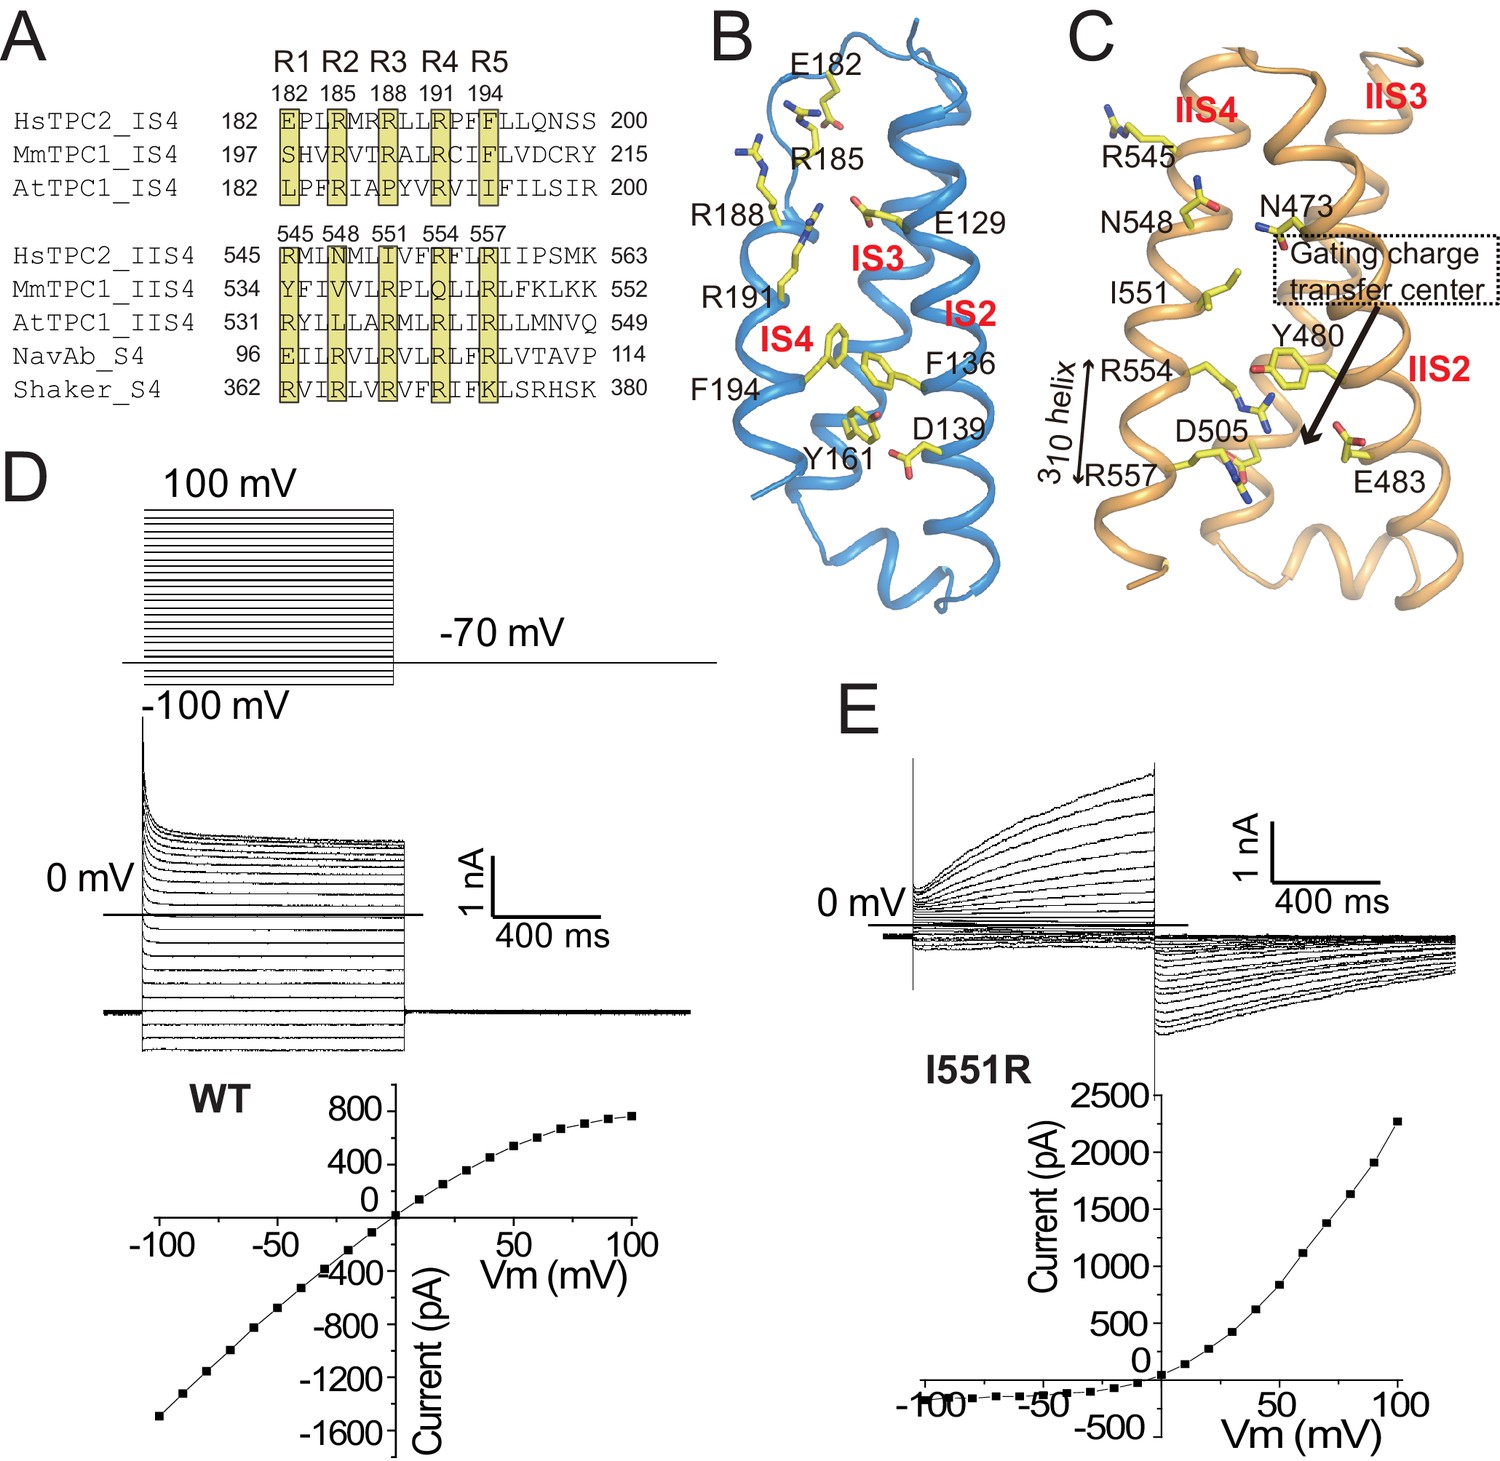
The voltage-sensing domains.
(A) Partial S4 sequence alignment and arginine registry. Residues at the R1-R5 positions on IS4 and IIS4 of HsTPC2 are numbered. (B) Side view of VSD1 with IS1 omitted for clarity. (C) Side view of VSD2 with IIS1 omitted for clarity. (D and E) Sample traces and I-V curves of voltage activation of HsTPC2 (D) and its IIS4 arginine mutation Ile551Arg (E) recorded in the whole cell configuration with 10 µM PI(3,5)P2 in the pipette. Sample I-V curves were obtained from the currents at the end of the activation voltage steps. Data shown in (D) and (E) were repeated five times independently with similar results.
Figure 4 with 1 supplement
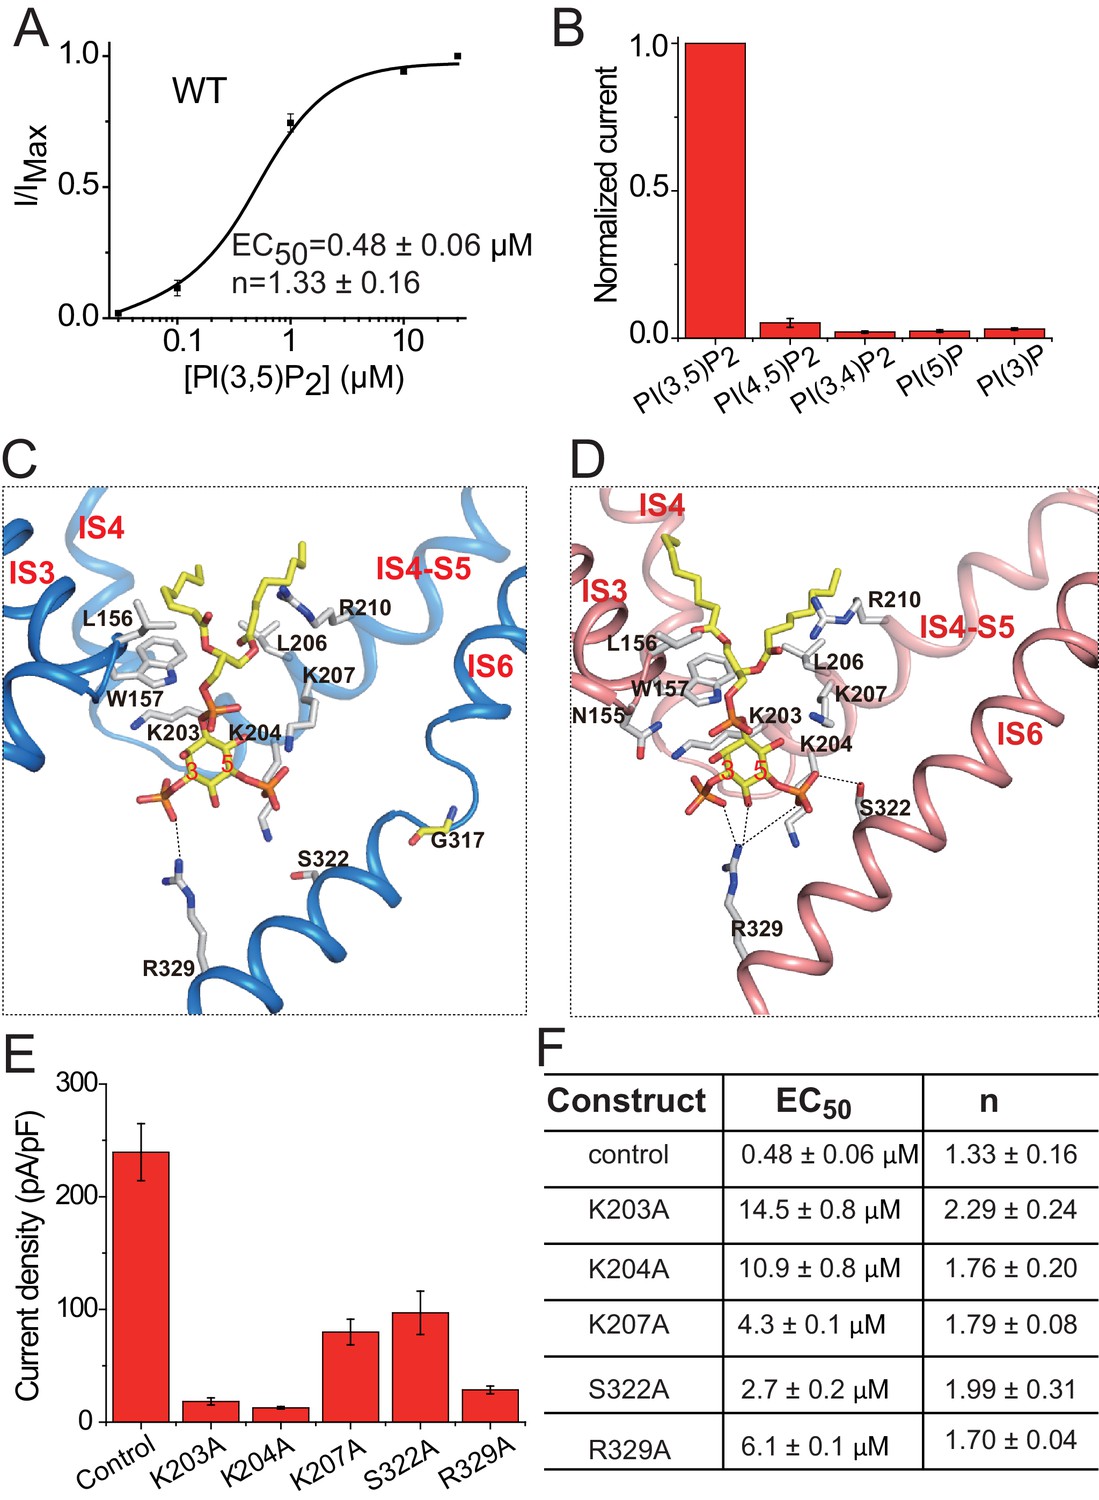
PI(3,5)P2 binding in HsTPC2.
(A) Concentration-dependent PI(3,5)P2 activation of HsTPC2 at −100 mV. Curves are least square fits to the Hill equation. Data points are mean ± s.e.m. (n = 5 independent experiments). (B) Ligand specificity of HsTPC2. Normalized currents of HsTPC2 measured at −100 mV in inside-out patches with the presence of various phosphatidylinositol lipids at 10 µM. (C and D) Ligand binding site in 6-TM I of HsTPC2 both in the PI(3,5)P2-bound closed (C) and open (D) states. (E) Current density of mutations at the PI(3,5)P2-binding site measured at −100 mV by whole cell recordings with 100 µM PI(3,5)P2. All mutants were generated on the background of the Leu11Ala/Leu12Ala mutant, which was used as the wild-type control. Data in (B) and (E) are shown as mean ±s.e.m. (n ≥ 6 independent experiments). (F) Measured EC50 and Hill coefficient values for the mutants. Data are mean ±s.e.m. (n ≥ 5 independent experiments). Source data for Figure 4A,B,E and F are available in Figure 4—source data 1.
-
Figure 4—source data 1
Source data for Figure 4A, B, E and F.
- https://doi.org/10.7554/eLife.45222.012
Figure 4—figure supplement 1
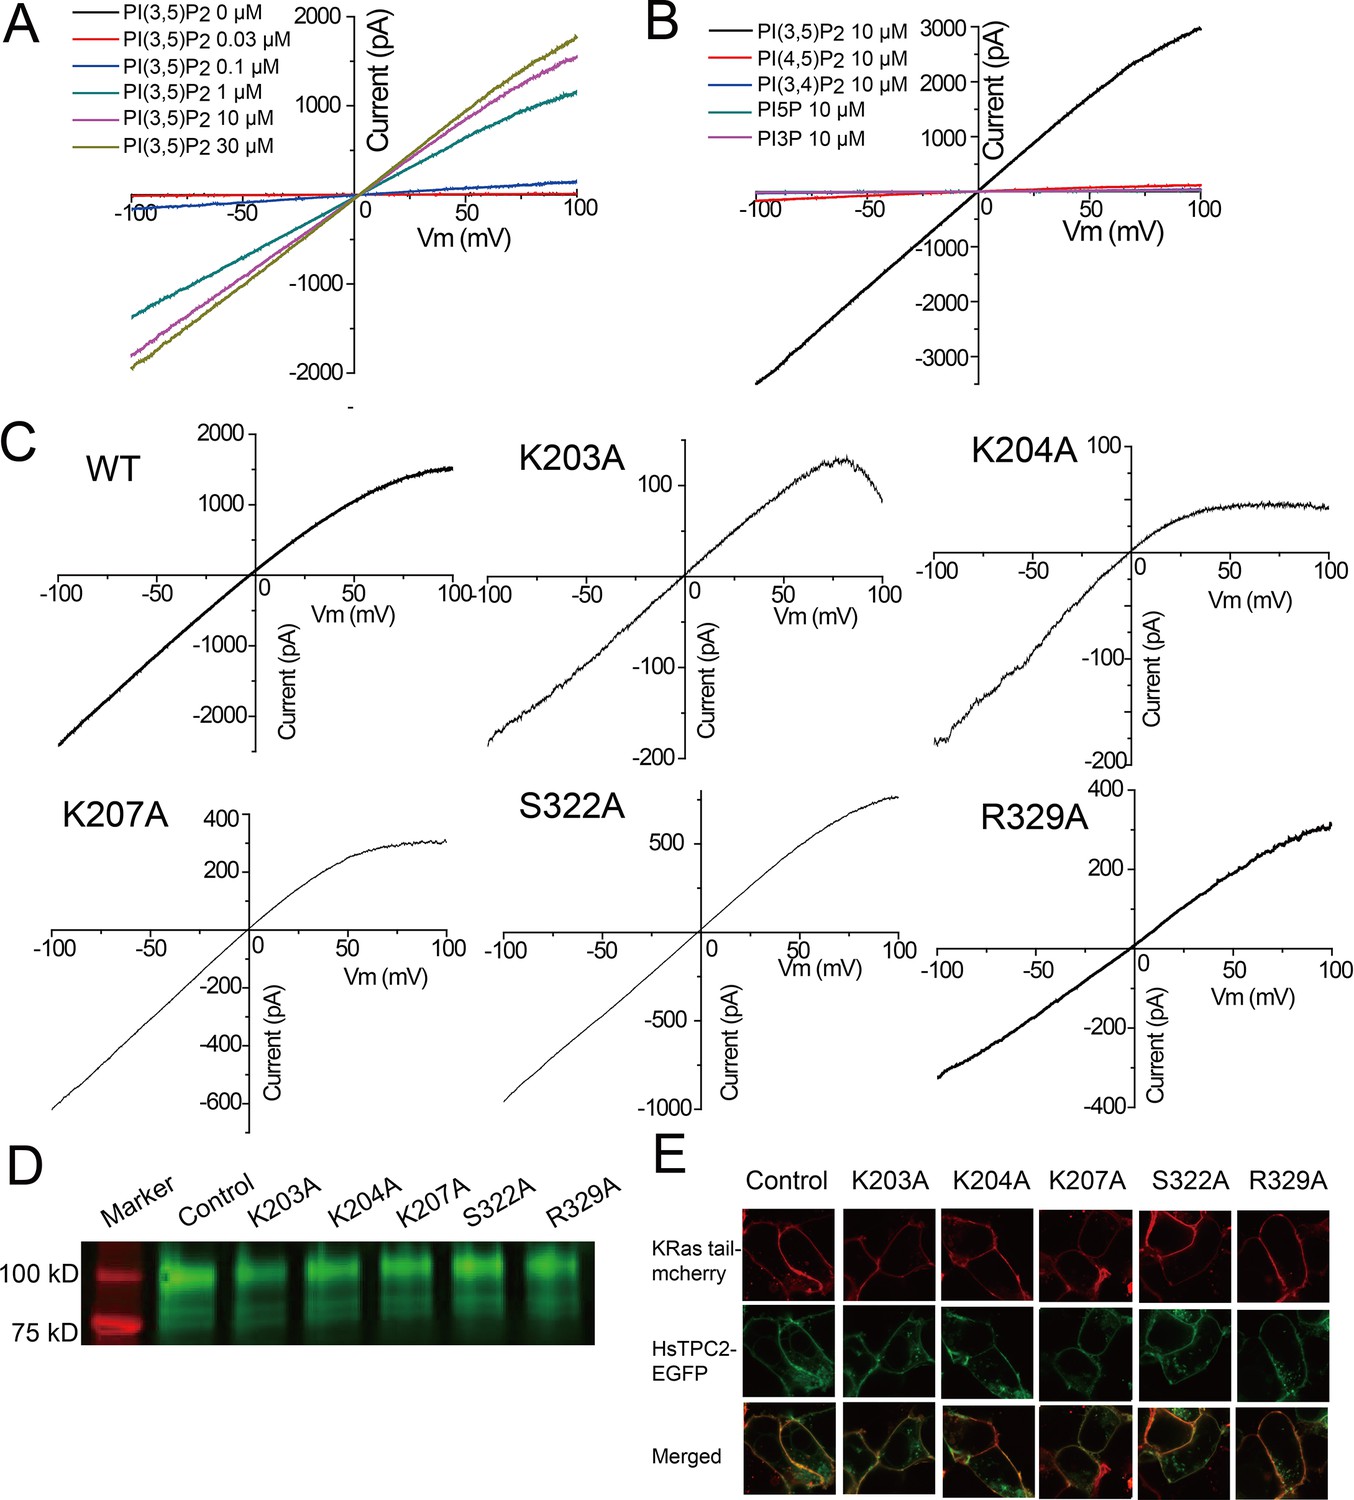
PI(3,5)P2 binding in HsTPC2.
(A) Sample I-V curves of HsTPC2 recorded using excised patches with varying PI(3,5)P2 concentrations in the bath (cytosolic) solution. Currents at −100 mV were used to generate the concentration-dependent PI(3,5)P2 activation curve shown in Figure 4A. (B) Sample I-V curves of HsTPC2 recorded on the same patch with different phosphatidylinositol lipids. (C) Sample I-V curves of mutations at the PI(3,5)P2-binding site measured in whole cell recordings. Currents at −100 mV were used to generate the Figure 4E. (D) Overall expression of GFP-tagged HsTPC2 mutants. (E) Plasma membrane localization of HsTPC2 mutants expressed in HEK293 cells. Experiments shown in (A–E) were repeated five times independently with similar results.
Figure 5 with 1 supplement
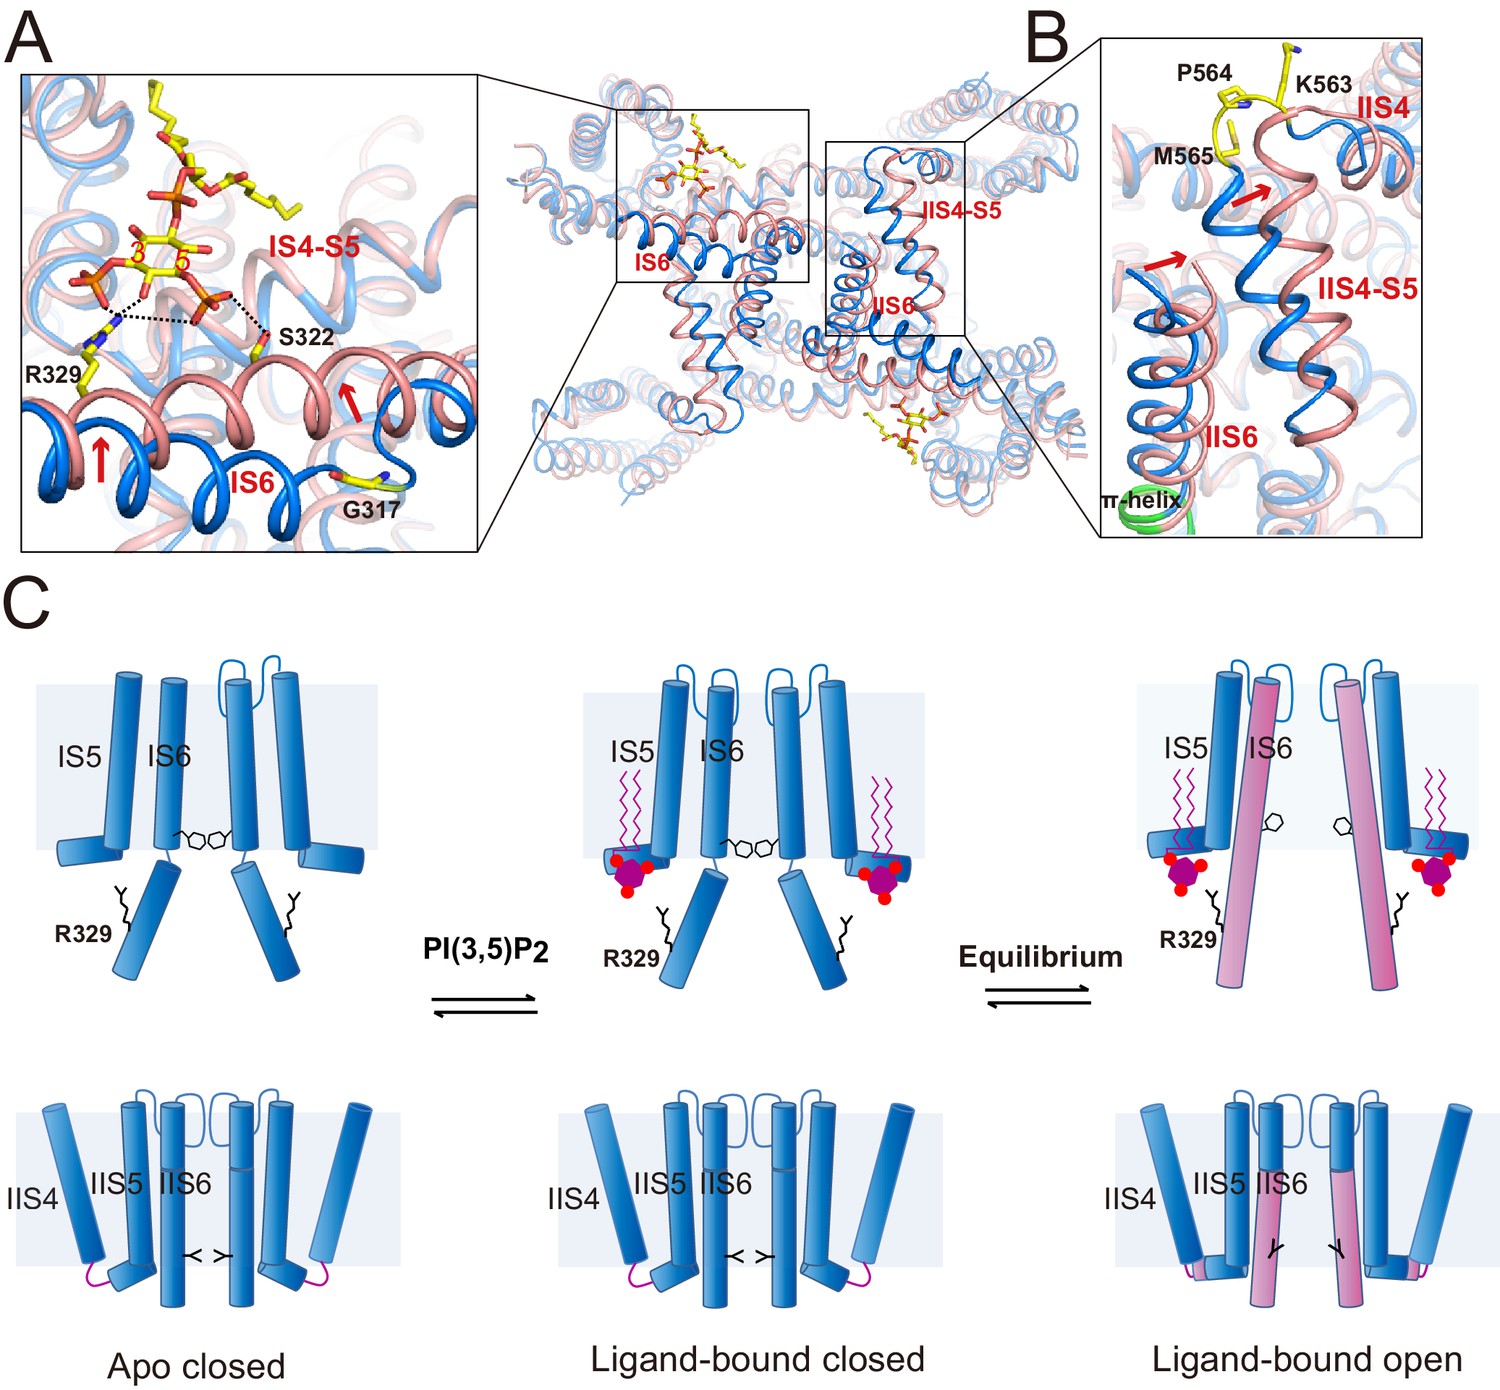
Gating mechanism for HsTPC2.
(A and B) Structural comparison between the PI(3,5)P2-bound open (pink) and closed (blue) HsTPC2 with zoomed-in views of the structural changes at IS6 (A) and IIS(6)/IIS4-S5 (B) regions. Arrows indicate structural movements. Key gating residues are shown as yellow sticks. The π-helix in IIS6 is shown in green. (C) Working model for PI(3,5)P2 activation of HsTPC2.
Figure 5—figure supplement 1
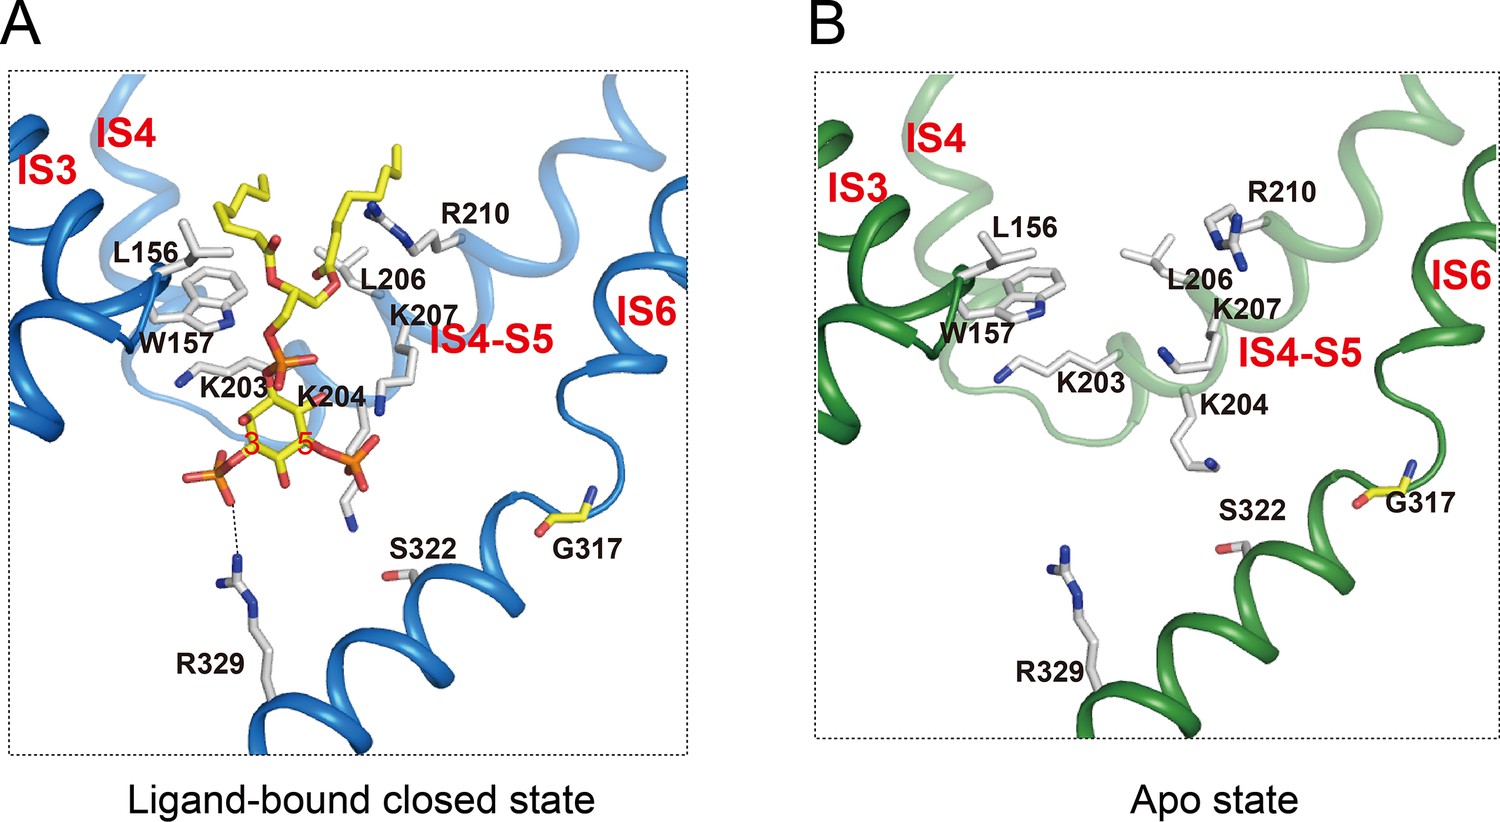
PI(3,5)P2 binding site in HsTPC2.
(A and B) Ligand binding site in the 6-TM I of HsTPC2 in the ligand-bound closed (A) and apo (B) states.
Tables
Key resources table
| Reagent type (species) or resource | Designation | Source or reference | Identifiers | Additional information |
|---|---|---|---|---|
| Gene (Human sapiens) | TPC2 | DOI: 10.1038/nature08030 | NCBI: AY029200 | |
| Cell line (Homo sapiens) | Freestyle 293 F | Thermo Fisher Scientific | RRID:CVCL_D603 | |
| Cell line (Spodoptera frugiperda) | Sf9 | Thermo Fisher Scientific | RRID:CVCL_0549 | |
| Chemical compound | PI(3,5)P2 diC8 | Echelon | Catalog No.: P-3508 | |
| Recombinant DNA reagent | pEZT-BM | DOI: 10.1016/j.str.2016.03.004 | Addgene: 74099 | |
| Software, algorithm | MotionCor2 | DOI: 10.1038/nmeth.4193 | ||
| Software, algorithm | GCTF | DOI: 10.1016/j.jsb.2015.11.003 | ||
| Software, algorithm | RELION2 | DOI: 10.7554/eLife.18722 | ||
| Software, algorithm | Coot | DOI: 10.1107/S0907444910007493 | RRID:SCR_014222 | |
| Software, algorithm | Phenix | DOI: 10.1107/S2059798318006551 | RRID:SCR_014224 | |
| Software, algorithm | PyMOL | Schrödinger | RRID:SCR_000305 | |
| Software, algorithm | Chimera | UCSF | RRID:SCR_004097 |
Additional files
-
Transparent reporting form
- https://doi.org/10.7554/eLife.45222.015
Download links
A two-part list of links to download the article, or parts of the article, in various formats.
Downloads (link to download the article as PDF)
Open citations (links to open the citations from this article in various online reference manager services)
Cite this article (links to download the citations from this article in formats compatible with various reference manager tools)
Structural mechanisms of phospholipid activation of the human TPC2 channel
eLife 8:e45222.
https://doi.org/10.7554/eLife.45222


