Can education be personalised using pupils’ genetic data?
- MRC Integrative Epidemiology Unit, University of Bristol, United Kingdom
- Population Health Sciences, Bristol Medical School, University of Bristol, United Kingdom
Figures
Figure 1
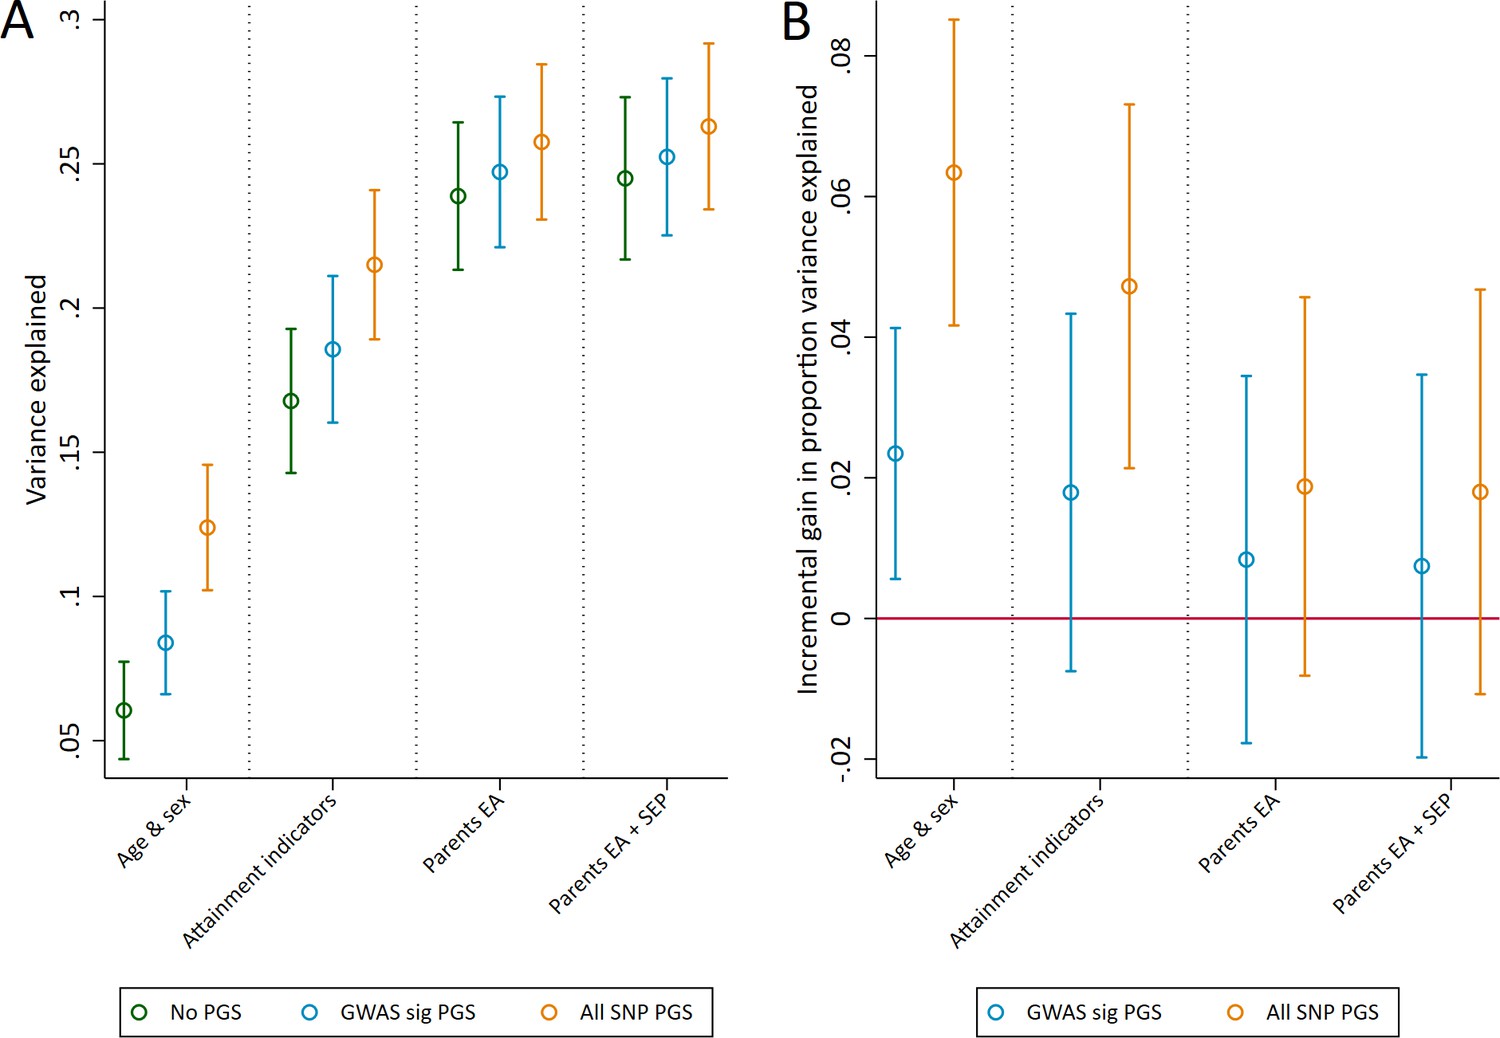
Variance in age 7 educational achievement explained by the polygenic scores.
(A) Variance explained in age 7 educational achievement by the polygenic scores while controlling for pupil characteristics and social factors. (B) Additional variance explained by the polygenic scores over and above pupil characteristics and social factors. Educational achievement measured using fine graded point scores from educational exams at age 7. Polygenic scores (PGS) built using only genome-wide significant SNPs (GWAS sig PGS) or all education associated SNPs (all SNP PGS) from the largest GWAS of educational attainment (Lee et al., 2018). Pupil characteristics available to schools include Free School Meals (FSM), English as a Foreign language (EFL) and Special Educational Needs (SEN) status. Parental educational attainment was measured as average years of completed education. Parental socioeconomic position (SEP) was measured as highest parental score on the Cambridge Social Stratification Score scale. All analyses include adjustment for the first 20 principal components of population stratification. Parameter estimates in Supplementary files 1A and 1B.
Figure 2
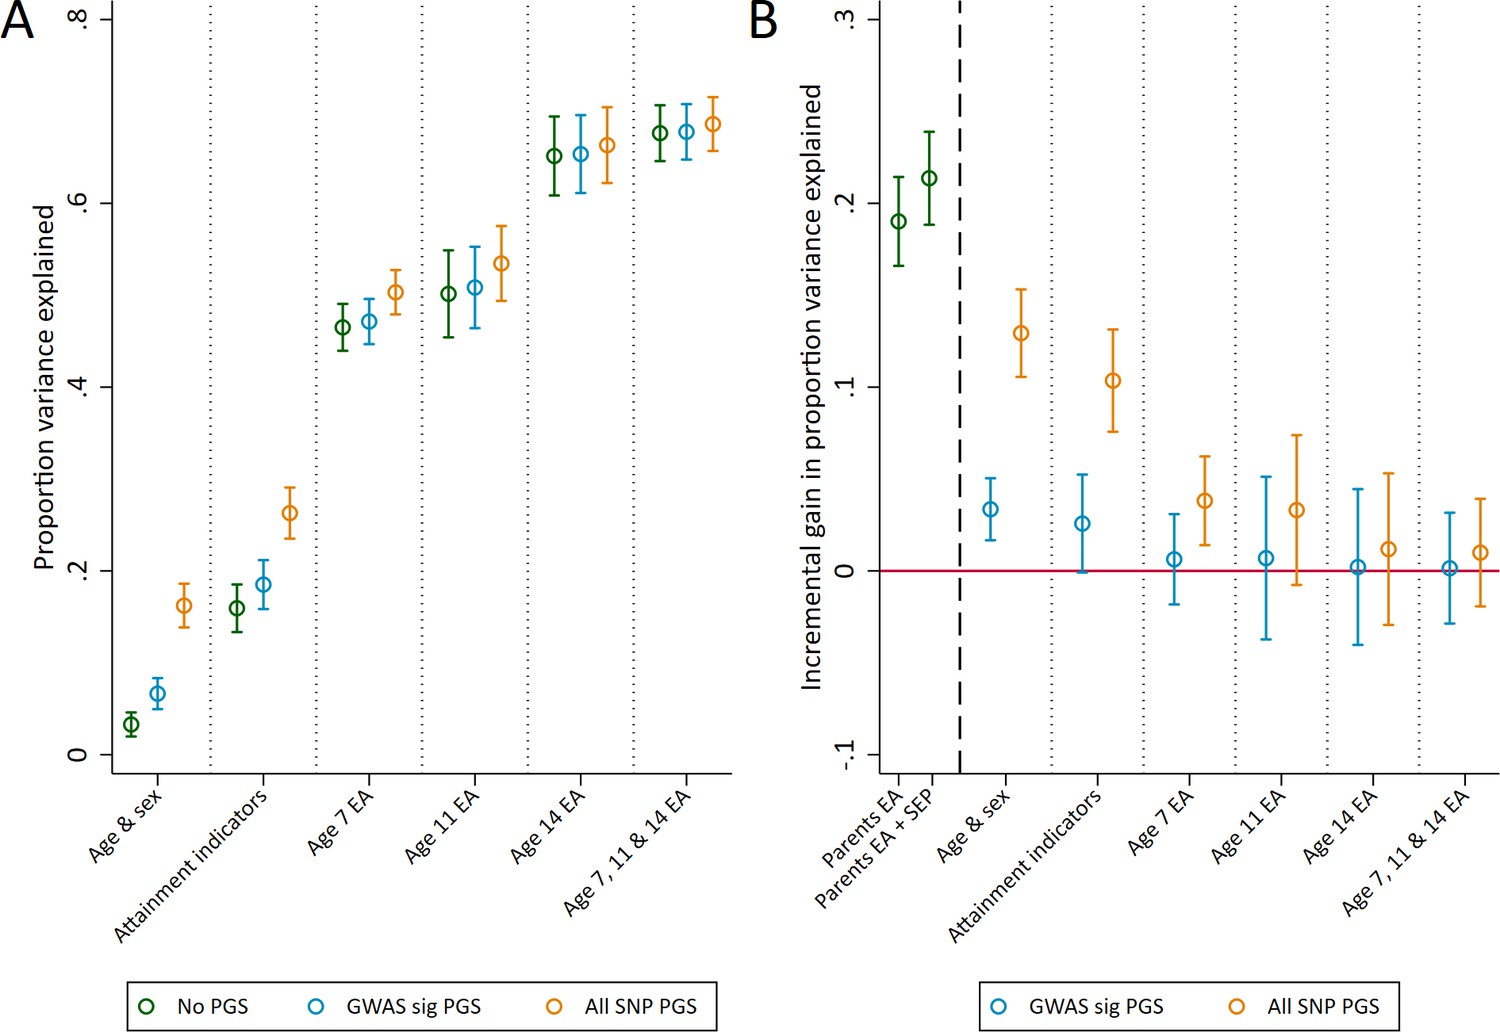
Variance in age 16 achievement explained by the polygenic scores.
(A) Variance explained in age 16 educational achievement by the polygenic scores while controlling for pupil characteristics and social factors. (B) Additional variance explained by the polygenic scores over and above pupil characteristics and social factors. Educational achievement (EA) measured using fine graded point scores from educational exams at ages 7, 11, 14 and 16. Polygenic scores (PGS) built using only genome-wide significant SNPs (GWAS sig PGS) or all education associated SNPs (all SNP PGS) from the largest GWAS of educational attainment (Lee et al., 2018). Pupil characteristics available to schools include Free School Meals (FSM), English as a Foreign language (EFL) and Special Educational Needs (SEN) status. Parental educational attainment was measured as average years of completed education. Parental socioeconomic position (SEP) was measured as highest parental score on the Cambridge Social Stratification Score scale. All analyses include adjustment for the first 20 principal components of population stratification. Parameter estimates in Supplementary files 1C and 1D.
Figure 3 with 1 supplement

Distributions of polygenic scores between ‘high achievers’ and all other pupils.
(A) Polygenic score distributions for the GWAS significant polygenic score. (B) Polygenic score distributions for the all SNP polygenic score. High achievers defined as pupils with age 16 educational exam scores in the top 10% of the sample. Polygenic scores (PGS) built using only genome-wide significant SNPs (GWAS sig PGS) or all education associated SNPs (all SNP PGS) from the largest GWAS of educational attainment (Lee et al., 2018).
Figure 3—figure supplement 1
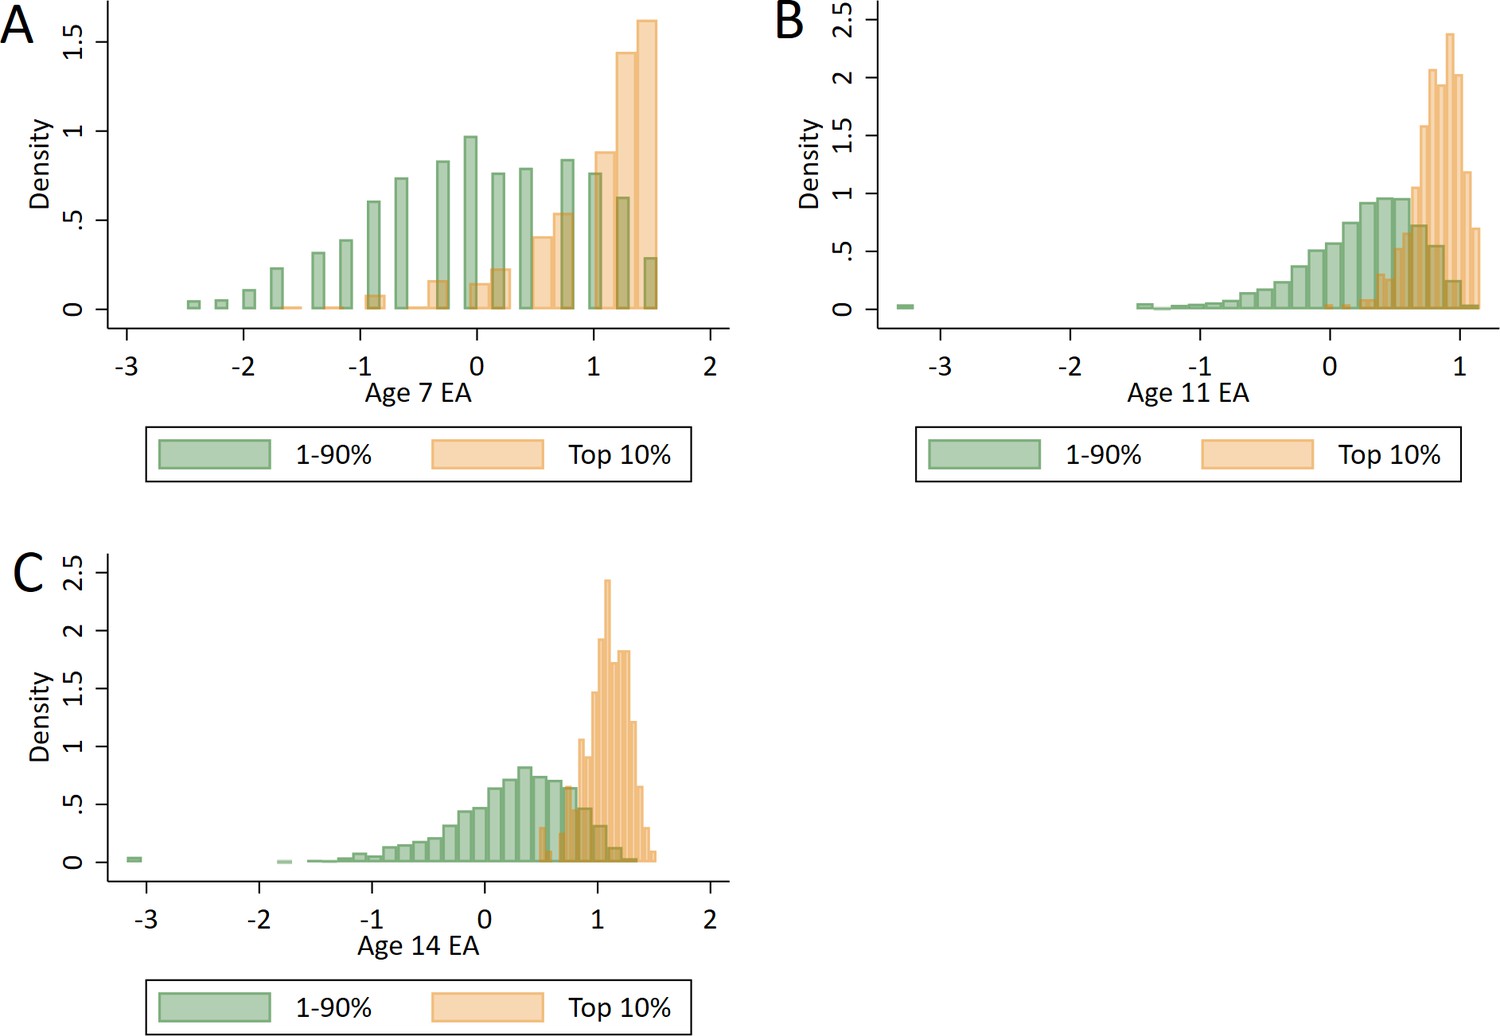
Distributions of prior achievement between ‘high achievers’ at age 16 and all other pupils.
(A) Prior achievement at age 7. (B) Prior achievement at age 11. (C) Prior achievement at age 14. Educational achievement (EA) measured using fine graded point scores from educational exams taken at ages 7, 11 and 14. s High achievers defined as pupils with age 16 educational exam scores in the top 10% of the sample. Prior attainment measured as educational achievement (EA) at ages.
Figure 4 with 1 supplement

Correlation between realised and genetically predicted achievement.
Educational achievement measured using fine graded point scores from educational exams at age 16. Predicted achievement at age 16 generated from a polygenic score built using all education associated SNPs (all SNP PGS) from the largest GWAS of educational attainment (Lee et al., 2018). Solid lines separate pupils who's exams scores were in the top 10% at age 16 (high achievers) on the y axis and pupils who's exam scores were predicted from genetic data to in the top 10% on the x axis. Dotted line represents best fit.
Figure 4—figure supplement 1
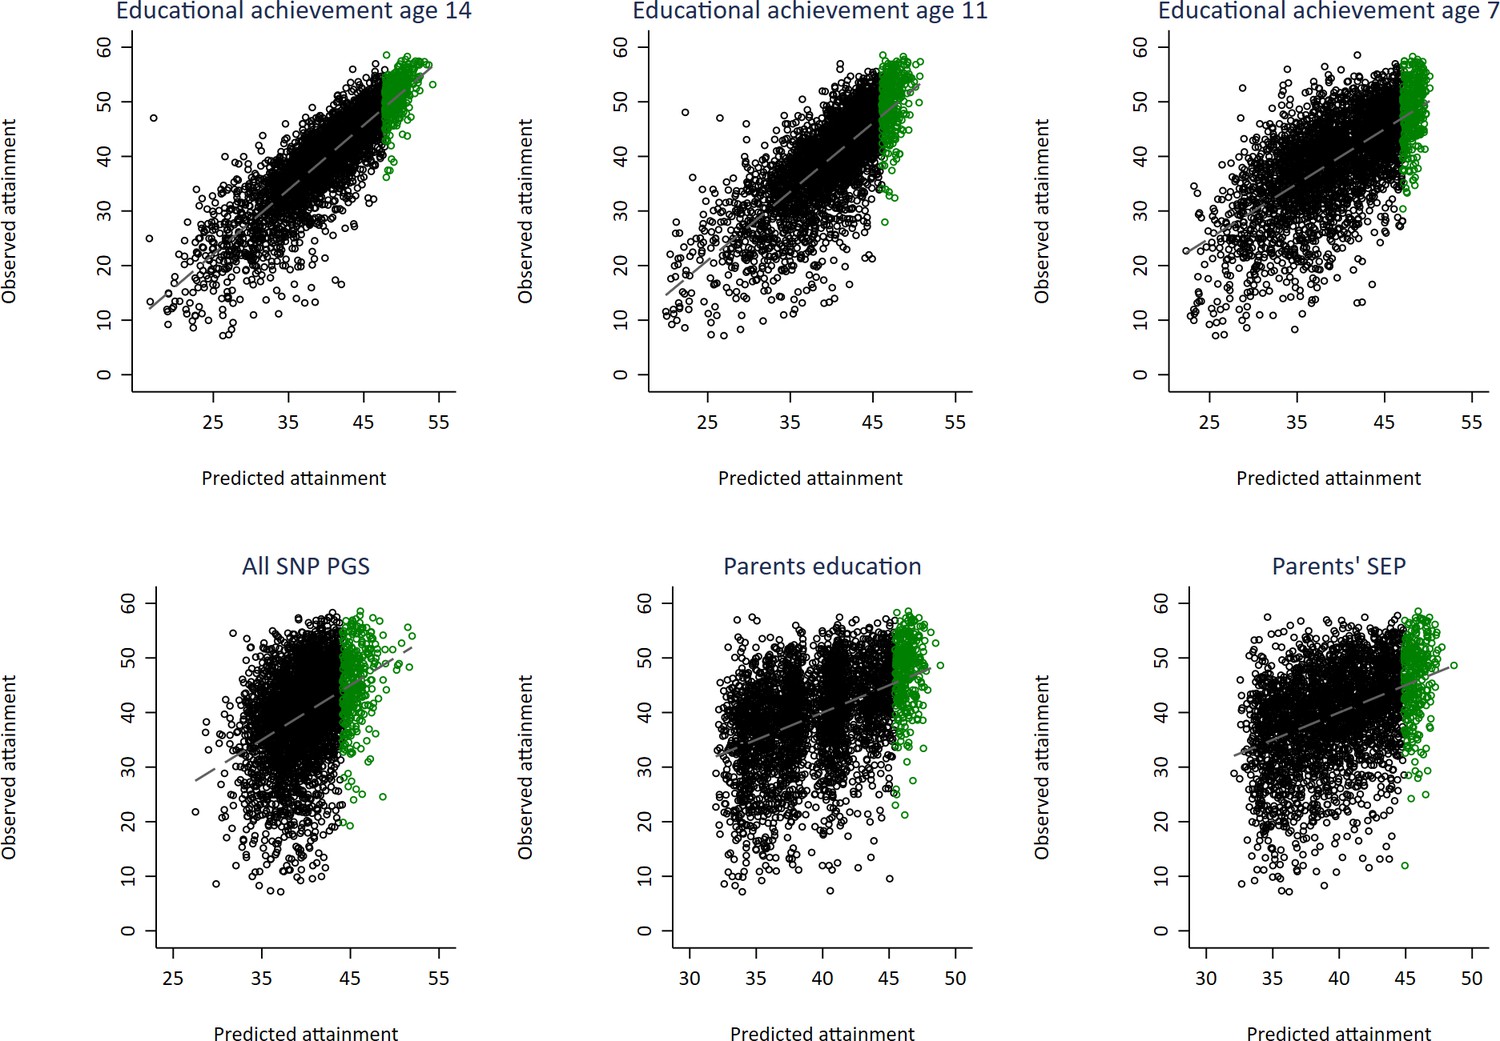
Independent scatter plots showing correlation between realised achievement at age 16 and achievement predicted from genotypic and phenotypic variables with top 10% of predicted achievers highlighted in green.
Educational achievement measured using fine graded point scores from educational exams. Genetically predicted achievement at age 16 generated from a polygenic score built using all education associated SNPs (all SNP PGS) from the largest GWAS of educational attainment. Parental educational attainment measured as average years of completed education. Parental socioeconomic position (SEP) measured as highest parental score on the Cambridge Social Stratification Score scale. All PGS analyses include adjustment for the first 20 principal components of population stratification.
Figure 5 with 1 supplement
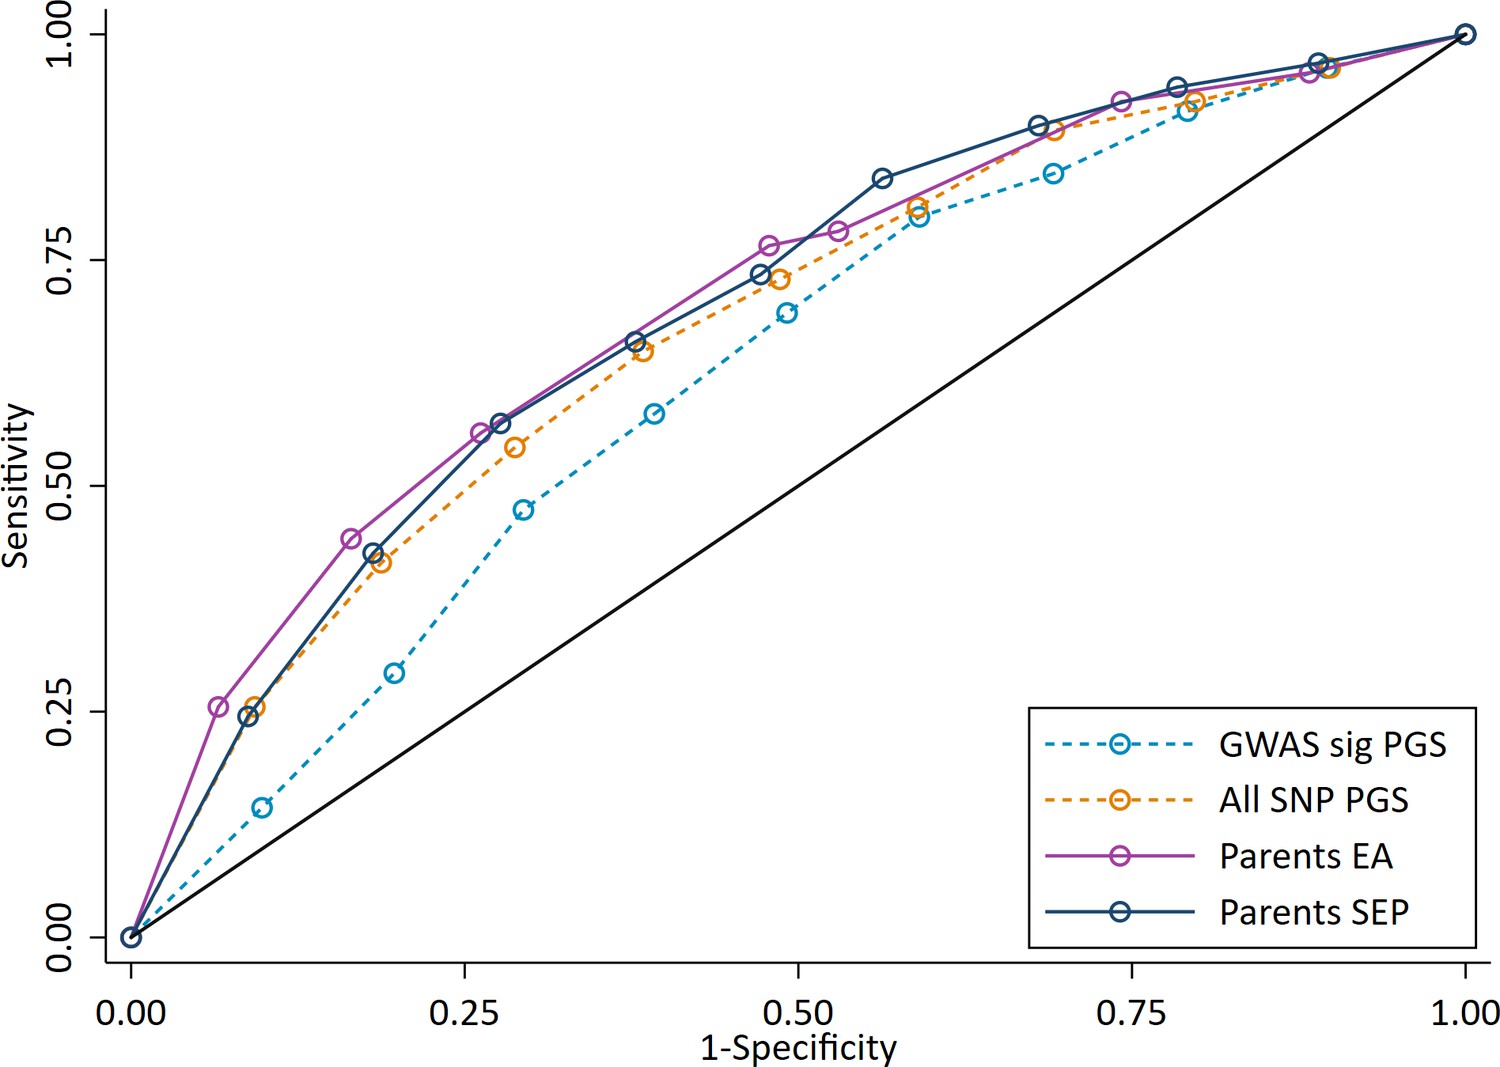
ROC curve for being a high achieving student (defined as the top 10% of pupils) at age 7.
High achievers defined as pupils with age 16 educational exam scores in the top 10% of the sample. Parental educational attainment (EA) was measured as average years of completed education. Parental socioeconomic position (SEP) was measured as highest parental score on the Cambridge Social Stratification Score scale. Polygenic scores (PGS) built using only genome-wide significant SNPs (GWAS sig PGS) or all education associated SNPs (all SNP PGS) from the largest GWAS of educational attainment (Lee et al., 2018). All PGS analyses include adjustment for the first 20 principal components of population stratification. Note that x axis displays 1-specificty.
Figure 5—figure supplement 1
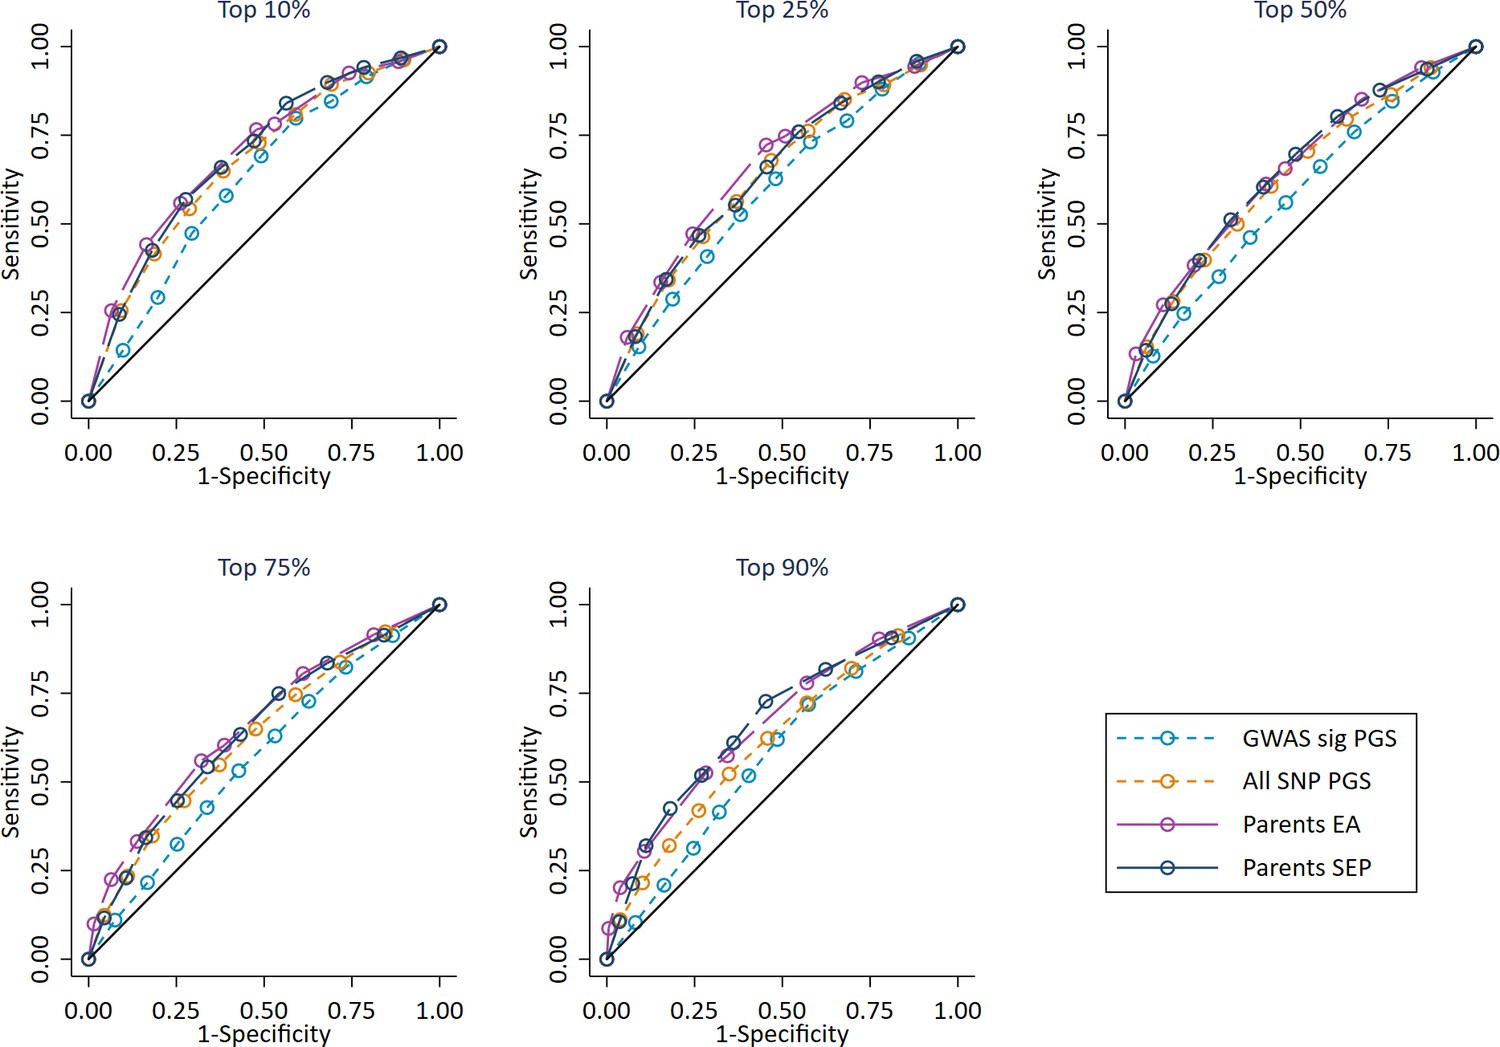
Independent ROC curves for deciled measures of polygenic scores, parental education and parental socioeconomic position predicting high achieving students at age 7 defined at different thresholds (e.g. top 10%).
Parents educational attainment (EA) measured as years of completed education. Parents socioeconomic position (SEP) measured as highest parental score on the CAMSIS social class scale. Polygenic scores (PGS) built using only genome-wide significant SNPs (GWAS sig PGS) or all education associated SNPs (All SNP PGS) from the largest GWAS of educational attainment1. All PGS analyses include adjustment for the first 20 principal components of population stratification. Note that x axis displays 1-specificty. Note that cut-offs of 1% and 5% could not be used due to lack of data richness in the age 7 achievement scores.
Figure 6 with 2 supplements
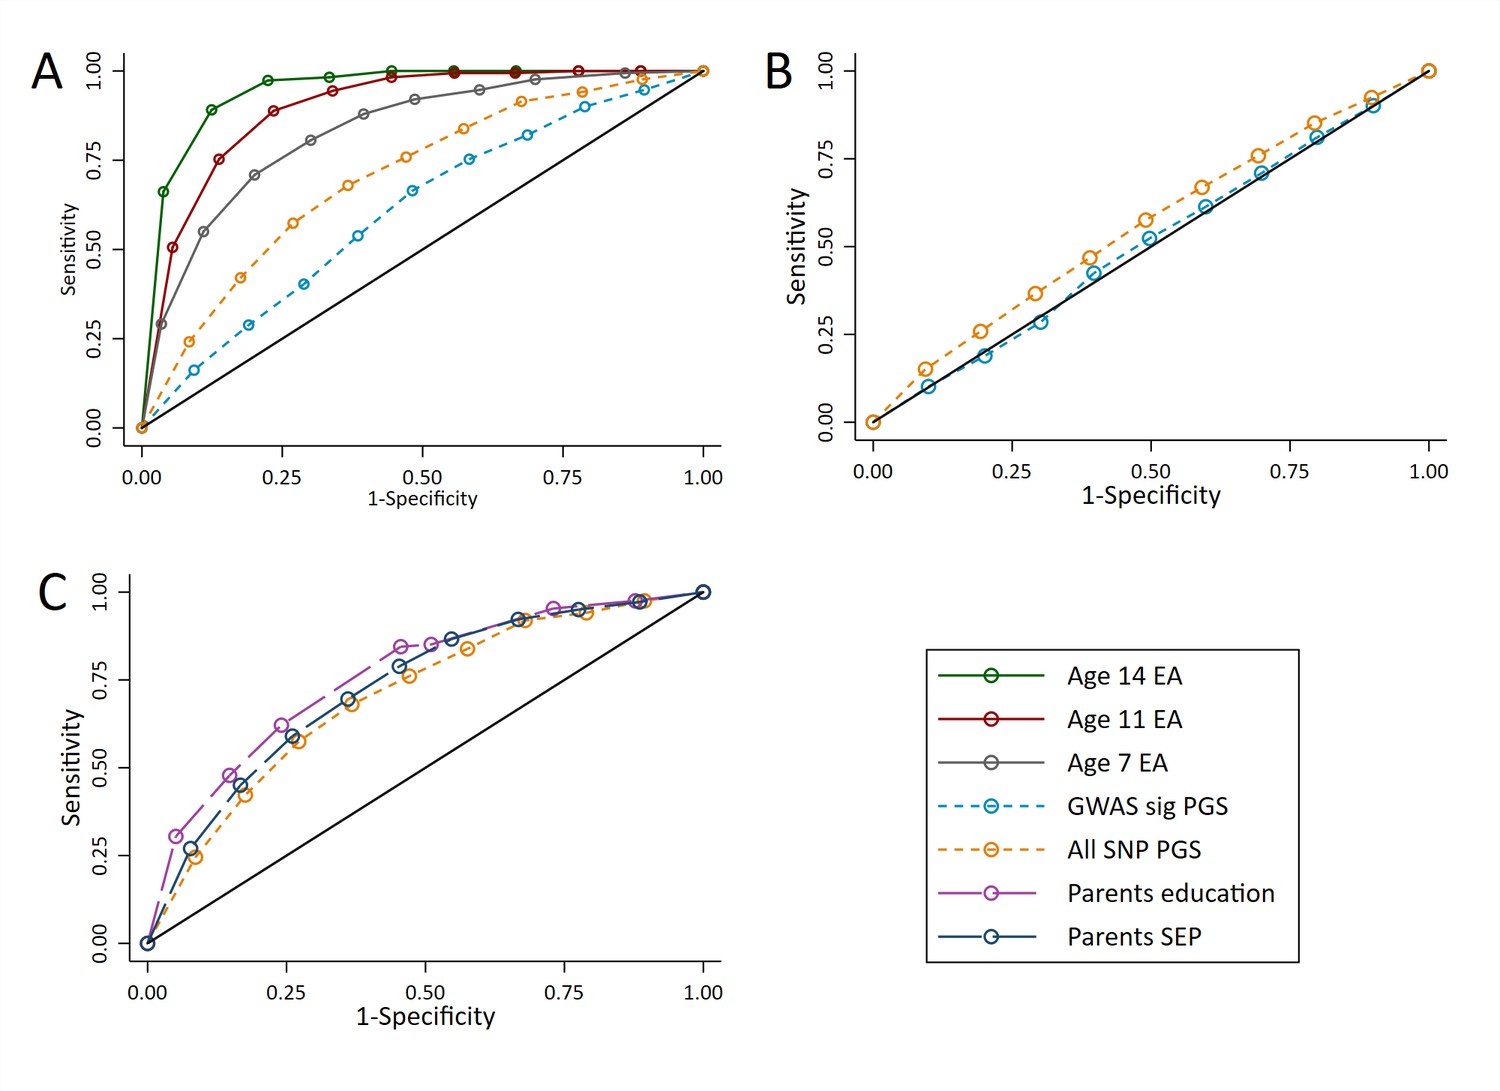
ROC curves for being a high achievement student (pupils with age 16 educational exam scores in the top 10% of the sample) at age 16.
(A) Independent ROC curves for deciled measures of prior achievement and polygenic scores (PGS) predicting high educational achievement (EA) at age 16. (B) Independent ROC curves for deciled measures of parental education and socioeconomic position predicting high educational achievement (EA) at age 16. (C) ROC curves for deciled polygenic scores predicting high educational achievement (EA) at age 16 residualised on age, sex, prior achievement, and pupil characteristics available to schools. Parental educational attainment was measured as average years of completed education. Parental socioeconomic position (SEP) was measured as highest parental score on the Cambridge Social Stratification Score scale. Polygenic scores (PGS) built using only genome-wide significant SNPs (GWAS sig PGS) or all education associated SNPs (all SNP PGS) from the largest GWAS of educational attainment (Lee et al., 2018). All PGS analyses include adjustment for the first 20 principal components of population stratification. Note that x axis displays 1-specificty.
Figure 6—figure supplement 1

ROC curves for deciled measures of polygenic scores predicting high achieving students at age 16 (pupils with age 16 educational exam scores in the top 10% of the sample) conditional on prior attainment and pupil characteristics.
Polygenic scores (PGS) built using only genome-wide significant SNPs (GWAS sig PGS) or all education associated SNPs (all SNP PGS) from the largest GWAS of educational attainment1. Pupil characteristics include Free School Meals (FSM), English as a Foreign language (EFL) and Special Educational Needs (SEN) status. All analyses include adjustment for the first 20 principal components of population stratification. Note that x axis displays 1-specificty.
Figure 6—figure supplement 2
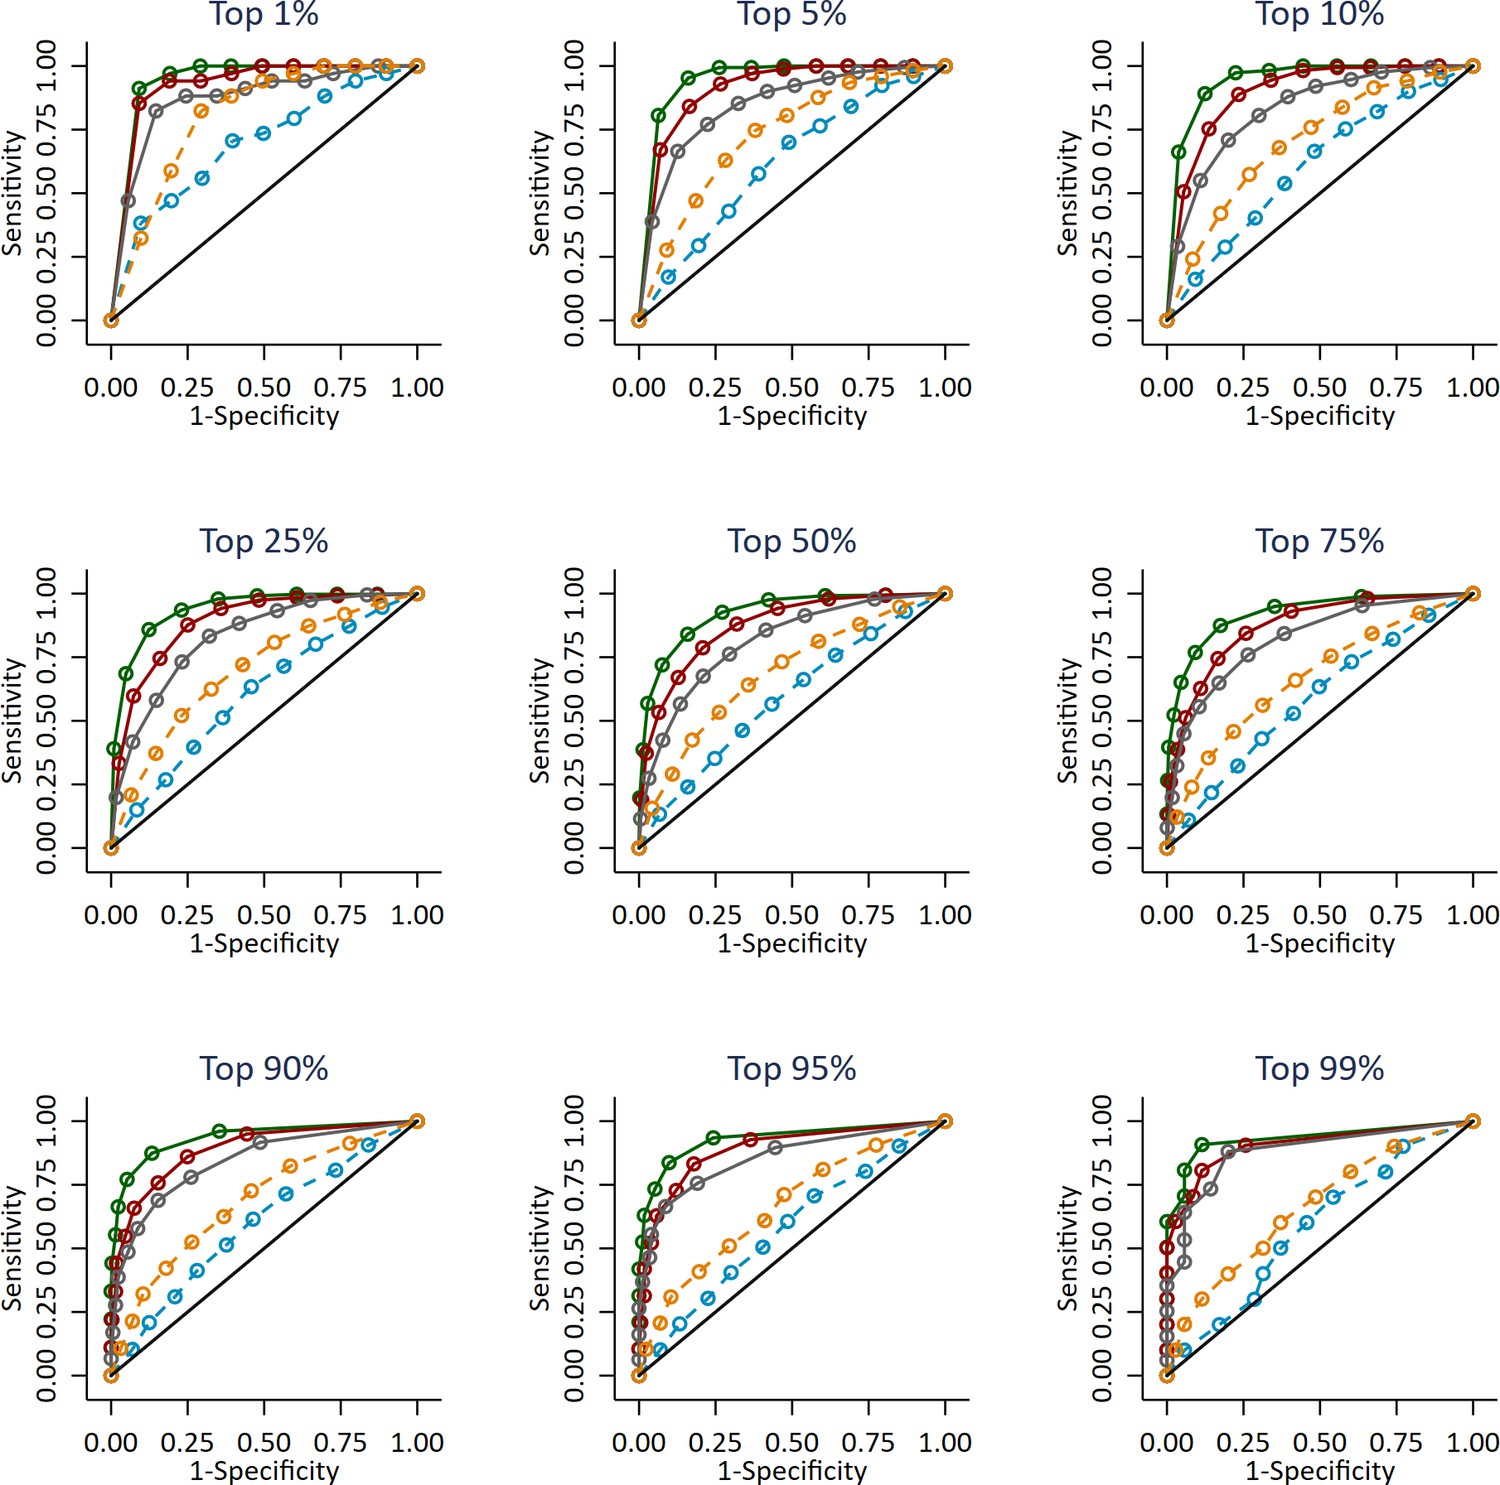
Independent ROC curves for deciled measures of prior attainment and polygenic scores predicting high achieving students at age 16 defined at different thresholds (e.g. top 1%).
Polygenic scores (PGS) built using only genome-wide significant SNPs (GWAS sig PGS) or all education associated SNPs (all SNP PGS) from the largest GWAS of educational attainment1. All PGS analyses include adjustment for the first 20 principal components of population stratification. Note that x axis displays 1-specificty.
Tables
Table 1
Correlation coefficients between educational achievement at ages 7 and 16 and the genotypic and social predictors.
Educational achievement measured using fine graded point scores from educational exams at ages 7 and 16. Genotypic predictors measured using two polygenic scores (PGS) built using only genome-wide significant SNPs (GWAS sig PGS) or all education associated SNPs (all SNP PGS) from the largest GWAS of educational attainment (Lee et al., 2018). Parental educational attainment (EA) was measured as average completed years of education. Parental socioeconomic position (SEP) was measured as highest parental score on the Cambridge Social Stratification Score scale.
| Achievement age 7 | Achievement 16 | |
|---|---|---|
| GWAS sig PGS | 0.17 | 0.19 |
| All SNP PGS | 0.26 | 0.37 |
| Mothers EA | 0.28 | 0.39 |
| Fathers EA | 0.27 | 0.40 |
| Parents SEP | 0.30 | 0.40 |
Additional files
-
Supplementary file 1
Full parameter estimates for all models presented throughout the manuscript.
(A) Variance explained in educational achievement at age 7. Polygenic scores (PGS) built using only genome-wide significant SNPs (GWAS sig PGS) or all education associated SNPs (All SNP PGS) from the largest GWAS of educational attainment (Lee et al., 2018). FSM, Free School Meals. EFL, English as a Foreign Language. SEN, Special Educational Needs. Eduyears, years of education. SEP, socioeconomic position. (B) Incremental R2 for educational achievement at age 7. Polygenic scores (PGS) built using only genome-wide significant SNPs (GWAS sig PGS) or all education associated SNPs (All SNP PGS) from the largest GWAS of educational attainment (Lee et al., 2018). FSM, Free School Meals. EFL, English as a Foreign Language. SEN, Special Educational Needs. Eduyears, years of education. SEP, socioeconomic position. (C) Variance explained in educational achievement at age 16. Polygenic scores (PGS) built using only genome-wide significant SNPs (GWAS sig PGS) or all education associated SNPs (All SNP PGS) from the largest GWAS of educational attainment (Lee et al., 2018). FSM, Free School Meals. EFL, English as a Foreign Language. SEN, Special Educational Needs. EA7, prior educational achievement at age 7. EA11, prior educational achievement at age 11. EA14, prior educational achievement at age 14. Eduyears, years of education. SEP, socioeconomic position. (D) Incremental R2 for educational achievement at age 16. Polygenic scores (PGS) built using only genome-wide significant SNPs (GWAS sig PGS) or all education associated SNPs (All SNP PGS) from the largest GWAS of educational attainment (Lee et al., 2018). FSM, Free School Meals. EFL, English as a Foreign Language. SEN, Special Educational Needs. EA7, prior educational achievement at age 7. EA11, prior educational achievement at age 11. EA14, prior educational achievement at age 14. (E) Agreement between educational achievement (EA) quantiles and other quantiled measures. Polygenic scores (PGS) built using only genome-wide significant SNPs (GWAS sig PGS) or all education associated SNPs (All SNP PGS) from the largest GWAS of educational attainment (Lee et al., 2018). p values for all tests < 0.001.
- https://cdn.elifesciences.org/articles/49962/elife-49962-supp1-v1.xlsx
-
Transparent reporting form
- https://cdn.elifesciences.org/articles/49962/elife-49962-transrepform-v1.pdf
Download links
A two-part list of links to download the article, or parts of the article, in various formats.
Downloads (link to download the article as PDF)
Open citations (links to open the citations from this article in various online reference manager services)
Cite this article (links to download the citations from this article in formats compatible with various reference manager tools)
Can education be personalised using pupils’ genetic data?
eLife 9:e49962.
https://doi.org/10.7554/eLife.49962


