Potential impact of outpatient stewardship interventions on antibiotic exposures of common bacterial pathogens
- Harvard T.H. Chan School of Public Health, United States
- Brigham and Women’s Hospital, Harvard Medical School, United States
Figures
Figure 1 with 3 supplements
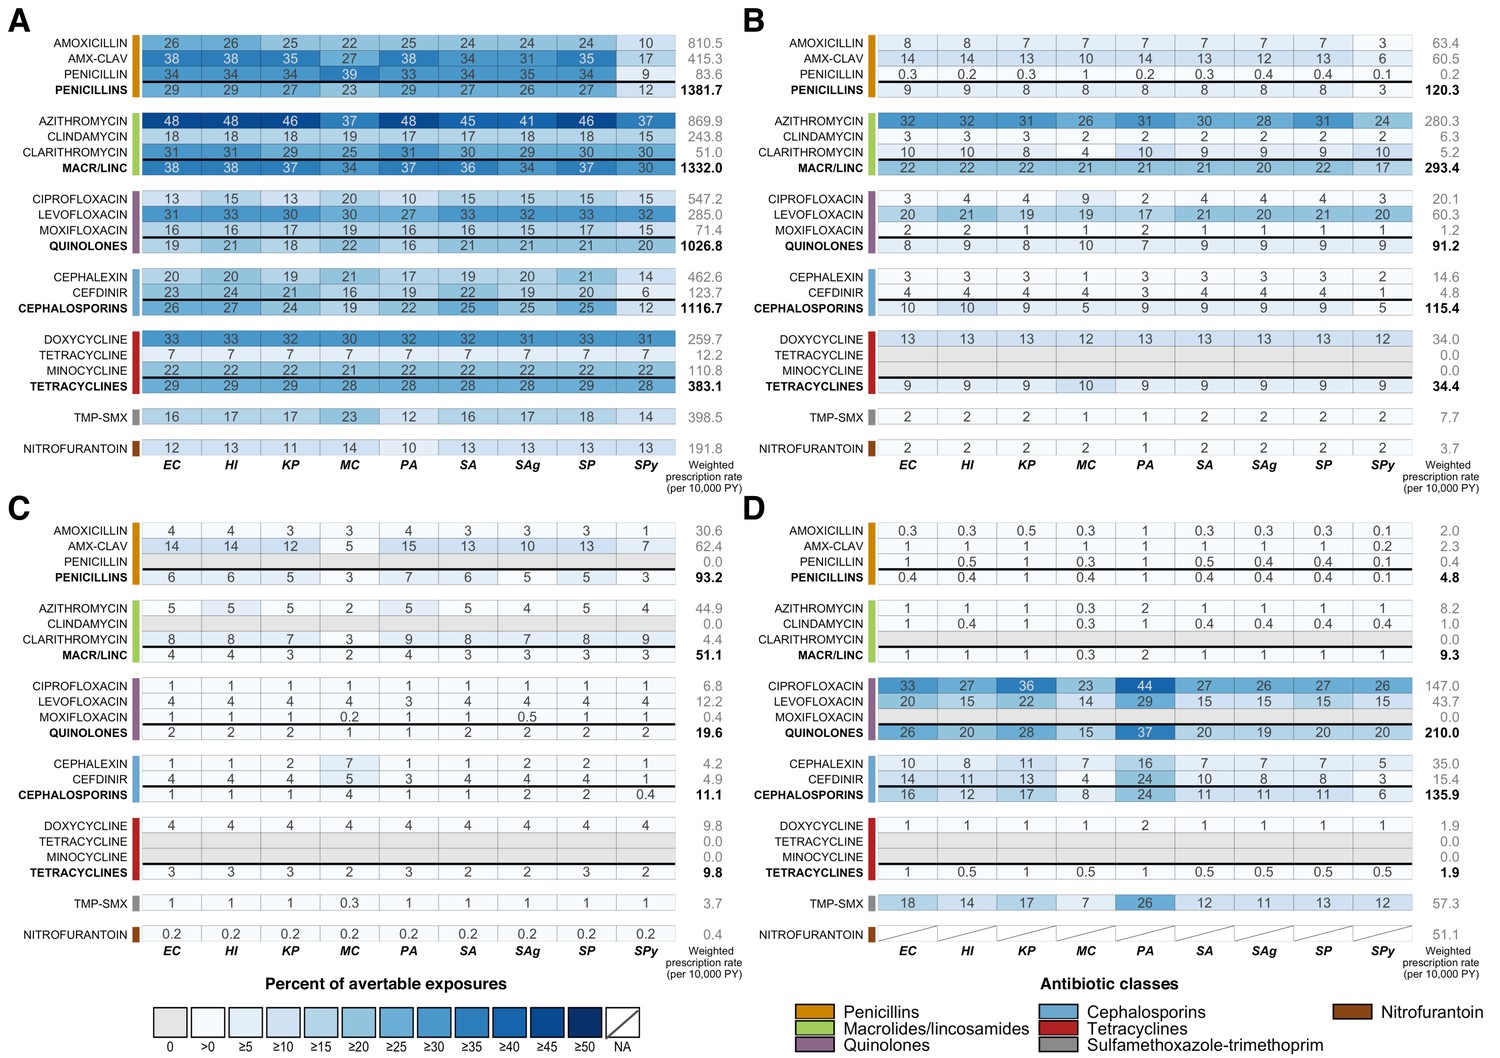
Heatmaps showing the estimated percentage of species exposures to each antibiotic or antibiotic class that could be averted by scenario.
Scenarios are defined as elimination of (A) unnecessary antibiotic prescriptions across all outpatient conditions, (B) all antibiotic use for outpatient respiratory conditions for which antibiotics are not indicated, (C) all antibiotic use for acute sinusitis, and (D) non-nitrofurantoin treatment of cystitis in women. Drug class results include prescriptions of all antibiotics in that class, as identified by the Lexicon Plus classification system. Sensitivity and other additional analyses are shown in Figure 1—figure supplements 1–3. Abbreviations: Antibiotics (y-axis): AMX-CLAV = amoxicillin-clavulanate, MACR/LINC = macrolides/ lincosamides, TMP-SMX = sulfamethoxazole-trimethoprim; Organisms (x-axis): EC = E. coli, HI = H. influenzae, KP = K. pneumoniae, MC = M. catarrhalis, PA = P. aeruginosa, SA = S. aureus, SAg = S. agalactiae, SP = S. pneumoniae, SPy = S. pyogenes; PY = person years.
-
Figure 1—source data 1
Summary of etiology studies.
- https://cdn.elifesciences.org/articles/52307/elife-52307-fig1-data1-v2.docx
-
Figure 1—source data 2
Modifications to proportions of unnecessary antibiotic prescriptions based on published etiology studies and antibiotic use in NAMCS/NHAMCS.
Modifications were made if the reported proportion of bacterial cases for a given condition exceeded the estimated proportion of appropriate prescriptions reported in Fleming-Dutra et al. (2016).
- https://cdn.elifesciences.org/articles/52307/elife-52307-fig1-data2-v2.docx
-
Figure 1—source data 3
Estimated antibiotic class exposures by exposed and causative species.
- https://cdn.elifesciences.org/articles/52307/elife-52307-fig1-data3-v2.docx
Figure 1—figure supplement 1

Sensitivity analysis of proportions of avertable exposures across all outpatient conditions when proportion of unnecessary use is applied equally across target and bystander exposures (Equation 1 without modification).
Figure 1—figure supplement 2
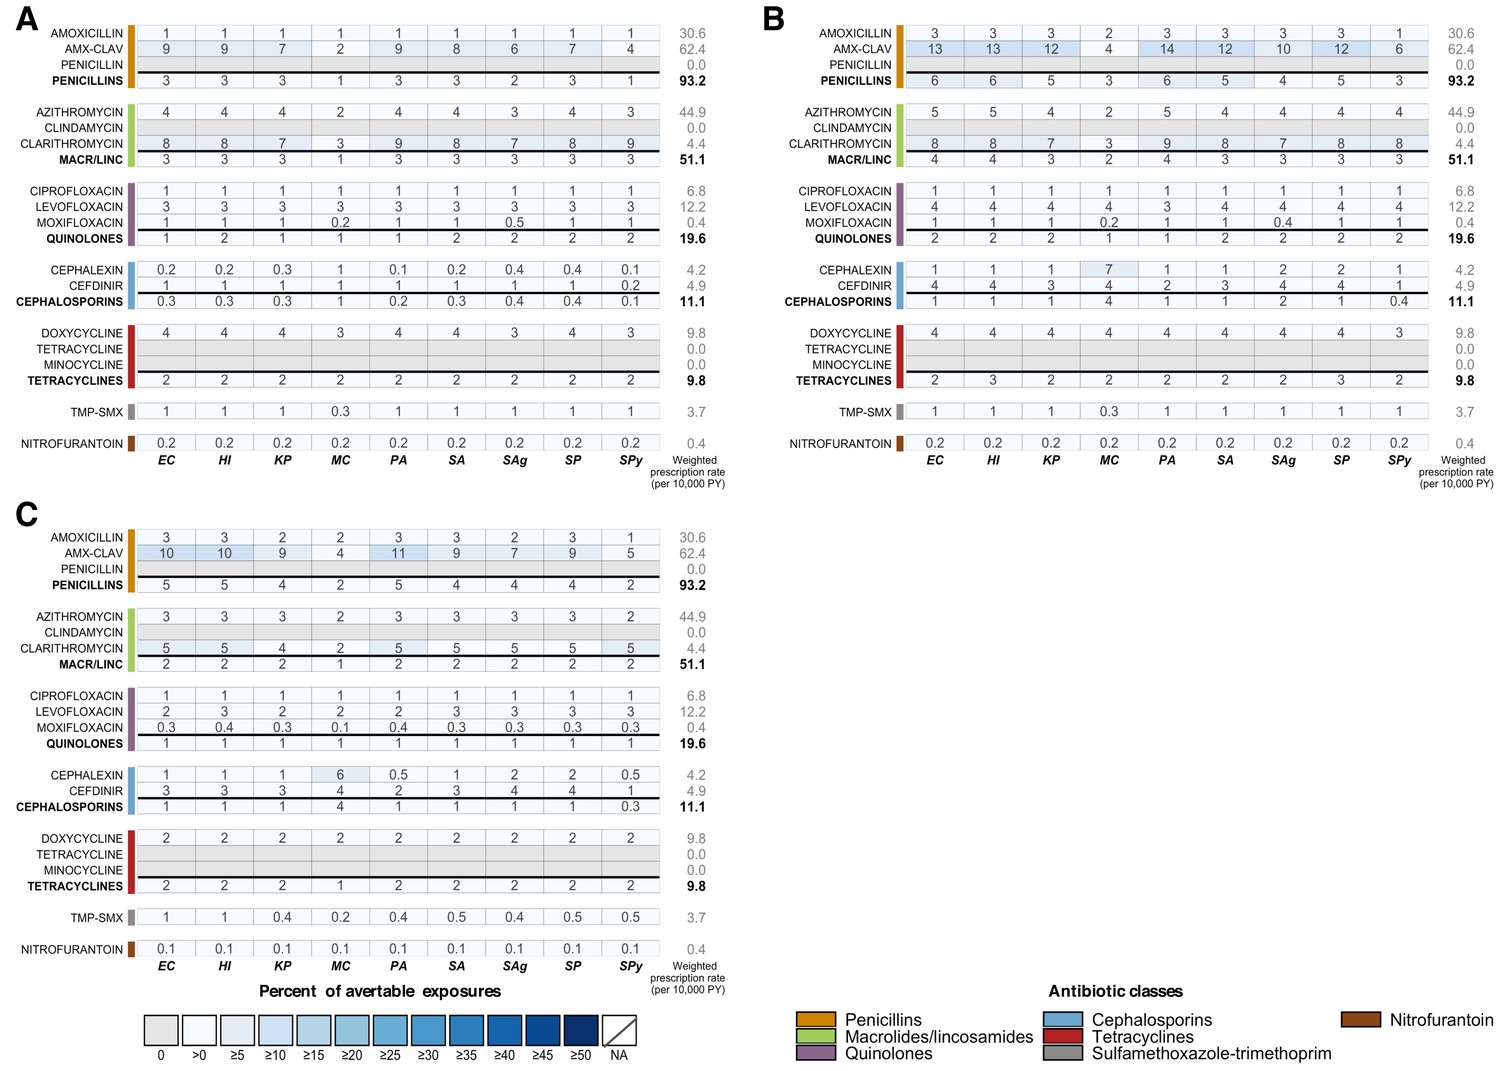
Sensitivity analyses for Scenario 3 (elimination of all antibiotic use for acute sinusitis).
(A) Unnecessary prescribing for acute sinusitis estimated from Fleming-Dutra et al. Based on Fleming-Dutra et al. (2016), we estimate that the proportion of unnecessary antibiotic prescriptions for acute sinusitis is 18%, 100%, and 34% for individuals who are 0-19, 20-64, and over 65 years old, respectively (see Figure 1—source data 2). (B) Estimates of bacterial etiology used to approximate necessary antibiotic use for acute sinusitis. The following upper bound estimates for the proportion of acute sinusitis cases with bacterial etiology were used: 2% for adults and 13% for children (applied to 0-19 year old age group) (Sande and Gwaltney, 2004; Snow et al., 2001; Wald et al., 1991). (C) Estimates of bacterial etiology among those presenting to primary care clinics used to approximate necessary antibiotic use. Patients visiting the clinic are likely to have more persistent, severe, or worsening symptoms, which may be indications of bacterial etiology. Studies have estimated that approximately 38% of adults and 17% of children (upper bounds) visiting primary care for symptoms of acute upper respiratory tract infection have bacterial rhinosinusitis (Aitken and Taylor, 1998; Benninger et al., 2000; Williams et al., 1992).
Figure 1—figure supplement 3
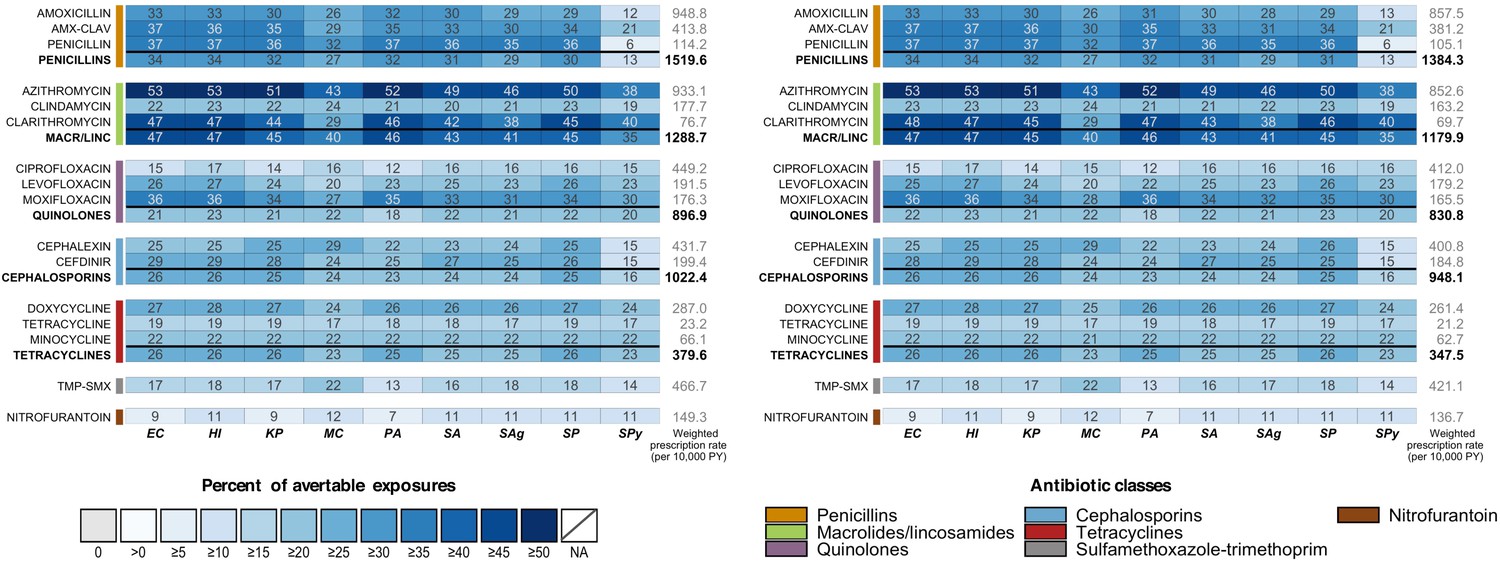
Avertable exposures under Scenario 1 (elimination of all unnecessary antibiotic use across outpatient conditions) using 2010-2011 NAMCS/NHAMCS data with (left) and without (right) NHAMCS outpatient department data.
Tables
Table 1
Notation, descriptions, and sources for variables in Equation 1.
| Variable | Definition | Source |
|---|---|---|
| daig | Number of prescriptions (using nationally representative weights) of antibiotic a associated with ICD9-CM diagnosis code i in age group g | NAMCS/NHAMCS 2015 |
| esig | Proportion of cases of condition defined by ICD9-CM diagnosis code i in age group g caused by species s | Published etiology studies (see Figure 1—source data 1) |
| ps0g | Asymptomatic carriage prevalence of species s in age group g | Human Microbiome Project (HMP) and published carriage studies |
| psig | Carriage prevalence of species s among individuals diagnosed with ICD9-CM code i in age group g | |
| qaig | Proportion of prescriptions of antibiotic a associated with ICD9-CM diagnosis code i in age group g that are avertable under the given scenario | Based on article by Fleming-Dutra et al. (Fleming-Dutra et al., 2016) with adjustments as described in Figure 1—source data 2 |
| Xas | Number of exposures of antibiotic a experienced by species s that are avertable under the given scenario | |
| Tas | Total number of exposures of antibiotic a experienced by species s |
Additional files
Download links
A two-part list of links to download the article, or parts of the article, in various formats.
Downloads (link to download the article as PDF)
Open citations (links to open the citations from this article in various online reference manager services)
Cite this article (links to download the citations from this article in formats compatible with various reference manager tools)
Potential impact of outpatient stewardship interventions on antibiotic exposures of common bacterial pathogens
eLife 9:e52307.
https://doi.org/10.7554/eLife.52307


